Article

Yield Response, Quality Traits, and Nitrogen-Use Efficiency of a Burley Tobacco Crop Grown in Mediterranean Areas (Southern Italy) as Affected by Intensive N Management

1
Department of Agricultural Sciences, University of Naples Federico II, 80055 Portici, Italy
2
Council for Agricultural Research and Economics (CREA), Research Center for Cereal and Industrial Crops, 81100 Caserta, Italy
*
Authors to whom correspondence should be addressed.
Agronomy 2021, 11(9), 1837; https://doi.org/10.3390/agronomy11091837
Submission received: 4 August 2021 / Revised: 6 September 2021 / Accepted: 10 September 2021 / Published: 14 September 2021
(This article belongs to the Special Issue New Methods for Plant Nutrition Management)

Abstract

:
Tobacco is an annual cash crop widely cultivated over the world, which generally needs great amounts (N) of nitrogen to achieve the best yield and quality. However, with a view to sustainable and environmentally friendly agriculture, also for this crop, the reduction in N fertilization is a priority, but without negatively affecting the yield and quality of the cured product. Therefore, field experiments were conducted during 2002 and 2003 on light air-cured (Burley) tobacco at three different locations of the Campania region (Southern Italy) where high-quality light air-cured (Burley) tobacco is traditionally cultivated. At each location, the following six N fertilization treatments were compared with four replications (blocks): (i) a not fertilized control (N0); (ii) 50 kg N ha−1 (N50); 90 kg N ha−1 (N90); 130 kg N ha−1 (N130); 170 kg N ha−1 (N170); 210 kg N ha−1 (N210). The yield of cured leaves appeared positively influenced by N fertilization but not at a rate higher than 170 kg ha−1. N fertilization directly influenced nitrates and the total N content of cured leaves at all locations. The greater values of both parameters were reached at N130 or N90, respectively, at Vitulazio (CE), N170 at Bellizzi (SA), and N90 at San Giorgio del Sannio (BN). The fire holding capacity increased with N fertilization up to N170 treatment (12–13 s at CE and BN but just 8 s at SA). L* (brightness) decreased with increasing N fertilization giving cured leaves less bright and opaquer. The a/b ratio (a*, green/red; b*, blue/yellow) increased with N treatments producing cured leaves of dark hazelnut. The best scores were assigned to cured products obtained by plants fertilized with 170 kg N ha−1. N-use efficiencies were negatively influenced by N fertilization. The best NUE and N-uptake efficiency was recorded in 2002 at Vitulazio (CE), in spite of a higher NO3-N before N fertilization than other locations.

1. Introduction

An intensive mineral N management permitted over the past 50 years to increase the productivity of agricultural lands around the world. Nevertheless, it often determined N surplus in soils and waters, resulting in severe pollution due to nitrate contamination [1,2,3,4,5]. In Europe, this negative effect was measured already in 1980 when mineral N consumption in agriculture, as well as that of other macro-nutrients (K and P), reached maxima values [6]. However, N consumption started to decrease at the beginning of 1990 when the Nitrates Directive [7] was applied with the aim to reduce nitrate pollution of agricultural origin.
Nowadays, the priority goal of modern and sustainable agriculture is to reduce N losses to the environment; this result might be reached by improving the efficiency of N use [8,9]. Several research studies were carried out in the last 20 years to investigate N-use efficiency of many crops such as maize [10,11,12], wheat [13,14,15,16,17,18], tomato [19,20,21,22,23], potato [24,25,26], sunflower [27,28,29], industrial crops [8,30,31] or non-edible and biofuel crops [32]. All of them are currently fertilized with a high amount of N. Various N-use indexes were proposed, generally measuring both N fertilizer efficiency (yield/N apply) or crop N efficiency. The latter is partitioned into the following two indexes: (i) N-uptake efficiency (crop N uptake/N apply or supply) and (ii) N-utilization efficiency (yield/crop N uptake) [8,33,34,35,36]. Both climate and soil have a great impact on N-use efficiency through their effect on water regimes of agricultural fields or on the N cycle in soil-plant systems. They contribute to change (i) transformation of N applied by fertilization, (ii) plant N assimilation, (iii) losses of N by leaching, denitrification/volatilization, or surface runoff [2,35,37].
Recovery of N in crop plants (that is a measure of N-uptake efficiency) is usually less than 50% worldwide. In particular, in annual crops, the low recovery of nitrogen appears to be associated with the above-reported N losses and plant canopy [38].
Tobacco is an annual cash crop widely cultivated over the world (3.6 million ha; [6]). It generally needs great amounts of N to achieve the best yield or quality response and is usually over-fertilized [3,39,40].
Significant soil and water pollution by nitrate were frequently measured after tobacco cropping [3,41,42]. Kaiser et al. [3] found that nitrate both in soil solution from tobacco field or in well water below tobacco crop was greater than that in natural conditions. Considering the negative effect that an excess N usually determines on cured product quality [43,44,45], the evaluation of tobacco growing conditions that improve N-use efficiency becomes indispensable.
Few studies were conducted on the N-use efficiency of tobacco [43,46,47,48,49]. Flue-cured tobacco N-use efficiency and its components (N-uptake efficiency and N-utilization efficiency) were investigated by Sisson et al. [46]. They found that efficiencies decreased with increasing N rates and were improved by breeding (i.e., they increased from the oldest to the newest cultivars). In Burley tobacco, Sifola and Postiglione [43] reported a similar negative effect of N fertilization on both N recovery fraction (RF) and N agronomic efficiency (AE) but not on N physiological efficiency (PE). That study showed that RF was always low (about 20%, on average) but positively influenced by irrigation or rainfall (a maximum value of 45% was recorded under well-watered conditions). In addition, changes in AE mainly reflected those of RF or the efficiency of N uptake [43].
In Italy, specific areas of Southern (Campania region), Central (Tuscany, Umbria, and Lazio regions), and Northern territories (Veneto region) are dedicated to the cultivation of different types of tobacco, mainly light air-cured (Burley), dark fire-cured and flue-cured (Kentucky and Virginia Bright) and flue-cured (Virginia Bright), respectively. In particular, in the Campania region, different pedo-climatic conditions of specific tobacco districts, that are Caserta (CE), Salerno (SA), and Benevento (BN), account for quality traits of cured (commercial) products together with cultural practices such as N fertilization. No result is available on the interactive effect of environmental conditions (soil and climate) and N fertilization on N-use efficiency of light air-cured (Burley) tobacco grown in Mediterranean areas.
The aim of the present work was to evaluate the effect of different N fertilization levels on yield, and qualitative traits of the cured products of light air-cured (Burley) tobacco, also evaluating the N-use efficiency under three conditions of soil and climate.

2. Materials and Methods

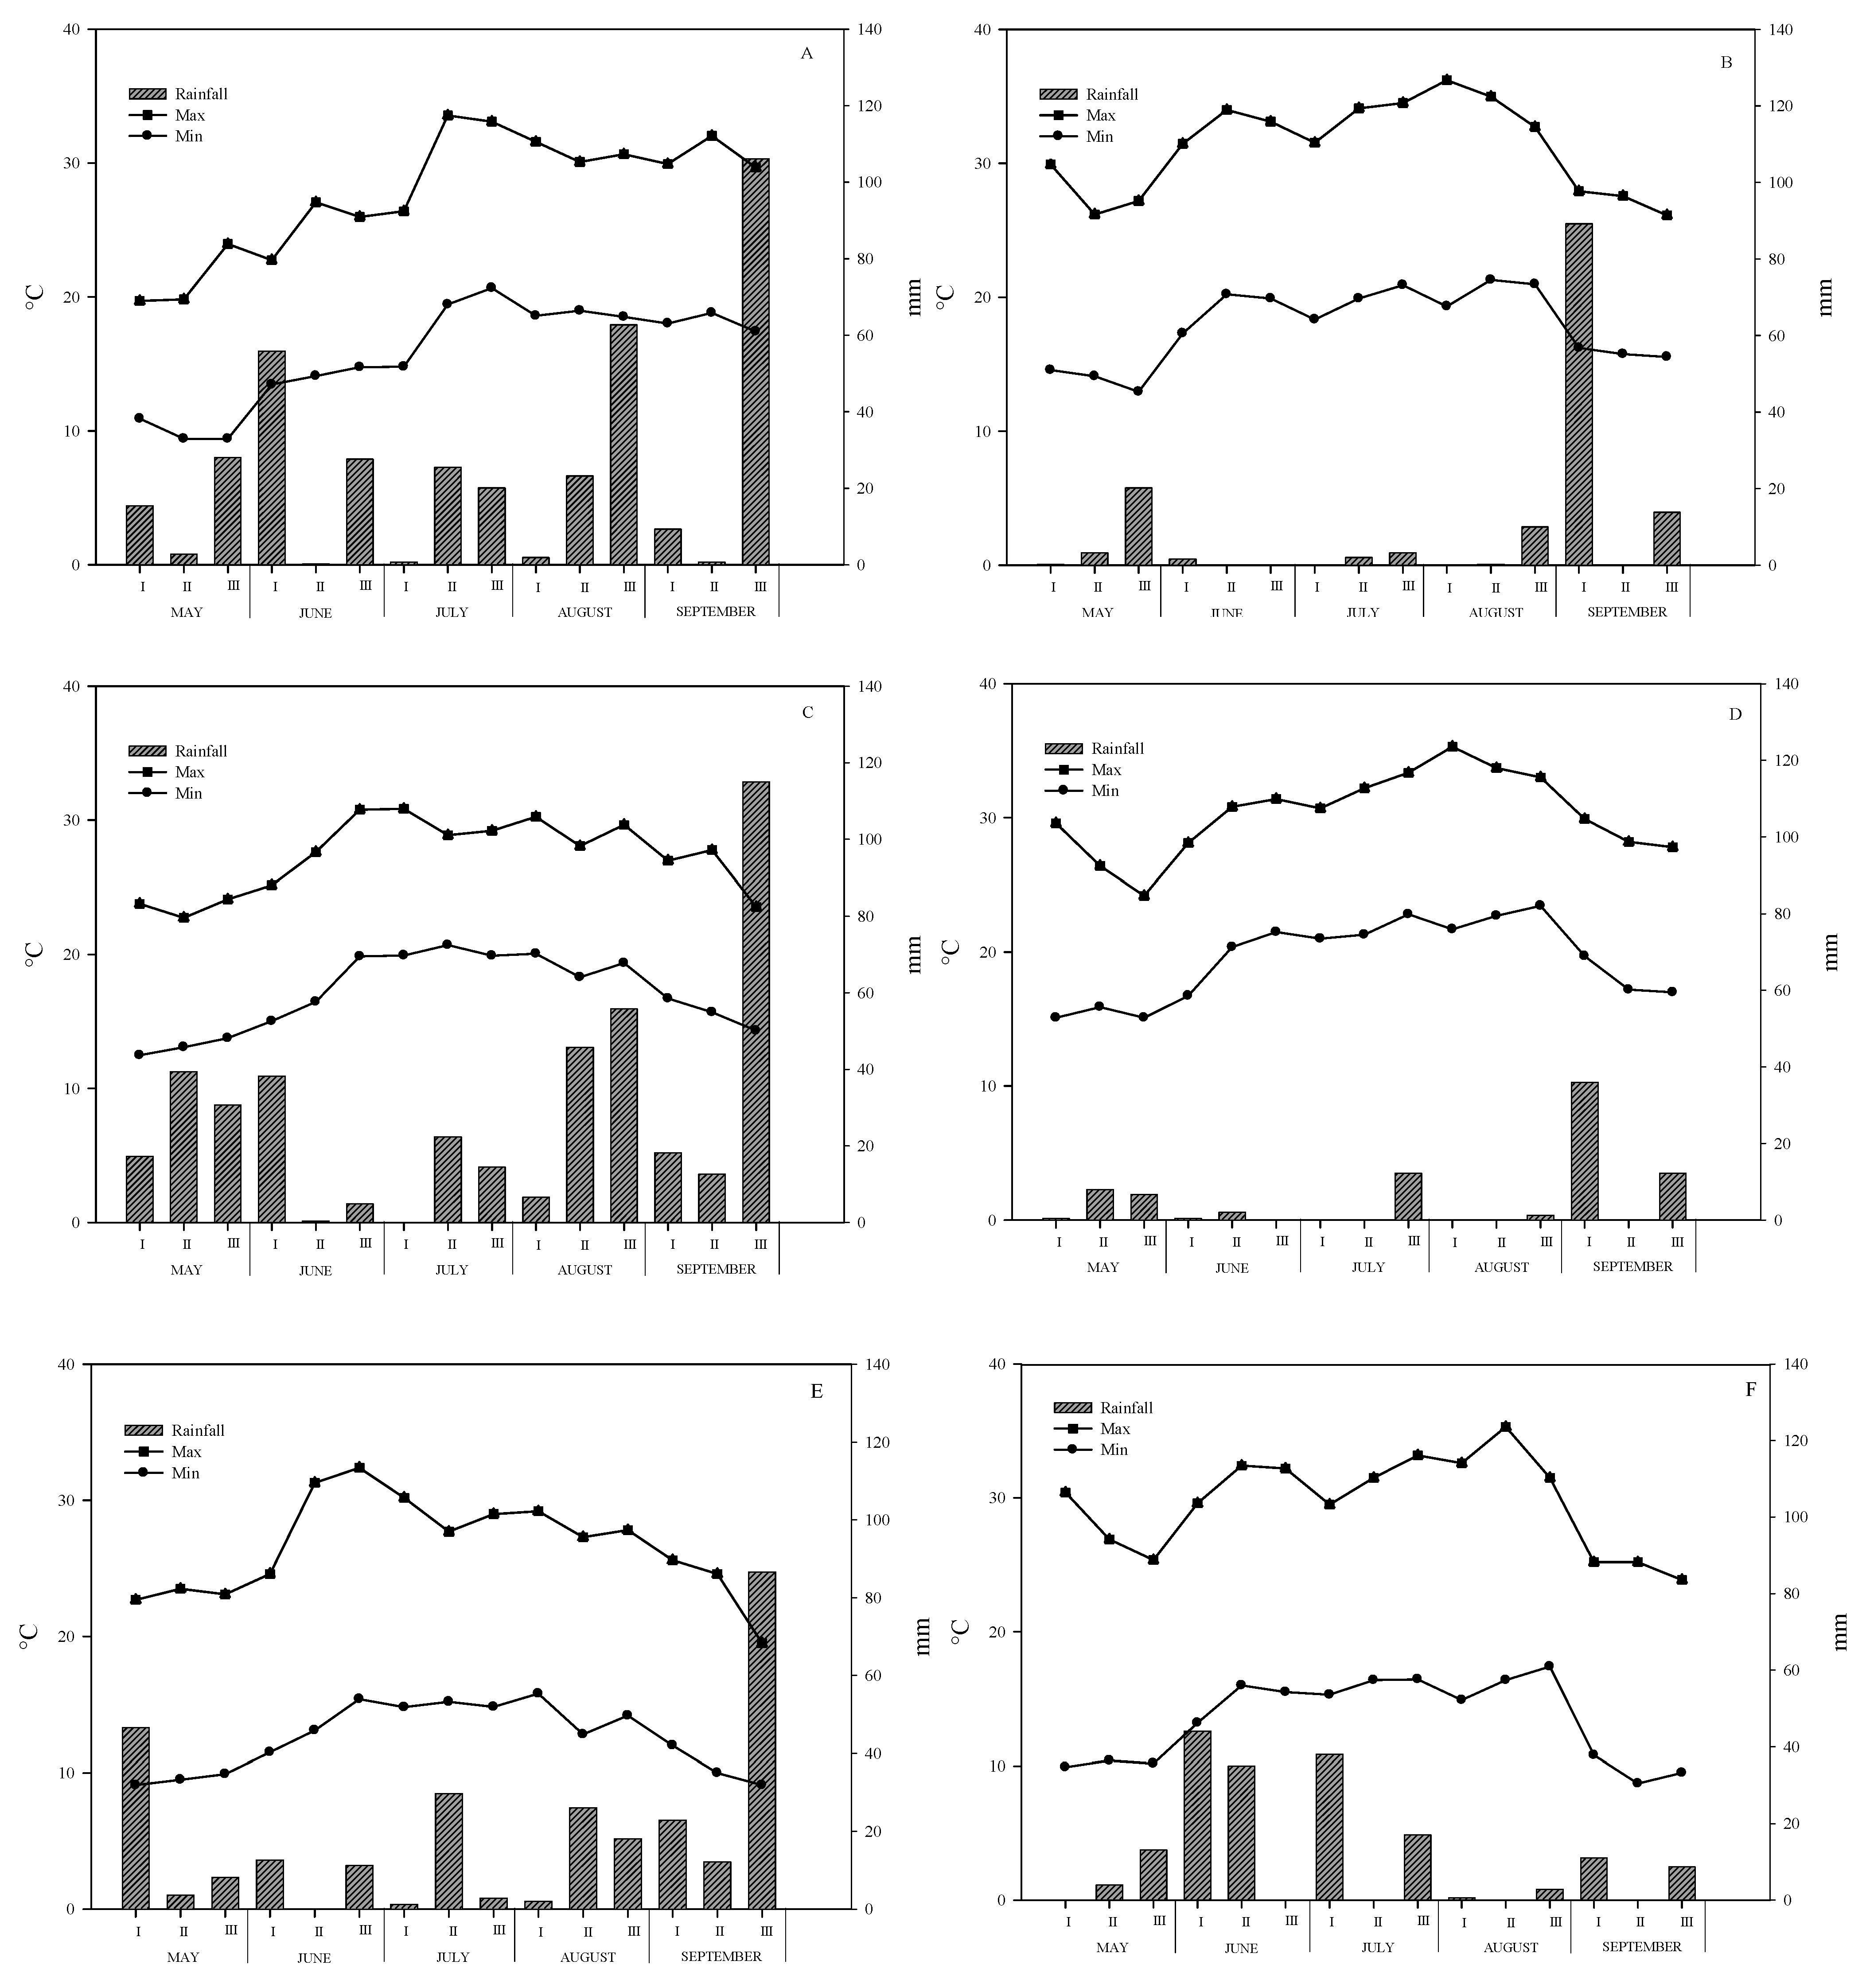
2.1. Experimental Locations and Weather Conditions

Field experiments were conducted during 2002 and 2003 on light air-cured (Burley) tobacco, cv. C104 (L’Agricola S.r.l., Bastia Umbra, PG, Italy) at three different locations of Campania region (Southern Italy) where high-quality Burley tobacco is traditionally cultivated: (i) Vitulazio, CE (Volturno River Plain; 40°07′ N, 14°50′ E; 25 m a.s.l.); (ii) Bellizzi, SA (Sele River Plain; 40°37′ N, 14°58′ E; 30 m a.s.l.); (iii) San Giorgio del Sannio, BN (Apennines internal hill; 41°6′ N, 14°43′ E; 250 m a.s.l.).
Soil characteristics at each field, measured at the beginning of each season within the 0.0–0.3 m soil layer, are reported in Table 1. At all locations, soils were characterized by sandy clay loam texture (Table 1). At Vitulazio (CE) there was higher NO3-N content, but lower NH4-N, than San Giorgio del Sannio (BN) and Bellizzi (SA). At San Giorgio del Sannio (BN), there were slightly higher total N and organic matter content than in both other fields (Table 1).
In Figure 1, the climate conditions of the three sites are reported. At Vitulazio (CE) and Bellizzi (SA), there were differences in rainfall during the growing season (from the end of May to the end of August) between years as it amounted to 246 and 219 mm, respectively, in 2002, but to just 37 and 22 mm, respectively, in 2003 (Figure 1A–D). By contrast, at San Giorgio del Sannio (BN) rainfall regime was quite similar between years (112 and 151 mm in 2002 and 2003, respectively; Figure 1E,F).
In both years, air temperatures were frequently greater than 30 °C; in particular: (i) at Vitulazio (CE) in the second and third ten-day periods of July and in August in 2002 and in June, July, and August in 2003 (Figure 1A,B); (ii) at Bellizzi (SA) in the last ten-day period of June and in the first ten-day period of July in 2002 and always in June, July, and August in the second year (Figure 1C,D); (iii) at San Giorgio del Sannio (BN) only in the second and third ten-day periods of June and first ten-day period of July during 2002 whereas in the second and third ten-day periods of June and July, and in August during 2003 (Figure 1E,F).

2.2. Treatments, Experimental Design, and Crop Management

At each location, the following six N fertilization treatments were compared with four replications (blocks): (i) a not fertilized control (N0); (ii) 50 kg N ha−1 (N50); 90 kg N ha−1 (N90); 130 kg N ha−1 (N130); 170 kg N ha−1 (N170); 210 kg N ha−1 (N210). In both years and at all locations, each N dose was applied as follows: (i) 50% at transplanting (end of May) as ammonium sulfate (21% N); (ii) 50% at side-dressing as ammonium nitrate (26% N), the latter split in two applications to minimize N leaching losses, that were at the seedling establishment (about 25–30 days after transplanting, DAT) and at the beginning of rapid stem elongation (about 35–38 DAT). Twenty-four elemental plots of 45 m2 were arranged in 2002 and 2003 at each experimental field.
In both years and at all experimental locations, 100 kg ha−1 of P2O5 as superphosphate and 150 kg ha−1 of K2O as potassium sulfate were mixed to the 0.2 m topsoil before transplanting.
Seedlings were transplanted at 1.0 m x 0.5 m distance (2 plants per square meter) on May 21, 20, and 27 at Vitulazio (CE), Bellizzi (SA), and San Giorgio del Sannio (BN), respectively, in 2002, and on May 15, 22 and 28, respectively, in 2003.
Plants were fully irrigated by furrows, and watering volumes and irrigation intervals were determined as previously reported [50]. In brief, plants received an amount of water equal to crop evapotranspiration (ETc), estimated from Class A pan evaporation rate (E0A) measured on site, corrected by a pan coefficient (kp = 0.8) to obtain reference evapotranspiration (ET0), and then multiplied by the crop coefficients (kc) that ranged from a minimum of 0.4 at transplanting to a maximum of 1.0–1.2 at flowering. Irrigation was applied when water depletion in the soil profile exceeded 40% of available water, which was calculated for the 0.0–0.15 m depth at transplanting and for 0.0–0.5 m at maximum plant development. Seasonal irrigation volumes were 3043, 2421, and 2650 m3 ha−1 at Vitulazio (CE), Bellizzi (SA), and San Giorgio del Sannio (BN) respectively, in 2002 and 3202, 2628 and 2804 m3 ha−1, respectively, in 2003.
Pests were regularly controlled over the two growing seasons using Ridomil M2 and Lannate; Asco 30 and Aceberg; Asco 30 and Vertimec. Weed control was carried out by Pendimetalin plus Patoran.

2.3. Yield and Quality Determinations and Analyses

Leaves were harvested three times, starting from the last week of July to the beginning of September, from the central part of each plot (24.0 m2), when they were fully ripen (i.e., leaves color turned out from green to yellow). Crop duration ranged between 107 and 103 days, 112 and 111, 107 and 110, in the two years, at Bellizzi (SA), Vitulazio (CE), and San Giorgio del Sannio (BN), respectively.
After curing was completed, the yield of cured leaves (Mg ha−1) was calculated at 19% standard moisture content. The commercial quality of cured products was assessed by expert evaluators from tobacco companies. It was based on structure, texture, elasticity and tissue integrity, and color. Scores on the decimal scale were assigned to samples of middle leaf crown per each plot, and averaged scores were finally calculated.
The color of five cured leaves per plot was determined by measuring color space parameters L* (brightness), a* (green/red), and b* (blue/yellow) with a Chroma-meter CR-300 (Minolta, Hannover, Germany) using an optical sensor of 8 mm. Color results were shown as L* and a/b ratio.
Burning measures were made on 5 cured leaves per plot with a SODIM device (Sodim SAS 29, Saint Jean de Braye, France) according to the incandescent point method. In brief, combustion at three spots on both right and left parts of the upper cured leaf page was caused by a point resistance, heated up to bright red. The fire holding capacity, in seconds (s), was then recorded per each spot, and results were averaged per leaf.
One sample of 100 g cured leaves per plot was collected and prepared for analytical determination of total N, nitrates, and alkaloids. The tissue was oven-dried at 60 °C to constant weight, ground using an IKA mill (IKA-Werke, Staufen, Germany), and sieved through a 2 mm screen.
Total N concentration of leaf dry tissues was determined by the Kjeldahl method as previously reported [43]. In brief, 1 g of dry tissue was digested with 8 mL of concentrated H2SO4 and 5 mL H2O2 for 40 min in the presence of a catalyst (Se + CuO) and K2SO4, using a DK20 digester (DK42/26, VELP Scientific, Milan, Italy). Sodium hydroxide (32% w/w) was added to distill the sample using an automatic unit (UDK 140, VELP Scientific). Nitrogen was collected as ammonia (NH3) in a 4% boric solution and titrated with H2SO4 in the presence of an indicator (bromocresol green and methyl red in 95% ethanol). For nitrate content of cured leaves, 0.5 g of dry tissue was diluted in 100 mL of deionized water and then vortexed for 1 min, the slurry decolorized with 2 g of activated charcoal powder. Ten mL of the filtered aqueous extract were diluted to 25 mL with de-ionized water, and one Nitraver 5® powder pillow (Hach Company, Loveland, CO, USA) was added. Absorbance was read at 500 nm using a Hach 2000 spectrophotometer (Hach Company) [43].
Total alkaloids content as nicotine (% dry weight, d.w.) was determined using a continuous flow analyzer. In brief, 0.25 g of leaf dry tissue were extracted with 25 mL of 5% acetic acid solution. After shaking for 30 min at >150 rpm (G10 Gyrotory Shaker, New Brunswick Scientific Co. Inc., Edison, NJ, USA), the extract was filtered through a quantitative filter paper Whatman No 40 and then analyzed by AutoAnalyzer II (Technicon, SEAL Analytical GmbH, Werkstrasse 5, D-22844, Norderstedt, Germany). The method is based on the measurement of the color complex generated by the reaction of alkaloids with sulfanilic acid and cyanogen chloride, which is formed on line from potassium thiocyanate and sodium hypochlorite. The developed color is measured at 460 nm [51].

2.4. N-Use Efficiency Indexes

The N-use efficiency indexes, which were NUE (N-use efficiency), N-uptake efficiency (NUpE), and N-utilization efficiency (NUtE), were determined as reported by Moll [33], according to the following equations:
NUE = Yield   of   cured   leaves     N   applied   by   fertilizers + N   soil
NUpE = N   content   of   cured   leaves   N   applied   by   fertilizers + N   soil
NUtE = Yield   of   cured   leaves N   content   of   cured   leaves
In particular, the yield of cured leaves was expressed as Mg ha−1; N applied by fertilizers, native soil N, and N content of cured leaves was expressed as kg ha−1. Therefore, NUE was expressed as Mg yield per kg soil N; NUpE was expressed as kg N uptake per kg N supply; NUtE was expressed as Mg yield per kg N uptake.

2.5. Statistical Analysis

All results were subjected to analysis of variance (ANOVA) using the SPSS software package (SPSS version 22, Chicago, IL, USA). N treatments (F), replicated four times, were the main factor, and they were combined both over locations (L) and years (Y), exploring, in addition to the main effect, also the second- (F x Y; F x L; Y x L) and third-degree interactions (F x L x Y). Means were separated by Duncan Test at p < 0.05 and p < 0.01. The relation between each nitrogen index (NUE and NUtE) and N fertilization rate was investigated as regression analysis.

3. Results

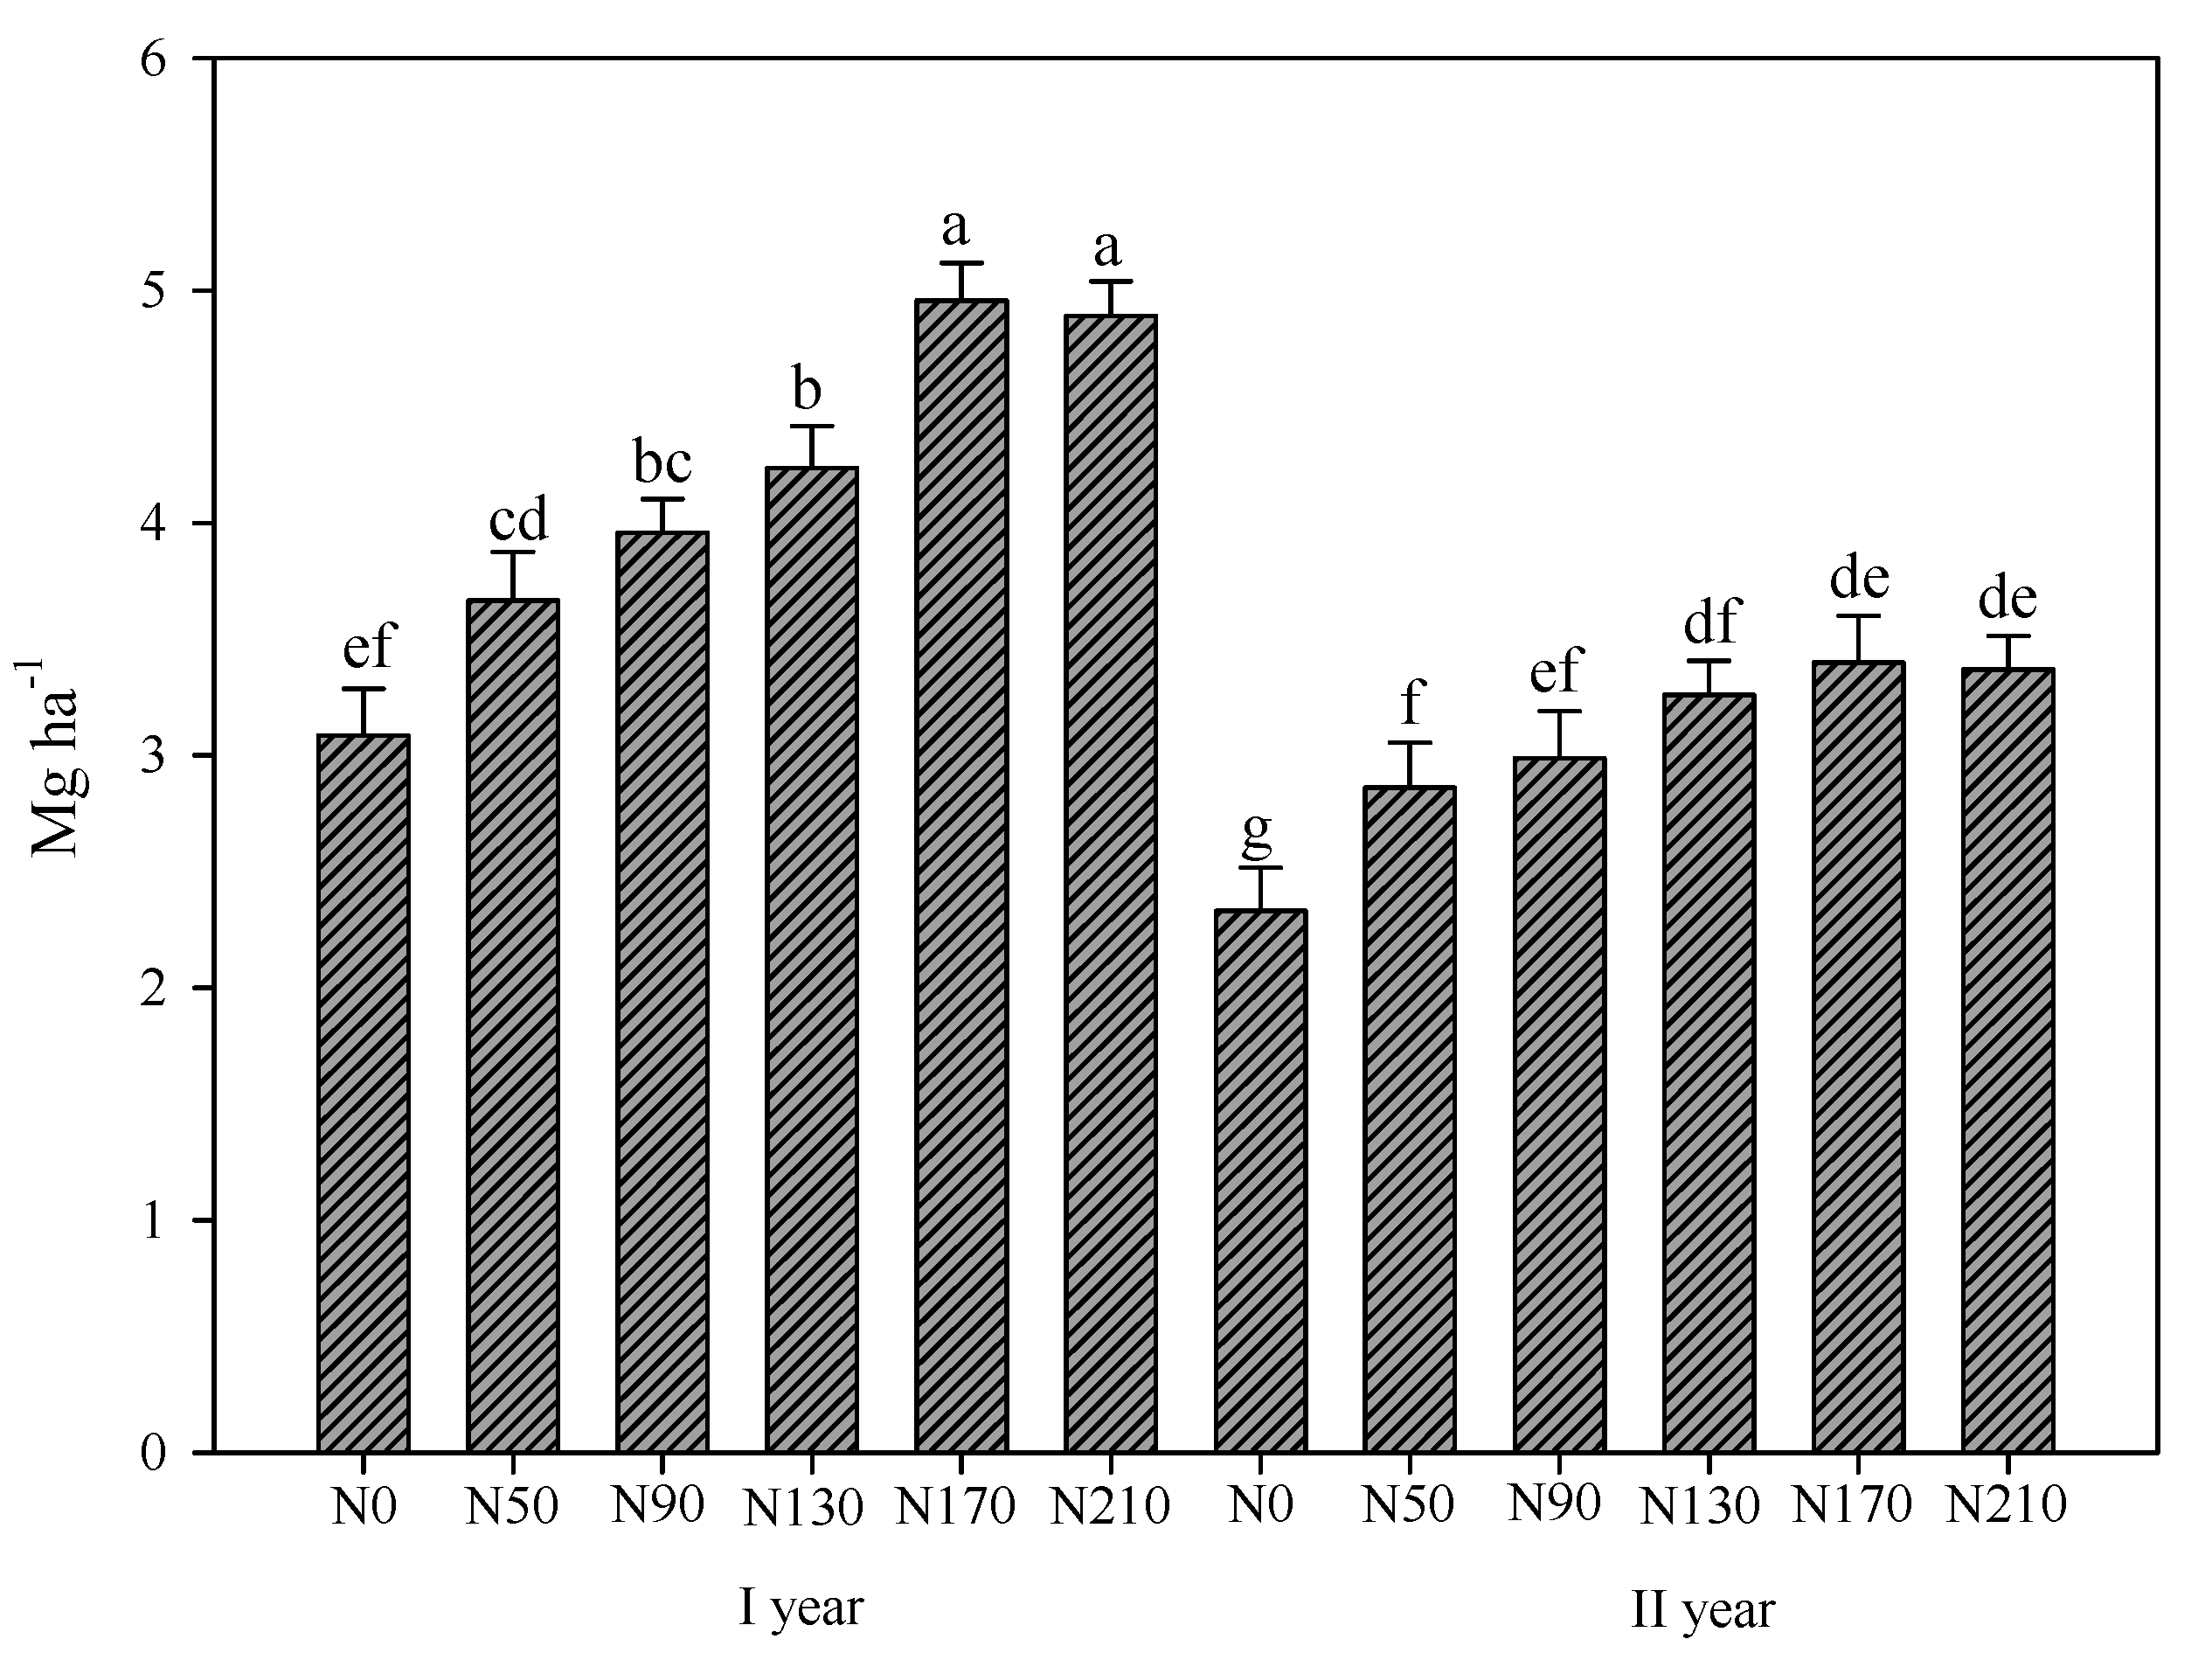
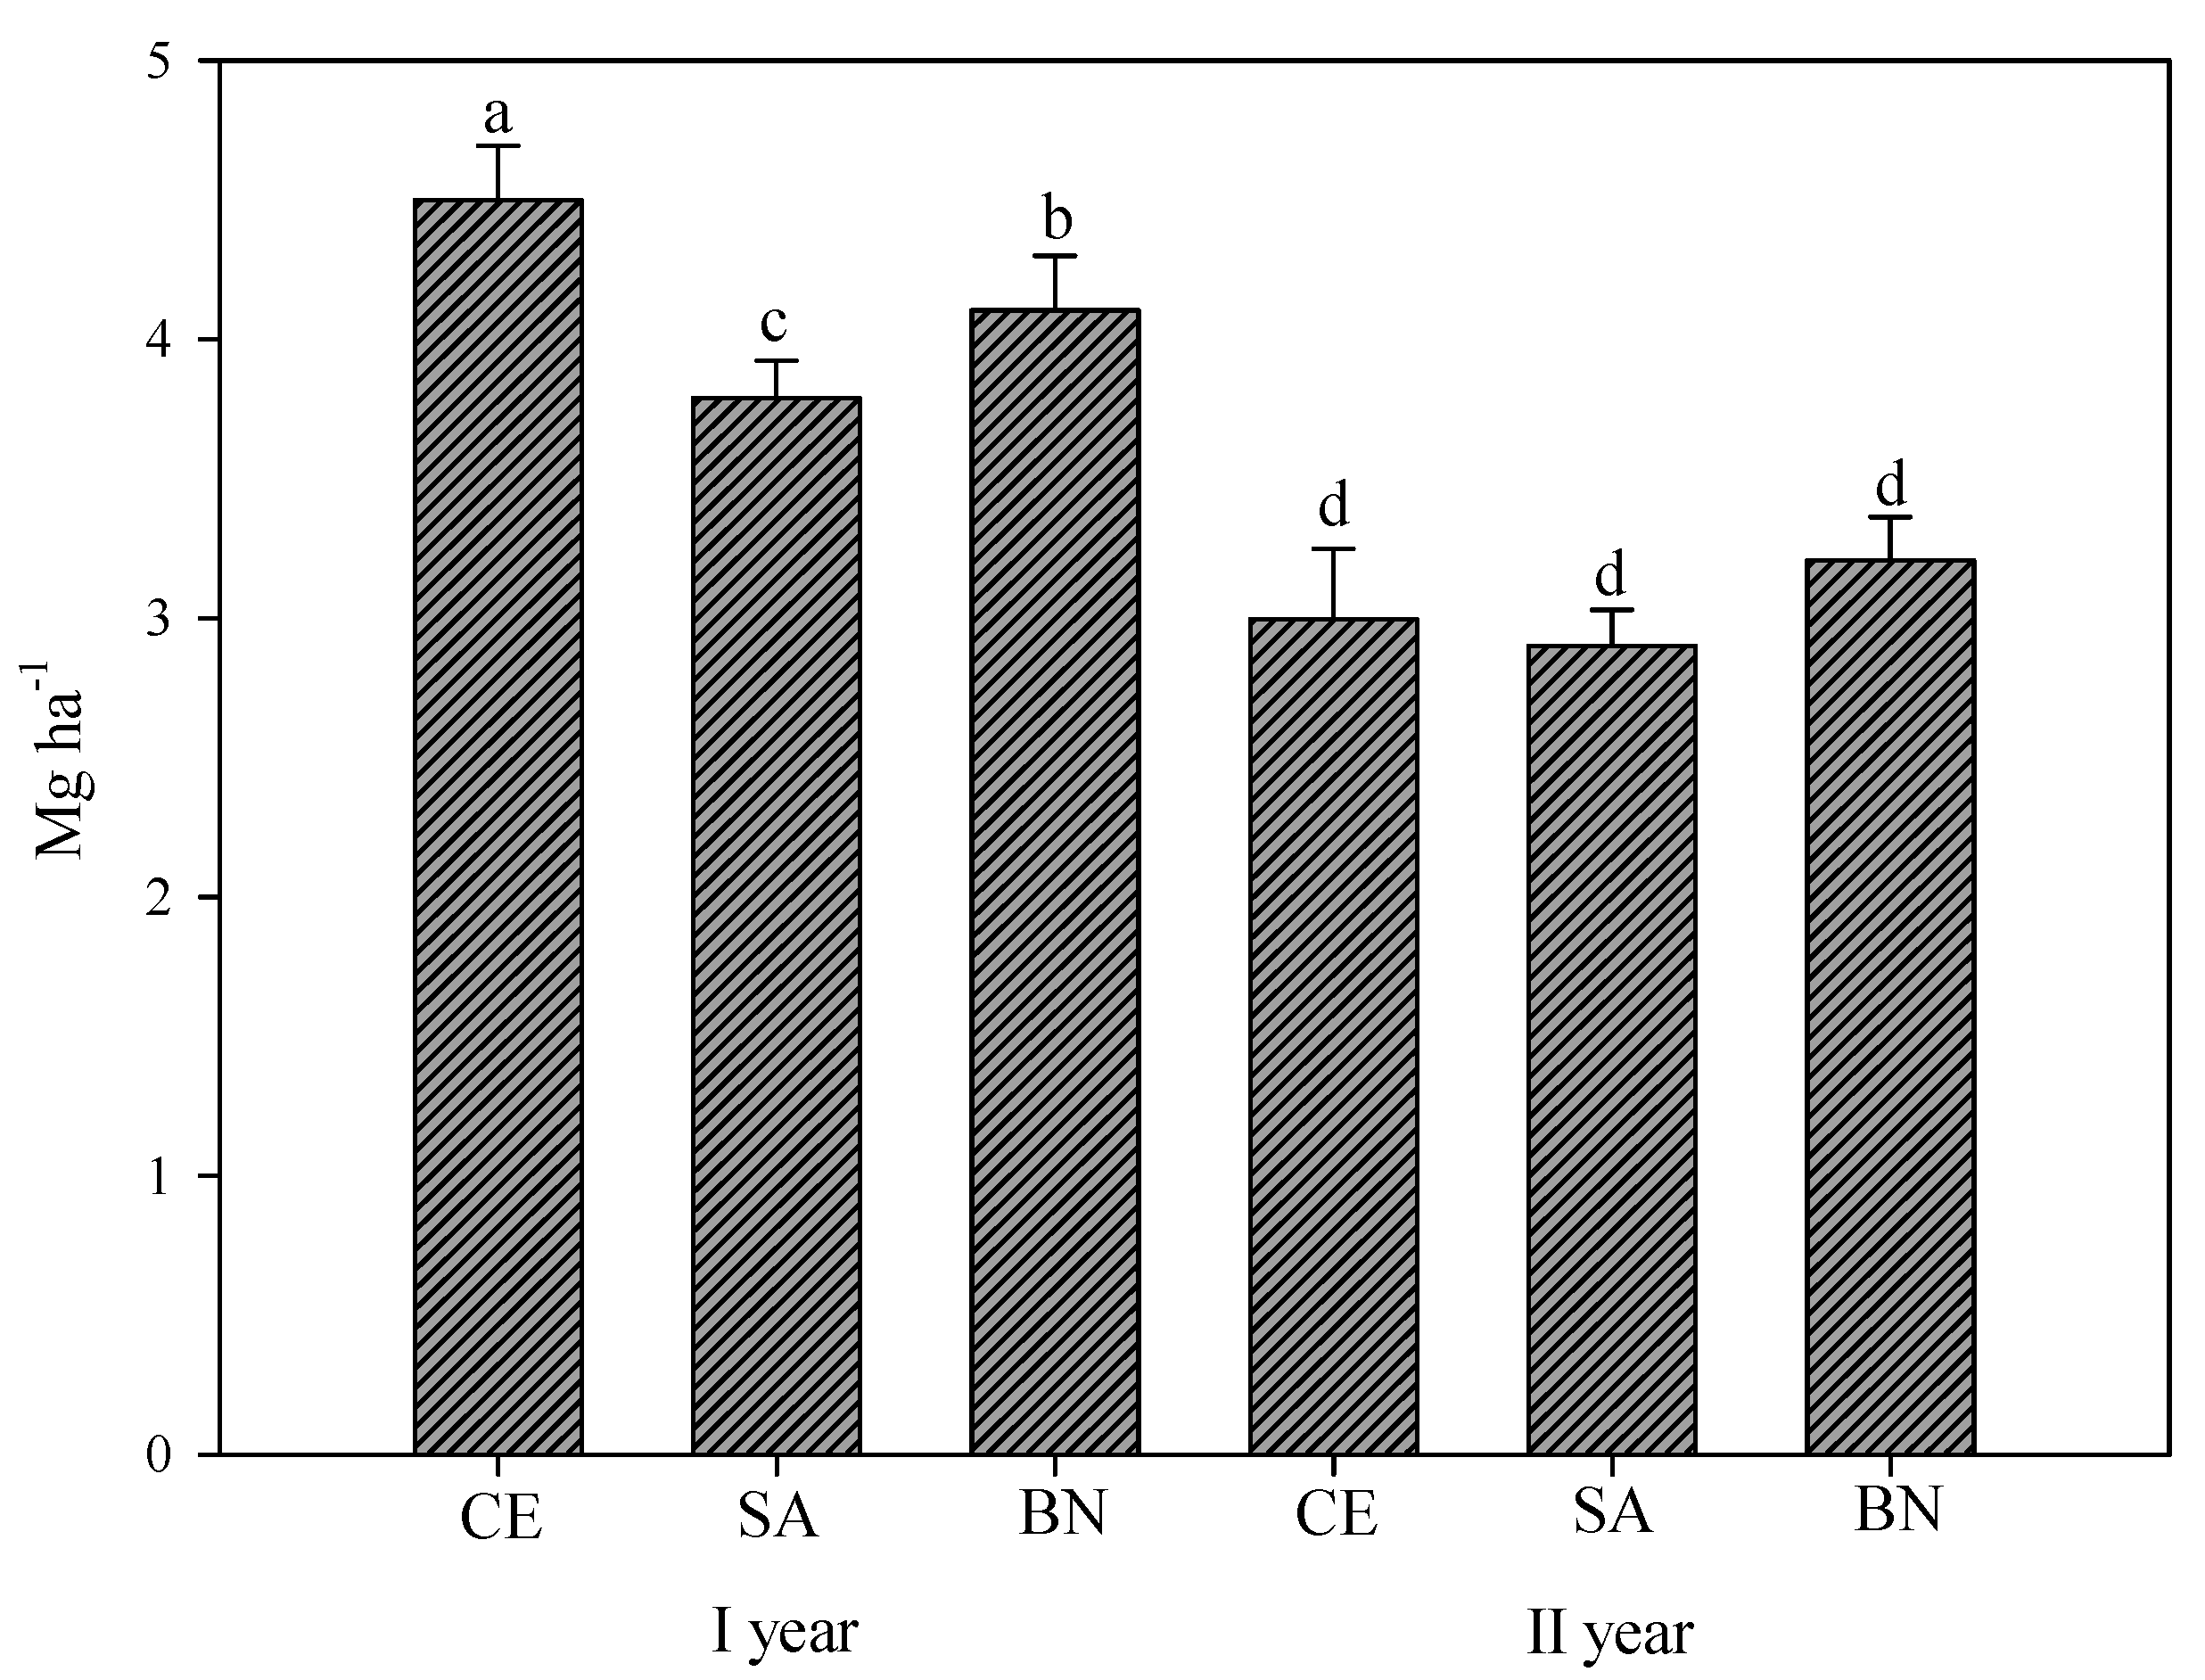
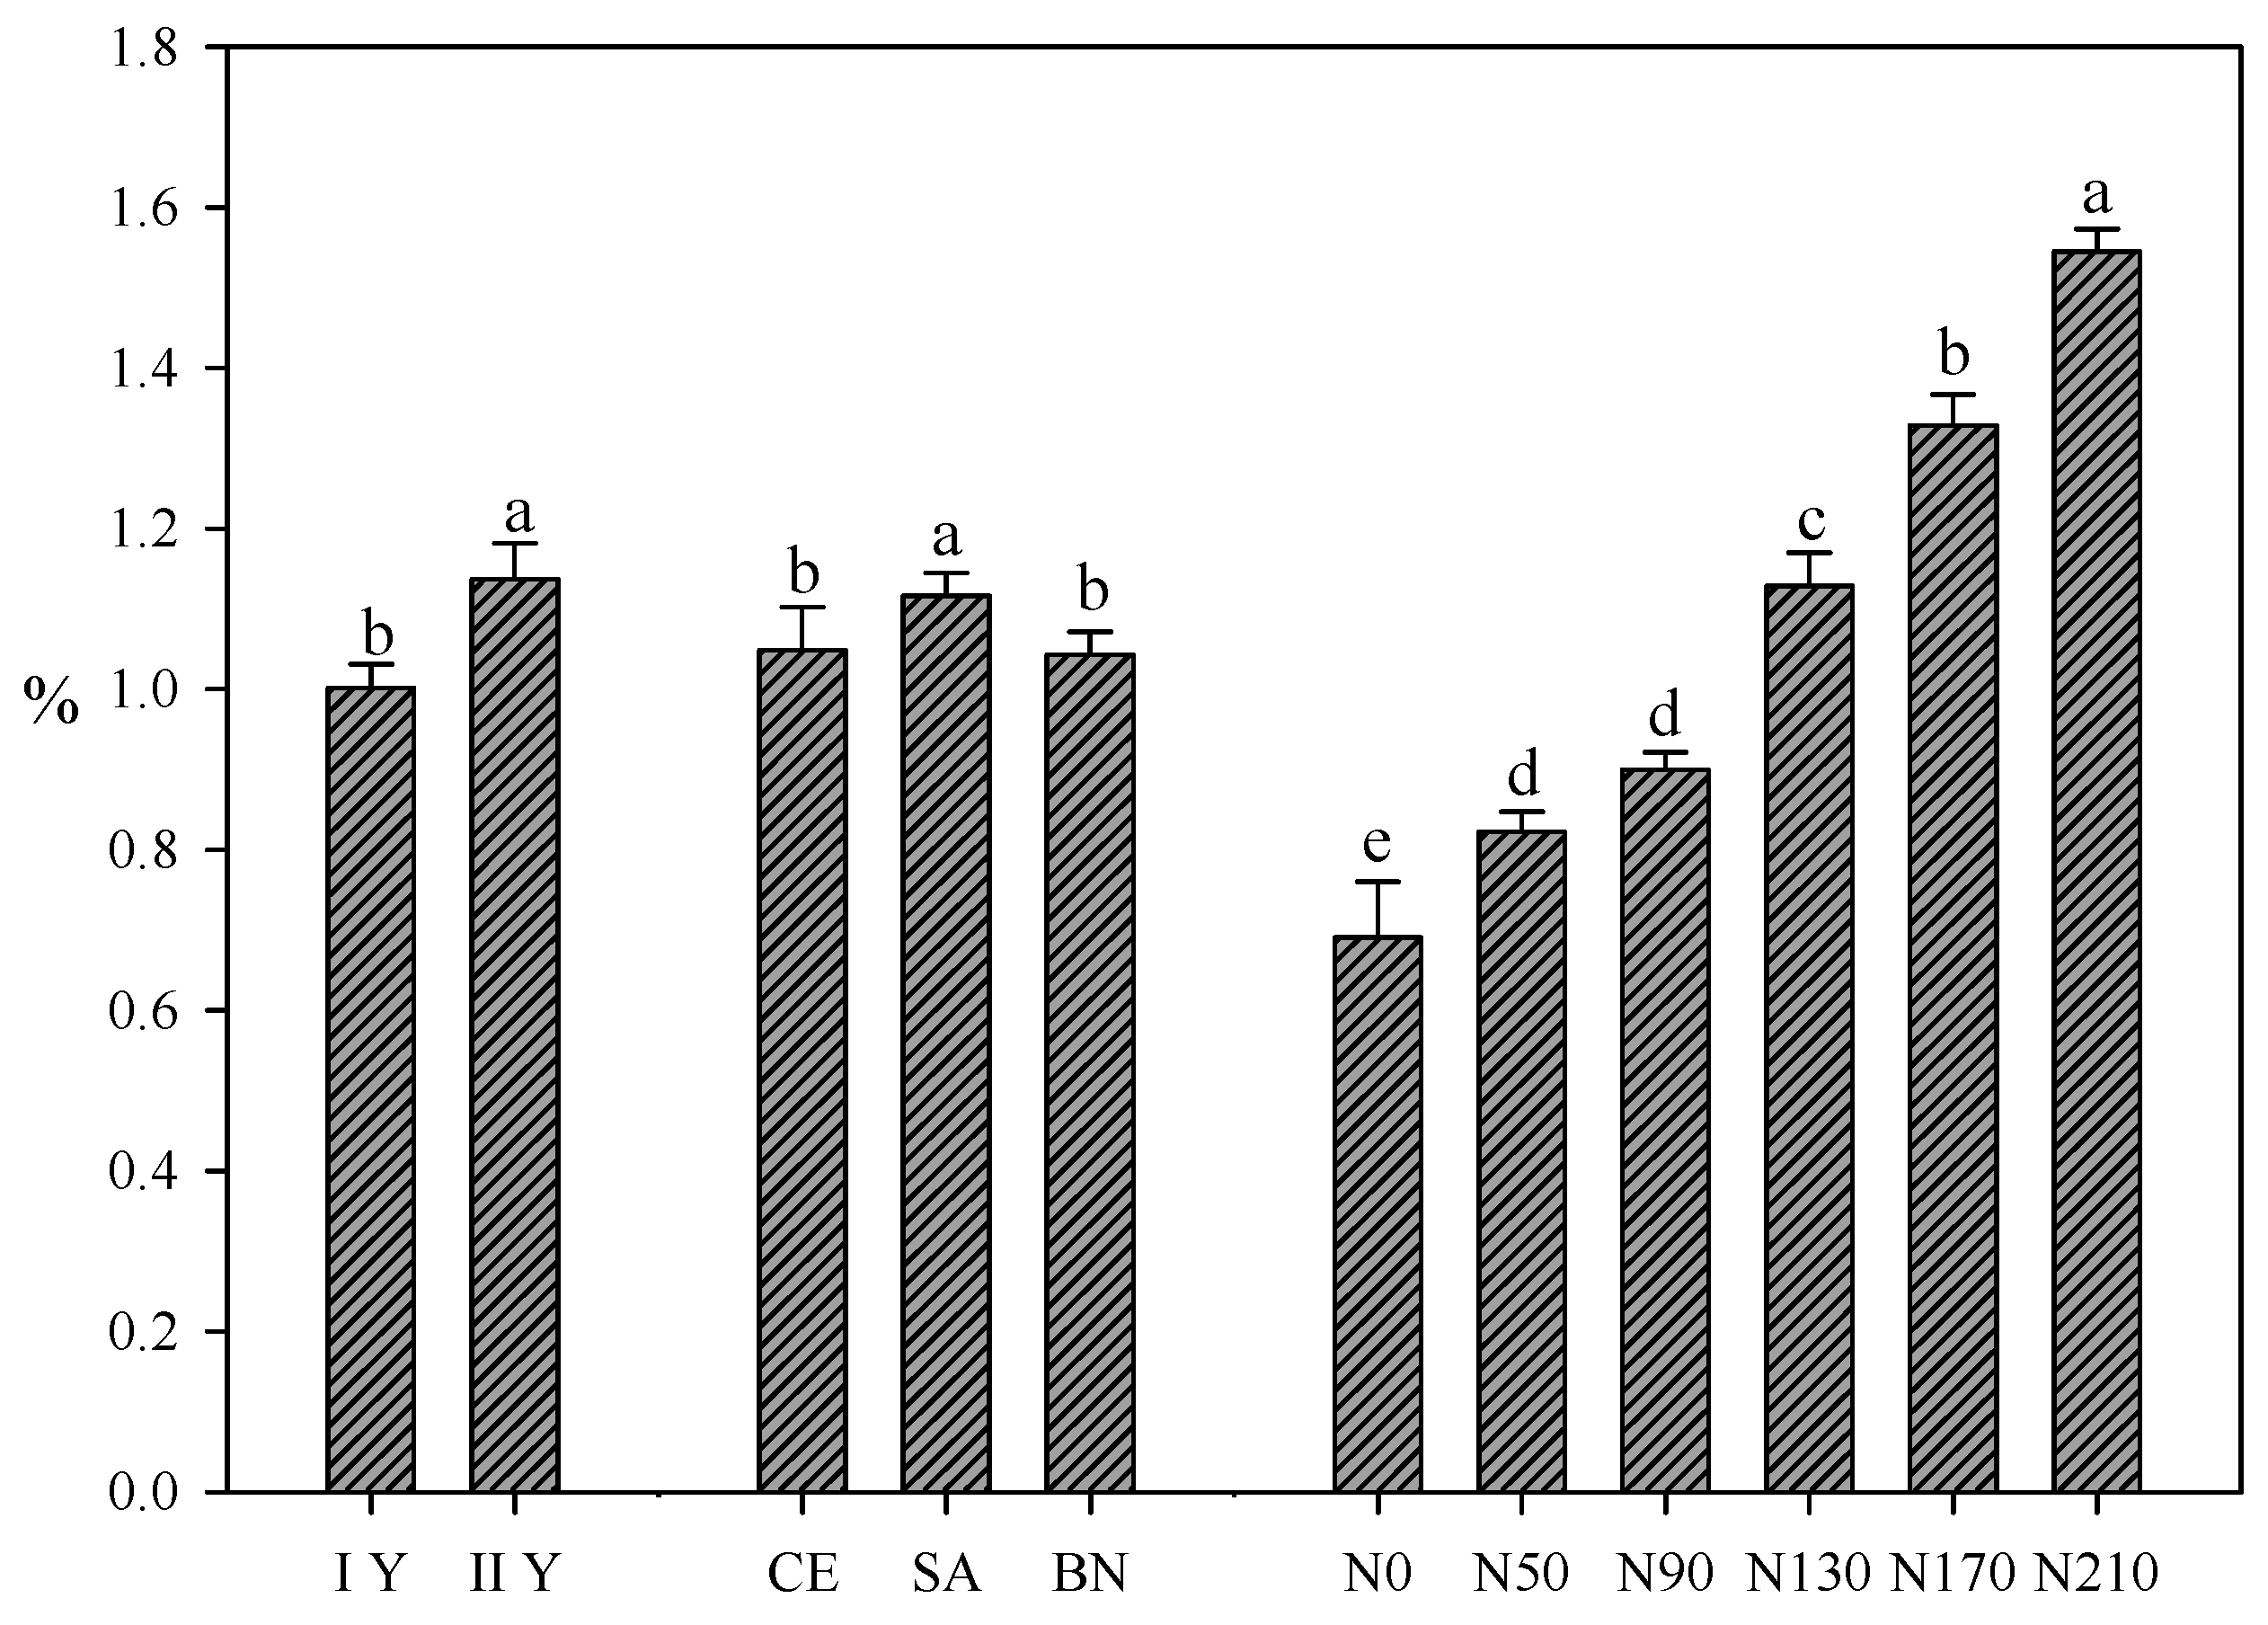
3.1. Yield and Quality of Cured Products

The significance of treatments on yield and quality traits (alkaloids, nitrates, total N, fire holding capacity, color, and score) is reported in Table 2. In the first year, the yield of cured leaves increased significantly with increasing N rates up to N 170 but without any further increase at 210 kg N ha−1 (Figure 2). In the second year, it increased up to N50, and on the whole, plants produced significantly less than in 2002 (Figure 2), presumably because of less rainfall during that growing season (Figure 1). On average, the yield was 4.1 and 3.0 Mg ha−1 in the first and second years, respectively. As for locations, in 2002, the yield was the highest at Vitulazio (CE) and the lowest at Bellizzi (SA), while in the second year, there was no significant difference in yield among locations (Figure 3).
The effects of Locations x N fertilization rates and of Years x Locations on intrinsic quality traits (nitrate, total N) and fire holding capacity are reported in Table 3. Both nitrates and the total N content of cured leaves increased with increasing N fertilization rates (Table 3). In particular, nitrate and total N content increased significantly up to N130 and N90, respectively, at Vitulazio (CE), N170 at Bellizzi (SA), and N90 at San Giorgio del Sannio (BN), without any further increase above those doses of N fertilization (Table 3). The fire holding capacity of cured tissues generally increased with increasing N fertilization at all locations up to N170 (Table 3). It ranged between 5 (N0) and 13 s (N170) at Vitulazio (CE), 4(N0) and 8 s (N170) at Bellizzi (SA), 6 (N0) and 14 s (N170) at San Giorgio del Sannio (BN) (Table 3).
By comparing locations in both years, results showed that in the first year, the highest nitrate contents of cured leaves were recorded at Vitulazio (CE) while in the second year at Vitulazio (CE) and San Giorgio del Sannio (BN) (Table 3). Cured leaves of Bellizzi (SA) showed a significantly lower nitrate content than Vitulazio (CE) in 2002 and then both Vitulazio (CE) and San Giorgio del Sannio (BN) in 2003 (Table 3). Cured leaves of Bellizzi (SA) also showed a significantly lower total N content than both Vitulazio (CE) and San Giorgio del Sannio (BN) in 2002 and Vitulazio (CE) in 2003 (Table 3). Fire holding capacity (s) of cured leaves from Bellizzi (SA) was in both years lower than that measured at both the other locations (Table 3).
The alkaloid content of cured leaves as affected by years, locations, and N fertilization rates are shown in Figure 4. Alkaloids content of cured tissues was significantly higher in 2003 than in 2002 (Figure 4). As for locations, cured products obtained at Bellizzi (SA) experimental field showed a significantly higher alkaloids content than products from both Vitulazio (CE) and San Giorgio del Sannio (BN) (Figure 4). N fertilization increased the alkaloids content of cured leaves and significantly up to the highest dose (N210; Figure 4). In particular, total N/alkaloids ratio ranged from 2.2 (N210) to 5.2 (N50) in 2002 and 2.6 (N210) to 6.3 (N0) in 2003 at Vitulazio (CE), from 2.0 (N210) to 3.6 (N0) in 2002 and 2.2 (N210) to 4.1 (N50) in 2003 at Bellizzi (SA), from 2.2 (N210) to 4.5 (N50) in 2002 and 2.5 (N210) to 5.1 (N0) in 2003 at San Giorgio del Sannio (BN).
The effects of Locations x N fertilization rates and of Years x Locations on color parameters (L*, a/b) and on scores assigned by expert evaluators are reported in Table 4. L* decreased while a/b increased with N fertilization and, in both cases, significantly up to N210 at each location (Table 4). Scores varied from 3.9 (N0) to 7.1 (N170) at Vitulazio (CE), from 3 (N0) to 5.6 (N170) at Bellizzi (SA) and from 3.8 (N0) to 6.4 (N170) at San Giorgio del Sannio (BN) (Table 4).
As for Locations x Years interaction, L* of cured leaves from Bellizzi (SA) was in both years significantly greater, as well as the a/b ratio significantly less, than L* and a/b ratio measured at other locations (Vitulazio, CE, and San Giorgio del Sannio, BN; Table 4). Finally, the score assigned by expert evaluators to cured products obtained at Vitulazio (CE) experimental field was in both years significantly greater than scores at Bellizzi (SA) and San Giorgio del Sannio (BN) (Table 4).

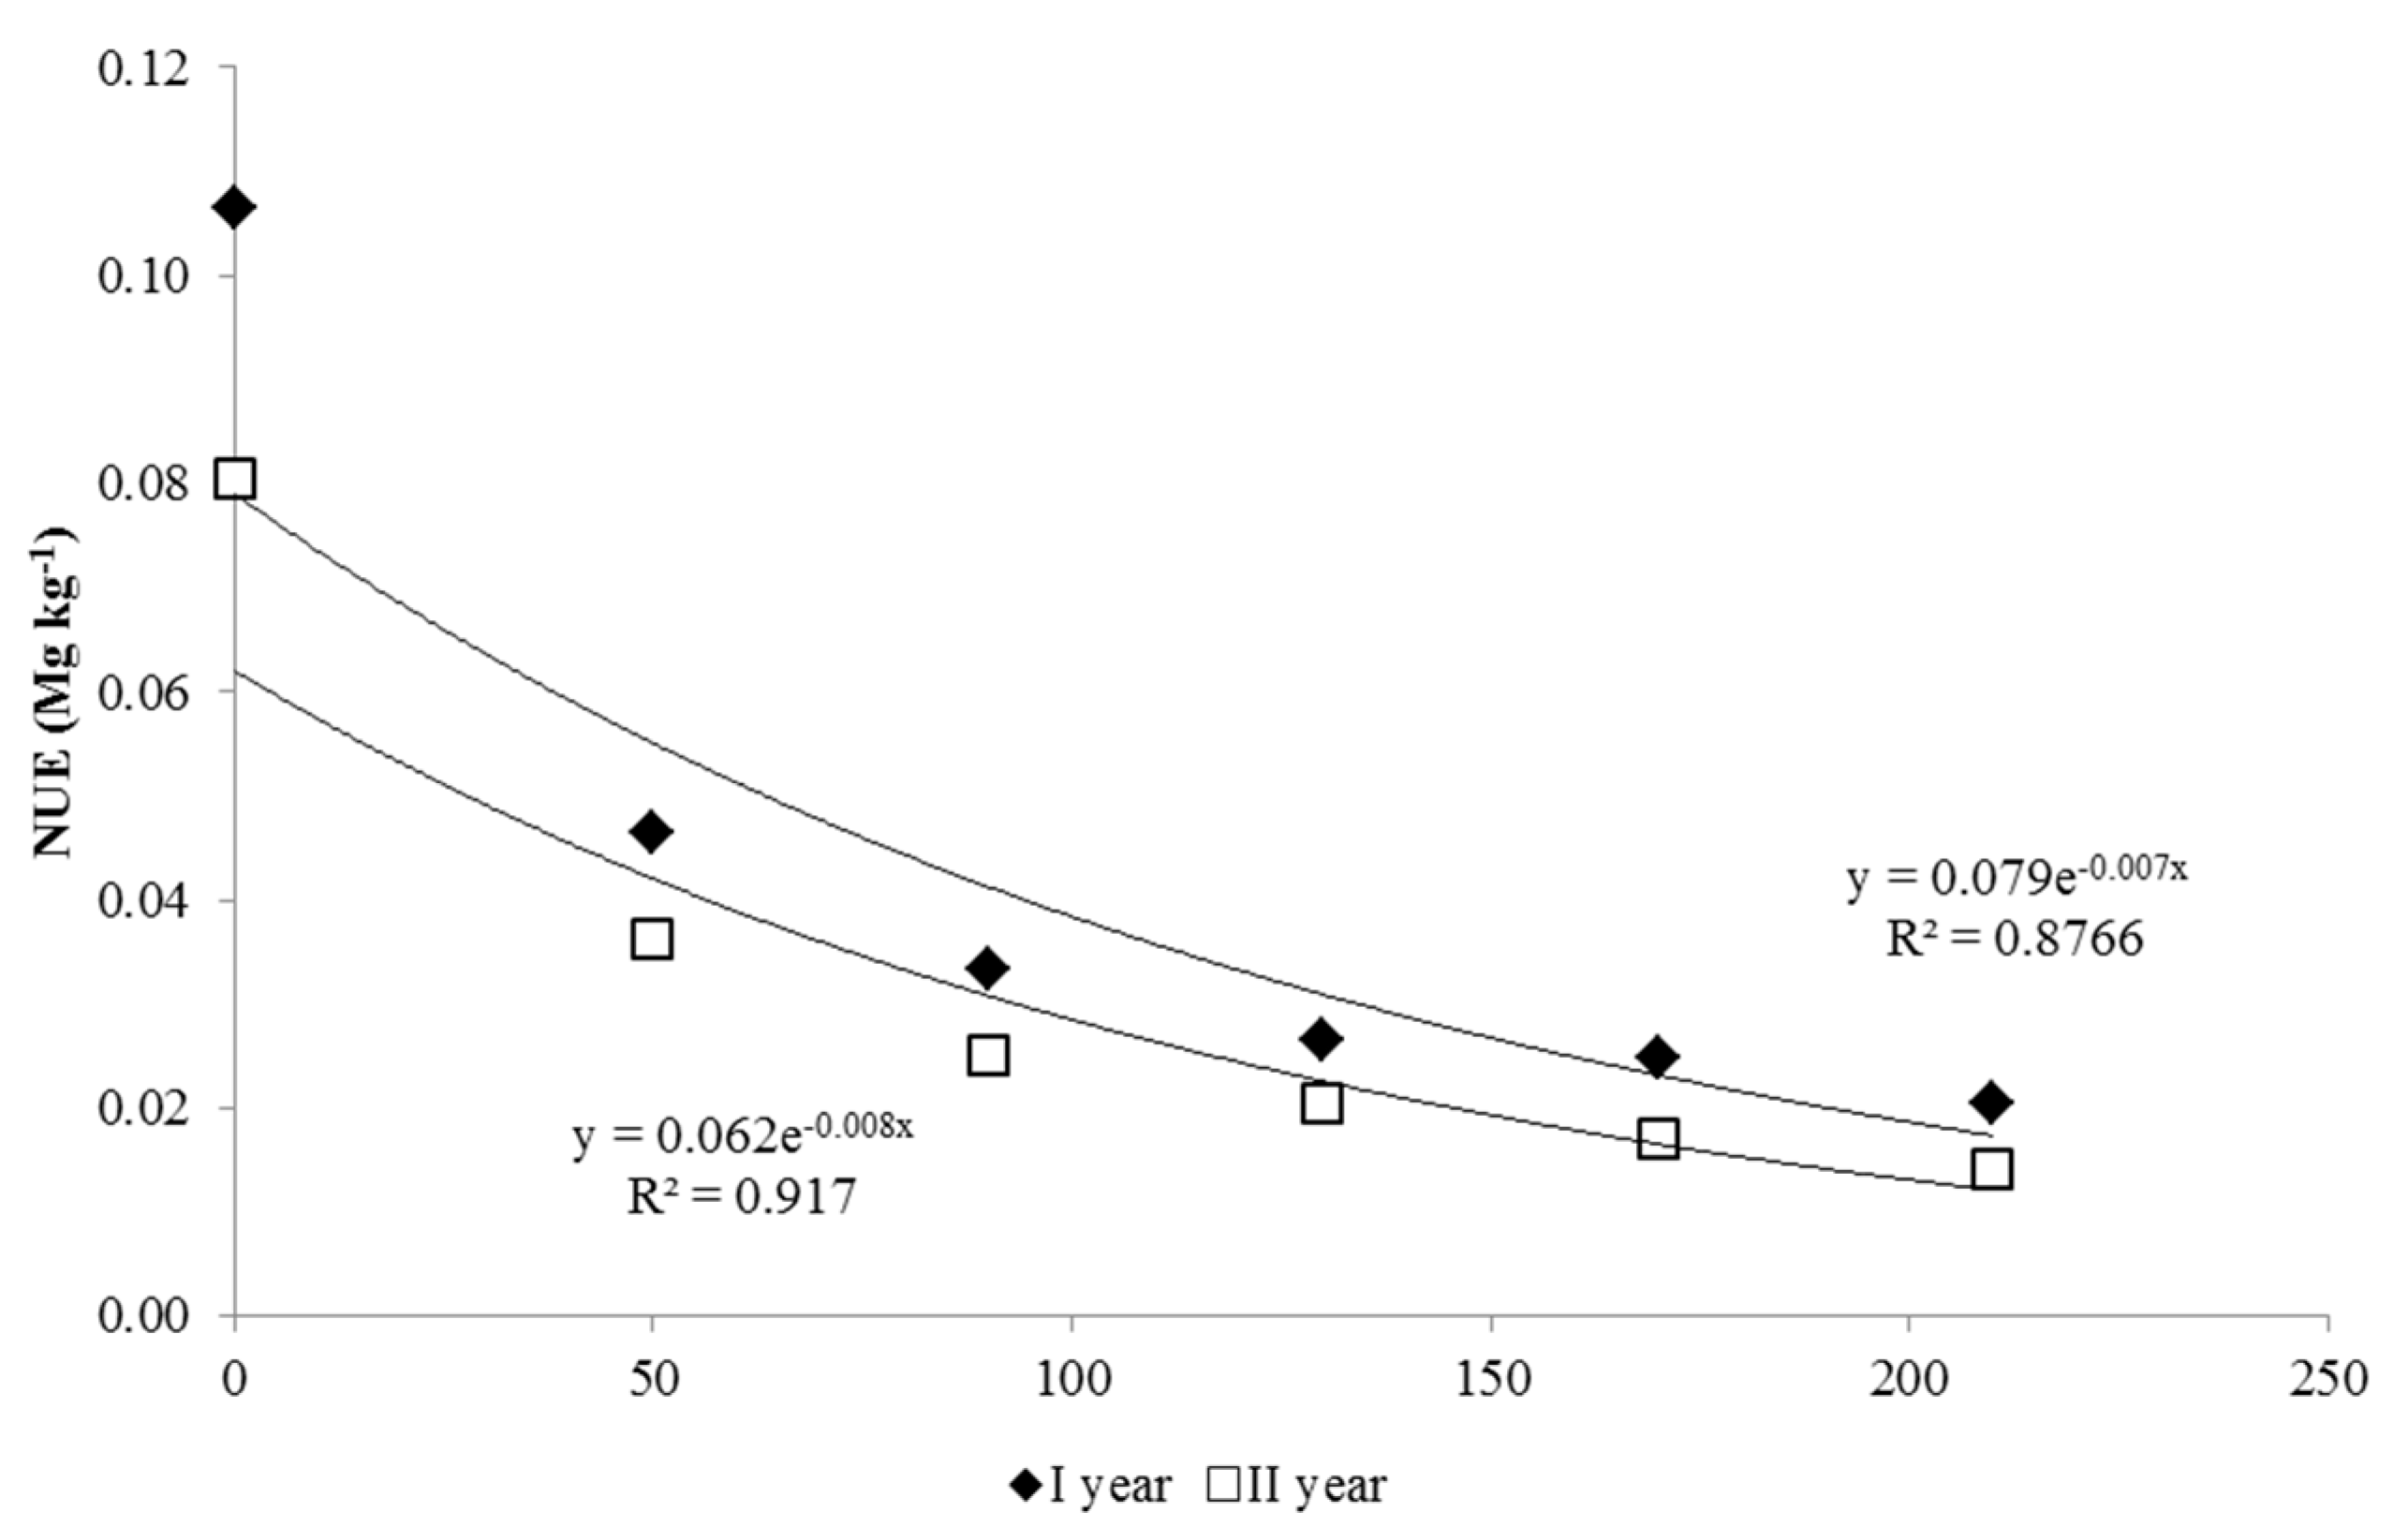
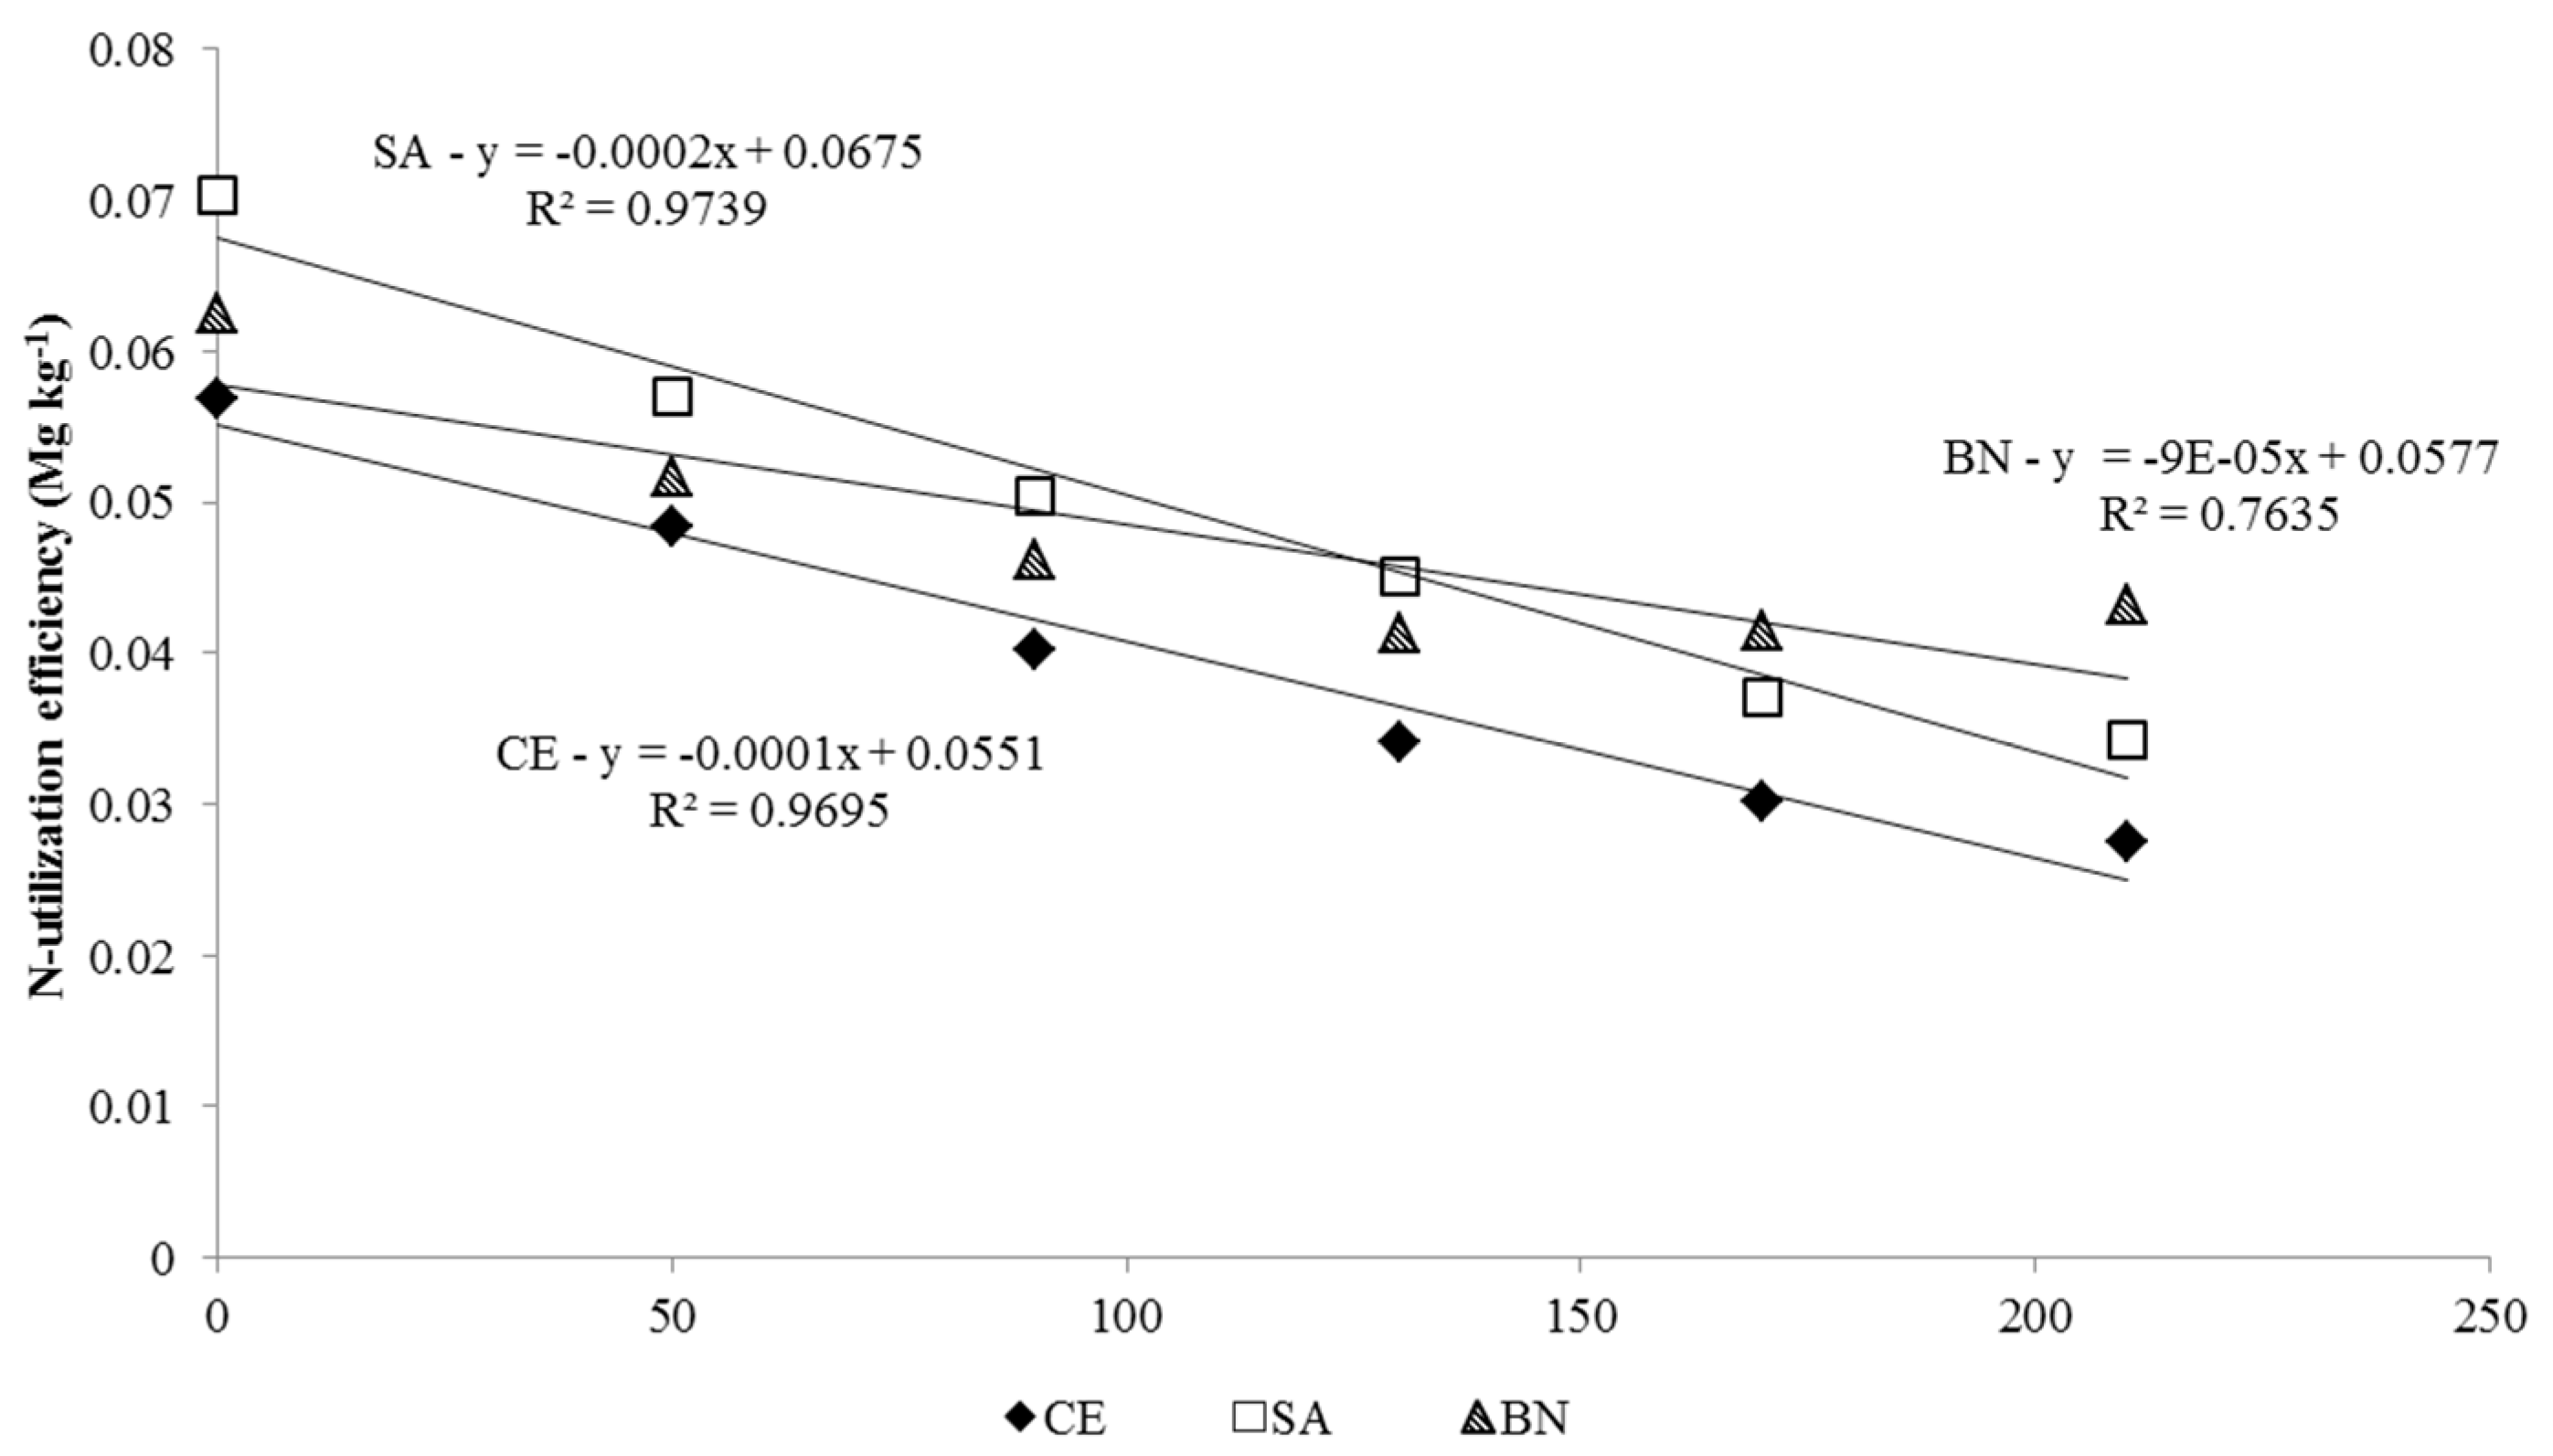
3.2. NUE, N-Uptake Efficiency, and N-Utilization Efficiency

NUE and N-utilization efficiency decreased with increasing N fertilization rates (Figure 5 and Figure 6). The exponential curve best fit the regression between NUE and nitrogen fertilization; in particular, at each N dose, NUE was greater in the first than in the second year (Figure 5). Among the N-utilization efficiency and N doses, a linear regression was found; NUt efficiency measured at Bellizzi (SA) and at San Giorgio del Sannio (BN) resulted in greater, on average, than that of Vitulazio (CE) (Figure 6). On average, the lowest NUE was recorded in 2003 than 2002 (Table 5). In the first year, plants grown at Vitulazio (CE) showed greater N-uptake efficiency than those grown at the other two locations (Table 5) but less N-utilization efficiency than the other two locations in 2002 and 2003 (Table 5).

4. Discussion

In spite of the reduction in the areas dedicated to tobacco cultivation worldwide, at present, the tobacco crop remains the most important non-food cash crop. Since it is usually over-fertilized [39], a reduction in N fertilization doses and an improvement of efficiency of N use becomes extremely relevant across different soils or environments.
In our research, we tested six different N levels, ranging from 0 to 210 kg ha−1, chosen regardless of the native mineral N content of the soil in the three locations. As expected yield of cured leaves appeared positively influenced by N fertilization but not at a rate higher than 170 kg ha−1 according to results of previous studies conducted on both light air-cured (Burley) or dark fire-cured (Kentucky) tobaccos grown in the same areas [40,43,52]. In light air-cured (Burley) tobacco, Sifola et al. [52] and Sifola and Postiglione [43] demonstrated that doses of N fertilization higher than 120 kg ha−1 did not produce substantial improvement in yield. In the same way, similar results were obtained for dark fire-cured (Kentucky) tobacco grown at BN province with N fertilization higher than 113 to 145 kg ha−1 depending on locations [40]. Regardless of fertilization levels, climate conditions also strongly affected cured leaves yield; indeed, in the second year, it was 26.8% less than the first year on average. Probably, this decrease can be explained by lower rainfall recorded in 2003, especially at CE and SA, if we consider that more than 53% of rainfall was concentrated in the first 20 days of June, immediately after the transplant, therefore not useful for production. In addition, also air temperatures greater than 30 °C for long periods at all locations could be responsible for the lower crop productivity in the 2003 growing season with respect to 2002. Instead, this difference in yield among the years doesn’t seem attributable to the physical and/or chemical soils properties, since per each site, they were quite similar in the two years.
N fertilization directly influenced nitrates and the total N content of cured leaves [40,44,45] at all locations. The highest values of both parameters were reached at N130 or N90, respectively, at Vitulazio (CE), N170 at Bellizzi (SA) but N90 at San Giorgio del Sannio (BN). Considering that nitrates are substrates for tobacco-specific nitrosamines (TSNA) during the curing period [53,54], this is another reason to recommend to growers not to apply an excessive amount of N fertilizers. Nitrate content measured in the present experiment might already produce in light air-cured (Burley) tobacco very high amount of TSNA [55], which are potentially carcinogenic.
The nitrate content recorded at Vitulazio (CE), higher than that of other locations, was attributable to the greater content of N in nitric form, already before N fertilization, in both years at the CE field with respect to those at SA and BN (11.6 vs. 2.0 and 0.9 ppm, on average, respectively; Table 1). In particular, nitrate N pool before transplanting was 43 and 44 kg ha−1 in 2002 and 2003 at Vitulazio (CE) but only 7.5 kg ha−1 in the 2 years at Bellizzi (SA) or 3.8 and 2.6 kg ha−1 in the first and the second year at San Giorgio del Sannio (BN).
Interestingly, regardless of locations, there was an increase in % quota of nitrates on total N with N fertilization. It was 14% at N0 treatment but 41% at N210. In addition, the % quota hardly changed between years since it was about 27% in 2002 and 31% in 2003 (data not shown). High amounts of nitrates accumulated in the leaves are a sign of poor efficiency of N utilization of tobacco plants [56]. Nitrates represent a quota of N that is not assimilated and therefore not profitably used by plants. This result was confirmed by indexes of N-use efficiency, which, in fact, always decreased as doses of N applied increased in line with the findings of Sifola and Postiglione [43].
The fire holding capacity increased with N fertilization rates [57] up to N170 treatment (maxima values were 12–13 s at CE and BN and 8 s at SA). Nevertheless, it was significantly reduced by the highest rate of N (210 kg N ha−1) at all locations, in agreement with results reported by Sims et al. [58] in plants fertilized with 224 kg N ha−1. The fire holding capacity describes the burning quality of cured tobacco that is a very important quality trait of commercial products. Generally, a high fire holding capacity occurs when the leaf structure is opened, then showing suitable aeration during burning. Usually, 3–6 s burn is already considered to be satisfactory for flue-cured (Virginia Bright) tobacco [59]. In the present experiment, we reached values higher than 6 s [57] already at N50 at CE and BN or N130 at SA.
Several chemical and physical parameters define the quality of tobacco cured leaves; between them, color, alkaloids content, as well as nitrogen and sugar in the leaf, play a key role. Nevertheless, the quality of the smoke is the result of the right combination of alkaloids (particularly nicotine), nitrogen, and sugar in the leaf. Nicotine generally represents up to 95% of the alkaloids of cured tobacco. Alkaloids content of cured leaves increased significantly up to the highest dose of N fertilization. It was in line (or sometimes less), on average, with what is required by tobacco companies and similar to that reported in previous studies on different kinds of tobacco [50,52,55,59]. Alkaloids contribute to defining the organoleptic properties of tobacco smoke; they influence both its flavor and taste [59]. When we calculated the total N/alkaloids ratio, we found a quite high value (3.3 on average; data not shown). The acceptable limit of this ratio, reported for flue-cured [59], is <1.2. Our values were always higher than 1.2, generally typical of light tobacco, due to low alkaloids content (0.5 to 1.7% d.w.) [60]. Excluding the highest values that were those of N0 and N50 cured leaves, the total N/alkaloids ratio of the present experiment should be considered appropriate for a light air-cured (Burley) tobacco such as that currently is cultivated in the Campania region. This tobacco is, in fact, properly known to be a filling tobacco thanks to its lightness and neutral aroma.
The color is affected by nitrogen availability; hazelnut is the typical color of light air-cured (Burley) tobacco cured leaves. It can switch to its variants that are dark and light hazelnut [61], which are generally the consequence of excess or lack of N, respectively. Our results showed that L* (brightness) decreased with increasing N fertilization, then giving cured leaves less bright and of more opaque hazelnut. By contrast, the a/b ratio in-creased with N treatments, then producing cured leaves of dark hazelnut ~\cite{B61-agronomy-11-01837}. The a/b ra-tio around 0.40 well describes the typical hazelnut color of good quality cured products of Italian Burley tobacco.
The score reported in Table 4 summarized results of expert evaluation of the whole quality of cured leaves, which took into account the development of the leaf, tissue structure, its integrity, and color. In our study, the highest score was obtained by cured products from Vitulazio (CE), which is actually the most suitable cultivation district for Burley tobacco in the Campania region. As for N fertilization, the best scores were assigned to cured products obtained by plants fertilized with 170 kg N ha−1.
The best NUE and N-uptake efficiency was recorded in 2002 at Vitulazio (CE), in spite of a higher NO3-N pool before N fertilization than other locations. Our data showed an NUE higher than that previously measured for Burley tobacco in the same agricultural region (0.0375 Mg yield per kg N supply vs. 2.6 kg yield per kg N apply, reported as AE in Sifola and Postiglione [43]). Nevertheless, in that study, the AE index was calculated using the “difference method”, assuming that N taken up by plants receiving no nitrogen fertilizer represented soil N reserves available for crop growth. Moreover, the high values of N-uptake efficiency reported in Table 5 (0.78 kg N uptake per kg N supply, on average) showed that light air-cured (Burley) tobacco plants were able to uptake N also by soil layers deeper than 0.3 m [43].
N-uptake efficiency measured in the present study conceptually corresponds to the annual output/input ratio of N (kg harvest N per kg input N), which is reported by several authors as an extremely important indicator to manage N in sustainable agriculture [17,62].

5. Conclusions

As expected, the results of the current research highlighted a positive response of tobacco to nitrogen fertilization, but only until 170 kg N ha−1, beyond which nitrogen has to be considered excessive for Burley tobacco grown in Mediterranean areas. It did not produce, on the whole, positive changes in both quantitative and qualitative traits of the cured product. Indeed, tobacco plants showed the best yield, fire holding capacity, and score when fertilized with 170 kg N ha−1.
The findings of our research also highlighted the effect of climate conditions on the productive response of the crop to N fertilization. Conditions of the lack of rainfall (recorded in the second year), together with the air temperature higher than 30 °C for long periods, negatively influenced the yield and quality traits of commercial cured products.
As expected, the nitrogen efficiency indexes decreased when the nitrogen dose increased, and also, in this case, in the second year they were lower, probably due to specific climate conditions.
Finally, considering the suitable results in terms of N-uptake efficiency (0.79 kg kg−1), it is conceivable a further future reduction in N apply, that could also help to respect the indications of Region Campania that invites tobacco farmers to not overcome 120 kg N ha−1, especially in areas vulnerable to nitrate, so preserving the environment.

Author Contributions

Conceptualization, M.M. and I.D.M.; methodology, M.M. and I.D.M.; software, L.O. and G.P.; validation, M.I.S., L.d.P., and M.M.; formal analysis, L.O. and E.C.; investigation, I.D.M. and M.M.; resources, I.D.M. and M.M.; data curation, E.C. and L.O.; writing—original draft preparation, M.I.S.; writing—review and editing, M.I.S., L.d.P., E.C., and I.D.M.; visualization, M.M., I.D.M., and M.I.S.; supervision, M.M. and M.I.S.; project administration, M.M.; funding acquisition, M.M. All authors have read and agreed to the published version of the manuscript.

Funding

This research received no external funding.

Data Availability Statement

The data sets generated for this study are available on request to the corresponding author.

Acknowledgments

We would like to thank Sabrina Nocerino for her support in laboratory work.

Conflicts of Interest

The authors declare no conflict of interest.

Abbreviations

SCL, sandy clay loam; N tot, total nitrogen; FHC, fire holding capacity; NUE, nitrogen-use efficiency; NUp, nitrogen-uptake efficiency; NUt, nitrogen-utilization efficiency; d.w., dry weight.

References

  1. Spiertz, J.H.J. Nitrogen, sustainable agriculture and food security. A review. In Sustainable Agriculture; Springer: Dordrecht, The Netherlands, 2010; Volume 30, pp. 43–55. [Google Scholar]
  2. Bindraban, P.S.; Dimkpa, C.; Nagarajan, L.; Roy, A.; Rabbinge, R. Revisiting fertilisers and fertilisation strategies for improved nutrient uptake by plants. Biol. Fertil. Soils 2015, 51, 897–911. [Google Scholar] [CrossRef] [Green Version]
  3. Kaiser, D.R.; Sequinatto, L.; Reinert, D.J.; Reichert, J.M.; Rheinheimer, D.S.; Dalbianco, L. High nitrogen fertilization of tobacco crop in headwater watershed contaminates subsurface and well waters with nitrate. J. Chem. 2015, 375092. [Google Scholar] [CrossRef] [Green Version]
  4. Lawniczak, A.E.; Zbierska, J.; Nowak, B.; Achtenberg, K.; Grześkowiak, A.; Kanas, K. Impact of agriculture and land use on nitrate contamination in groundwater and running waters in central-west Poland. Environ. Monit. Assess. 2016, 188, 172. [Google Scholar] [CrossRef] [Green Version]
  5. Singh, B.; Craswell, E. Fertilizers and nitrate pollution of surface and ground water: An increasingly pervasive global problem. SN Appl. Sci. 2021, 3, 1–24. [Google Scholar]
  6. Food and Agriculture Organization. FAOSTAT. Available online: http://www.fao.org/faostat/en/#data/QL (accessed on 17 July 2021).
  7. Nitrate Directive (ND; 91/676/EEC). Available online: https://eur-lex.europa.eu/legal-content/EN/TXT/PDF/?uri=CELEX:31991L0676&from=EN (accessed on 17 July 2021).
  8. Weih, M.; Asplund, L.; Bergkvist, G. Assessment of nutrient use in annual and perennial crops: A functional concept for analyzing nitrogen use efficiency. Plant Soil 2011, 339, 513–520. [Google Scholar] [CrossRef] [Green Version]
  9. Lassaletta, L.; Billen, G.; Grizzetti, B.; Anglade, J.; Garnier, J. 50 year trends in nitrogen use efficiency of world cropping systems: The relationship between yield and nitrogen input to cropland. Environ. Res. Lett. 2014, 9, 105011. [Google Scholar] [CrossRef]
  10. Muchow, R.C. Nitrogen utilization efficiency in maize and grain sorghum. Field Crop. Res. 1998, 56, 209–216. [Google Scholar] [CrossRef]
  11. Barbieri, P.A.; Echeverría, H.E.; Saínz Rozas, H.R.; Andrade, F.H. Nitrogen use efficiency in maize as affected by nitrogen availability and row spacing. Agrono. J. 2008, 100, 1094–1100. [Google Scholar] [CrossRef]
  12. de Carvalho, E.V.; Afférri, F.S.; Peluzio, J.M.; Dotto, M.A.; Cancellier, L.L. Nitrogen use efficiency in corn (Zea mays L) genotypes under different conditions of nitrogen and seeding date. Maydica 2012, 57, 43–48. [Google Scholar]
  13. Asseng, S.; Turner, N.C.; Keating, B.A. Analysis of water-and nitrogen-use efficiency of wheat in a Mediterranean climate. Plant Soil 2001, 233, 127–143. [Google Scholar] [CrossRef]
  14. Ravier, C.; Meynard, J.M.; Cohan, J.P.; Gate, P.; Jeuffroy, M.H. Early nitrogen deficiencies favor high yield, grain protein content and N use efficiency in wheat. Eur. J. Agron. 2017, 89, 16–24. [Google Scholar] [CrossRef]
  15. de Oliveira Silva, A.; Ciampitti, I.A.; Slafer, G.A.; Lollato, R.P. Nitrogen utilization efficiency in wheat: A global perspective. Eur. J. Agron. 2020, 114, 126008. [Google Scholar] [CrossRef]
  16. Lüder, R.M.H.; Qin, R.; Richner, W.; Stamp, P.; Streit, B.; Herrera, J.M.; Noulas, C. Small-Scale variation in nitrogen use efficiency parameters in winter wheat as affected by N fertilization and tillage intensity. Sustainability 2020, 12, 3621. [Google Scholar] [CrossRef]
  17. Moitzi, G.; Neugschwandtner, R.W.; Kaul, H.P.; Wagentristl, H. Efficiency of mineral nitrogen fertilization in winter wheat under Pannonian climate conditions. Agriculture 2020, 10, 541. [Google Scholar] [CrossRef]
  18. Di Mola, I.; Ottaiano, L.; Sacco, A.; Senatore, M.; Mori, M. Organic versus mineral fertilization: Assessing of yield and quality of durum wheat in marginal lands. Ital. J. Agron. 2021, 16. [Google Scholar] [CrossRef]
  19. Badr, M.A.; Shedeed, S.I.; Hussein, S.D.A. Tomato fruit yield and nitrogen use efficiency as affected by drip irrigation method and rate of nitrogen in a hot dry climate. J. Appl. Sci. Res. 2012, 8, 4486–4495. [Google Scholar]
  20. Du, Y.D.; Cao, H.X.; Liu, S.Q.; Gu, X.B.; Cao, Y.X. Response of yield, quality, water and nitrogen use efficiency of tomato to different levels of water and nitrogen under drip irrigation in Northwestern China. J. Integr. Agric. 2017, 16, 1153–1161. [Google Scholar] [CrossRef] [Green Version]
  21. Liang, L.; Ridoutt, B.G.; Lal, R.; Wang, D.; Wu, W.; Peng, P.; Hang, S.; Wang, L.; Zhao, G. Nitrogen footprint and nitrogen use efficiency of greenhouse tomato production in North China. J. Clean. Prod. 2019, 208, 285–296. [Google Scholar] [CrossRef]
  22. Ronga, D.; Parisi, M.; Pentangelo, A.; Mori, M.; Di Mola, I. Effects of nitrogen management on biomass production and dry matter distribution of processing tomato cropped in southern Italy. Agronomy 2019, 9, 855. [Google Scholar] [CrossRef] [Green Version]
  23. Cozzolino, E.; Di Mola, I.; Ottaiano, L.; El-Nakhel, C.; Rouphael, Y.; Mori, M. Foliar application of plant-based biostimulants improve yield and upgrade qualitative characteristics of processing tomato. Ital. J. Agron. 2021, 16, 1825. [Google Scholar]
  24. Zebarth, B.J.; Tai, G.; Tarn, R.D.; De Jong, H.; Milburn, P.H. Nitrogen use efficiency characteristics of commercial potato cultivars. Can. J. Plant Sci. 2004, 84, 589–598. [Google Scholar] [CrossRef]
  25. Hailu, G.; Nigussie, D.; Ali, M.; Derbew, B. Nitrogen and phosphorus use efficiency in improved potato (Solanum tuberosum L.) cultivars in southern Ethiopia. Am. J. Potato Res. 2017, 94, 617–663. [Google Scholar] [CrossRef]
  26. Milroy, S.P.; Wang, P.; Sadras, V.O. Defining upper limits of nitrogen uptake and nitrogen use efficiency of potato in response to crop N supply. Field Crop. Res. 2019, 239, 38–46. [Google Scholar] [CrossRef]
  27. Montemurro, F.; De Giorgio, D. Quality and nitrogen use efficiency of sunflower grown at different nitrogen levels under Mediterranean conditions. J. Plant Nutr. 2005, 28, 335–350. [Google Scholar] [CrossRef]
  28. Qahar, A.; Khan, Z.H.; Anwar, S.; Badshah, H.; Ullah, H. Nitrogen use efficiency, yield and other characteristics of sunflower Helianthus annuus L. hybrids as affected by different levels of nitrogen. Biyolojik Çeşitlilik Koruma 2010, 3, 121–125. [Google Scholar]
  29. Immanuel, R.R. Nutrient uptake and nutrient use efficiency of sunflower in response to Zn and B micronutrient fertilization. Plant Arch. 2019, 19, 543–547. [Google Scholar]
  30. Weih, M.; Hamnér, K.; Pourazari, F. Analyzing plant nutrient uptake and utilization efficiencies: Comparison between crops and approaches. Plant Soil 2018, 430, 7–21. [Google Scholar] [CrossRef] [Green Version]
  31. MacDonald, B.C.; Latimer, J.O.; Schwenke, G.D.; Nachimuthu, G.; Baird, J.C. The current status of nitrogen fertiliser use efficiency and future research directions for the Australian cotton industry. J. Cotton Res. 2018, 1, 1–10. [Google Scholar] [CrossRef]
  32. Neupane, D.; Solomon, J.K.Q.; Davison, J.; Lawry, T. Nitrogen source and rate effects on grain and potential biodiesel production of camelina in the semiarid environment of northern Nevada. GCB Bioenergy 2018, 10, 861–876. [Google Scholar] [CrossRef] [Green Version]
  33. Moll, R.H.; Kamprath, E.J.; Jackson, W.A. Analysis and interpretation of factors which contribute to efficiency of nitrogen utilization. Agron. J. 1982, 74, 562–564. [Google Scholar] [CrossRef]
  34. Bouchet, A.S.; Laperche, A.; Bissuel-Belaygue, C.; Snowdon, R.; Nesi, N.; Stahl, A. Nitrogen use efficiency in rapeseed. A review. Agron. Sustain. Dev. 2016, 36, 1–20. [Google Scholar] [CrossRef]
  35. Yadav, M.R.; Kumar, R.; Parihar, C.M.; Yadav, R.K.; Jat, S.L.; Ram, H.; Meena, R.K.; Singh, M.; Verma, A.P.; Kumar, U.; et al. Strategies for improving nitrogen use efficiency: A review. Agric. Rev. 2017, 38, 29–40. [Google Scholar] [CrossRef] [Green Version]
  36. Antille, D.L.; Moody, P.W. Nitrogen use efficiency indicators for the Australian cotton, grains, sugar, dairy and horticulture industries. Environ. Sustain. Indic. 2021, 10, 100099. [Google Scholar] [CrossRef]
  37. Mahmud, K.; Panday, D.; Mergoum, A.; Missaoui, A. Nitrogen losses and potential mitigation strategies for a sustainable agroecosystem. Sustainability 2021, 13, 2400. [Google Scholar] [CrossRef]
  38. Fageria, N.K.; Baligar, V.C. Enhancing Nitrogen Use Efficiency in Crop Plants. Adv. Agron. 2005, 88, 97–185. [Google Scholar]
  39. Sifola, M.I. Assessment of water quality used for irrigation of tobacco (Nicotiana tabacum L.) in the Campania region, Italy. In Proceedings of the Actes (Tome 4: Environnement et Nature) Congres Internationale Environnement et Identité en Mediterranée, Corte (Corse), France, 3–5 July 2002; pp. 645–650. [Google Scholar]
  40. Sifola, M.I.; Carrino, L.; Cozzolino, E.; Ianuario, S.; Lucibelli, A.; Coppola, A. A Survey of fertility program responses of Kentucky dark fire-cured Tobacco (Nicotiana tabacum L.) yield and quality for cigars manufacture in the Benevento province (Southern Italy). Beiträge zur Tabakforschung Int. Contrib. Tob. Res. 2018, 28, 14–29. [Google Scholar] [CrossRef] [Green Version]
  41. De Roo, H.C. Nitrate Fluctuation in Ground Water as Influenced by Use of Fertilizer; Connecticut Agrucultural Experimewnt Station, University of Connecticut: New Haven, CT, USA, 1980; p. 779. [Google Scholar]
  42. Kaiser, D.R.; Reinert, D.J.; Reichert, J.M.; Streck, C.A.; Pellegrini, A. Nitrate and ammonium in soil solution in tobacco management systems. Revista Brasileira de Ciência do Solo 2010, 34, 379–388. [Google Scholar] [CrossRef]
  43. Sifola, M.I.; Postiglione, L. The effect of nitrogen fertilization on nitrogen use efficiency of irrigated and non-irrigated tobacco (Nicotiana tabacum L.). Plant Soil 2003, 252, 313–323. [Google Scholar] [CrossRef]
  44. Bailey, W.A. Effect of nitrogen rate on growth, yield, quality, and leaf chemistry of dark tobacco. Tob. Sci. 2014, 51, 13–22. [Google Scholar]
  45. Drake, M.P.; Vann, M.C.; Fisher, L.R. Nitrogen application rate influence on yield, quality, and chemical constituents of flue-cured tobacco, Part I: Application timing. Tob. Sci. 2015, 52, 11–17. [Google Scholar] [CrossRef]
  46. Sisson, V.A.; Rufty, T.W.; Williamson, R.E. Nitrogen-use efficiency among flue-cured tobacco genotypes. Crop Sci. 1991, 31, 1615–1620. [Google Scholar] [CrossRef]
  47. Teng, W.; Li, W.; Li, C. Comparison of N uptake and internal use efficiency in two tobacco varieties. Crop J. 2015, 3, 80–86. [Google Scholar] [CrossRef] [Green Version]
  48. Hou, M.; Jin, Q.; Wu, X.; Yao, Y.; Zhang, Z. Impact of top-pruning time on the fertilizer N use efficiency of flue-cured tobacco as assessed by 15N tracing technique. Arch. Agron. Soil Sci. 2017, 63, 1324–1335. [Google Scholar] [CrossRef]
  49. Andrade, A.B.; Guelfi, D.R.; Faquin, V.; Coelho, F.S.; de CSouza, C.S.; Faquin, G.P.; Souza, K.R.; Chagas, W.F. Genotypic variation in nitrogen use-efficiency traits of 28 Tobacco genotypes. Agronomy 2020, 10, 572. [Google Scholar] [CrossRef] [Green Version]
  50. Sifola, M.I.; Postiglione, L. The effect of nitrogen fertilization and irrigation on dry matter partitioning, yield and quality of tobacco (Nicotiana tabacum L.) Burley type. Agricoltura Mediterr. 2002, 132, 33–43. [Google Scholar]
  51. Lidzey, R.G.; Savage, G.P. An automated procedure for the determination of total alkaloids in cigarette smoke using on-line cyanogen chloride generation from low hazard starting materials. Beiträge Tab. Int. 1986, 13, 151–155. [Google Scholar] [CrossRef] [Green Version]
  52. Sifola, M.I.; Cuocolo, B.; Postiglione, L. Effect of increasing nitrogen fertilization rate on yield and quality of Burley tobacco (Nicotiana tabacum L.) grown under stressed and well-watered conditions. Ital. J. Agron. 1998, 2, 117–125. [Google Scholar]
  53. Tso, T.C. Production, Physiology and Biochemistry of Tobacco Plant; Ideals Inc.: Beltsville, MD, USA, 1990; p. 753. [Google Scholar]
  54. Wang, J.; Yang, H.; Shi, H.; Zhou, J.; Bai, R.; Zhang, M.; Jin, T. Nitrate and nitrite promote formation of tobacco-specific nitrosamines via nitrogen oxides intermediates during postcured storage under warm temperature. J. Chem. 2017, 2017, 1–13. [Google Scholar] [CrossRef] [Green Version]
  55. Li, Y.; Shi, H.; Yang, H.; Zhou, J.; Wang, J.; Bai, R.; Xu, D. Difference between burley tobacco and flue-cured tobacco in nitrate accumulation and chemical regulation of nitrate and TSNA contents. J. Chem. 2017, 2017, 1–13. [Google Scholar]
  56. Shi, H.; Wang, R.; Bush, L.P.; Yang, H.; Fannin, F.F. The relationships between TSNAs and their precursors in burley tobacco from different regions and varieties. J. Food Agric. Environ. 2012, 10, 1048–1052. [Google Scholar]
  57. Garner, W.W.; Bacon, C.W.; Bowling, J.D.; Brown, D.E. The Nitrogen Nutrition of Tobacco; Technical Bul1etin No. 414; U.S. Department of Agriculture: Washington, DC, USA, 1934. [Google Scholar]
  58. Sims, J.L.; Sheen, S.J.; Grunwald, C.; Atkinson, W.O. Effects of nitrogen fertilization and stalk position on certain chemical and physical characteristics of three tobacco genotypes. Can. J. Plant Sci. 1975, 55, 485–490. [Google Scholar] [CrossRef]
  59. CTRI Central Tabacco Research Institute. Available online: https://ctri.icar.gov.in/for_quality.php (accessed on 6 July 2021).
  60. Davis, D.L.; Nielsen, M.T. (Eds.) Tobacco: Production, Chemistry and Technology. In The Quarterly Review of Biology; World Agriculture Series; Blackwell Science: Oxford, MA, USA; Malden, MA, USA, 1999; p. 480. [Google Scholar]
  61. Sims, J.L.; Palmer, G.K.; Wells, K.L. Factors affecting colors of cured Burley leaf. Soil Sci. News Views 1993, 105. Available online: https://uknowledge.uky.edu/cgi/viewcontent.cgi?article=1105&context=pss_views (accessed on 17 August 2021).
  62. Zhang, X.; Davidson, E.A.; Mauzerall, D.L.; Searchinger, T.D.; Dumas, P.; Shen, Y. Managing nitrogen for sustainable development. Nature 2015, 528, 51–59. [Google Scholar] [CrossRef] [PubMed] [Green Version]
Figure 1. Maximum and minimum air temperatures and rainfall on a ten-day basis during the growing seasons at Vitulazio (CE; (A) = I year; (B) = II year), Bellizzi (SA; (C) = I year; (D) = II year), and San Giorgio del Sannio (BN; (E) = I year; (F) = II year).
Agronomy 11 01837 g001
Figure 2. The effect of Years x N fertilization rates on yield of cured leaves (Mg ha−1). Different letters indicate significant differences according to Duncan’s test (p < 0.05).
Agronomy 11 01837 g002
Figure 3. The effect of Years x Locations on yield of cured leaves (Mg ha−1). Different letters indicate significant differences according to Duncan’s test (p < 0.05).
Agronomy 11 01837 g003
Figure 4. The effect of Years, Locations, and N fertilization rates (N0, N50, N90, N130, N170, and N210) on alkaloids content (% d.w.) of cured leaves. Different letters indicate significant differences according to Duncan’s test (p < 0.05); d.w., dry weight.
Agronomy 11 01837 g004
Figure 5. Exponential regression of NUE of tobacco crop vs. N fertilization rates in the two experimental years. For the explanation of the index, see Materials and Methods section.
Agronomy 11 01837 g005
Figure 6. Linear regression of N-utilization efficiency vs. N fertilization rates in the three experimental locations. For the explanation of the index, see Materials and Methods section.
Agronomy 11 01837 g006
Table 1. Physical and chemical characteristics of soils at experimental fields (Vitulazio, CE; Bellizzi, SA; San Giorgio del Sannio, BN).
Texture CESABN
I YearII YearI YearII YearI YearII Year
_Sand%52.842.845.845.855.554.8
_Silt%22.730.822.223.421.522.8
_Clay%24.526.432.030.823.022.4
Texture SCLSCLSCLSCLSCLSCL
Total Ng kg−10.860.820.890.871.261.16
P2O5mg kg−119.918.537.835.957.655.8
K2Omg kg−1220.7250.3350.8320.8235.7233.4
Organic matterg kg−110.09.413.011.417.015.0
NO3-Nmg kg−111.511.72.02.01.00.7
NH4-Nmg kg−13.52.720.514.716.513.0
pH 7.207.227.307.276.806.93
Electrical conductivitydS m−10.1390.1420.1360.1370.1700.115
N Total (Kjeldahl method); P2O5 (Olsen method); K2O (Tetraphenylborate method); Organic matter (Bichromate method); SCL = sandy clay loam.
Table 2. Analysis of variance results of yield and cured leaves quality traits. For the explanation of the index, see Materials and Methods section.
SignificanceYieldAlkaloidsNitratesN TotFHCL*a*/b*ScoreNUENUpNUt
Years (Y)0.010.010.010.01-0.010.010.010.010.010.01
Location (L)0.010.010.010.010.050.010.010.010.010.010.01
Fertilization (F)0.010.010.010.010.010.010.010.010.010.010.01
Y x L0.01-0.010.050.050.010.010.050.010.050.05
Y x F0.01-------0.01--
L x F--0.050.050.010.01-0.010.01--0.05
Y x L x F-----------
N tot = total nitrogen; FHC = fire holding capacity; NUE = nitrogen-use efficiency; NUp = nitrogen-uptake efficiency; NUt = nitrogen-utilization efficiency; L* = brightness, a* = green/red; b* = blue/yellow; Score = expert evaluation of commercial quality (see Section 2.3 for more detail).
Table 3. The effect of Locations x N fertilization rates and Years x Locations on nitrates, total N and fire holding capacity of cured leaves; d.w., dry weight; s, seconds.
TreatmentsNitratesN TotalFire Holding Capacity
mg kg−1 d.w.% d.w.s
CEN05957 gl3.17 ce5.1 h
N507138 fh3.45 bd6.3 fg
N9012,388 de3.60 ac7.4 e
N13017,782 ac3.76 ab11.0 b
N17018,909 ab3.71 ab12.8 a
N21019,268 a3.94 a9.6 c
SAN01257 l2.37 g3.5 i
N501931 il2.84 ef4.0 i
N904223 hl2.88 ef5.4 gh
N1306134 gl3.13 de7.1 ef
N1707987 eh3.71 ab8.1 de
N21012,770 ce3.70 ab5.6 gh
BNN04095 hl2.58 fg5.9 gh
N506908 fi3.16 de7.5 de
N9010,214 dg3.33 bd8.5 d
N13011,983 df3.44 bd11.4 b
N17012,556 de3.48 bd13.6 a
N21013,995 bd3.68 ab9.6 c
I yearCE14,449 a3.23 c8.6 c
SA5282 b2.71 d5.9 d
BN4719 b3.04 c9.3 ab
II yearCE12,698 a3.97 a8.8 bc
SA6152 b3.50 b5.3 d
BN15,198 a3.51 b9.6 a
Different letters within each column indicate significant differences according to Duncan’s multiple range test p < 0.05.
Table 4. The effect of Locations x N fertilization rates and Years x Locations on L*, a*/b*, and scores (by expert evaluators) of cured leaves. For the explanation of the index, see Materials and Methods section.
TreatmentsL*a*/b*Score
CEN050.7 bc0.21 i3.9 i
N5049.5 cd0.30 fg4.7 fh
N9047.8 ef0.31 f5.1 e
N13045.4 gf0.39 de6.2 b
N17044.2 hi0.41 cd7.1 a
N21042.3 lm0.47 b5.1 e
SAN053.9 a0.17 l3.0 l
N5051.3 b0.23 hi3.9 i
N9050.1 bd0.28 g4.5 gh
N13048.6 de0.31 f5.0 ef
N17046.2 g0.36 e5.6 d
N21043.7 il0.48 b4.4 h
BNN051.1 b0.25 h3.8 i
N5046.4 fg0.30 fg4.6 gh
N9046.2 g0.32 f4.9 eg
N13045.1 g0.41 cd5.7 cd
N17043.2 il0.42 c6.4 b
N21041.3 m0.51 a4.6 fh
I yearCE47.4 b0.36 b5.6 a
SA49.1 a0.33 c4.5 d
BN45.6 c0.37 a5.2 b
II yearCE45.9 c0.34 c5.1 b
SA48.8 a0.29 d4.3 d
BN45.5 c0.36 ab4.8 c
Different letters within each column indicate significant differences according to Duncan’s multiple range test p < 0.05. L* = brightness, a* = green/red; b* = blue/yellow; Score = expert evaluation of commercial quality (see Section 2.3 for more detail).
Table 5. The effect of Years x Locations on NUE, N-Uptake, and N-Utilization Efficiency. For the explanation of the index, see Materials and Methods section.
TreatmentsNUEN-Uptake EfficiencyN-Utilization Efficiency
mg kg−1kg kg−1mg kg−1
I yearCE0.045 a1.01 a0.044 b
SA0.041 b0.73 bc0.052 a
BN0.042 ab0.78 b0.052 a
II yearCE0.031 d0.83 b0.035 c
SA0.031 d0.62 c0.046 ab
BN0.035 c0.76 bc0.043 b
Different letters within each column indicate significant differences according to Duncan’s multiple range test p < 0.05.
Publisher’s Note: MDPI stays neutral with regard to jurisdictional claims in published maps and institutional affiliations.

