
How Mineral Fertilization and Soil-Climate Conditions Affect Spring Barley Grain Yield and Soil Chemical Properties


Crop Research Institute, Division of Crop Management Systems, Drnovská 507/73, 161 06 Prague, Czech Republic
*
Author to whom correspondence should be addressed.
Agronomy 2021, 11(9), 1843; https://doi.org/10.3390/agronomy11091843
Submission received: 26 July 2021
/
Revised: 1 September 2021
/
Accepted: 9 September 2021
/
Published: 14 September 2021
(This article belongs to the Section Soil and Plant Nutrition)
Abstract
:Barley is one of the most important cereals growing in the Czech Republic. In this paper, we have evaluated how different fertilizer treatments (Control, N1—30 kg ha−1 N, N2—60 kg ha−1 N, NPK1—30, 60, 80 kg ha−1, respectively, NPK2—60, 60, 80, and NPK3—90, 60, 80) affected spring barley grain yield under different soil-climate conditions (Caslav-degraded Chernozem, Ivanovice-Chernozem, Lukavec-Cambisol) between the years 2013 and 2016. The agronomic efficiency (AE) and the effect of the fertilizer treatments (Control, N2, NPK2) on soil properties (pH, P, K, Ca, Mg, Cox, Nt) were also evaluated. The spring barley grain yield was significantly affected by the fertilizer treatment and soil-climate conditions. Two different models (quadratic and linear-plateau) provided the maximum and reasonable doses of N, according to the soil-climate conditions. Application of mineral P and K slightly increased the AE. The regular application of mineral P and K fertilizers led to an increase in the P and K concentration in the soil, which maintains soil fertility and prevents soil depletion.
1. Introduction
Barley is one of the most important arable crops growing in the Czech Republic. Following the winter wheat and winter rapeseed, barley is the third most cultivated crop in the Czech Republic, covering approximately 332 thousand ha of arable land with a total grain production of 1.8 million tons in 2020. The average grain yield was approximately 5.3 t ha−1 between the years 2015 and 2019 [1]. Both winter and spring forms of barley are grown mainly for livestock feedstuff production and approximately 30% of the spring barley is used for malt production in the Czech Republic.
A demanded grain yield can be achieved by choosing a suitable barley cultivar [2,3,4], preceding crop [5,6], soil preparation technique [7,8] and proper fertilization [4,9,10,11,12]. The soil-climate conditions of the locality where the barley grows represent another factor significantly affecting barley grain yield and quality [4,12,13,14].
Out of all macronutrients, nitrogen (N) represents the most important nutrient directly influencing the yielding potential and quality of most of the arable crops, including barley. An insufficient amount of mineral N results in lower yields. On the other hand, an excessive amount of the N can negatively affect the grain yield (lodging) and in the case of barley grown for the brewing industry (malting purposes) even quality, because barley continues to utilize N even when yield requirements are met [4,15,16], increasing its protein content. The excessive amounts of applied N are also connected with financial losses of the farmers and negative impacts on soil, water and groundwater due to the N leaching and emissions [17,18,19]. Barley is considered a plant requiring lower nutrients input than wheat. Generally, the recommended doses of N range from approximately 30 to 60 kg ha−1 N in the Czech Republic, depending on the soil-climate conditions, preceding crop and purpose (feed or malting grain). Other sources state doses of N ranging from 30 kg ha−1 N [10] and 50 kg ha−1 [20] to 40–80 kg ha−1 N [16] and 50–100 kg ha−1 N [8], depending on the previously mentioned factors. Low or no fertilization should be applied to barley following the legumes or crops fertilized with organic manures (malting purposes), while higher doses can be applied for barley grown for feedstuff purposes. This kind of production is not limited by protein concentration and other requirements.
The application of mineral fertilizers and organic manures, together with tillage practices and crop rotations [21,22], does not only affect the yield and quality of arable crops. As a consequence of fertilization, soil properties are also modified, including fields and meadows [23]. Application of all types of fertilizers significantly modify a wide range of soil properties, such as the soil organic carbon (SOC) content [24,25], soil microbial community [26,27,28] and enzyme activity [25], the value of the pH [29,30,31] and consequently the availability of essential and non-essential metals [32] and availability of macronutrients [25,33]. In general, the SOC content increases when organic manures are applied alone or in combination with mineral fertilizers to the field [31,34]. Mineral N fertilizers can also, but do not have to [35], increase the SOC, but the effect is smaller in comparison with organic manures [24,31,36]. The value of the pH generally decreases when mineral fertilizers (ammonium-based fertilizers) are applied without organic amendments [29,30,31,37]. This is due to N transformation processes in the soil. The rate of acidification depends on the soil type. For example, Chernozems have a high buffering capacity against acidification, while other soil types (Cambisols, Luvisols) are more prone to the effects of N fertilizers [30]. Application of mineral N without other amendments can not only decrease the soil pH but also lead to the deficiency of other macronutrients [37]. We present these causes and consequences because the current conventional agriculture in the Czech Republic is characterized by low inputs of organic manures (and thus organic matter) and mineral forms of P and K into the soil and dependence on mineral N.
In this paper, we have evaluated how six fertilizer treatments (Control, N1, N2, NPK1, NPK2, NPK3) affected spring barley grain yield under three different soil-climate conditions between the years 2013 and 2016. The AE (kg kg−1) of all fertilizer treatments is included. The effect of three fertilizer treatments (Control, N2, NPK2) on soil properties (pH, P, K, Ca, Mg, Cox, Nt) was also evaluated.
2. Materials and Methods
2.1. The Trial Description
The field trials were established in three localities with different soil-climate conditions in 1955. The basic description of the localities is given in Table 1. A detailed description of the weather conditions in the individual years is given in Tables S1 and S2 (see Section 3.1).
The methodology of all three trials is identical. Each trial consists of a total of four fields (four fields at each site, marked as Field I., Field II., Field III., Field IV.). For a better understanding of the trial layout, see Table 2.
Each field is divided into 48 plots. A total of 12 different fertilization treatments are applied on these 48 plots in a completely randomized block design, each treatment being repeated four times (12 × 4 = 48). The size of the individual plot is 8 × 8 m. To eliminate the edge effect, the 5 × 5 m central area is used for yield determination and soil analyses. Six out of twelve fertilizer treatments are evaluated in this paper. To determine the effect of fertilizers on spring barley yields, we evaluated the following treatments: Control (unfertilized since the trial establishment in 1955), N1 (mineral N, 30 kg ha−1), N2 (mineral N, 60 kg ha−1), NPK1 (mineral N, P and K applied in doses of 30, 60 and 80 kg ha−1, respectively), NPK2 (60, 60, 80 kg ha−1, respectively), and NPK3 (90, 60, 80 kg ha−1, respectively). All doses represent the dose of pure nutrients. To determine the effect of fertilizers on soil properties, we evaluated three treatments: Control, N2 and NPK2 (the analyses of the soil treated with N1, NPK1 and NPK3 treatments were not performed between the years 2013 and 2016). The N was applied as calcium ammonium nitrate (27% N), P as triple superphosphate (19.4% P) and K as potassium chloride (49.8% K). Mineral N was applied during the pre-sowing preparation in the spring (N1, NPK1—30 kg ha−1; N2, NPK2—60 kg ha−1; NPK3—60 kg ha−1). The remaining 30 kg of N in the NPK3 treatment was applied at the BBCH 30–31. Mineral P and K fertilizers were applied in the autumn. All mineral fertilizers were spread on the plots by hand. The preceding crop was always the silage maize (cultivar LG 32.58), fertilized with the cattle farmyard manure (40 t ha−1; approximately 200, 56 and 236 kg of N, P and K ha−1). In the Control, the preceding maize was not fertilized with the farmyard manure. The spring barley cultivar used in this experiment was Bolan. The seeding rate was 3.5–4.5 million germinating seeds.
2.2. Soil Analyses
The soil samples were taken from the Ap horizon (0–30 cm) by the soil sampler when the barley was harvested. Four soil samples were taken from each plot (together 16 samples from each fertilizer treatment). The concentration of nutrients was analyzed in air-dried soil samples, sieved at <2 mm. The value of the soil reaction (pH) was determined potentiometrically in 50 mL of 0.2 mol KCl (inoLab pH 730, WTW, Xylem Analytics, Weilheim, Germany). The SOC was determined colorimetrically and by oxidimetric titration according to [39,40]. The soil N content was determined with concentrated sulfuric acid in a heating block (Tecator, Foss A/S, Hillerød, Denmark), followed by the Kjeldahl method [41]. The concentrations of plant available P, K, Mg and Ca (mg kg−1) were analyzed using the Mehlich III method [42], followed by the ICP-OES analysis (Thermo Scientific ICAP 7400 Duo, ThermoFisher Scientific, Cambridge, UK).
2.3. Data Analysis
The quadratic model, ANOVA (analysis of variance), MANOVA (multivariate analysis of variance), the PCA (principal component analysis) and FA (factor analysis) were performed using the Statistica 13.3 (Tibco Software Inc., Palo Alto, CA, USA). The significant ANOVA (MANOVA) results were followed by Tukey’s HSD post hoc test. The agronomic efficiency (AE) was calculated as:
where GYT is grain yield recorded in the fertilizer treatment, GYC is grain yield recorded in the Control and N represents the dose of applied N. The linear-plateau model was calculated using the R software (R: A language and environment for statistical computing. R Foundation for Statistical Computing, Vienna, Austria, 2020), using three R packages [43,44,45].
AE = (GYT − GYC)/N,
3. Results
3.1. Weather Conditions
Detailed information about the weather is shown in Tables S1 and S2. The evaluation of the precipitation and temperature in Tables S1 and S2 was done according to [38].
A higher amount of precipitation in May and June 2013, together with very cold conditions in March 2013, reduced the yields in Caslav, resulting in the lowest mean yields out of all individual years (5.2 t ha−1, Table 3). On the contrary, dry conditions with a relatively normal course of temperatures in 2015 were beneficial for barley in Caslav, which resulted in the highest mean yields (7.2 t ha−1).
Grain yields in the monitored period in Ivanovice were relatively stable and with low fluctuation between the years, ranging from 7.1 (2016) to 7.4 (2013, 2015) t ha−1 (Table 3). According to the MANOVA results (see Section 3.2.2, first three lines); the effect of the weather on grain yields was minimal as the grain yields were mainly affected by the fertilizer treatment. The highest yield fluctuation was recorded in 2015. We assume that weather conditions were unusually beneficial this year and the grain yield was actually limited by the dose of nutrients applied.
Unfavorable development of precipitation in 2013, when dry conditions in March and April occurred and were followed by heavy precipitation in May and June, significantly reduced yields in Lukavec (4.3 t ha−1, Table 3). A warmer March, with relatively normal precipitation in March and April, developed good conditions, resulting in 1.1 t ha−1 higher yields one year later, when the mean grain yield was 5.4 t ha−1.
3.2. The Effect of the Year and Fertilization on Grain Yield
The spring barley grain yield was significantly affected by the locality (d.f. = 2, F = 192, p < 0.001) and fertilizer treatment (d.f. = 5, F = 98, p < 0.001). The interaction between locality and fertilizer treatment was significant (d.f. = 10, F = 4, p < 0.001). The lowest mean grain yields (across all years and fertilizer treatments) were recorded in Lukavec (4.9 t ha−1), followed by Caslav (6.0 t ha−1) and Ivanovice (7.3 t ha−1). The differences were statistically significant.
3.2.1. Caslav
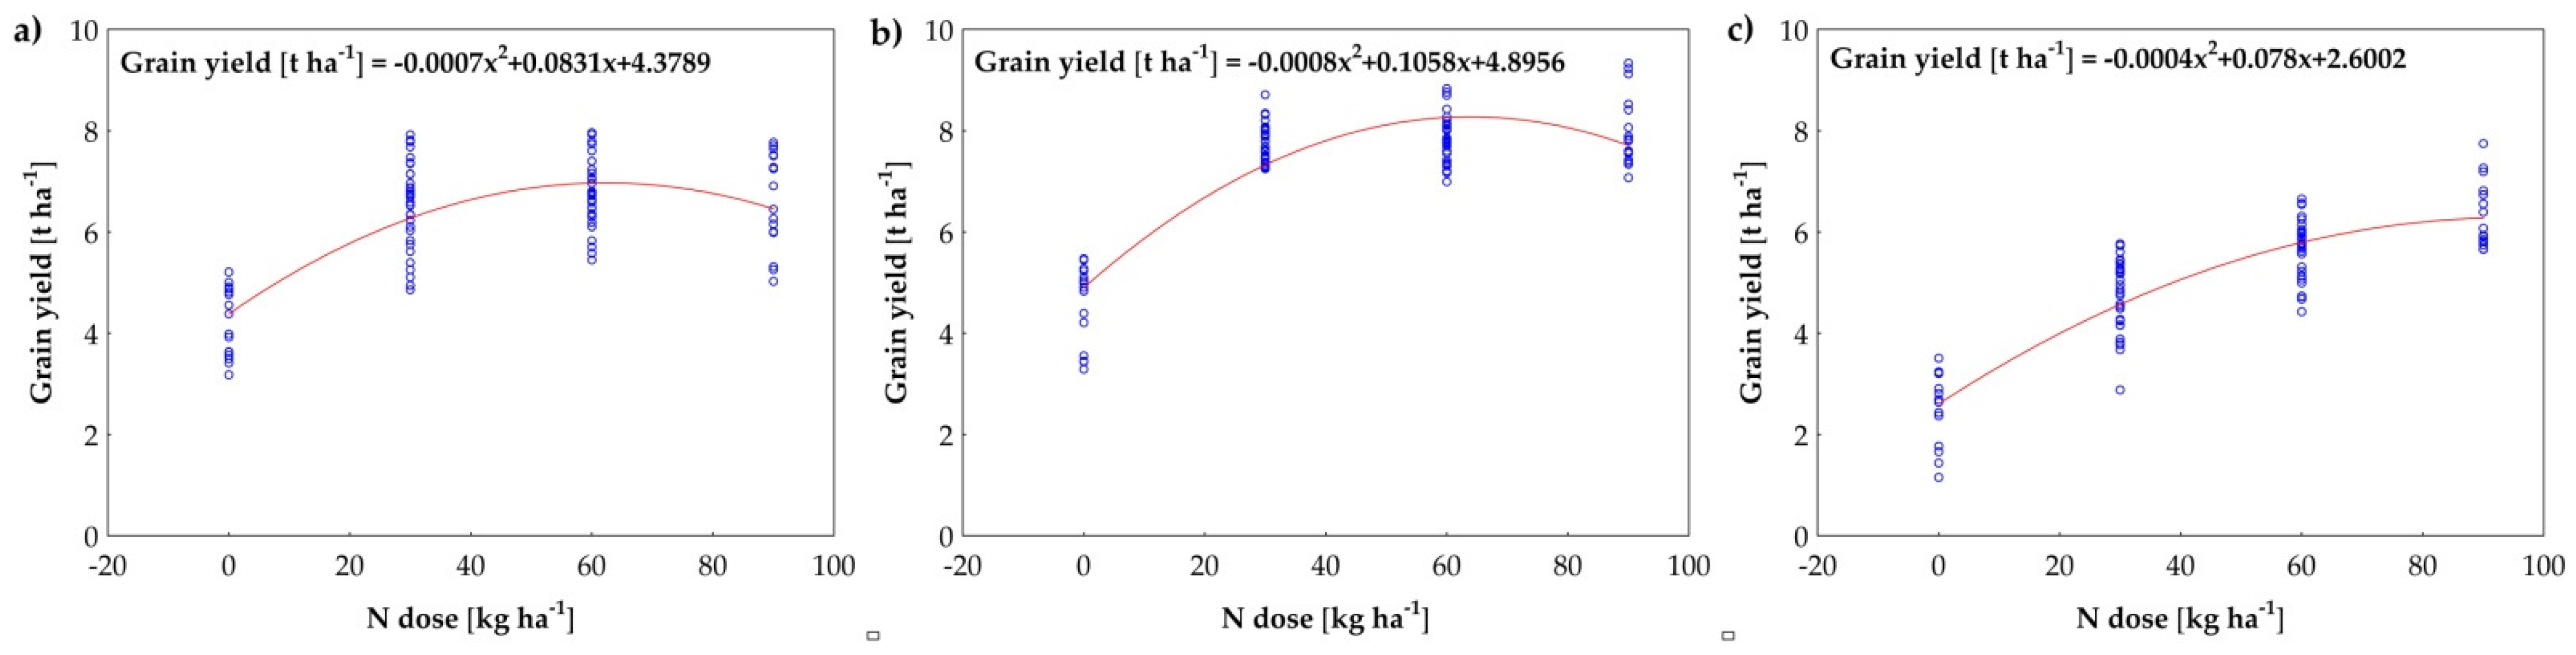
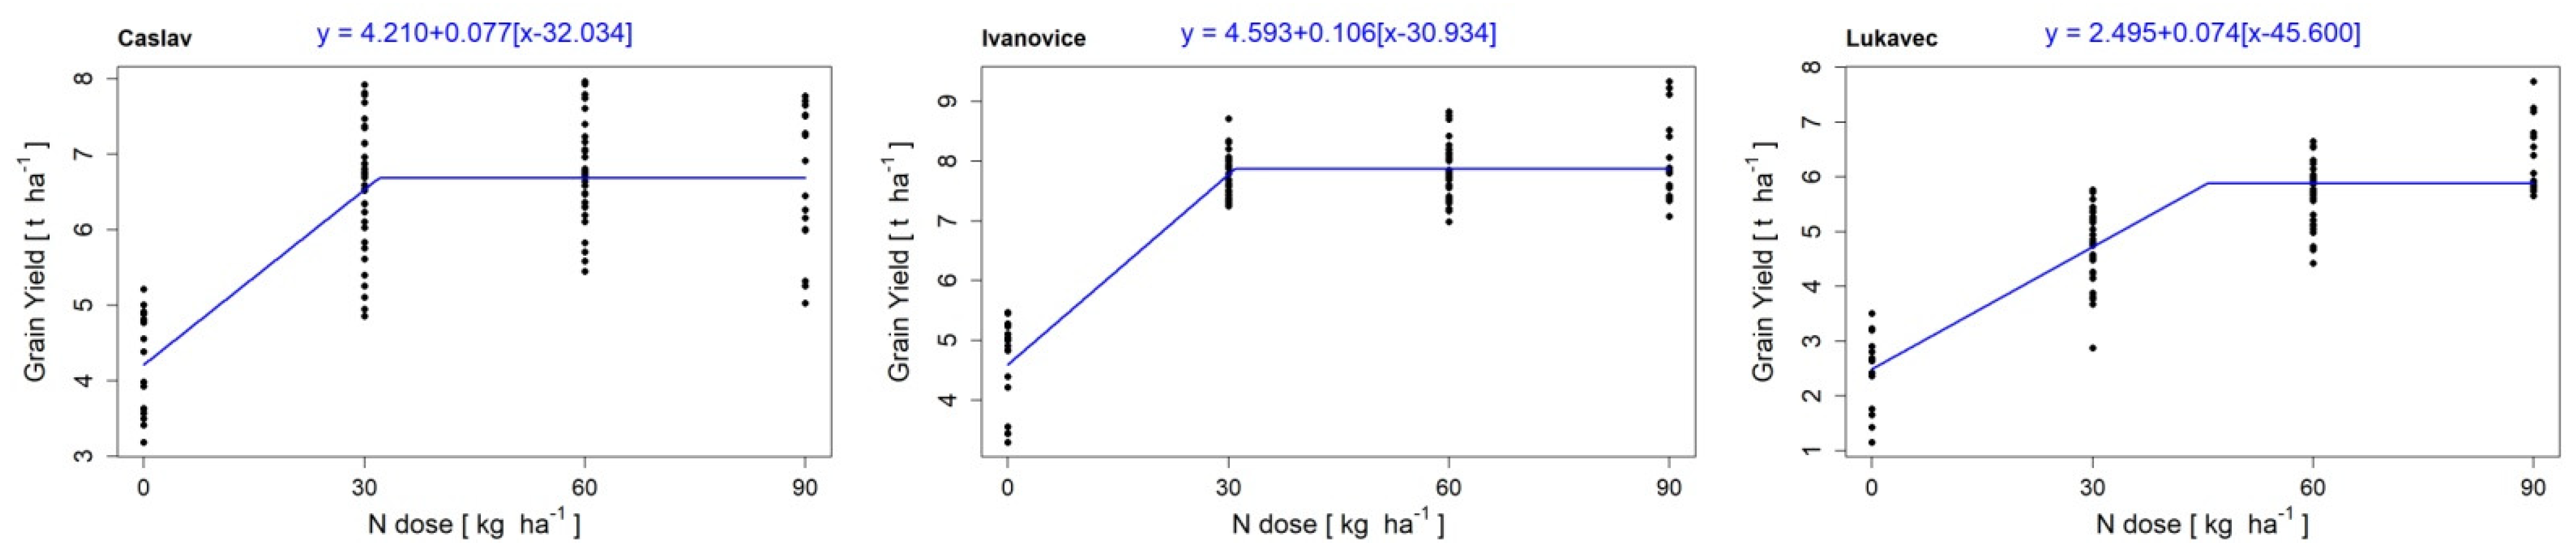
The results of all fertilizer treatments (in all localities) are shown in Table 3. In Caslav, the spring barley grain yield was significantly affected by the year (d.f. = 3, F = 269, p < 0.001) and the fertilizer treatment (d.f. = 5, F = 270, p < 0.001). The interaction between the factors year and fertilizer treatment was significant (d.f. = 15, F = 5, p < 0.001), which means that factors have to be analyzed separately. Both factors have affected grain yields equally (by 49%). The lowest mean grain yield was harvested in 2013 (5.2 t ha−1), while the highest was in 2015 (7.2 t ha−1). Comparing the fertilizer treatments, the lowest yields were provided by the Control (4.2 t ha−1), while the highest yields were recorded in the NPK2 treatment (6.9 t ha−1). The response of barley was typical for cereals in Caslav. With an increasing dose of N the grain yield initially increased, then decreased after approaching the maximum. After reaching this maximum, increased fertilizer did not result in a significant increase in yield. According to the quadratic model, the maximum mean yield was reached at the dose of 59 kg ha−1 N, corresponding with the yield of 6.8 t ha−1 (Figure 1a). Application of a lower N dose (N1 treatment—30 kg ha−1 N) resulted in a lower mean yield (6.4 t ha−1), so the difference between N1 and maximum mean yield is 400 kg ha−1. This means that a reduction in the N dose is possible and this reduction will not be associated with such a significant decrease in yield. This is supported by the results of the linear-plateau model. According to the linear-plateau model, the shoulder point occurs in the dose of 32 kg ha−1 N, corresponding with the mean yield of 6.7 t ha−1 (Figure 2). Application of lower N dose is also recommendable according to the AE (kg kg−1) results. The highest efficiency was recorded in the N1 (72 kg per 1 kg N) and NPK1 (83 kg per 1 kg N) treatments, while in the N2, NPK2 and NPK3 treatments it was 39, 45 and 27 kg per 1 kg N, respectively (Table 4). The difference in yields and the AE between the N1 and NPK1 treatments (and similarly between N2 and NPK2 treatments) is attributed to the application of PK fertilizers, so the application of PK slightly increased the yields. However, separately calculated ANOVA (d.f. = 2, F = 64, p < 0.01), comparing three groups of fertilizer treatments (Control, N and NPK), did not reveal significant differences between N (6.4 t ha−1) and NPK (6.7 t ha−1) treatments.
3.2.2. Ivanovice
In Ivanovice, the spring barley grain yield was significantly affected by the year (d.f. = 3, F = 4, p < 0.01) and the fertilizer treatment (d.f. = 5, F = 263, p < 0.001). The interaction between the factors year and fertilizer treatment was significant (d.f. = 15, F = 10, p < 0.01). In comparison with Caslav, the grain yields were mainly affected by the fertilizer treatment in Ivanovice (by 95%), showing stable weather conditions between the years 2013 and 2016. The lowest mean grain yield was recorded in 2016 (7.1 t ha−1), while the highest yields were harvested in 2013 and 2015 (7.4 t ha−1, Table 3). A more detailed analysis of grain yields in Ivanovice revealed an interesting fact. Namely, no differences between the fertilizer treatments (except the Control) were recorded in 2013, 2014 and 2016 and the response of barley to the increasing dose of N was typical in those years, which means that yields initially increased with increasing dose of N and decreased when the maximal mean yield was reached. According to the quadratic model, evaluating the whole period, this maximum occurred with 66 kg ha−1 N, corresponding with the yield of 8.4 t ha−1 (Figure 1b). A different situation was recorded in 2015 when yields increased with the increasing dose of applied nutrients. We assume that the weather conditions were actually unusually beneficial this year, providing higher yields and the barley potential was limited by the insufficient amount of applied nutrients. According to the linear-plateau model, the shoulder point occurs in the dose of 31 kg ha−1 N, corresponding with the mean yield of 7.9 t ha−1 (Figure 2). The highest AE offered N1 (102 kg per 1 kg N) and NPK1 (113 kg per 1 kg N) treatments. The application of the PK fertilizers slightly increased grain yields and fertilizer efficiency (Table 3 and Table 4), but the yield differences between the N1 and NPK1 treatments (and similarly between N2 and NPK2 treatments) were not statistically different in each individual year (Table 3). Only if we evaluate the whole period (2013–2016), we can observe significant differences between N1 and NPK1, which was significantly affected by the conditions and results of 2015. The AE of the N2 and NPK2 treatments ranged from 52 to 56 kg per 1 kg N, respectively. The lowest AE offered the NPK3 treatment, 38 kg per 1 kg N (Table 4). Separately calculated ANOVA, comparing three groups of fertilizers (Control, N and NPK) revealed a significant difference (d.f. = 2, F = 258, p < 0.01) between the N (7.6 t ha−1) and NPK (8.0 t ha−1) treatments. This was caused by the conditions of the year 2015 and it means that during the seasons with highly beneficial weather conditions the application of PK increases the yielding potential of barley in this area.
3.2.3. Lukavec
In Lukavec, the grain yield of spring barley was significantly affected by the factors year (d.f. = 3, F = 30, p < 0.001) and fertilizer treatment (d.f. = 5, F = 170, p < 0.001). The interaction between the two factors was significant (d.f. = 15, F = 3, p < 0.01). The factor year affected the grain yield by 15% and the fertilizer treatment factor by 84%. The lowest mean grain yield was recorded in 2013 (4.3 t ha−1), while the highest was in 2014 (5.4 t ha−1). Comparing the fertilizer treatments, the lowest mean yields were provided by the Control (2.5 t ha−1), while the highest by NPK 2 (6.0 t ha−1) and NPK3 treatments (6.4 t ha−1). The difference between the NPK2 and NPK3 treatments was not significant (Table 3). The response of the barley to the increasing dose of N was not the same as in the Caslav and Ivanovice (Figure 1c). The maximum mean yield was estimated by the approximation of the quadratic model (6.4 t ha−1, corresponding with the dose of 98 kg ha−1 N, see Figure 1c). It means that barley grain yield potential is slightly limited by the soil nutrient content and, in other words, by the experimental design in Lukavec (the maximum mean yield would be reached with a higher dose of mineral N). According to the linear-plateau model, 46 kg ha−1 N (the shoulder point, see Figure 2) corresponds with the yield of 5.9 t ha−1. Approximately a 50% reduction in fertilizers would correspond to a reduction in yields of 500 kg ha−1, from 6.4 to 5.9 t ha−1. The AE was highest in the N1 and NPK1 treatments (75 and 76 kg per 1 kg N, respectively), followed by the NPK2 (58 kg per 1 kg N), N2 (48 kg per 1 kg N) and NPK3 (43 kg per 1 kg N) treatments (Table 4). Separately calculated ANOVA, comparing three groups of fertilizer treatments (Control, N and NPK) showed a significant (d.f. = 2, F = 91, p < 0.01) differences between the N (5.0 t ha−1) and NPK (5.7 t ha−1) treatments. It means that the application of PK fertilizers plays a significant role in Lukavec.
3.3. The Effect of the Fertilizer Treatments on Soil Properties
When compared with the Control and N treatments, regular application of mineral P and K fertilizers (NPK treatments) resulted in significantly higher P and K concentrations in the soil in all localities (Table 5). No significant differences between the Control and N treatments were recorded in the case of P soil content. In the case of K, application of the mineral N resulted in slightly higher concentrations when compared with the Control, yet the differences were insignificant. The N treatment thus forms a kind of transition step between the unfertilized Control and the NPK treatment. The concentrations of Mg and Ca in the soil were comparable and not affected by the fertilizer treatment in all localities (Table 5).
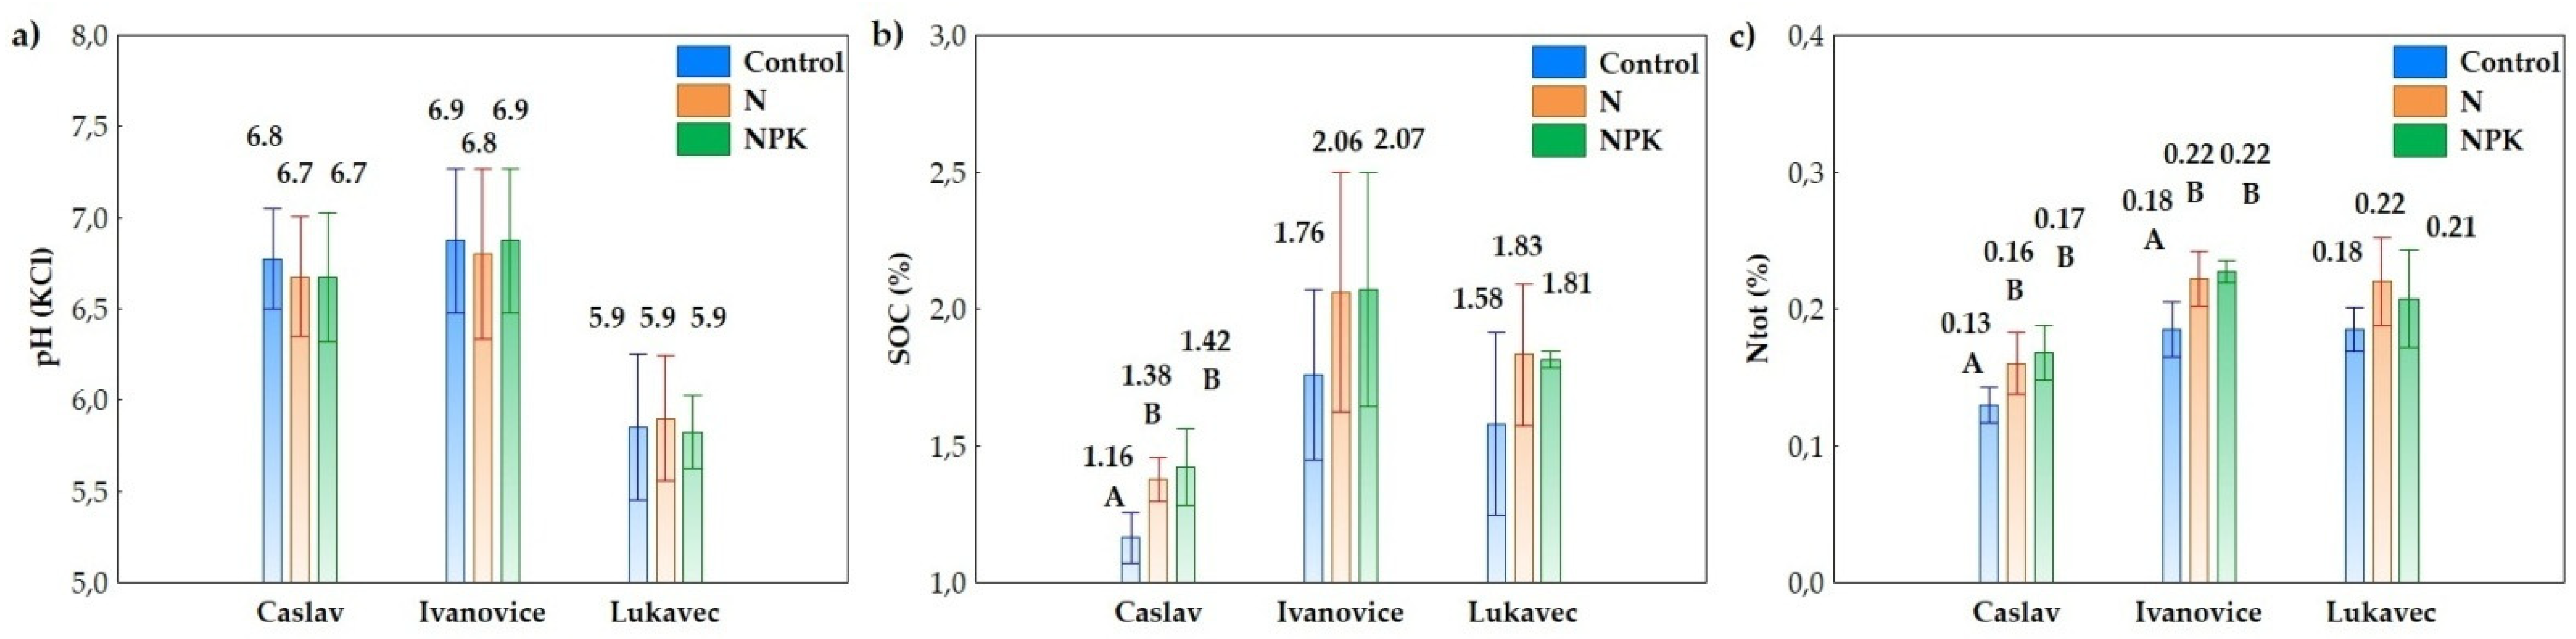
The value of the pH (KCl) ranged from 6.7 to 6.8 in Caslav and from 6.8 to 6.9 in Ivanovice. In Lukavec, the pH of the soil was the same in all three treatments—5.9. No significant differences between the fertilizer treatments were recorded in all localities (Figure 3a). The lowest SOC content was recorded in Caslav (degraded Chernozem), ranging from 1.16% (Control) to 1.42% (NPK). The mean SOC of the N treatment was 1.38% and both treatments provided a statistically significantly higher value in comparison with the Control (Figure 3b). The highest mean SOC was recorded in Ivanovice, ranging from 1.76% (Control) to 2.07% (NPK). No statistically significant differences were recorded here (d.f. = 3, F = 2.05, p = 0.185). In Lukavec, the SOC varied from 1.58% (Control) to 1.83% (N). As in Ivanovice, we did not record any significant differences (d.f. = 3, F = 3.4, p = 0.079) between the individual fertilization treatments (Figure 3b). The content of N was significantly affected by the fertilizer treatment in Caslav, ranging from 0.13% (Control) to 0.17% (NPK). The difference between N and NPK treatments was not significant. In Ivanovice, the N and NPK treatments recorded the same N content in the soil (0.22%), which was significantly higher when compared with the Control (0.18%). In Lukavec, the N content in the soil varied from 0.18% (Control) to 0.22% (N), without significant differences between the treatments (Figure 3c).
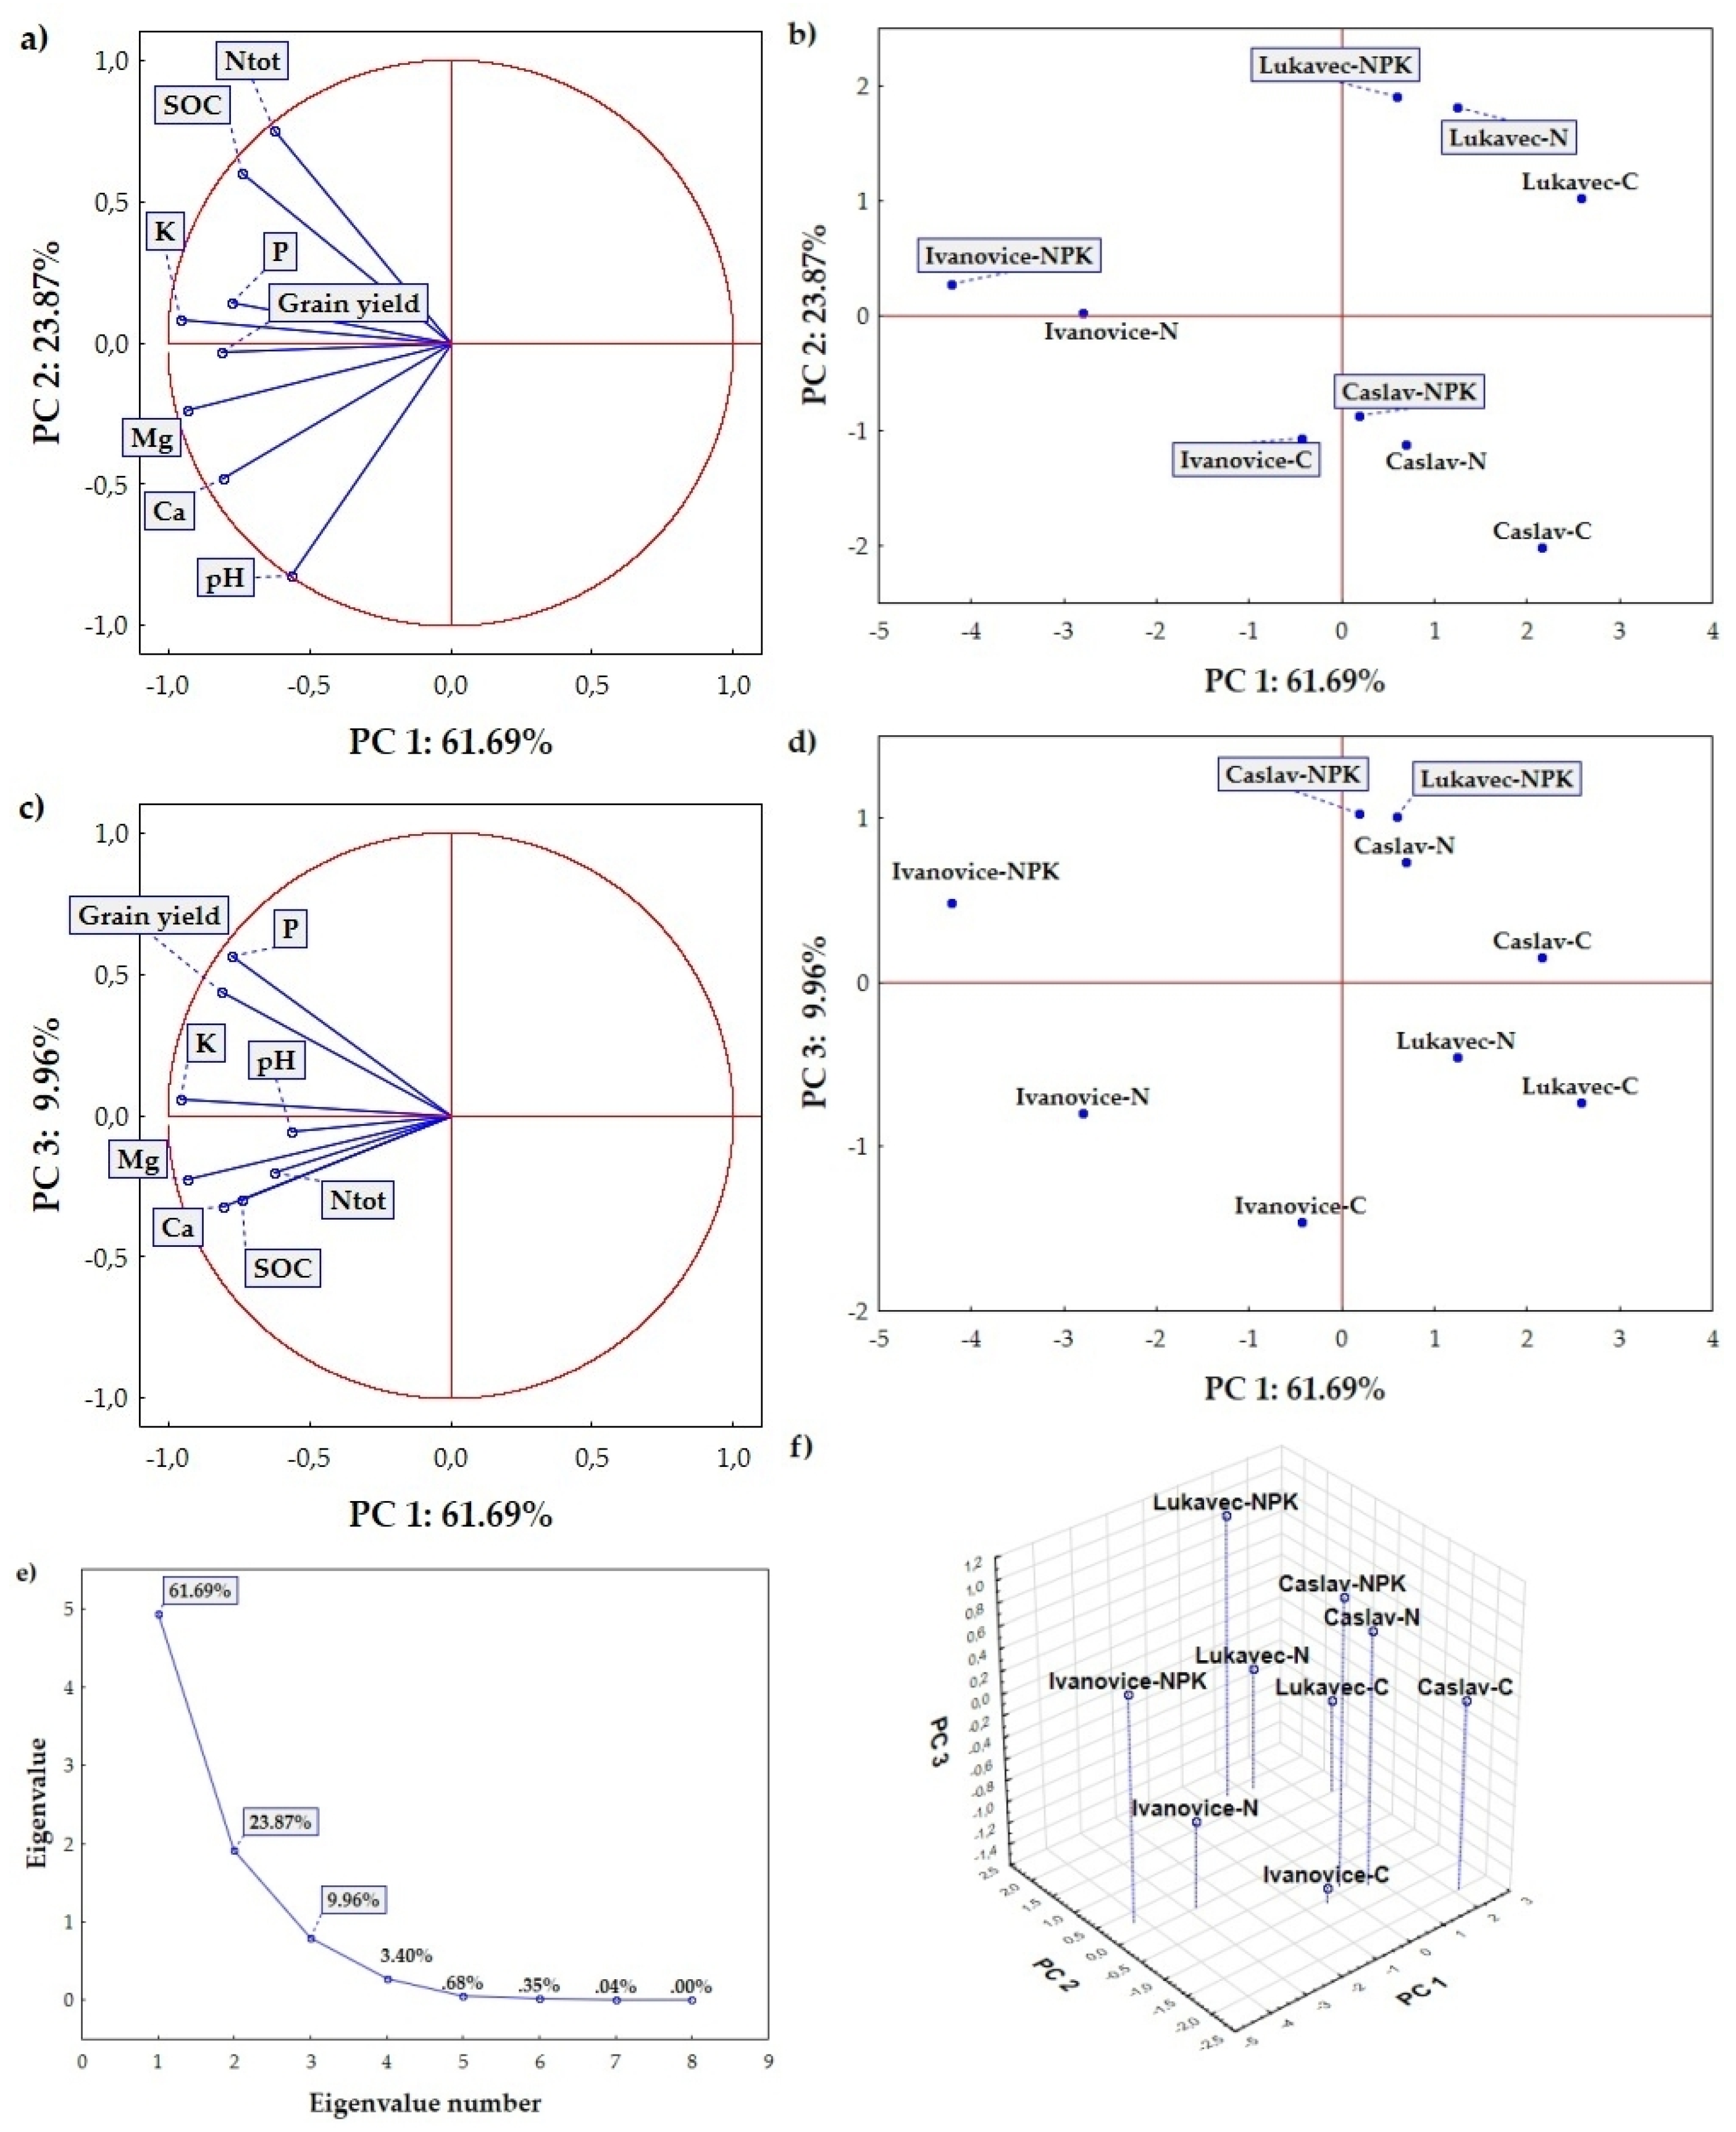
According to the PCA, on the graph of component weights PC1, PC2, PC3 (Figure 4a–c), the first two axes are significant. Together the axes exhaust about 85% of the variability (Figure 4e). The PC1 axis in the PC1 x PC2 figure unambiguously characterizes the content of K and Mg, as they go directly along this axis and are correlated with it at a level exceeding −0.9 (high correlation) and Grain yield and Ca content (r = −0.81 and −0.80). Furthermore, there is still a significant correlation with P and Cox on the PC1 axis (r = −0.74–0.77). On the PC2 axis, there is a significant correlation with pH (r = −0.82) and further with Ntot (r = 0.74). There is no significant correlation on the PC3 axis.
In the scattering diagram of the component score (Figure 4b), localities (Caslav, Lukavec and Ivanovice) and fertilization treatments (Control, N, NPK) are clearly located along the PC1 axis. The highest content of K, Mg and Ca is in the locality Ivanonice (Chernozem). The localities Lukavec (Cambisols) and Čáslav (degraded Chernozem) are very similar in their content of K, Mg and Ca; therefore, they are at the same level within the PC1 axis. A similar situation can be found in the case of grain yield—comparable yields can be found in Ivanovice and Caslav. In Lukavec, lower yields were recorded in the Control, but high yields were recorded in N and NPK treatments, which were similar toCaslav. However, the differentiation within the PC2 axis is significant. The locality Lukavec is significantly differentiated (Figure 4b) from the other two localities (Ivanovice and Caslav). This is caused by significantly lower pH and higher SOC content and Ntot in Lukavec when compared to Caslav.
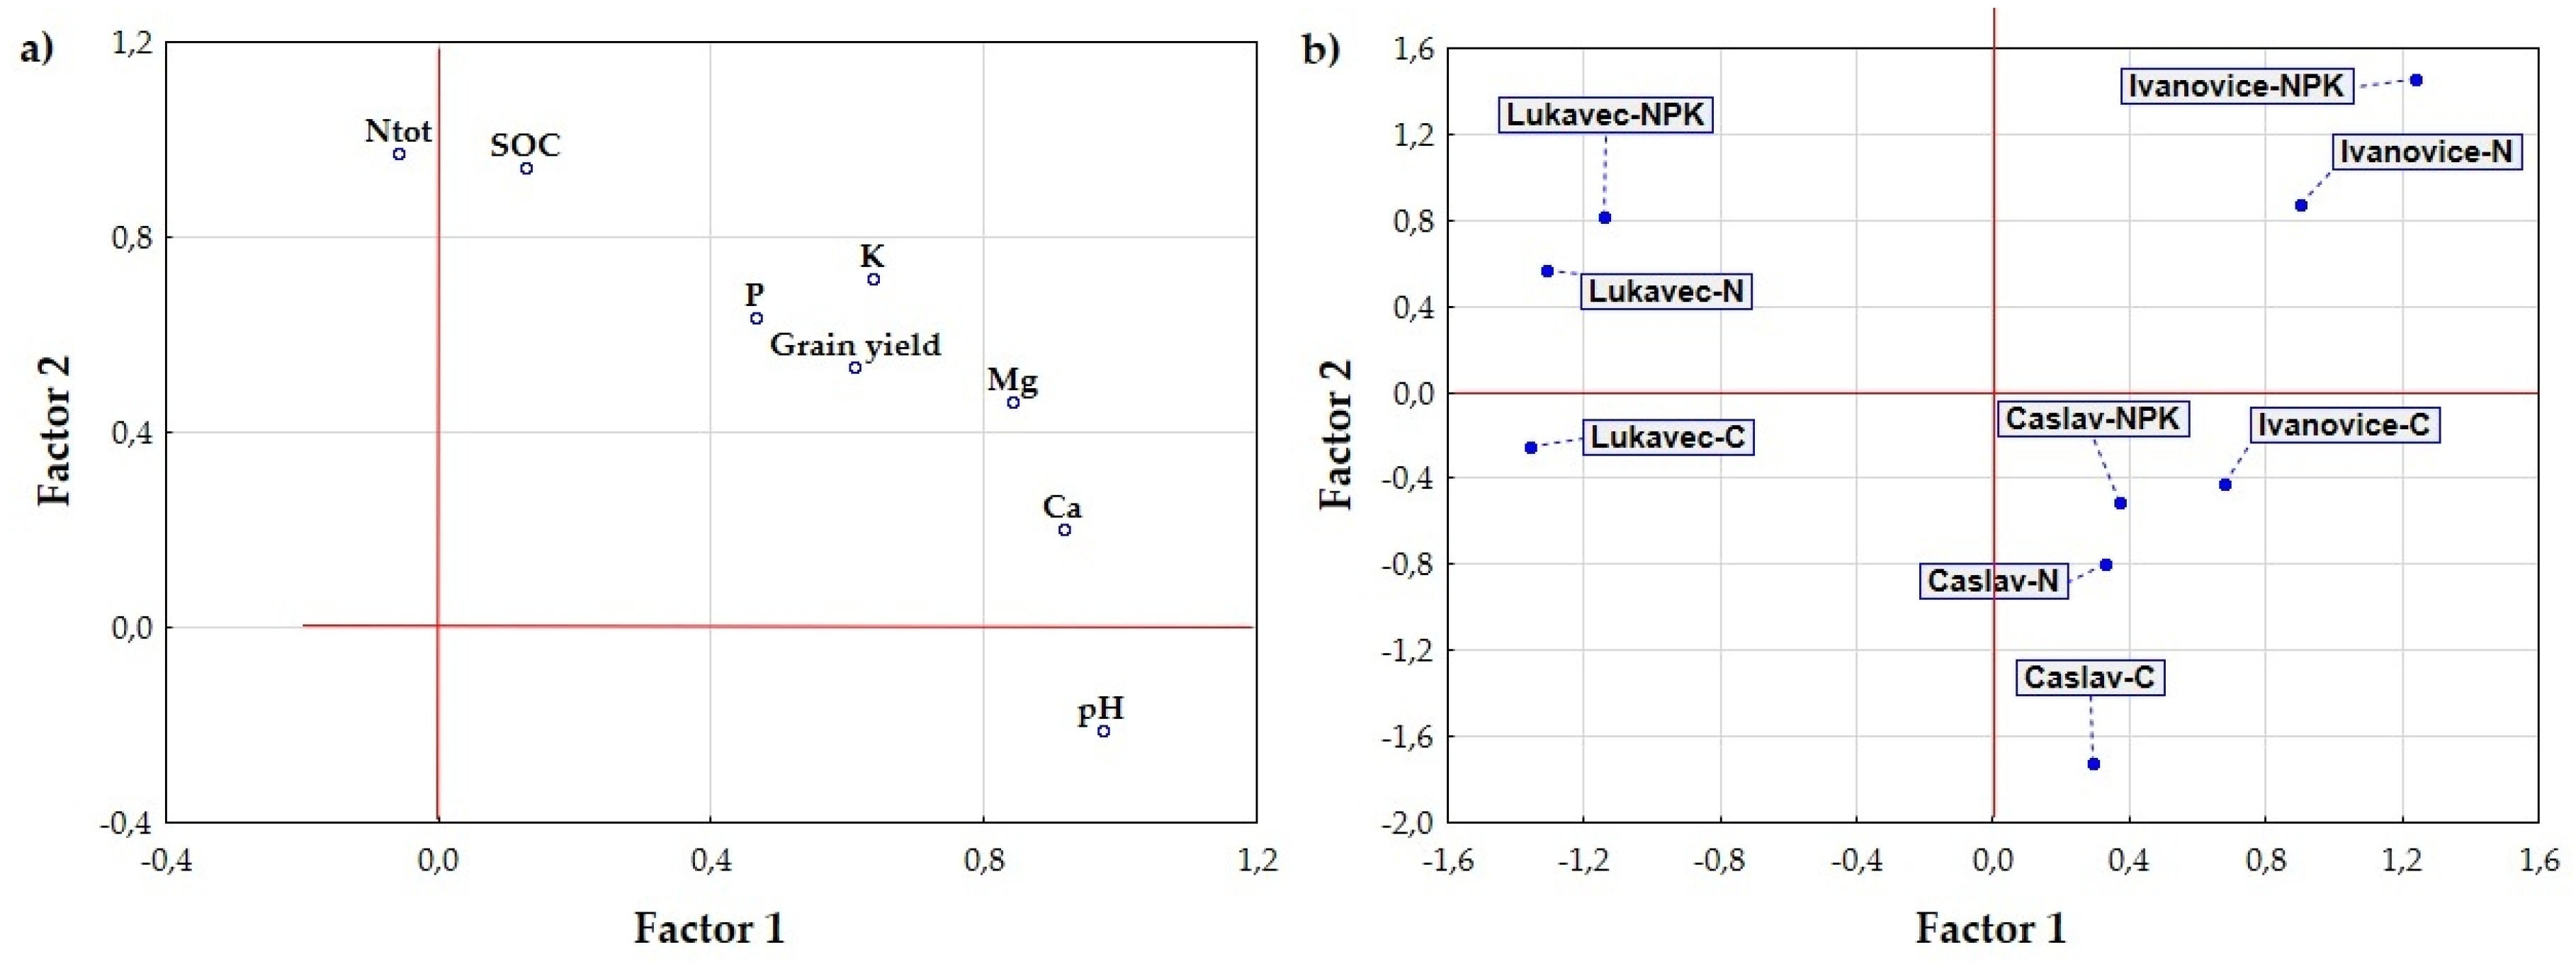
The FA (Figure 5) confirmed the PCA results and differentiated the localities and fertilization treatments similarly to the PCA (Figure 4). Factor weights explain the correlations between factors and features (Table 6). They represent the most important information on which the interpretation of factors is based. We can say that Factor 1 describes the properties of the soil (pH, Ca and Mg content, significant differentiation of localities Lukavec and Ivanovice with Čáslav). Factor 2 clearly describes the content of Ntot and SOC (significantly higher content of SOC and Ntot in fertilized treatments compared to Control in all three localities). Communality represents the proportion of trait variability expressed by the factors in question. It is similar to the value of R2, which we obtain if the original characters are explained by regression by selected factors [46]. From the contribution of Factor 1 and Factor 2 to Communality, it is evident how Communality acquires high values (more than 0.9), and thus the features of the values are very well taken into account by the proposed factor model (Table 6).
4. Discussion
Our results confirm that spring barley grain yield is strongly affected by the soil-climate conditions and fertilization treatment. In other words, different soil-climate conditions and fertilization lead to different results.
We have compared three different localities with different soil-climate conditions in our paper. Two localities have similar weather conditions (Ivanovice and Caslav) but differ in soil types (Ivanovice-Chernozem; Caslav-degraded Chernozem). Ivanovice offers naturally highly fertile soil. Out of all analyzed localities, Ivanovice is the most productive locality, capable to support sustainable production even without fertilizer inputs [47]. The soil in Ivanovice has the highest buffering capacity against soil acidification caused by N fertilization [30]. Finally, the weather conditions are very suitable for growing cereals, offering conditions for stable yields (low grain yield fluctuation, Table 3) due to good water management [48]. All these factors result in high yields and high fertilizers efficiency, expressed by using the quadratic and linear-plateau models and AE (see Section 3.2.1). On the other hand, the beneficial conditions and stable yields may change in the close future due to the ongoing climate change, especially due to the lower water availability and higher heat stress in the lowlands [49], such as in Ivanovice.
The weather in Caslav is similar to that in Ivanovice, the biggest difference between the two localities is in the soil, which is a degraded Chernozem in Caslav. The sustainable production in Caslav, without fertilizer inputs, can be expected only under proper crop rotations including legumes and root crops [50]. This soil is characterized by the lower SOC and Ntot content. Concentrations of P and K in the soil are comparable with Lukavec (Table 5, Figure 3), which is the locality with the lowest natural fertility (in our comparison and comparison with four other long-term experiments in the Czech Republic [12]). The difference between the Chernozem and degraded Chernozem is in the origin of the soil and several theories on how these soils came into being have been developed, including tallgrass steppe (Chernozems) and moister forest-steppe (degraded Chernozems) origins and other theories [51]. Anyway, according to our results, good barley yields can be harvested under such soil-climate conditions but with higher nutrients input (lower yields and lower efficiency when compared with Ivanovice).
As mentioned above, Lukavec is the naturally lowest fertile locality in our comparison. The Cambisol here has the lowest pH, but the soil responds efficiently to the applied fertilizers [12]. According to our results, the proper fertilization can lead to similar yields as in localities more suitable for growing cereals (Ivanovice, Caslav) and increase soil fertility (the SOC, Ntot, nutrients content).
Comparing the fertilizer treatments, the effect of applied fertilizers strongly depends on locality. Nitrogen is the most important nutrient for spring barley and the addition of mineral P and K is site-specific [12], which is confirmed by our results. As the response of spring barley to fertilizers depends on soil-climate conditions, different recommendations must be set to obtain desired yields, save financial costs and minimize environmental damages [4,8,9,10,16,20,52]. In our case, maximum yields can be obtained in Caslav and Ivanovice (Chernozem and degraded Chernozem soil types) with doses of N ranging from 59 to 66 kg ha−1, respectively, but “reasonable yields” [53] (according to the linear-plateau model) can be harvested with N doses around 31–32 kg ha−1, which would be connected with average grain yields decrease of 100 kg ha−1 (Caslav) and 500 kg ha−1 (Ivanovice). In Lukavec (Cambisol, higher altitude, wetter and colder weather), the maximum mean grain yield can be obtained with higher N inputs (98 kg ha−1) but reasonable yields can be obtained with 46 kg ha−1 N, representing a 50% reduction in N dose, which would be connected with averagely 500 kg ha−1 lower yields in this locality.
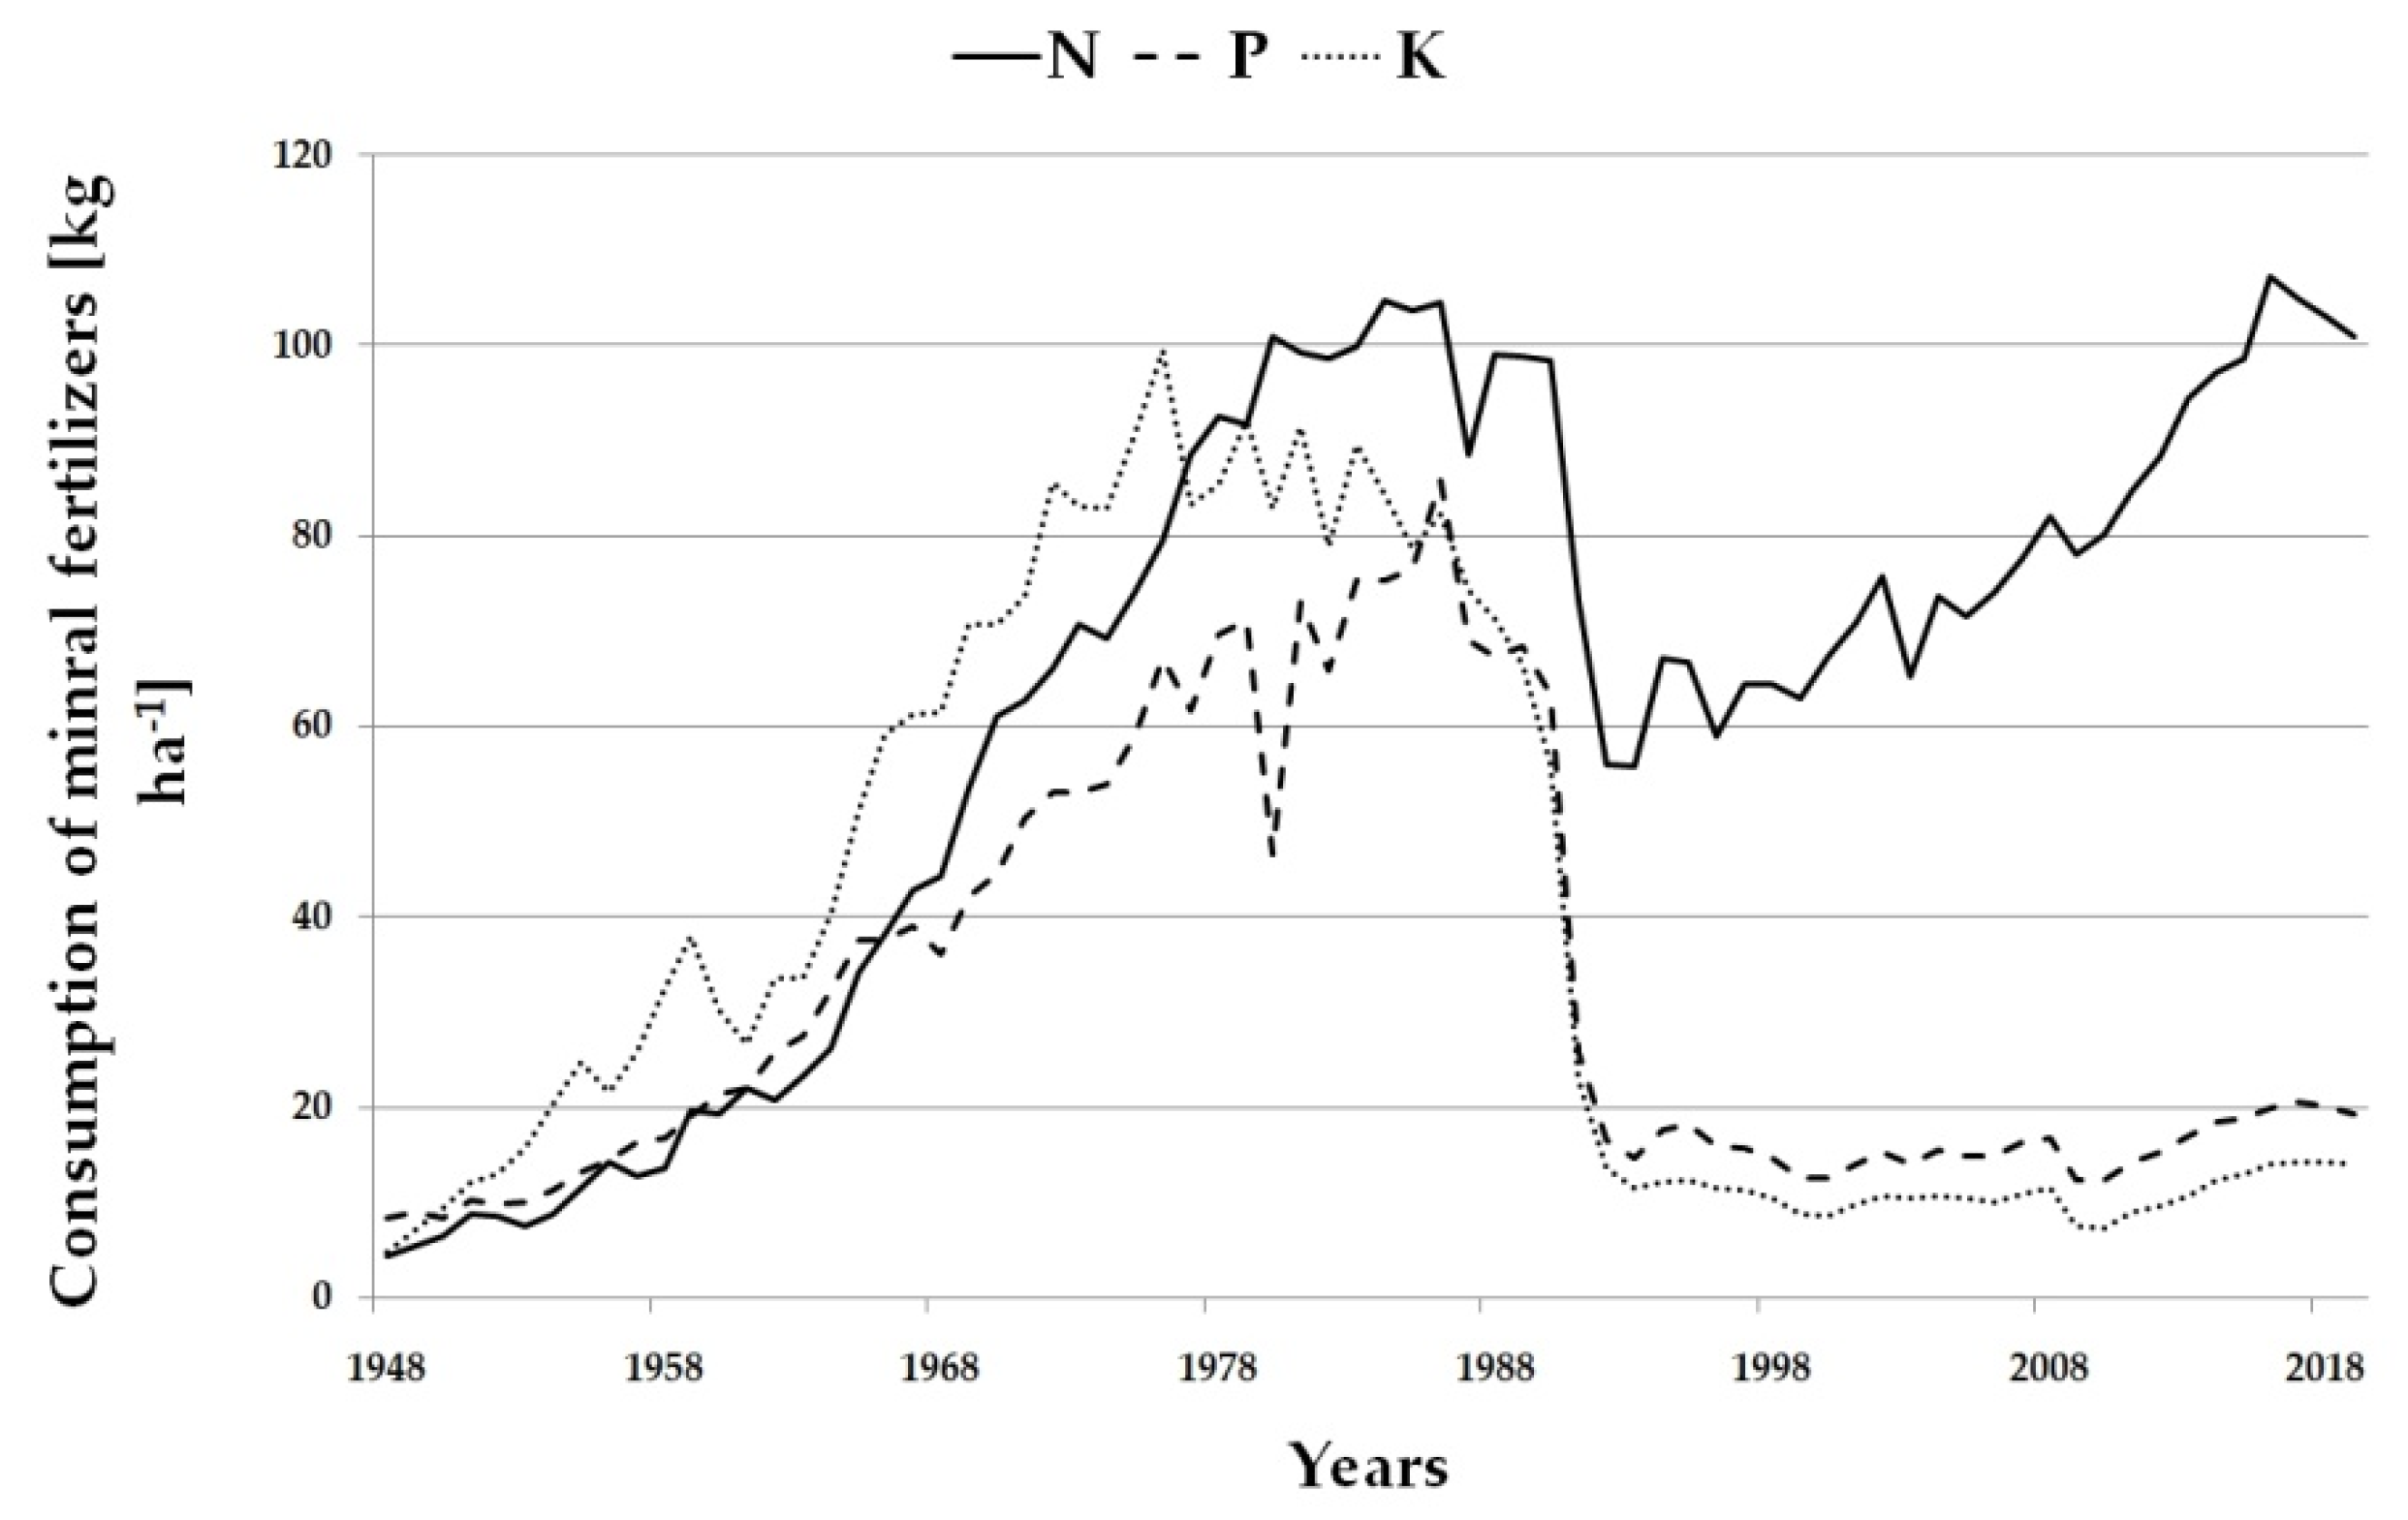
The fertilization does not affect only spring barley grain yield but also soil properties. In our case, regular application of mineral P fertilizers significantly increased the soil P content (Table 5), resulting in high and very high levels when compared with the Control and N fertilizer treatments. Similar results were published by [33,37,54], where omitted P fertilization resulted in significantly lower P soil concentrations when compared with treatments including P fertilizers. This is an important result, showing the negative side of omitting P fertilization. In the Czech Republic, the application rate of mineral P fertilizers decreased significantly after the Velvet Revolution in 1989 (transformation from the centrally planned economy to the market economy) and is on the same level as in the 1960s (Figure 6).
A similar, but not the same, situation was recorded in the case of K, where the application of NPK resulted in significantly higher soil K concentrations when compared with Control (Table 5). The same results were published by [33,37], who recorded lower K concentrations in K-omitted treatments in their long-term trials. The pH value was not affected by the fertilizer treatment (in all localities). The decreasing effect of mineral N (ammonium-based) fertilizers on the soil pH value is known, especially when mineral N is applied without organic amendments [29,30,31,32,37]. In our trial, however, the farmyard manure was applied (and is regularly applied to the root crops and maize in the crop rotation) to the preceding crop (maize, the dose of the manure was 40 t ha−1). The addition of solid organic manures can compensate or negate the negative effect of mineral fertilizers [55] due to the high concentration of base cations. Application rates of the organic manures are currently low in the Czech Republic due to the low level of farm animal production, disrupting crop and animal production and dependence of crop production on mineral N fertilizers. This situation represents a vicious circle that deepens the chemical degradation processes of the soil in the Czech Republic [48,56]. A similar situation can be found in the case of the SOC content. Out of all localities and treatments, the SOC content was significantly lower only in Caslav’s Control treatment (degraded Cheznozem), but lower SOC content was always recorded in the Control when compared with the N and NPK treatments, though insignificantly (Figure 3). The SOC is one of the most important factors determining soil fertility and properties, directly affecting the field’s production capacity (grain yields) [57]. Application of mineral fertilizers increases the SOC content, as in our case and as was confirmed by others [24,31,36], but by how much depends on soil-climate conditions as mentioned in [57], who compared the effect of different fertilizers on the SOC content with the results published earlier.
5. Conclusions
Spring barley grain yield strongly depends on soil-climate conditions and fertilization. According to our results, maximum mean yields (according to the quadratic model) were 6.8, 8.4 and 6.4 t ha−1 in Caslav (degraded Chernozem), Ivanovice (Chernozem) and Lukavec (Cambisol), respectively, with the corresponding N rates of 59, 66, and 98 kg ha−1 N, respectively. Reasonable yields (according to the linear-plateau model) were achieved with significantly lower fertilizer doses, namely 6.7 t ha−1 (with the dose of 32 kg ha−1 N) in Caslav, 7.9 t ha−1 (31 kg ha−1 N) in Ivanovice and 5.9 t ha−1 (46 kg ha−1 N) in Lukavec. Application of P and K fertilizers slightly increased the N efficiency, mainly in Lukavec, which is a locality with soil characterized by low natural fertility.
Fertilization significantly affects soil properties. The pH value was not affected by the application of mineral fertilizers, which was mainly caused by a regular application of the farmyard manure to the preceding crop (maize) and also by natural soil properties in some localities (high buffering capacity of Chernozem in Ivanovice). Concentrations of soil P and K were positively affected by the application of mineral P and K fertilizers. Their regular application prevents their depletion, especially in a situation where crop production is dependent on mineral nitrogen, as is the case in the Czech Republic. The SOC content was significantly affected only in one locality (Caslav). In Ivanovice and Lukavec, the SOC content was always higher in N and NPK treatments when compared with the Control, but the differences were insignificant.
Supplementary Materials
The following are available online at https://www.mdpi.com/article/10.3390/agronomy11091843/s1 —Table S1: The average monthly sum of precipitation (mm) in Caslav, Ivanovice and Lukavec in comparison with the climate normal (1981–2010), Table S2: The average monthly temperatures (°C) in Caslav, Ivanovice and Lukavec in comparison with the climate normal (1981–2010).
Author Contributions
Conceptualization, L.H., L.M. and E.K.; methodology, L.H., L.M. and E.K.; software, L.H., K.K. and L.M.; validation, L.H., K.K. and L.M.; formal analysis, L.H., K.K. and L.M.; investigation, L.H., K.K. and L.M.; resources, L.M. and E.K.; data curation, E.K.; writing—original draft preparation, L.H.; writing—review and editing, L.H., K.K. and L.M.; visualization, L.H., K.K. and L.M.; supervision, E.K.; project administration, L.H., L.M. and E.K.; funding acquisition, E.K. and L.M. All authors have read and agreed to the published version of the manuscript.
Funding
This research was funded by Ministry of the Agriculture of the Czech Republic, grant number RO0418 and Czech National Agency for Agricultural Research—project nos. QK1810010, QK21020155 and QK21010124.
Institutional Review Board Statement
Ethical review and approval were waived for this study, due to the non-use of experimental animals or human subjects.
Informed Consent Statement
No human trials were conducted during the study.
Data Availability Statement
Not Applicable.
Acknowledgments
We would like to thank the technicians who participated in the experiment and analyses.
Conflicts of Interest
The authors declare no conflict of interest.
References
- Czech Statistical Office Sowing Areas of Agricultural Crops. Available online: https://www.czso.cz/csu/czso/zem_cr (accessed on 21 May 2021).
- Zargar, M.; Bodner, G.; Tumanyan, A.; Tyutyuma, N.; Plushikov, V.; Pakina, E.; Shcherbakova, N.; Bayat, M. Productivity of various barley (Hordeum vulgare L.) cultivars under semi-arid conditions in Southern Russia. Agron. Res. 2018, 16, 2242–2253. [Google Scholar] [CrossRef]
- Noworolnik, K. Morphological characters, plant phenology and yield of spring barley (Hordeum sativum L.) depending on cultivar properties and sowing date. Acta Agrobot. 2012, 65, 171–176. [Google Scholar] [CrossRef] [Green Version]
- O’Donovan, J.T.; Turkington, T.K.; Edney, M.J.; Clayton, G.W.; McKenzie, R.H.; Juskiw, P.E.; Lafond, G.P.; Grant, C.A.; Brandt, S.; Harker, K.N.; et al. Seeding rate, nitrogen rate, and cultivar effects on malting barley production. Agron. J. 2011, 103, 709–716. [Google Scholar] [CrossRef] [Green Version]
- Sieling, K.; Christen, O. Crop rotation effects on yield of oilseed rape, wheat and barley and residual effects on the subsequent wheat. Arch. Agron. Soil Sci. 2015, 61, 1531–1549. [Google Scholar] [CrossRef]
- O’Donovan, J.T.; Izydorczyk, M.S.; Tidemann, B.; Edney, M.J.; Turkington, T.K.; Grant, C.A.; Harker, K.N.; Gan, Y. Effect of preceding crop and nitrogen application on malting barley quality. Can. J. Plant Sci. 2017, 97, 1014–1023. [Google Scholar] [CrossRef] [Green Version]
- Klikocka, H.; Narolski, B.; Michalkiewicz, G. The effects of tillage and soil mineral fertilization on the yield and yield components of spring barley. Plant Soil Environ. 2014, 60, 255–261. [Google Scholar] [CrossRef]
- Malecka, I.; Blecharczyk, A. Effect of tillage systems, mulches and nitrogen fertilization on spring barley (Hordeum vulgare). Agron. Res. 2008, 6, 517–529. [Google Scholar]
- Shejbalová, Š.; Černý, J.; Vašák, F.; Kulhánek, M.; Balík, J. Nitrogen efficiency of spring barley in long-term experiment. Plant Soil Environ. 2014, 60, 291–296. [Google Scholar] [CrossRef] [Green Version]
- Siller, A.; Hashemi, M.; Wise, C.; Smychkovich, A.; Darby, H. Date of planting and nitrogen management for winter malt barley production in the Northeast, USA. Agronomy 2021, 11, 797. [Google Scholar] [CrossRef]
- Thai, T.H.; Bellingrath-Kimura, S.D.; Hoffmann, C.; Barkusky, D. Effect of long-term fertiliser regimes and weather on spring barley yields in sandy soil in North-East Germany. Arch. Agron. Soil Sci. 2020, 66, 1812–1826. [Google Scholar] [CrossRef]
- Černý, J.; Balík, J.; Kulhánek, M.; Časová, K.; Nedvěd, V. Mineral and organic fertilization efficiency in long-term stationary experiments. Plant Soil Environ. 2010, 56, 28–36. [Google Scholar] [CrossRef] [Green Version]
- Křen, J.; Klem, K.; Svobodová, I.; Míša, P.; Neudert, L. Yield and grain quality of spring barley as affected by biomass formation at early growth stages. Plant Soil Environ. 2014, 60, 221–227. [Google Scholar] [CrossRef] [Green Version]
- Trnka, M.; Hlavinka, P.; Semerádová, D.; Dubrovský, M.; Žalud, Z.; Možný, M. Agricultural drought and spring barley yields in the Czech Republic. Plant Soil Environ. 2007, 53, 306–316. [Google Scholar] [CrossRef] [Green Version]
- Shrestha, R.K.; Lindsey, L.E. Agronomic management of malting barley and research needs to meet demand by the craft brew industry. Agron. J. 2019, 111, 1570–1580. [Google Scholar] [CrossRef] [Green Version]
- Sainju, U.M.; Lenssen, A.W.; Barsotti, J.L. Dryland malt barley yield and quality affected by tillage, cropping sequence, and nitrogen fertilization. Agron. J. 2013, 105, 329–340. [Google Scholar] [CrossRef] [Green Version]
- Zebarth, B.J.; Drury, C.F.; Tremblay, N.; Cambouris, A.N. Opportunities for improved fertilizer nitrogen management in production of arable crops in eastern Canada: A review. Can. J. Soil Sci. 2009, 89, 113–132. [Google Scholar] [CrossRef]
- Kanter, D.R.; Zhang, X.; Mauzerall, D.L. Reducing nitrogen pollution while decreasing farmers’ costs and increasing fertilizer industry profits. J. Environ. Qual. 2015, 44, 325–335. [Google Scholar] [CrossRef] [PubMed]
- Lassaletta, L.; Billen, G.; Garnier, J.; Bouwman, L.; Velazquez, E.; Mueller, N.D.; Gerber, J.S. Nitrogen use in the global food system: Past trends and future trajectories of agronomic performance, pollution, trade, and dietary demand. Environ. Res. Lett. 2016, 11, 095007. [Google Scholar] [CrossRef]
- Dostálová, Y.; Hřivna, L.; Kotková, B.; Burešová, I.; Janečková, M.; Šottníková, V. Effect of nitrogen and sulphur fertilization on the quality of barley protein. Plant Soil Environ. 2015, 61, 399–404. [Google Scholar] [CrossRef] [Green Version]
- Neugschwandtner, R.W.; Liebhard, P.; Kaul, H.P.; Wagentristl, H. Soil chemical properties as affected by tillage and crop rotation in a long-term field experiment. Plant Soil Environ. 2014, 60, 57–62. [Google Scholar] [CrossRef] [Green Version]
- Macák, M.; Đalović, I.; Turan, J.; Šeremešić, S.; Tyr, S.; Milošev, D.; Kulina, M. Soil organic carbon in long-term experiments: Comparative analysis in Slovakia and Serbia. Agron. Res. 2017, 15, 1971–1982. [Google Scholar] [CrossRef]
- Kopeć, M.; Gondek, K.; Mierzwa-Hersztek, M.; Jarosz, R. Changes in the soil content of organic carbon nitrogen and sulphur in a long-term fertilisation experiment in czarny potok (Poland). J. Elem. 2021, 26, 33–46. [Google Scholar] [CrossRef]
- Chen, Y.; Camps-Arbestain, M.; Shen, Q.; Singh, B.; Cayuela, M.L. The long-term role of organic amendments in building soil nutrient fertility: A meta-analysis and review. Nutr. Cycl. Agroecosyst. 2018, 111, 103–125. [Google Scholar] [CrossRef]
- Šimon, T.; Czakó, A. Influence of long-term application of organic and inorganic fertilizers on soil properties. Plant Soil Environ. 2014, 60, 314–319. [Google Scholar] [CrossRef] [Green Version]
- Qin, H.; Lu, K.; Strong, P.J.; Xu, Q.; Wu, Q.; Xu, Z.; Xu, J.; Wang, H. Long-term fertilizer application effects on the soil, root arbuscular mycorrhizal fungi and community composition in rotation agriculture. Appl. Soil Ecol. 2015, 89, 35–43. [Google Scholar] [CrossRef]
- Soman, C.; Li, D.; Wander, M.M.; Kent, A.D. Long-term fertilizer and crop-rotation treatments differentially affect soil bacterial community structure. Plant Soil 2017, 413, 145–159. [Google Scholar] [CrossRef]
- Geisseler, D.; Scow, K.M. Long-term effects of mineral fertilizers on soil microorganisms—A review. Soil Biol. Biochem. 2014, 75, 54–63. [Google Scholar] [CrossRef]
- Rutkowska, B.; Szulc, W.; Sosulski, T.; Stępień, W. Soil micronutrient availability to crops affected by long-term inorganic and organic fertilizer applications. Plant Soil Environ. 2014, 60, 198–203. [Google Scholar] [CrossRef]
- Vašák, F.; Černý, J.; Buráňová, Š.; Kulhánek, M.; Balík, J. Soil pH changes in long-term field experiments with different fertilizing systems. Soil Water Res. 2015, 10, 19–23. [Google Scholar] [CrossRef] [Green Version]
- Maltas, A.; Kebli, H.; Oberholzer, H.R.; Weisskopf, P.; Sinaj, S. The effects of organic and mineral fertilizers on carbon sequestration, soil properties, and crop yields from a long-term field experiment under a Swiss conventional farming system. Land Degrad. Dev. 2018, 29, 926–938. [Google Scholar] [CrossRef]
- Czarnecki, S.; Düring, R.A. Influence of long-term mineral fertilization on metal contents and properties of soil samples taken from different locations in hesse, Germany. Soil 2015, 1, 23–33. [Google Scholar] [CrossRef] [Green Version]
- Shang, Q.; Ling, N.; Feng, X.; Yang, X.; Wu, P.; Zou, J.; Shen, Q.; Guo, S. Soil fertility and its significance to crop productivity and sustainability in typical agroecosystem: A summary of long-term fertilizer experiments in China. Plant Soil 2014, 381, 13–23. [Google Scholar] [CrossRef]
- Wei, W.; Yan, Y.; Cao, J.; Christie, P.; Zhang, F.; Fan, M. Effects of combined application of organic amendments and fertilizers on crop yield and soil organic matter: An integrated analysis of long-term experiments. Agric. Ecosyst. Environ. 2016, 225, 86–92. [Google Scholar] [CrossRef] [Green Version]
- Menšík, L.; Hlisnikovský, L.; Pospíšilová, L.; Kunzová, E. The effect of application of organic manures and mineral fertilizers on the state of soil organic matter and nutrients in the long-term field experiment. J. Soils Sediments 2018, 18, 2813–2822. [Google Scholar] [CrossRef]
- Vanden Nest, T.; Vandecasteele, B.; Ruysschaert, G.; Cougnon, M.; Merckx, R.; Reheul, D. Effect of organic and mineral fertilizers on soil P and C levels, crop yield and P leaching in a long term trial on a silt loam soil. Agric. Ecosyst. Environ. 2014, 197, 309–317. [Google Scholar] [CrossRef] [Green Version]
- Liu, E.; Yan, C.; Mei, X.; He, W.; Bing, S.H.; Ding, L.; Liu, Q.; Liu, S.; Fan, T. Long-term effect of chemical fertilizer, straw, and manure on soil chemical and biological properties in northwest China. Geoderma 2010, 158, 173–180. [Google Scholar] [CrossRef]
- Kožnarová, V.; Klabzuba, J. Recommendation of World Meteorological Organization to describing meteorological or climatological conditions—Information. Plant Soil Environ. 2011, 48, 190–192. [Google Scholar] [CrossRef] [Green Version]
- Sims, J.R.; Haby, V.A. Simplified colorimetric determination of soil organic matter. Soil Sci. 1971, 112, 137–141. [Google Scholar] [CrossRef]
- Nelson, D.W.; Sommers, L.E. Total carbon, organic carbon, and organic matter. In Total Carbon, Organic Carbon, and Organic Matter: Methods of Soil Analysis Part 3—Chemical Methods; Soil Science Society of America, Inc.: Madison, WI, USA, 2018; pp. 961–1010. [Google Scholar]
- Kirk, P.L. Kjeldahl method for total nitrogen. Anal. Chem. 1950, 22, 354–358. [Google Scholar] [CrossRef]
- Mehlich, A. Communications in soil science and plant analysis Mehlich 3 soil test extractant: A modification of Mehlich 2 extractant. Commun. Soil Sci. Plant Anal. 1984, 15, 37–41. [Google Scholar] [CrossRef]
- Arnhold, E. Easy Nonlinear Model; The R Foundation: Vienna, Austria, 2017; Available online: https://cran.r-project.org/web/packages/easynls/easynls.pdf (accessed on 13 June 2021).
- Mangiafico, S. Rcompanion: Functions to Support Extension Education Program Evaluation in R; Rutgers Cooperative Extension: New Brunswick, NJ, USA, 2019; Available online: http://rcompanion.org/handbook/ (accessed on 13 June 2021).
- Wickham, H.; Averick, M.; Bryan, J.; Chang, W.; McGowan, L.; François, R.; Grolemund, G.; Hayes, A.; Henry, L.; Hester, J.; et al. Welcome to the Tidyverse. J. Open Source Softw. 2019, 4, 1686. [Google Scholar] [CrossRef]
- Meloun, M.; Militský, J. Statistical Data Analysis, a Practical Guide; Woodhead Publishing Limited: Cambridge, UK, 2011. [Google Scholar]
- Kunzová, E.; Hejcman, M. Yield development of winter wheat over 50 years of FYM, N, P and K fertilizer application on black earth soil in the Czech Republic. Field Crops Res. 2009, 111, 226–234. [Google Scholar] [CrossRef]
- Hladký, J.; Brtnický, M.; Elbl, J.; Kintl, A.; Kynický, J. Chernozem degradation in the Czech Republic over the last 50 years. In Proceedings of the SGEM2018, Albena, Bulgaria, 30 June–9 July 2018. [Google Scholar]
- Eitzinger, J.; Trnka, M.; Semerádová, D.; Thaler, S.; Svobodová, E.; Hlavinka, P.; Šiška, B.; Takáč, J.; Malatinská, L.; Nováková, M.; et al. Regional climate change impacts on agricultural crop production in Central and Eastern Europe—Hotspots, regional differences and common trends. J. Agric. Sci. 2013, 151, 787–812. [Google Scholar] [CrossRef]
- Kunzová, E.; Hejcman, M. Yield development of winter wheat over 50 years of nitrogen, phosphorus and potassium application on greyic Phaeozem in the Czech Republic. Eur. J. Agron. 2010, 33, 166–174. [Google Scholar] [CrossRef]
- Kabała, C. Chernozem (czarnoziem)—Soil of the year 2019 in Poland. Origin, classification and use of chernozems in Poland. Soil Sci. Annu. 2019, 70, 184–192. [Google Scholar] [CrossRef]
- Dubis, B.; Hlasko-Nasalska, A.; Hulanicki, P. Yield and malting quality of spring barley cultivar Prestige depending on nitrogen fertilization. Acta Sci. Pol. Agric. 2012, 11, 45–56. [Google Scholar]
- Hochmuth, G.; Hanlon, E.; Overman, A. Fertilizer Experimentation, Data Analyses, and Interpretation for Developing Fertilization Recommendations: Examples with Vegetable Crop Research; University of Florida: Gainesville, FL, USA, 2017. [Google Scholar]
- Zhao, B.; Chen, J.; Zhang, J.; Xin, X.; Hao, X. How different long-term fertilization strategies influence crop yield and soil properties in a maize field in the North China Plain. J. Plant Nutr. Soil Sci. 2013, 176, 99–109. [Google Scholar] [CrossRef]
- Zeng, M.; De Vries, W.; Bonten, L.T.C.; Zhu, Q.; Hao, T.; Liu, X.; Xu, M.; Shi, X.; Zhang, F.; Shen, J. Model-based analysis of the long-term effects of fertilization management on cropland soil acidification. Environ. Sci. Technol. 2017, 51, 3843–3851. [Google Scholar] [CrossRef] [PubMed]
- Šarapatka, B.; Bednář, M.; Novák, P. Analysis of soil degradation in the Czech Republic: GIS approach. Soil Water Res. 2010, 5, 108–112. [Google Scholar] [CrossRef] [Green Version]
- Zhengchao, Z.; Zhuoting, G.; Zhouping, S.; Fuping, Z. Effects of long-term repeated mineral and organic fertilizer applications on soil organic carbon and total nitrogen in a semi-arid cropland. Eur. J. Agron. 2013, 45, 20–26. [Google Scholar] [CrossRef]
Figure 1.
The effect of different N doses on spring barley grain yield (t ha−1) in (a) Caslav, (b) Ivanovice, (c) Lukavec. The data is interpolated by a quadratic model (red line).
Figure 1.
The effect of different N doses on spring barley grain yield (t ha−1) in (a) Caslav, (b) Ivanovice, (c) Lukavec. The data is interpolated by a quadratic model (red line).

Figure 2.
The effect of different N doses on spring barley grain yield (t ha−1) in Caslav, Ivanovice and Lukavec. The data (black dots) is interpolated by a linear-plateau model (blue line).
Figure 2.
The effect of different N doses on spring barley grain yield (t ha−1) in Caslav, Ivanovice and Lukavec. The data (black dots) is interpolated by a linear-plateau model (blue line).

Figure 3.
The effect of fertilizer treatments on soil (a) pH, (b) SOC (%), and (c) Ntot (%) in Caslav, Ivanovice and Lukavec (2013–2016). Mean values followed by the same letter are not statistically significantly different (p < 0.05). No letter means that no difference was recorded in the locality.

Figure 4.
The results of the PCA, showing relationships between the analyzed soil parameters, grain yield and fertilizer treatment/locality. (a) PC1 and PC2—grain yield and soil properties, (b) PC1 and PC2—fertilizer treatments according to the locality, (c) PC1 and PC3—grain yield and soil properties, (d) PC1 and PC3—fertilizer treatments according to the locality, (e) eigenvalues, (f) 3D model showing PC1, PC2 and PC3 axis.

Figure 5.
The results of the factor analysis showing the relationship between (a) soil properties and grain yield and (b) fertilizer treatment/locality.
Figure 5.
The results of the factor analysis showing the relationship between (a) soil properties and grain yield and (b) fertilizer treatment/locality.

Figure 6.
The mean consumption of mineral fertilizers (N, P, K, kg ha−1) in the Czech Republic (1948–2019).
Figure 6.
The mean consumption of mineral fertilizers (N, P, K, kg ha−1) in the Czech Republic (1948–2019).


Table 1.
The basic description of the experimental localities (Caslav, Ivanovice, Lukavec) with weather conditions in individual years (2013–2016) compared with the climate normal (CN; 1981–2010). The evaluation was done according to [38]. The initial soil concentrations of P were analyzed using the Egnér-Riehm extraction method. The initial soil concentrations of K and Mg were analyzed using the Schachtschabel extraction method.
| Caslav | Ivanovice | Lukavec | |
|---|---|---|---|
| GPS | 49°85′ N, 15°40′ E | 49°19′ N, 17°05′ E | 49°57′ N, 14°99′ E |
| Altitude (m a.s.l.) | 263 | 225 | 620 |
| Soil type | Chernozems calcic (luvic)-degraded | Chernozems leptic | Cambisols skeletic |
| Arable layer (cm) | 40–45 | 30–35 | 25–30 |
| Initial pH (KCl) in 1956 | 6.5 | 7.1 | 6.4 |
| Initial P (mg kg−1) in 1956 | 30 | 25 | 21 |
| Initial K (mg kg−1) in 1956 | 108 | 138 | 276 |
| Initial Mg (mg kg−1) in 1956 | 114 | 111 | 152 |
| Precipitation (mm)-CN (1981–2010) | 593 | 562 | 698 |
| Precipitation 2013 | 582 (N) | 554 (N) | 876 (AN) |
| Precipitation 2014 | 541 (N) | 520 (N) | 717 (N) |
| Precipitation 2015 | 388 (VBN) | 392 (VBN) | 576 (BN) |
| Precipitation 2016 | 393 (VBN) | 474 (BN) | 601 (BN) |
| Temperature (°C)-CN (1981–2010) | 9.4 | 9.1 | 7.8 |
| Temperature 2013 | 8.9 (N) | 9.2 (N) | 7.3 (BN) |
| Temperature 2014 | 10.3 (AN) | 10.5 (VAN) | 8.6 (AN) |
| Temperature 2015 | 10.5 (AN) | 10.4 (VAN) | 8.7 (AN) |
| Temperature 2016 | 9.7 (N) | 9.9 (AN) | 7.9 (N) |
Note: N—normal; AN—above normal; VAN—very above normal; BN—below normal; VBN—very below normal.
Table 2.
The scheme of the trial in the period 2012–2016.
| Field I. | Field II. | Field III. | Field IV. | |
|---|---|---|---|---|
| 2012 | Silage maize | |||
| 2013 | Spring barley | Silage maize | ||
| 2014 | Spring barley | Silage maize | ||
| 2015 | Spring barley | Silage maize | ||
| 2016 | Spring barley |
Table 3.
Spring barley grain yield (t ha−1) as affected by the fertilizer treatment and year.
| 2013 | 2014 | 2015 | 2016 | Mean | |
|---|---|---|---|---|---|
| Caslav | |||||
| Control | 3.4 ± 0.1 Aa | 4.7 ± 0.1 Ab | 4.9 ± 0.1 Ab | 3.8 ± 0.1 Aa | 4.2 ± 0.2 A |
| N1 | 5.1 ± 0.1 Ba | 6.5 ± 0.1 Bb | 7.6 ± 0.1 Bc | 6.2 ± 0.1 Bb | 6.4 ± 0.2 B |
| N2 | 5.6 ± 0.1 Ba | 6.7 ± 0.1 BCb | 7.6 ± 0.1 Bc | 6.2 ± 0.1 Bb | 6.5 ± 0.2 BC |
| NPK1 | 5.6 ± 0.2 Ba | 6.9 ± 0.1 BCb | 7.5 ± 0.2 Bc | 6.8 ± 0.1 Cb | 6.7 ± 0.2 CD |
| NPK2 | 6.3 ± 0.2 Ca | 7.0 ± 0.1 BCb | 7.6 ± 0.2 Bc | 6.7 ± 0.1 Cab | 6.9 ± 0.1 D |
| NPK3 | 5.4 ± 0.2 Ba | 7.2 ± 0.1 Cc | 7.7 ± 0.1 Bc | 6.2 ± 0.1 Bb | 6.6 ± 0.2 C |
| Mean | 5.2 ± 0.2 a | 6.5 ± 0.2 c | 7.2 ± 0.2 d | 6.0 ± 0.2 b | |
| Ivanovice | |||||
| Control | 4.9 ± 0.2 Ab | 4.8 ± 0.2 Ab | 3.4 ± 0.1 Aa | 5.2 ± 0.2 Ab | 4.6 ± 0.2 A |
| N1 | 7.6 ± 0.2 Ba | 7.8 ± 0.1 Ba | 7.6 ± 0.2 Ba | 7.5 ± 0.2 Ba | 7.6 ± 0.1 B |
| N2 | 7.8 ± 0.1 Ba | 7.6 ± 0.3 Ba | 8.0 ± 0.2 BCa | 7.3 ± 0.1 Ba | 7.6 ± 0.1 BC |
| NPK1 | 8.2 ± 0.1 Ba | 7.7 ± 0.2 Ba | 8.0 ± 0.3 BCa | 7.9 ± 0.1 Ba | 7.9 ± 0.1 CD |
| NPK2 | 8.0 ± 0.1 Ba | 7.7 ± 0.2 Ba | 8.6 ± 0.1 CDb | 7.5 ± 0.1 Ba | 8.0 ± 0.1 CD |
| NPK3 | 7.9 ± 0.2 Ba | 7.6 ± 0.1 Ba | 9.0 ± 0.2 Db | 7.5 ± 0.2 Ba | 8.0 ± 0.2 D |
| Mean | 7.4 ± 0.2 ab | 7.2 ± 0.2 ab | 7.4 ± 0.4 b | 7.1 ± 0.2 a | |
| Lukavec | |||||
| Control | 1.5 ± 0.1 Aa | 2.7 ± 0.2 Abc | 3.2 ± 0.1 Ac | 2.5 ± 0.1 Ab | 2.5 ± 0.2 A |
| N1 | 3.9 ± 0.2 Ba | 5.3 ± 0.1 Bb | 5.1 ± 0.3 Bb | 4.6 ± 0.1 Bab | 4.7 ± 0.2 B |
| N2 | 5.0 ± 0.2 BCa | 5.6 ± 0.2 Ba | 5.4 ± 0.2 Ba | 5.3 ± 0.2 BCa | 5.3 ± 0.1 C |
| NPK1 | 3.7 ± 0.3 Ba | 5.3 ± 0.2 Bb | 5.3 ± 0.1 Bb | 4.7 ± 0.3 Bab | 4.7 ± 0.2 B |
| NPK2 | 5.4 ± 0.4 Ca | 6.4 ± 0.1 Ca | 5.9 ± 0.1 Ba | 6.1 ± 0.2 CDa | 6.0 ± 0.1 D |
| NPK3 | 6.2 ± 0.4 Cab | 7.1 ± 0.2 Cb | 5.8 ± 0.1 Ba | 6.4 ± 0.1 Dab | 6.4 ± 0.2 D |
| Mean | 4.3 ± 0.3 a | 5.4 ± 0.3 c | 5.1 ± 0.2 bc | 4.9 ± 0.3 b |
The mean grain yield (±SE) followed by the same letter (A vertically—comparing the effect of fertilizer treatment in the locality; a horizontally—comparing the effect of the year within the fertilizer treatment) are not statistically significantly different (p < 0.05).
Table 4.
The AE (kg kg−1) of analyzed fertilizer treatments as affected by the locality (2013–2016).
Table 4.
The AE (kg kg−1) of analyzed fertilizer treatments as affected by the locality (2013–2016).
| N1 | N2 | NPK1 | NPK2 | NPK3 | |
|---|---|---|---|---|---|
| Caslav | 72 ± 8 b | 39 ± 3 a | 83 ± 6 b | 45 ± 2 a | 27 ± 2 a |
| Ivanovice | 102 ± 14 bc | 52 ± 9 a | 113 ± 14 c | 56 ± 11 ab | 38 ± 8 a |
| Lukavec | 75 ± 5 b | 48 ± 4 a | 76 ± 4 b | 58 ± 4 ab | 43 ± 5 a |
The AE results (±SE) followed by the same letter (horizontally) are not statistically significantly different.
Table 5.
The concentrations of P, K, Mg and Ca in the soil profile according to the locality and fertilizer treatment.
Table 5.
The concentrations of P, K, Mg and Ca in the soil profile according to the locality and fertilizer treatment.
| P | P Assess. | K | K Assess. | Mg | Mg Assess. | Ca | |
|---|---|---|---|---|---|---|---|
| Caslav | |||||||
| Control | 42 ± 4 A | Low | 108 ± 20 A | Suitable | 114 ± 7 A | Suitable | 3015 ± 143 A |
| N | 53 ± 17 A | Low | 130 ± 15 AB | Suitable | 145 ± 7 B | Suitable | 2946 ± 126 A |
| NPK | 146 ± 2 B | High | 163 ± 18 B | Suitable | 150 ± 8 B | Suitable | 2910 ± 192 A |
| Ivanovice | |||||||
| Control | 65 ± 7 A | Suitable | 174 ± 7 A | Good | 184 ± 16 A | Good | 4257 ± 205 A |
| N | 117 ± 14 A | Good | 279 ± 22 AB | Good | 235 ± 12 A | Good | 4192 ± 243 A |
| NPK | 232 ± 25 B | Very high | 429 ± 67 B | Very high | 133 ± 17 A | Suitable | 4239 ± 221 A |
| Lukavec | |||||||
| Control | 46 ± 8 A | Low | 110 ± 16 A | Suitable | 110 ± 9 A | Suitable | 2054 ± 69 A |
| N | 50 ± 5 A | Low | 129 ± 11 AB | Suitable | 109 ± 6 A | Suitable | 2209 ± 80 A |
| NPK | 158 ± 10 B | High | 162 ± 12 B | Suitable | 103 ± 7 A | Low | 2181 ± 93 A |
Note: the mean values (±SE) followed by the same letter (A—vertically) are not statistically significantly different (p < 0.05).
Table 6.
Factor weights and contributions of a given factor to the communality for individual characters after normalized Varimax rotation for production (yield) and soil parameters.
Table 6.
Factor weights and contributions of a given factor to the communality for individual characters after normalized Varimax rotation for production (yield) and soil parameters.
| Variable | Factor Weights | Contribution of Factors | |||
|---|---|---|---|---|---|
| Factor 1 | Factor 2 | Factor 1 | Factor 2 | Communality | |
| pH (KCl) | 0.9734 | −0.2113 | 0.9475 | 0.9922 | 0.9999 |
| P | 0.4635 | 0.6353 | 0.2148 | 0.6184 | 0.9901 |
| K | 0.6374 | 0.7158 | 0.4063 | 0.9187 | 0.9964 |
| Ca | 0.9157 | 0.2041 | 0.8385 | 0.8802 | 0.9999 |
| Mg | 0.8403 | 0.4649 | 0.7060 | 0.9221 | 0.9567 |
| SOC | 0.1270 | 0.9428 | 0.0161 | 0.9050 | 0.9999 |
| Ntot | −0.0604 | 0.9723 | 0.0037 | 0.9490 | 0.9992 |
| Grain yield | 0.6106 | 0.5355 | 0.3728 | 0.6595 | 0.9972 |
Note: pH—soil reaction; P—phosphorus; K—potasium; Ca—calcium; Mg—magnesium; SOC—soil organic carbon; Ntot—nitrogen.
Publisher’s Note: MDPI stays neutral with regard to jurisdictional claims in published maps and institutional affiliations. |
© 2021 by the authors. Licensee MDPI, Basel, Switzerland. This article is an open access article distributed under the terms and conditions of the Creative Commons Attribution (CC BY) license (https://creativecommons.org/licenses/by/4.0/).
Share and Cite
MDPI and ACS Style
Hlisnikovský, L.; Křížová, K.; Menšík, L.; Kunzová, E. How Mineral Fertilization and Soil-Climate Conditions Affect Spring Barley Grain Yield and Soil Chemical Properties. Agronomy 2021, 11, 1843. https://doi.org/10.3390/agronomy11091843
AMA Style
Hlisnikovský L, Křížová K, Menšík L, Kunzová E. How Mineral Fertilization and Soil-Climate Conditions Affect Spring Barley Grain Yield and Soil Chemical Properties. Agronomy. 2021; 11(9):1843. https://doi.org/10.3390/agronomy11091843
Chicago/Turabian StyleHlisnikovský, Lukáš, Kateřina Křížová, Ladislav Menšík, and Eva Kunzová. 2021. "How Mineral Fertilization and Soil-Climate Conditions Affect Spring Barley Grain Yield and Soil Chemical Properties" Agronomy 11, no. 9: 1843. https://doi.org/10.3390/agronomy11091843
Note that from the first issue of 2016, this journal uses article numbers instead of page numbers. See further details here.