
Morphological and Ecogeographic Study of the Diversity of Cassava (Manihot esculenta Crantz) in Ecuador

 ,
, 


Abstract
:1. Introduction
2. Materials and Methods
2.1. Cassava Collection
2.2. Morphological Characterization
2.3. Ecogeographical Characterization
2.4. Ecogeographical Land Characterization Map
2.5. Statistical Analysis
3. Results
3.1. Cassava Collection
3.2. Morphological Characterization
3.2.1. Quantitative Descriptors
3.2.2. Qualitative Descriptors
3.2.3. Correlations
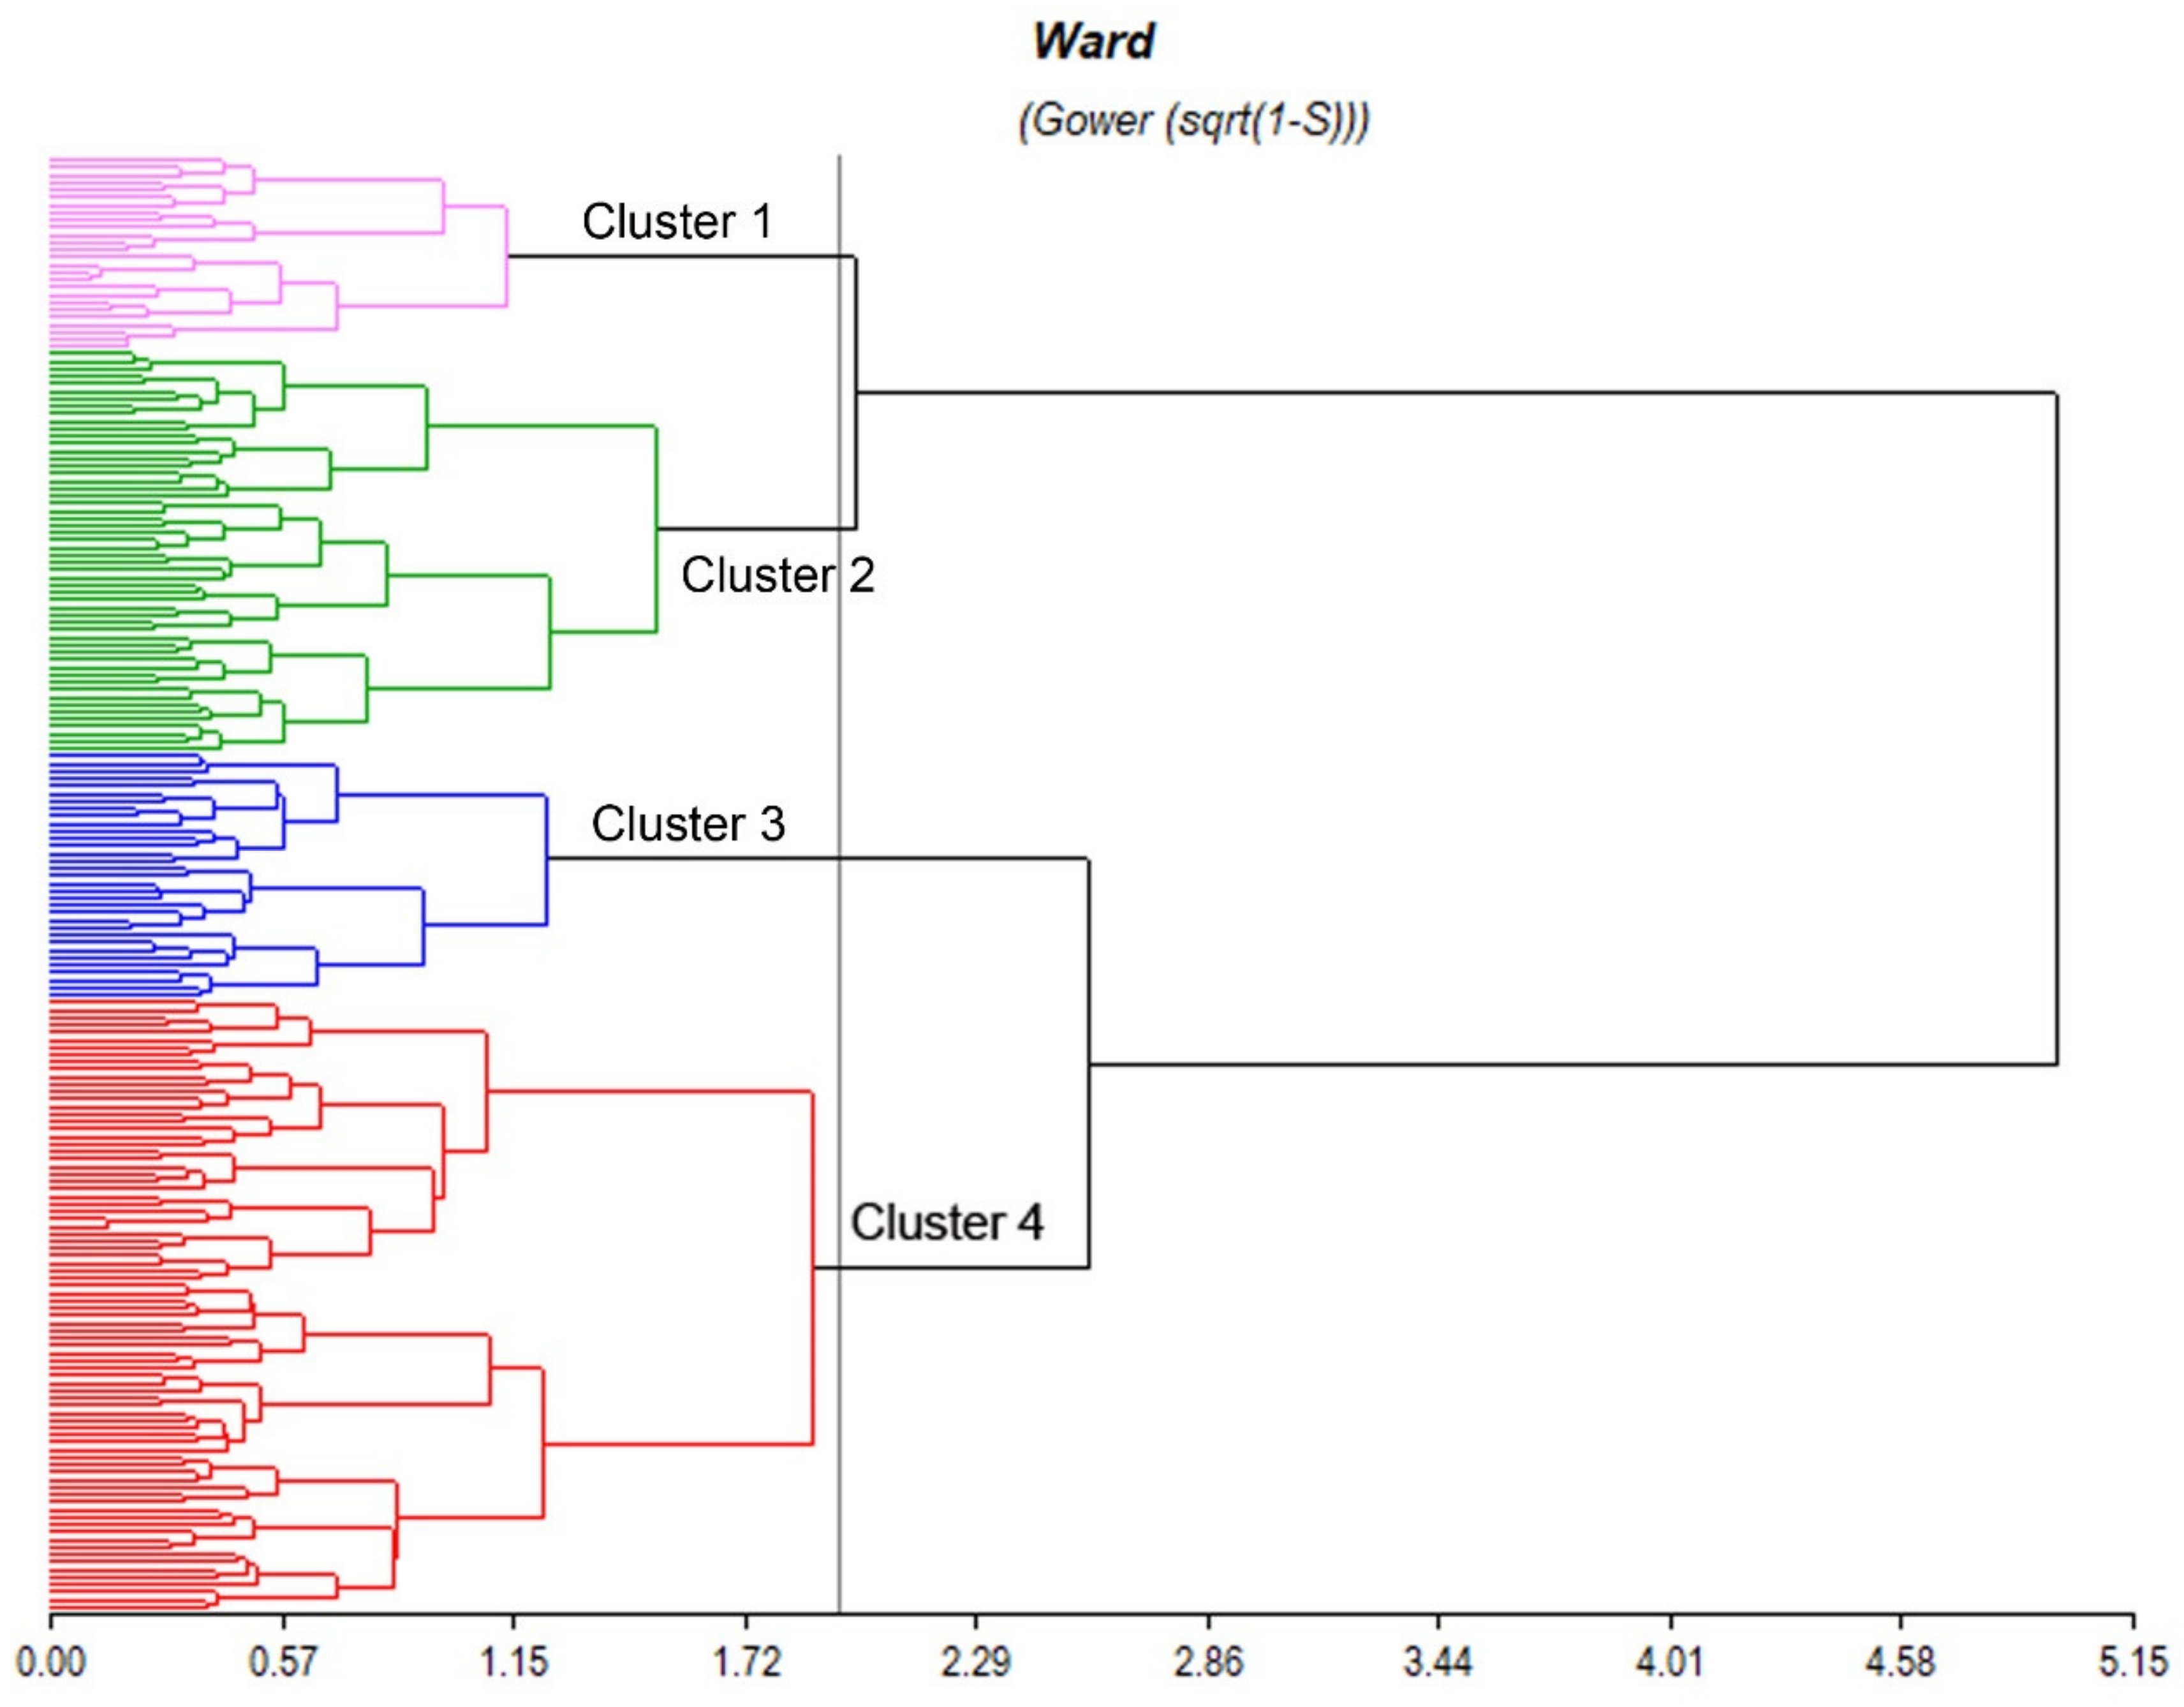
3.3. Multivariate Analysis: Description of Clusters
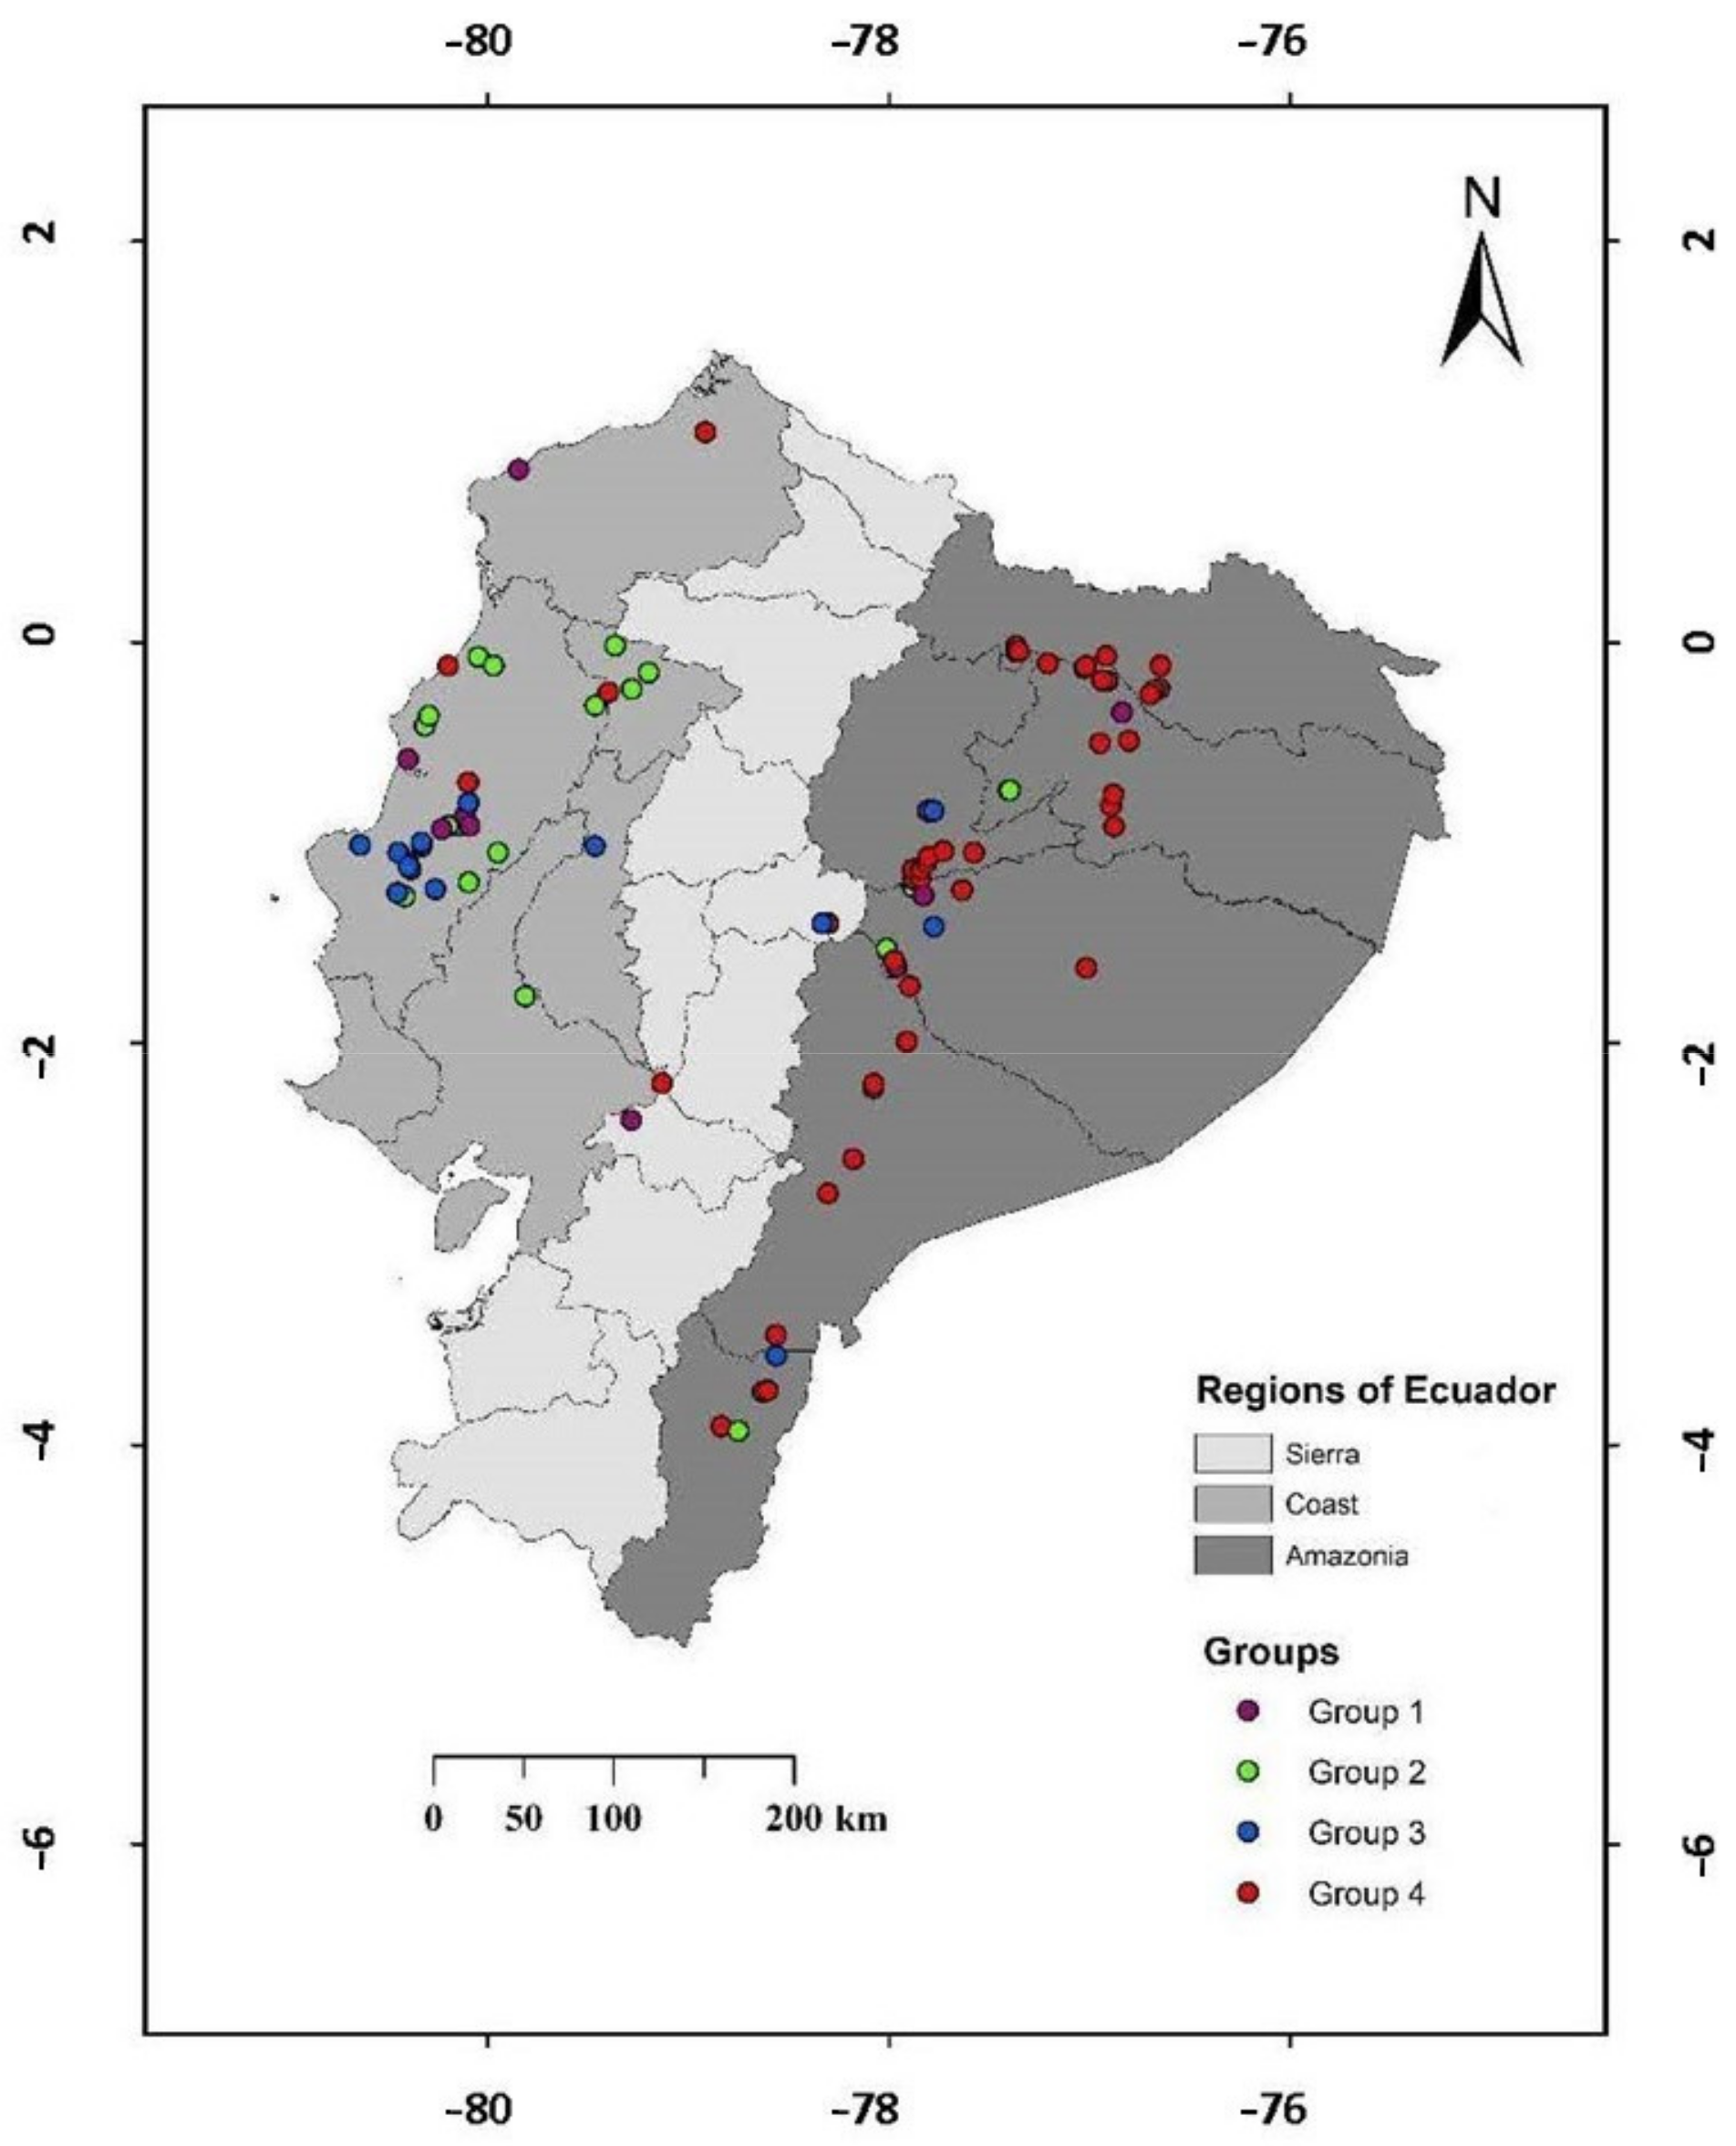
3.4. Ecogeographic Characterization Map of the Soil
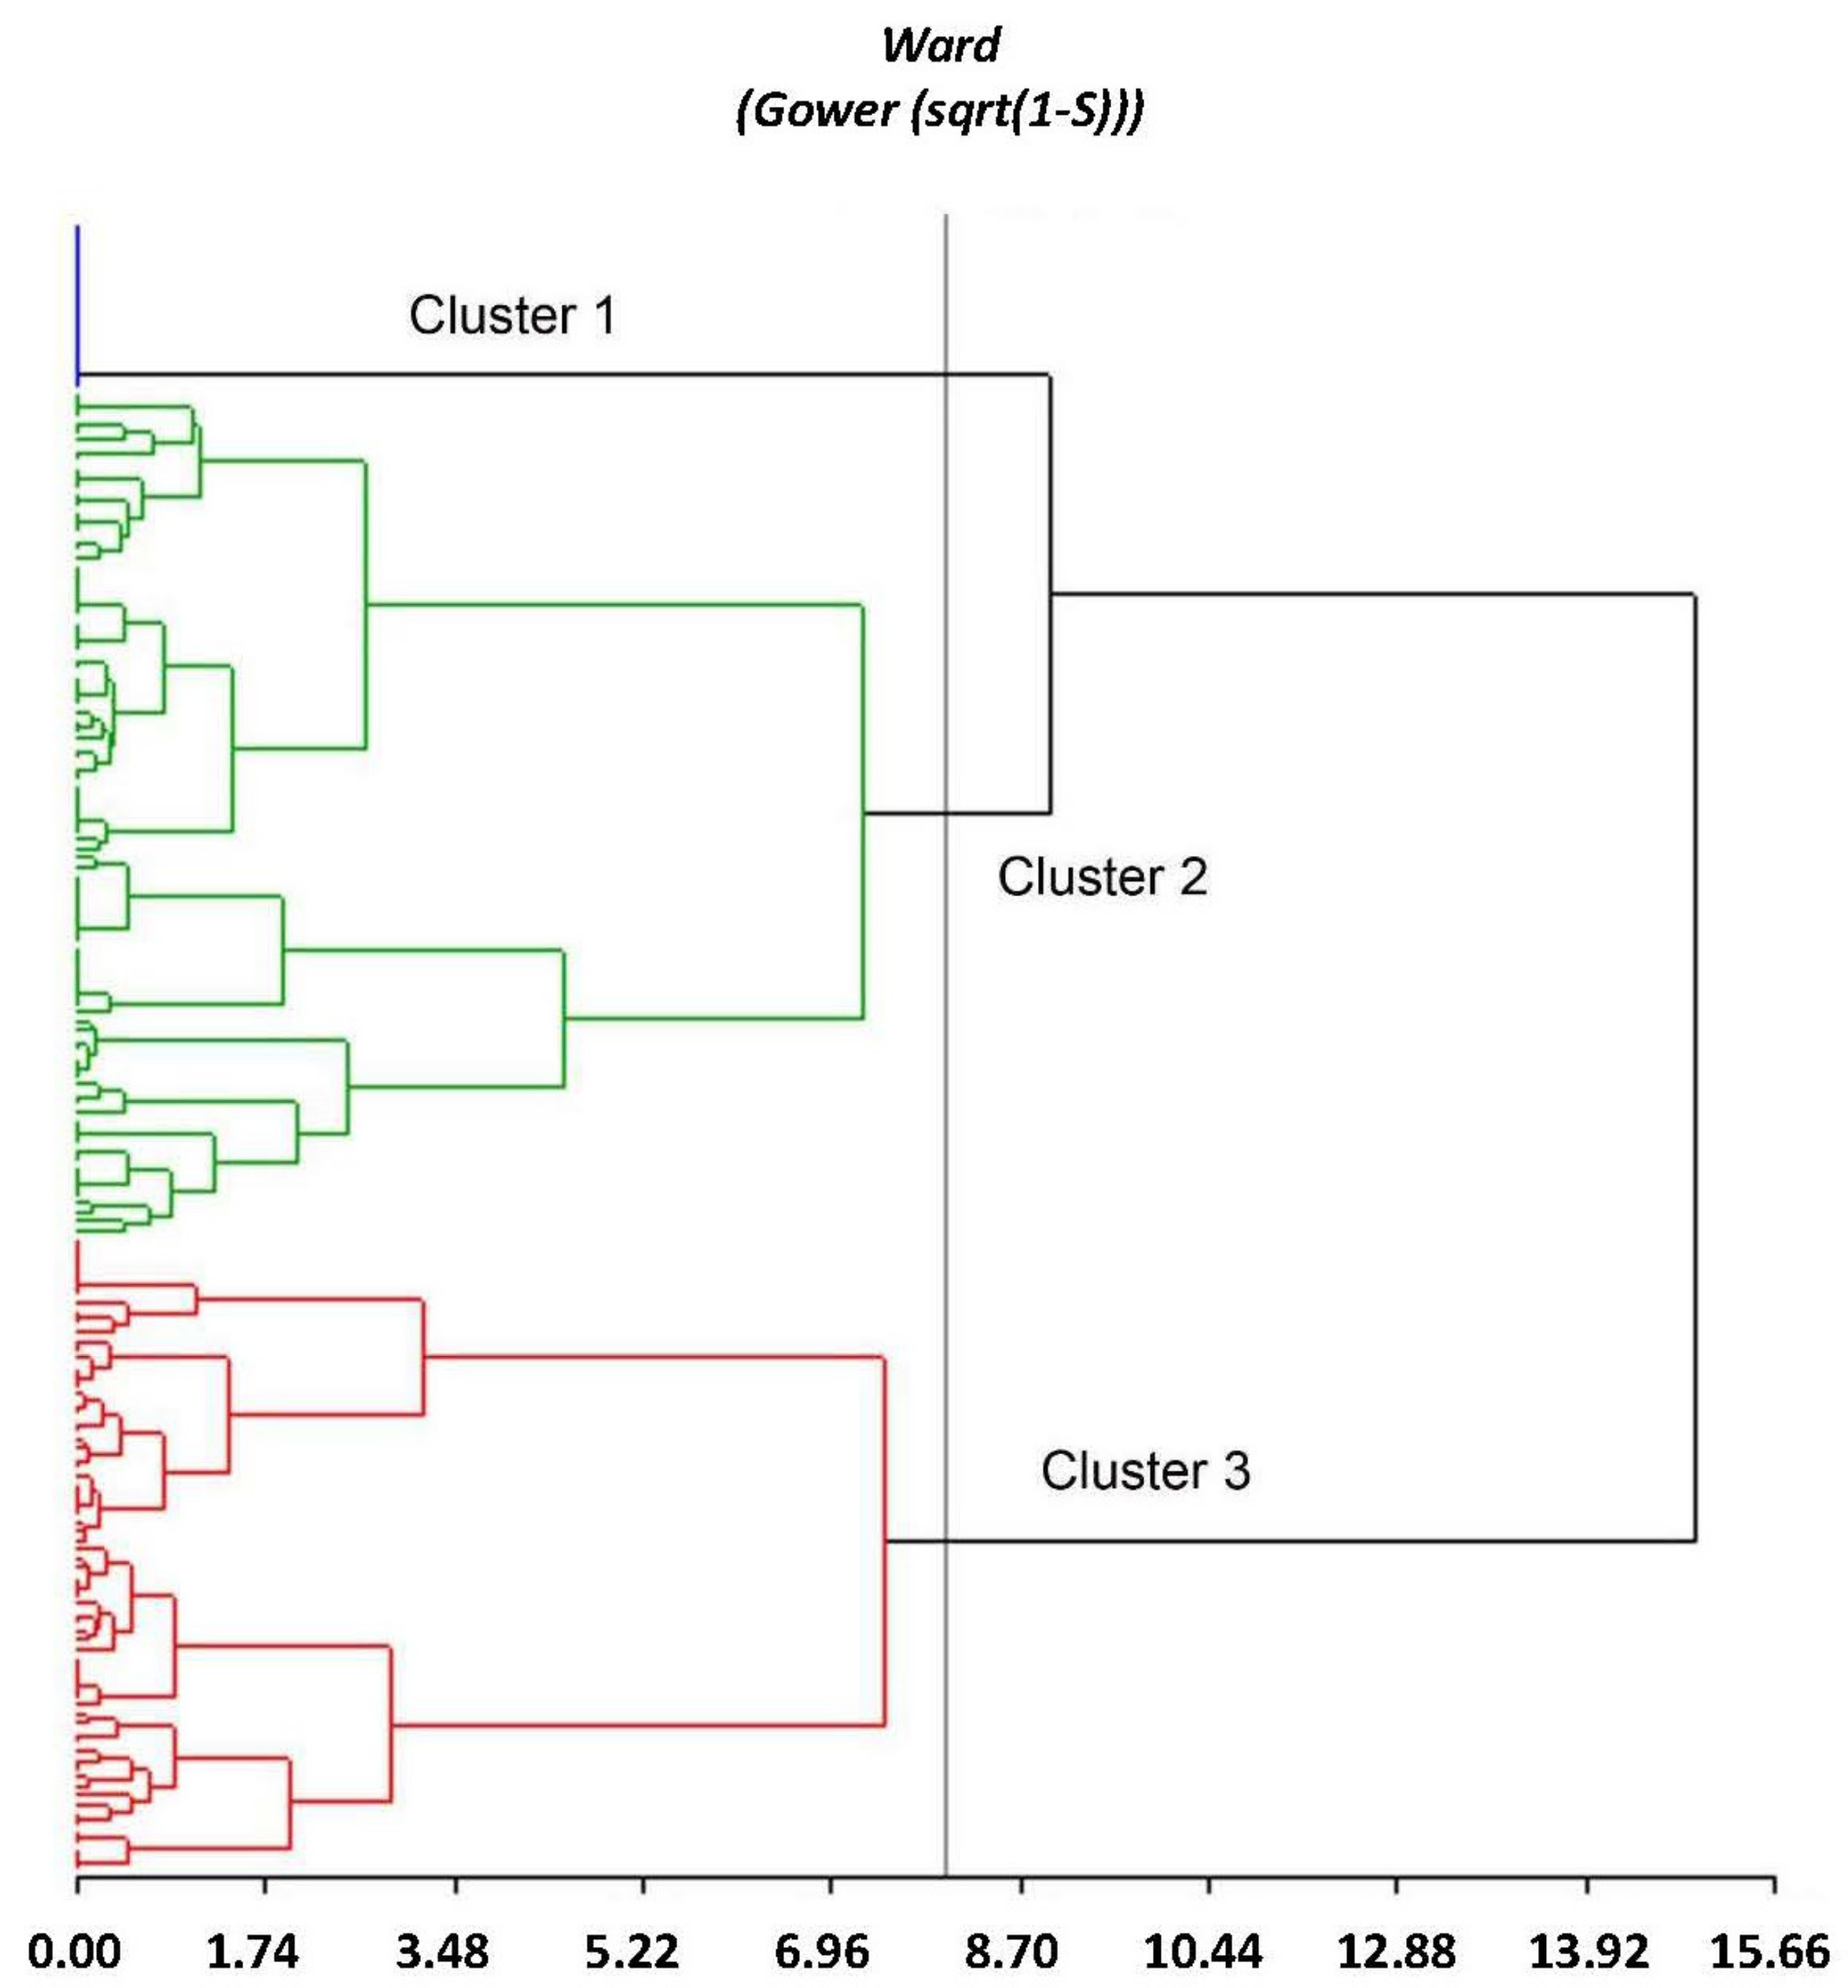
3.5. Multivariate Analysis: Description of Groups
4. Discussion
4.1. Morphology
4.1.1. Descriptors of the Aerial Part
4.1.2. Root Descriptors
4.1.3. Discriminant Morphological Characters
4.1.4. Environmental Adaptation Characteristics of the Cassava Collection
Supplementary Materials
Author Contributions
Funding
Institutional Review Board Statement
Informed Consent Statement
Data Availability Statement
Conflicts of Interest
Appendix A

| Grouping by Morphological Quantitative Characters | |||
|---|---|---|---|
| Group 1 | Group 2 | Group 3 | Group 4 |
| 18,414; 18,421; 18,429; 18,435; 18,444; 18,453; 18,459; 18,461; 18,470; 18,472; 18,487; 18,488; 18,497; 18,540; 18,546; 18,564; 18,566; 18,594; 18,597; 18,600; 18,605; 18,616; 19,107; 19,136; 19,149; 19,162 | 17,607; 17,615; 17,618; 18,407; 18,415; 18,419; 18,423; 18,432; 18,434; 18,440; 18,441; 18,448; 18,451; 18,452; 18,455; 18,462; 18,466; 18,468; 18,473; 18,476; 18,479; 18,480; 18,483; 18,489; 18,491; 18,495; 18,505; 18,506; 18,510; 18,511; 18,513; 18,523; 18,524; 18,536; 18,539; 18,541; 18,542; 18,547; 18,559; 18,561; 18,586; 18,587; 18,602; 18,607; 18,610; 18,615; 18,620; 18,621; 19,089; 19,113; 19,134; 19,141; 19,150; 19,454 | 17,620; 18,416; 18,422; 18,424; 18,426; 18,427; 18,430; 18,437; 18,439; 18,449; 18,450; 18,460; 18,463; 18,464; 18,486; 18,517; 18,535; 18,543; 18,545; 18,554; 18,556; 18,560; 18,562; 18,571; 18,583; 18,622; 19,071; 19,108; 19,111; 19,116; 19,125; 19,143; 19,148 | 17,603; 17,604; 17,605; 17,608; 17,611; 17,612; 17,614; 17,617; 17,619; 17,621; 17,623; 17,624; 17,625; 17,627; 17,628; 17,640; 18,436; 18,456; 18,465; 18,477; 18,485; 18,516; 18,522; 18,533; 18,567; 18,599; 18,601; 18,608; 18,618; 19,070; 19,091; 19,092; 19,094; 19,095; 19,096; 19,097; 19,098; 19,100; 19,101; 19,102; 19,103; 19,104; 19,106; 19,109; 19,110; 19,115; 19,117; 19,118; 19,119; 19,120; 19,121; 19,122; 19,123; 19,124; 19,126; 19,128; 19,129; 19,130; 19,131; 19,132; 19,133; 19,135; 19,137; 19,138; 19,139; 19,140; 19,142; 19,144; 19,145; 19,146; 19,147; 19,151; 19,152; 19,153; 19,154; 19,155; 19,156; 19,157; 19,158; 19,159; 19,160; 19,161 |
| Grouping by Ecogegraphical Quantitative Variables | |||
| Group 1 | Group 2 | Group 3 | |
| * 18,583; 18,586; 18,587; 18,594; 18,597; 18,599; 18,600; 18,601; 18,602; 18,605; 18,607; 18,608; 18,610; 18,615; 18,616; 18,618,; 18,620; 18,621; 18,622 | 17,640; 18,407; 18,414; 18,415; 18,416; 18,419; 18,421; 18,422; 18,423; 18,424; 18,426; 18,427; 18,429; 18,430; 18,432; 18,434; 18,435; 18,436; 18,437; 18,439; 18,440; 18,441; 18,444; 18,448; 18,449; 18,450; 18,451; 18,452; 18,453; 18,454; 18,455; 18,456; 18,459; 18,460; 18,461; 18,462; 18,463; 18,464; 18,465; 18,466; 18,468; 18,470; 18,472; 18,473; 18,476; 18,477; 18,479; 18,480; 18,483; 18,485; 18,486; 18,487; 18,488; 18,489; 18,491; 18,495; 18,497; 18,505; 18,506; 18,510; 18,511; 18,513; 18,516; 18,517; 18,522; 18,523; 18,524; 18,533; 18,535; 18,536; 18,539; 18,540; 18,541; 18,542; 18,543; 18,545; 18,546; 18,547; 18,554; 18,556; 18,559; 18,560; 18,561; 18,562; 18,564; 18,566; 18,567; 18,571; 19,152; 19,153; 19,154; 19,155; 19,156; 19,157; 19,158 | 17,603; 17,604; 17,605; 17,607; 17,608; 17,611; 17,612; 17,614; 17,615; 17,617; 17,618; 17,619; 17,620; 17,621; 17,623; 17,624; 17,625; 17,627; 17,628; 19,070; 19,071; 19,089; 19,091; 19,092; 19,094; 19,095; 19,096; 19,097; 19,098; 19,100; 19,101; 19,102; 19,103; 19,104; 19,106; 19,107; 19,108; 19,109; 19,110; 19,111; 19,113; 19,115; 19,116; 19,117; 19,118; 19,119; 19,120; 19,121; 19,122; 19,123; 19,124; 19,125; 19,126; 19,128; 19,129; 19,130; 19,131; 19,132; 19,133; 19,134; 19,135; 19,136; 19,137; 19,138; 19,139; 19,140; 19,141; 19,142; 19,143; 19,144; 19,145; 19,146; 19,147; 19,148; 19,149; 19,150; 19,151; 19,159; 19,160; 19,161; 19,162 | |
| Variables | Group 1 | Group 2 | ||||||||||
|---|---|---|---|---|---|---|---|---|---|---|---|---|
| n | Mean | SD | CV | Mín | Max | n | Mean | SD | CV | Mín | Max | |
| Total fresh weight of storage roots per plant; kg | 26 | 4.45 | 2.70 | 60.78 | 1.83 | 14.90 | 54 | 4.35 | 2.99 | 68.76 | 0.84 | 15.60 |
| Height to first branching; cm | 25 | 111.83 | 47.90 | 42.84 | 10.00 | 210.00 | 52 | 103.28 | 38.13 | 36.92 | 30.00 | 200.00 |
| Length of storage root; cm | 26 | 39.14 | 8.12 | 20.75 | 29.92 | 58.00 | 54 | 39.94 | 11.41 | 28.56 | 23.20 | 82.33 |
| Plant height; cm | 25 | 231.24 | 71.70 | 31.01 | 98.00 | 350.00 | 52 | 237.90 | 58.74 | 24.59 | 127.00 | 330.00 |
| Diameter of storage root; cm | 26 | 8.63 | 1.36 | 15.77 | 5.33 | 11.00 | 54 | 8.11 | 1.96 | 24.14 | 3.00 | 11.67 |
| Distance between leaf scars; cm | 25 | 0.52 | 0.11 | 20.69 | 0.30 | 0.70 | 54 | 0.53 | 0.10 | 19.61 | 0.30 | 0.70 |
| Width of leaf lobe; cm | 26 | 5.73 | 0.48 | 8.35 | 5.04 | 7.02 | 54 | 5.56 | 0.87 | 15.65 | 3.16 | 7.37 |
| Number of leaf lobes | 26 | 8.00 | 1.02 | 12.75 | 7.00 | 9.00 | 54 | 7.59 | 0.92 | 12.14 | 7.00 | 9.00 |
| Length of leaf lobe; cm | 26 | 22.21 | 1.99 | 8.98 | 18.15 | 25.55 | 54 | 20.29 | 2.74 | 13.48 | 12.83 | 28.35 |
| Variables | Group 3 | Group 4 | ||||||||||
| n | Mean | SD | CV | Mín | Max | n | Mean | SD | CV | Mín | Max | |
| Total fresh weight of storage roots per plant; kg | 33 | 7.28 | 4.08 | 56.05 | 1.00 | 22.00 | 82 | 6.71 | 3.51 | 52.32 | 1.00 | 18.47 |
| Height to first branching; cm | 33 | 86.52 | 37.28 | 43.08 | 24.67 | 166.67 | 80 | 92.29 | 41.52 | 44.99 | 20.00 | 233.33 |
| Length of storage root; cm | 33 | 47.93 | 7.81 | 16.29 | 35.00 | 62.67 | 82 | 48.94 | 13.91 | 27.20 | 23.67 | 48.00 |
| Plant height; cm | 33 | 261.15 | 59.91 | 22.94 | 83.00 | 350.00 | 80 | 261.59 | 59.20 | 22.63 | 90.00 | 393.00 |
| Diameter of storage root; cm | 33 | 10.33 | 2.30 | 22.23 | 4.33 | 15.00 | 82 | 9.90 | 2.36 | 23.86 | 5.67 | 17.20 |
| Distance between leaf scars; cm | 33 | 0.49 | 0.06 | 13.32 | 0.30 | 0.60 | 82 | 0.46 | 0.10 | 21.13 | 0.30 | 0.70 |
| Width of leaf lobe; cm | 33 | 5.99 | 0.76 | 12.69 | 3.67 | 7.14 | 82 | 5.45 | 1.05 | 19.17 | 2.48 | 8.57 |
| Number of leaf lobes | 33 | 7.48 | 1.00 | 13.41 | 5.00 | 9.00 | 82 | 7.91 | 1.24 | 15.66 | 5.00 | 11.00 |
| Length of leaf lobe; cm | 33 | 20.08 | 2.27 | 11.30 | 13.45 | 24.39 | 82 | 19.97 | 2.77 | 13.89 | 11.95 | 29.90 |
| State | Group 1 | Group 2 | Group 3 | Group 4 | Total |
|---|---|---|---|---|---|
| Initial vigour of the plant | |||||
| 1. Low | 0.19 | 0.46 | 0.48 | 0.46 | 0.43 |
| 3. Intermediate | 0.81 | 0.50 | 0.52 | 0.46 | 0.53 |
| 5. High | 0.00 | 0.04 | 0.00 | 0.07 | 0.04 |
| Total | 1.00 | 1.00 | 1.00 | 1.00 | 1.00 |
| Colour of apical leaves | |||||
| 3. Light green | 0.54 | 0.50 | 0.48 | 0.11 | 0.34 |
| 5. Dark green | 0.27 | 0.20 | 0.18 | 0.30 | 0.25 |
| 7. Purple green | 0.19 | 0.26 | 0.33 | 0.33 | 0.29 |
| 9. Purple | 0.00 | 0.04 | 0.00 | 0.26 | 0.12 |
| Total | 1.00 | 1.00 | 1.00 | 1.00 | 1.00 |
| Pubescence of apical leaves | |||||
| 0. Absent | 0.23 | 0.22 | 0.27 | 0.90 | 0.52 |
| 1. Present | 0.77 | 0.78 | 0.73 | 0.10 | 0.48 |
| Total | 1.00 | 1.00 | 1.00 | 1.00 | 1.00 |
| Shape of central lobe of leaf | |||||
| 0. Ovoid | 0.00 | 0.00 | 0.00 | 0.05 | 0.02 |
| 1. Elliptic-lanceolate | 0.00 | 0.63 | 0.85 | 0.44 | 0.50 |
| 2. Obovate-lanceolate | 0.00 | 0.00 | 0.00 | 0.01 | 0.01 |
| 3. Oblong-lanceolate | 0.00 | 0.07 | 0.00 | 0.01 | 0.03 |
| 4. Lanceolate | 0.96 | 0.28 | 0.15 | 0.40 | 0.40 |
| 5. Straight or linear | 0.00 | 0.00 | 0.00 | 0.04 | 0.02 |
| 6. Pandurate | |||||
| 7. Linear-pyramidal | 0.04 | 0.02 | 0.00 | 0.02 | 0.02 |
| 8. Linear-pandurate | 0.00 | 0.00 | 0.00 | 0.01 | 0.01 |
| 9. Linear-hostatilobalate | 0.00 | 0.00 | 0.00 | 0.01 | 0.01 |
| Total | 1.00 | 1.00 | 1.00 | 1.00 | 1.00 |
| Petiole colour | |||||
| 1. Yellowish green | 0.00 | 0.00 | 0.06 | 0.02 | 0.02 |
| 2. Green | 0.08 | 0.09 | 0.03 | 0.04 | 0.06 |
| 3. Reddish green | 0.00 | 0.07 | 0.00 | 0.00 | 0.02 |
| 5. Greenish red | 0.88 | 0.61 | 0.39 | 0.16 | 0.42 |
| 7. Red | 0.00 | 0.15 | 0.15 | 0.22 | 0.16 |
| 9. Purple | 0.00 | 0.04 | 0.03 | 0.16 | 0.14 |
| 10. Yellowish Green-red | 0.00 | 0.02 | 0.33 | 0.11 | 0.13 |
| 11. Reddish yellow green | |||||
| 12. Purplish-green | |||||
| 13. Greenish-purple | 0.04 | 0.02 | 0.00 | 0.11 | 0.06 |
| Total | 1.00 | 1.00 | 1.00 | 1.00 | 1.00 |
| Leaf colour | |||||
| 3. Light green | 0.00 | 0.02 | 0.00 | 0.09 | 0.04 |
| 5. Dark green | 1.00 | 0.98 | 1.00 | 0.90 | 0.95 |
| 7. Purple green | 0.00 | 0.00 | 0.00 | 0.01 | 0.01 |
| 9. Purple | |||||
| Total | 1.00 | 1.00 | 1.00 | 1.00 | 1.00 |
| Colour of stem epidermis | |||||
| 1. Greenish-yellow | 0.00 | 0.00 | 0.03 | 0.01 | 0.01 |
| 2. Light green | 0.04 | 0.02 | 0.88 | 0.24 | 0.26 |
| 3. Dark green | 0.92 | 0.98 | 0.03 | 0.40 | 0.57 |
| 4. Purple cream | |||||
| 5. Purple | 0.00 | 0.00 | 0.00 | 0.26 | 0.11 |
| 6. Green with red purple stripes | 0.04 | 0.00 | 0.06 | 0.06 | 0.04 |
| 7. Purple green | 0.00 | 0.00 | 0.00 | 0.02 | 0.01 |
| Total | 1.00 | 1.00 | 1.00 | 1.00 | 1.00 |
| Flowering | |||||
| 0. Absent | 0.85 | 0.33 | 0.12 | 0.09 | 0.26 |
| 1. Present | 0.15 | 0.67 | 0.88 | 0.91 | 0.74 |
| Total | 1.00 | 1.00 | 1.00 | 1.00 | 1.00 |
| Colour of terminal branches of adult plant | |||||
| 2. Light green | 0.00 | 0.04 | 0.91 | 0.35 | 0.31 |
| 3. Dark green | 0.96 | 0.94 | 0.03 | 0.23 | 0.49 |
| 5. Purple green | 0.04 | 0.02 | 0.03 | 0.23 | 0.11 |
| 6. Red green | 0.00 | 0.00 | 0.03 | 0.11 | 0.05 |
| 7. Purple | 0.00 | 0.00 | 0.00 | 0.07 | 0.03 |
| Total | 1.00 | 1.00 | 1.00 | 1.00 | 1.00 |
| Plant earliness | |||||
| 3. Early (3−6 months) | 0.00 | 0.02 | 0.00 | 0.02 | 0.02 |
| 5. Intermediate (6−9 months) | 0.96 | 0.30 | 0.79 | 0.82 | 0.69 |
| 7. Late (>9 months) | 0.04 | 0.69 | 0.21 | 0.16 | 0.30 |
| Total | 1.00 | 1.00 | 1.00 | 1.00 | 1.00 |
| Shape of plant | |||||
| 1. Compact | 0.04 | 0.12 | 0.06 | 0.06 | 0.07 |
| 2. Open | 0.04 | 0.02 | 0.00 | 0.01 | 0.02 |
| 3. Umbrella | 0.60 | 0.62 | 0.67 | 0.56 | 0.60 |
| 4. Cylindrical | 0.16 | 0.13 | 0.12 | 0.20 | 0.16 |
| 5. Erect | 0.16 | 0.12 | 0.15 | 0.16 | 0.15 |
| Total | 1.00 | 1.00 | 1.00 | 1.00 | 1.00 |
| Root constrictions | |||||
| 0. Absent | 0.92 | 0.78 | 0.79 | 0.80 | 0.81 |
| 1. Present | 0.08 | 0.22 | 0.21 | 0.20 | 0.19 |
| Total | 1.00 | 1.00 | 1.00 | 1.00 | 1.00 |
| Texture of root epidermis | |||||
| 3. Smooth | 0.15 | 0.02 | 0.15 | 0.02 | 0.06 |
| 5. Intermediate | 0.23 | 0.35 | 0.24 | 0.16 | 0.24 |
| 7. Rough | 0.62 | 0.63 | 0.61 | 0.82 | 0.70 |
| Total | 1.00 | 1.00 | 1.00 | 1.00 | 1.00 |
| Length of root peduncle | |||||
| 1. Sessile | 0.42 | 0.11 | 0.39 | 0.10 | 0.19 |
| 3. Short | 0.38 | 0.52 | 0.30 | 0.28 | 0.36 |
| 5. Intermediate | 0.15 | 0.28 | 0.09 | 0.46 | 0.31 |
| 7. Long | 0.04 | 0.09 | 0.21 | 0.16 | 0.13 |
| Total | 1.00 | 1.00 | 1.00 | 1.00 | 1.00 |
| Colour of root cortex | |||||
| 1. White | 0.08 | 0.20 | 0.15 | 0.23 | 0.19 |
| 2. Cream | 0.08 | 0.22 | 0.18 | 0.22 | 0.19 |
| 3. Yellow | 0.08 | 0.06 | 0.03 | 0.07 | 0.06 |
| 4. Pink | 0.19 | 0.15 | 0.45 | 0.04 | 0.16 |
| 5. Purple | 0.58 | 0.37 | 0.18 | 0.44 | 0.39 |
| Total | 1.00 | 1.00 | 1.00 | 1.00 | 1.00 |
| Colour of root pulp | |||||
| 1. White | 0.96 | 0.85 | 0.91 | 0.73 | 0.83 |
| 2. Cream | 0.00 | 0.13 | 0.09 | 0.18 | 0.13 |
| 3. Yellow | 0.04 | 0.02 | 0.00 | 0.09 | 0.05 |
| 4. Orange | |||||
| 5. Pink | |||||
| Total | 1.00 | 1.00 | 1.00 | 1.00 | 1.00 |
| Shape of root | |||||
| 1. Conical | 0.23 | 0.28 | 0.12 | 0.16 | 0.19 |
| 2. Conical-cylindrical | 0.73 | 0.63 | 0.82 | 0.63 | 0.68 |
| 3. Cylindrical | 0.04 | 0.07 | 0.03 | 0.20 | 0.11 |
| 4. Irregular | 0.00 | 0.02 | 0.03 | 0.01 | 0.02 |
| Total | 1.00 | 1.00 | 1.00 | 1.00 | 1.00 |
| Cortex: ease of peeling | |||||
| 1. Easy | 0.92 | 0.80 | 0.97 | 0.88 | 0.88 |
| 2. Difficult | 0.08 | 0.20 | 0.03 | 0.12 | 0.12 |
| Total | 1.00 | 1.00 | 1.00 | 1.00 | 1.00 |
| Variables | Group 1 | Group 2 | Group 3 | |||||||||
|---|---|---|---|---|---|---|---|---|---|---|---|---|
| n | Mean | SD | CV | n | Mean | SD | CV | n | Mean | SD | CV | |
| Altitude; m a.s.l. | 19 | 347.00 | 0 | 0 | 94 | 165.62 | 108.80 | 65.67 | 81 | 591.00 | 286.30 | 48.43 |
| Annual average temperature; °C | 19 | 23.50 | 0 | 0 | 95 | 24.84 | 0.59 | 2.39 | 81 | 23.22 | 1.30 | 5.60 |
| Isothermality *; °C | 19 | 8.30 | 0 | 0 | 95 | 8.03 | 0.31 | 3.82 | 81 | 8.66 | 0.22 | 2.59 |
| Temperature seasonality **; °C | 19 | 63.50 | 0 | 0 | 95 | 67.81 | 10.85 | 16.00 | 81 | 43.06 | 7.36 | 17.10 |
| Maximum temperature; warmest month; °C | 19 | 29.20 | 0 | 0 | 95 | 30.77 | 0.72 | 2.35 | 81 | 29.09 | 1.31 | 4.51 |
| Minimum temperature; coldest month; °C | 19 | 17.40 | 0 | 0 | 95 | 19.07 | 0.63 | 3.30 | 81 | 17.73 | 1.39 | 7.82 |
| Annual temperature range ***; °C | 19 | 11.80 | 0 | 0 | 95 | 11.71 | 0.82 | 7.00 | 81 | 11.36 | 0.58 | 5.15 |
| Average temperature; coldest quarter (3 coldest months); °C | 19 | 22.70 | 0 | 0 | 95 | 24.02 | 0.59 | 2.45 | 81 | 22.57 | 1.35 | 6.00 |
| Average temperature for the quarter with most rainfall (3 rainiest months); °C | 19 | 24.30 | 0 | 0 | 95 | 25.51 | 0.61 | 2.41 | 81 | 22.93 | 1.23 | 5.37 |
| Average temperature for the hottest quarter(3 hottest months); °C | 19 | 24.30 | 0 | 0 | 95 | 25.69 | 0.55 | 2.13 | 81 | 23.68 | 1.32 | 5.59 |
| Maximum temperature for January; °C | 19 | 28.50 | 0 | 0 | 95 | 29.87 | 0.75 | 2.50 | 81 | 28.29 | 1.46 | 5.15 |
| Maximum temperature for February; °C | 19 | 28.50 | 0 | 0 | 95 | 30.02 | 0.64 | 2.14 | 81 | 28.37 | 1.39 | 4.89 |
| Maximum temperature for March; °C | 19 | 29.00 | 0 | 0 | 95 | 30.49 | 0.72 | 2.37 | 81 | 28.18 | 1.32 | 4.68 |
| Maximum temperature for April; °C | 19 | 29.20 | 0 | 0 | 95 | 30.68 | 0.83 | 2.71 | 81 | 28.04 | 1.19 | 4.24 |
| Maximum temperature for May; °C | 19 | 28.50 | 0 | 0 | 95 | 29.87 | 0.79 | 2.64 | 81 | 27.70 | 1.16 | 4.19 |
| Maximum temperature for June; °C | 19 | 27.40 | 0 | 0 | 95 | 28.72 | 0.72 | 2.50 | 81 | 27.19 | 1.27 | 4.67 |
| Maximum temperature for July; °C | 19 | 27.30 | 0 | 0 | 95 | 28.49 | 0.74 | 2.58 | 81 | 27.00 | 1.35 | 5.01 |
| Minimum temperature for January; °C | 19 | 19.40 | 0 | 0 | 95 | 20.70 | 0.59 | 2.83 | 81 | 18.40 | 1.29 | 7.00 |
| Minimum temperature for February; °C | 19 | 19.70 | 0 | 0 | 95 | 20.83 | 0.68 | 3.25 | 81 | 18.39 | 1.31 | 7.14 |
| Minimum temperature for March; °C | 19 | 20.00 | 0 | 0 | 95 | 21.17 | 0.61 | 2.89 | 81 | 18.49 | 1.32 | 7.14 |
| Minimum temperature for April; °C | 19 | 19.70 | 0 | 0 | 95 | 21.06 | 0.57 | 2.72 | 81 | 18.49 | 1.29 | 6.96 |
| Minimum temperature for May; °C | 19 | 19.20 | 0 | 0 | 95 | 20.67 | 0.67 | 3.24 | 81 | 18.49 | 1.22 | 6.59 |
| Minimum temperature for June; °C | 19 | 18.50 | 0 | 0 | 95 | 20.08 | 0.62 | 3.10 | 81 | 18.12 | 1.38 | 7.59 |
| Minimum temperature for July; °C | 19 | 17.80 | 0 | 0 | 95 | 19.45 | 0.62 | 3.17 | 81 | 17.81 | 1.39 | 7.83 |
| Minimum temperature for August; °C | 19 | 17.40 | 0 | 0 | 95 | 19.07 | 0.64 | 3.38 | 81 | 17.73 | 1.39 | 7.83 |
| Minimum temperature for September; °C | 19 | 17.50 | 0 | 0 | 95 | 19.23 | 0.58 | 3.02 | 81 | 18.17 | 1.37 | 7.56 |
| Minimum temperature for October; °C | 19 | 17.70 | 0 | 0 | 95 | 19.59 | 0.59 | 3.02 | 81 | 18.41 | 1.33 | 7.24 |
| Minimum temperature for December; °C | 19 | 18.60 | 0 | 0 | 95 | 20.09 | 0.54 | 2.67 | 81 | 18.58 | 1.30 | 6.97 |
| Average temperature for January; °C | 19 | 23.90 | 0 | 0 | 95 | 25.25 | 0.56 | 2.24 | 81 | 23.32 | 1.35 | 5.81 |
| Average temperature for February; °C | 19 | 24.10 | 0 | 0 | 95 | 25.39 | 0.57 | 2.23 | 81 | 23.35 | 1.32 | 5.66 |
| Average temperature for March; °C | 19 | 24.50 | 0 | 0 | 95 | 25.81 | 0.59 | 2.30 | 81 | 23.31 | 1.31 | 5.62 |
| Average temperature for April; °C | 19 | 24.40 | 0 | 0 | 95 | 25.85 | 0.64 | 2.47 | 81 | 23.23 | 1.20 | 5.18 |
| Average temperature for May; °C | 19 | 23.80 | 0 | 0 | 95 | 25.24 | 0.65 | 2.56 | 81 | 23.07 | 1.18 | 5.11 |
| Average temperature for June; °C | 19 | 22.90 | 0 | 0 | 95 | 24.37 | 0.57 | 2.34 | 81 | 22.62 | 1.32 | 5.85 |
| Average temperature for July; °C | 19 | 22.50 | 0 | 0 | 95 | 23.95 | 0.56 | 2.33 | 81 | 22.38 | 1.36 | 6.10 |
| Average temperature for August; °C | 19 | 22.80 | 0 | 0 | 95 | 24.03 | 0.60 | 2.49 | 81 | 22.82 | 1.37 | 5.99 |
| Average temperature for October; °C | 19 | 23.10 | 0 | 0 | 95 | 24.45 | 0.69 | 2.84 | 81 | 23.62 | 1.33 | 5.62 |
| Average temperature for December; °C | 19 | 23.80 | 0 | 0 | 95 | 24.92 | 0.72 | 2.90 | 81 | 23.73 | 1.34 | 5.64 |
| Rainfall during the hottest quarter (3 hottest months); mm | 19 | 845.00 | 0 | 0 | 95 | 784.69 | 441.20 | 56.23 | 81 | 830.60 | 177.70 | 21.39 |
| Average rainfall for May; mm | 19 | 117.00 | 0 | 0 | 95 | 124.28 | 0 | 87.68 | 81 | 356.50 | 75.75 | 21.25 |
| Average rainfall for August; mm | 19 | 8.00 | 0 | 0 | 95 | 29.47 | 50.14 | 170.10 | 81 | 237.20 | 54.42 | 22.94 |
| Average rainfall for October; mm | 19 | 9.00 | 0 | 0 | 95 | 43.56 | 79.81 | 183.20 | 81 | 294.70 | 61.23 | 20.77 |
| Sand content of soil; % | 19 | 30.00 | 0 | 0 | 94 | 29.20 | 10.60 | 36.29 | 81 | 33.21 | 16.16 | 48.66 |
| Sand content of subsoil; % | 19 | 20.00 | 0 | 0 | 94 | 23.97 | 11.21 | 4.06.77 | 79 | 33.33 | 16.29 | 48.87 |
| Gravel content of subsoil; % | 19 | 1.00 | 0 | 0 | 94 | 1.50 | 1.82 | 121.20 | 79 | 12.63 | 18.49 | 146.40 |
| Group 1 | Group 2 | Group 3 | Total | |
|---|---|---|---|---|
| Slope | ||||
| 1. Flat (0−2°) | 1 | 0.78 | 0.81 | 0.81 |
| 2. Very smooth (2−5°) | 0 | 0.22 | 0.14 | 0.16 |
| 3. Smooth (5−12°) | 0 | 0.00 | 0.05 | 0.02 |
| Total | 1 | 1.00 | 1.00 | 1.00 |
| Total exchangeable bases in surface soil | ||||
| 1. Low fertility | 0 | 0.24 | 0.53 | 0.34 |
| 2. Medium fertility | 0 | 0.04 | 0.47 | 0.22 |
| 3. High fertility | 1 | 0.71 | 0.00 | 0.44 |
| Total | 1 | 1.00 | 1.00 | 1.00 |
| Organic carbon content in surface soil | ||||
| 1. Very low | 0 | 0.23 | 0.00 | 0.11 |
| 2. Low | 0 | 0.54 | 0.89 | 0.63 |
| 3. Medium | 1 | 0.22 | 0.00 | 0.21 |
| 4. High | 0 | 0.00 | 0.11 | 0.05 |
| Total | 1 | 1.00 | 1.00 | 1.00 |
| Cation exchange capacity in surface soil | ||||
| 1. Very low | 0 | 0.07 | 0.02 | 0.05 |
| 2. Low | 0 | 0.19 | 0.98 | 0.50 |
| 3. Medium | 1 | 0.73 | 0.00 | 0.45 |
| Clay cation exchange capacity in surface | ||||
| 2. Low | 0 | 0.00 | 0.35 | 0.14 |
| 3. Medium | 0 | 0.12 | 0.44 | 0.23 |
| 4. High | 0 | 0.00 | 0.21 | 0.08 |
| 5. Very high | 1 | 0.88 | 0.00 | 0.55 |
| Total | 1 | 1.00 | 1.00 | 1.00 |
| Apparent bulk density reference in surface soil | ||||
| 1. Peaty horizons | 0 | 0.00 | 0.28 | 0.12 |
| 2. Volcanic soil horizons | 0 | 0.93 | 0.57 | 0.69 |
| 3. Clay horizons with structure | 1 | 0.07 | 0.15 | 0.20 |
| Total | 1 | 1.00 | 1.00 | 1.00 |
| Apparent bulk density reference in subsoil | ||||
| 1. Peaty horizons | 0 | 0.00 | 0.29 | 0.12 |
| 2. Volcanic soil horizons | 1 | 0.96 | 0.59 | 0.81 |
| 3. Clay horizons with structure | 0 | 0.04 | 0.11 | 0.07 |
| Total | 1 | 1.00 | 1.00 | 1.00 |
| Surface soil pH in a soil–water solution | ||||
| 1. Very acid | 0 | 0.01 | 0.49 | 0.21 |
| 2. Acid | 0 | 0.27 | 0.41 | 0.30 |
| 3. Moderately acid | 0 | 0.16 | 0.10 | 0.12 |
| 4. Slightly acid | 1 | 0.51 | 0.00 | 0.34 |
| 5. Practically neutral | 0 | 0.01 | 0.00 | 0.01 |
| 6. Neutral | 0 | 0.04 | 0.00 | 0.02 |
| Total | 1 | 1.0.00 | 1.00 | 1.00 |
| pH in subsoil in soil–water solution | ||||
| 1. Very acid | 0 | 0.01 | 0.49 | 0.21 |
| 2. Acid | 0 | 0.28 | 0.39 | 0.30 |
| 3. Moderately acid | 0 | 0.04 | 0.01 | 0.03 |
| 4. Slightly acid | 1 | 0.62 | 0.10 | 0.44 |
| 5. Practically neutral | 0 | 0.01 | 0.00 | 0.01 |
| 6. Neutral | 0 | 0.04 | 0.00 | 0.02 |
| Total | 1 | 1.00 | 1.00 | 1.00 |
| Saturation of bases in surface soil | ||||
| 1. Very acidic soil | 0 | 0.21 | 1.00 | 0.52 |
| 2. Medium soil | 1 | 0.22 | 0.00 | 0.21 |
| 3. Soil saturated in bases | 0 | 0.56 | 0.00 | 0.27 |
| Total | 1 | 1.00 | 1.00 | 1.00 |
References
- Organización de las Naciones Unidas para la Agricultura y la Alimentación (FAO) y Fondo Internacional de Desarrollo Agrícola (FIDA). La Economía Mundial de la Yuca: Hechos, Tendencias y Perspectiva; FAO: Rome, Italy, 2000. [Google Scholar]
- Aristizábal, J.; Sánchez, T.; Lorío, D.M. Guía Técnica para Producción y Análisis de Almidón de Yuca; Boletín de Servicios Agrícolas de la FAO: Rome, Italy, 2007; Volume 163. Available online: http://www.fao.org/3/a1028s/a1028s.pdf (accessed on 14 September 2020).
- Organización de las Naciones Unidas para la Agricultura y la Alimentación (FAO). Ahorrar Para Crecer: La Yuca. Guía a la Intensificacion Sostenible de su Producción; FAO: Rome, Italy, 2013; p. 24. Available online: http://www.fao.org/3/i2929s/i2929s.pdf (accessed on 14 September 2020).
- Ademiluyi, F.T.; Mepba, H.D. Yield and Properties of Ethanol Biofuel Produced from Different Whole Cassava Flours. ISRN Biotechnol. 2013, 2013, 1–6. [Google Scholar] [CrossRef] [Green Version]
- Awoyale, W.; Sanni, L.; Shittu, T.A.; Adegunwa, M.O. Effect of storage on the chemical composition, microbiological load, and sensory properties of cassava starch-based custard powder. Food Sci. Nutr. 2015, 3, 425–433. [Google Scholar] [CrossRef]
- Hinostroza, F.; Mendoza, M.; Navarrete, M.; Muñoz, X. Cultivo de yuca en el Ecuador. Estación Experimental Portoviejo de INIAP. Boletín Divulg. 2014, 436, 28. Available online: https://repositorio.iniap.gob.ec/bitstream/41000/5214/1/INIAPEEPbd436.pdf (accessed on 15 December 2020).
- Pérez, H.; Rodríguez, I. Cultivos Tropicales de Importancia Económica en Ecuador (Arroz; Yuca; Caña de Azúcar y Maíz); UTMACH: Machala, Ecuador, 2017. [Google Scholar]
- Salick, J.; Cellinese, N.; Knapp, S. Indigenous diversity of Cassava: Generation, maintenance, use and loss among the Amuesha, Peruvian upper Amazon. Econ. Bot. 1997, 51, 6–19. [Google Scholar] [CrossRef]
- Elias, M.; Rival, L.; Mckey, D. Perception and management of cassava (Manihot esculenta Crantz) diversity among Makushi Amerindians of Guyana (South America). J. Ethnobiol. 2000, 20, 239–265. Available online: https://ethnobiology.org/sites/default/files/pdfs/JoE/20-2/Elias-etal.pdf (accessed on 2 September 2020).
- Gillman, M.; Erenler, H. The genetic diversity and cultural importance of cassava and its contribution to tropical forest sustainability. J. Integr. Environ. Sci. 2009, 6, 189–200. [Google Scholar] [CrossRef]
- Organización de las Naciones Unidas para la Agricultura y la Alimentación (FAO). DSTATos Sobre Alimentación y Agricultura; FAO: Rome, Italy, 2020; Available online: http://www.fao.org/faostat/es/#search/yucca (accessed on 25 October 2020).
- Muñoz, X.; Hinostroza, F.; Mendoza, M. La yuca en Ecuador: Su origen y diversidad genética. Misionero Agro. 2017, 16, 2. Available online: http://181.198.35.101/web/revistas_cientificas/revista_cientifica_16.pdf (accessed on 25 January 2021).
- Ministerio de Cultura y Patrimonio. Patrimonio Alimentario: Yuca Amazónica. Available online: https://patrimonioalimentario.culturaypatrimonio.gob.ec/wiki/index.php/Yuca_Amazon%C3%ADa (accessed on 4 February 2021).
- Barrera, V.; Cruz, E.; Cárdenas, F.; Cobeña, G.; Zambrano, H. Estrategias de vida de las comunidades de pequeños/as pro-ductores/as de yuca (Manihot esculenta Crantz) en Manabí-Ecuador; INIAP-SENACYT: Quito, Ecuador, 2010; p. 79. Available online: https://repositorio.iniap.gob.ec/bitstream/41000/1185/1/iniap-senacyt.pdf (accessed on 4 February 2021).
- Dominguez, C.E. Morphology of the Cassava Plant: Study Guide; Serie 04EC-02.03CIAT; Centro International de Agricultural Tropical: Cali, Colombia, 1984; p. 44. Available online: http://ciat-library.ciat.cgiar.org/articulos_ciat/books/Morphology_of_the_casava_plant.pdf (accessed on 25 January 2021).
- Van Hintum, T.J.L. Hierarchical approaches to the analysis of genetic diversity in crop plants. In Core Collection of Plant Genetic Resources; Hodgkin, T., Brown, A.H.D., van Hintum, T.J.L., Morales, E.A.V., Eds.; A Wiley-Sayce Publication: Chichester, UK, 1995; pp. 23–34. [Google Scholar]
- Abadie, T.; Ceretta, S. Exploring crop adaptation through the study of multi environment trials (METs). In Proceedings of the 3rd South American Oats Congress, Colonia, Uruguay, 11–12 November 1997; pp. 35–40. [Google Scholar]
- Furman, B.; Qualset, C.; Skovmand, B.; Heaton, J.; Wesenberg, D. Characterization and analysis of North America Triticale genetic resources. Crop Sci. 1997, 37, 1951–1959. [Google Scholar] [CrossRef]
- Abadie, T.; Berreta, A. Caracterización y evaluación de recursos fitogenéticos. In Estrategia en Recursos Fitogenéticos para los Países del Cono Sur; Berretta, A., Rivas, M., Eds.; PROCISUR: Montevideo, Uruguay, 2001; pp. 91–99. Available online: http://www.procisur.org.uy/adjuntos/plataforma-regional/21.pdf (accessed on 13 July 2020).
- Lobo, R. Descriptores para la caracterización de yuca (Manihot esculenta Crantz). In Conservación in situ de Cultivos Nativos y Parientes Silvestres; Estrada, R., Medina, T., Roldán, A., Eds.; Instituto Nacional e Investigación y Extensión Agraria: Lima, Perú, 2006; pp. 136–169. Available online: http://www.iiap.org.pe/upload/publicacion/publ459.pdf (accessed on 4 February 2021).
- Fukuda, W.M.G.; Guevara, C.L. Descritores Morfológicos y Agronómicos para a Caracterizaçión de Yuca (Manihot esculenta Crantz); Documentos 78; Cruz das Almas: Empresa Brasileira de Pesquisa Agropecuária (EMBRAPA–CNPMF): Bahia, Brazil, 1998; p. 38. [Google Scholar]
- Mejía, J.; Silva, R.E.-D.; Mejía, K.; García-Dávila, C. Caracterización morfológica y genética de etnovariedades de la yuca Manihot esculenta Crantz; en 6 localidades de la Cuenca baja del río Ucayali-Perú. Folia Amazón 2015, 24, 71–82. [Google Scholar] [CrossRef]
- Agre, A.P.; Dansi, A.; Rabbi, I.Y.; Bhattacharjee, R.; Becerra Lopez Lavelle, L.A.; Sanni, A.; Akouegninou, A.; Akpagana, K. Agromorphological Characterization of elite cassava (Manihot esculenta Crantz) cultivars collected in Benin. Int. J. Curr. Res. Biosci. Plant Biol. 2015, 2, 1–14. Available online: http://www.ijcrbp.com/vol-2-2/A.P.%20Agre;%20et%20al.pdf (accessed on 25 October 2020).
- Koefender, J.; Golle, D.P.; Manfio, C.E.; Horn, R.C.; Schoffel, A.; de Oliveira, J.A.R.; Camera, J.N. Caracterización Morfológica Y Agronómica De Accesos En Yuca En La Region Noroeste Del Rio Grande Do Sul, Brasil. Holos 2018, 6, 2–15. [Google Scholar] [CrossRef]
- N’Zué, B.; Pamelas, O.M.; Michel, K.A.; Brice, D.K.E.; Pierre, Z.G.; Sidoine, E.B.; Alexandre, D.A. Morphological characterization of cassava (Manihot esculenta Crantz) accessions collected in the centre-west, south-west and west of Côte d’Ivoire. Green. J. Agric. Sci. 2014, 4, 220–231. [Google Scholar] [CrossRef]
- Meneses, I.; Núñes, R.; Andrés, P.; Del Rosario, A.J.L.; Leyva, O.O.R.; Galindo, T.M.E. Caracterización morfológica de accesiones de yuca Manihot esculenta Crantz recolectadas en el Estado de Chiapas, México. In Seguridad Alimentaria: Aportaciones Científicas y Agrotecnológicas; Martínez, R., Cámara-Córdova, J., Eds.; University Autonomous Juárez of Tabdisgust, INIFAP: Tabasco, México, 2017; pp. 419–423. ISBN 978-607-606-425-2. [Google Scholar]
- Parra-Quijano, M.; Draper, D.; Torres, E.; Iriondo, J.M. Ecogeographical representativeness in crop wild relative ex situ collections. In Crop Wild Relative Conservation and Use; Maxted, N., Ford-Lloyd, B.V., Kell, S.P., Iriondo, J.M., Dulloo, M.E., Turok, J., Eds.; Cab International: Wallingford, UK, 2008; pp. 249–273. [Google Scholar]
- Parra-Quijano, M.; Iriondo, J.; Torres, E. Applications of ecogeography and geographic information systems in conservation and utilization of plant genetic resources. Span. J. Agric. Res. 2012, 10, 419. [Google Scholar] [CrossRef] [Green Version]
- Mezghani, N.; Khoury, C.K.; Carver, D.; Achicanoy, H.A.; Simon, P.; Flores, F.M.; Spooner, D. Distributions and Conservation Status of Carrot Wild Relatives in Tunisia: A Case Study in the Western Mediterranean Basin. Crop Sci. 2019, 59, 2317–2328. [Google Scholar] [CrossRef]
- González, J.D.J.S.; Corral, J.A.R.; García, G.M.; Ojeda, G.R.; Larios, L.D.L.C.; Holland, J.B.; García Romero, G.E. Ecogeography of teosinte. PLoS ONE 2018, 13, e0192676. [Google Scholar] [CrossRef] [Green Version]
- Parra-Quijano, M.; Lamas, E.T.; Alegría, J.M.I.; López, F. Herramientas CAPFITOGEN Para la Conservación y Utilización de los Recursos Fitogenéticos para la Alimentación y la Agricultura, Versión 2, 1st ed.; Organización de las Naciones Unidas para la Alimentación y la Agricultura: Madrid, Spain, 2015; Available online: http://www.fao.org/3/i3700s/i3700s.pdf (accessed on 15 April 2021).
- Tapia, C.; Torres, E.; Parra-Quijano, M. Searching for Adaptation to Abiotic Stress: Ecogeographical Analysis of Highland Ecuadorian Maize. Crop Sci. 2015, 55, 262–274. [Google Scholar] [CrossRef]
- Borja, E.J. Caracterización eco-geográfica de Prunus serotina Ehrh. subsp. capuli (Cav.) McVaugh (capulí), en la Región Andina de Ecuador. Master’s Thesis, Universidad de Valencia, Valencia, Spain, 2017. [Google Scholar]
- Quinaluisa, E.J.N.; Bastidas, C.G.T.; Feria, R.J.V.; Perez, Y.C.; Pilla, A.H.D.; Borja, E.B.J.; Andrade, N.J. Caracterización eco-geográfica de melloco (Ullucus tuberosus C.) en la región Alto Andina del Ecuador. Técnica Rev. Agrocienc. 2018, 19, 31–46. [Google Scholar]
- Monteros-Altamirano, Á.; Tacán, M.; Peña, G.; Tapia, C.; Paredes, N.; Lima, L. Guía para el Manejo de los Recursos Fitogenéticos en Ecuador. Protocolos; Miscellaneous Publication No. 432; INIAP, Santa Catalina Experimental Station, National Department of Plant Genetic Resources: Quito, Ecuador, 2018; Volume 432, pp. 1–104. Available online: https://repositorio.iniap.gob.ec/handle/41000/4889 (accessed on 11 June 2021).
- Vargas, L.A.T. Caracterización morfológica de 37 accesiones de yuca (Manihot esculenta Crantz) del banco de germoplasma del Centro Agronómico Tropical de Investigación y Enseñanza (CATIE). Master’s Thesis, CATIE, Turrialba, Costa Rica, 2010; p. 103. Available online: http://www.sidalc.net/repdoc/a5955e/a5955e.pdf (accessed on 11 February 2021).
- Del Rosario-Arellano, J.L.; Meneses-Márquez, I.; Andrés-Meza, P. Caracterización morfo-agronómica de accesiones de yuca (Manihot esculenta Crantz). In Ciencias de la Biología; Agronomía y Economía. Handbook; Pérez, F., Figueroa, E., Eds.; ECORFAN: Texcoco de Mora, Mexico, 2017; p. 13. Available online: https://www.ecorfan.org/handbooks/Ciencias%20de%20la%20Biologia%20Agronomia%20y%20Economia%20T-I/HCBAE_TI_6.pdf (accessed on 11 February 2021).
- Farfán, F.P. Agroclimatología del Ecuador, 1st ed.; Universidad Salesiana: Cuenca, Ecuador, 2018; p. 647. ISBN 978-9978-10-310-4. [Google Scholar]
- MAG. Memoria Explicativa del Mapa de Ordenes de Suelos del Ecuador; MAG (Ministerio de Agricultura y Ganadería): San Jose, Costa Rica, 2003; p. 15. Available online: http://metadatos.sigtie-rras.gob.ec/pdf/MEMORIA_MAPA_DE_ORDENES_DE_SUELOS_MAG_SIGTIERRAS.pdf (accessed on 16 February 2021).
- INFOSTAT. Version 2014: Software Estadístico; Grupo InfoStat, Universidad Nacional de Córdoba: Córdoba, Argentina; Available online: http://www.infostat.com.ar (accessed on 25 February 2021).
- Wilcox, A.R. Indices of qualitative variation and political measurement the western Political Quarterly. West. Polit. Q. 1973, 26, 325–343. [Google Scholar] [CrossRef]
- Hernández, J.D.; Espinosa, J.; Peñaloza, M.; Rangel, J.G.C.; Sierra, C.A.T.; Torrado, M.K.A.; Pirela, V. Sobre el uso adecuado del coeficiente de correlación de Pearson: Definición; propiedades y suposiciones. Arch. Venez. Farmacol. Ter. 2018, 37, 5. Available online: https://www.revistaavft.com/images/revistas/2018/avft_5_2018/25sobre_uso_adecuado_coeficiente.pdf (accessed on 13 February 2021).
- Espinoza Romeno, V. Construcción y análisis de los coeficientes de sendero. Acta Nova 2018, 8, 517−535. [Google Scholar]
- Lehmann, S.; Rodríguez, J. La Chakra Kichwa: Criterios para la Conservación y Fomento de un Sistema de Producción Sostenible en la Asociación Kallari y sus Organizaciones Socias; Serie de Sistematización 7, 201; GIZ: Quito, Ecuador, 2013; p. 20. [Google Scholar]
- GIZ, Grupo Chakra. La Chakra Kichwa Amazónica: Un Sistema Ancestral Resiliente al Cambio Climático en la Provincia de Napo; Sistematización Programa ProCamBío II; GIZ: Tena, Ecuador, 2019; p. 61. [Google Scholar]
- Wilson, W.M.; Dufour, D.L. Why “bitter” cassava? Productivity of “bitter” and “sweet” cassava in a Tukanoan Indian settlement in the northwest Amazon. Econ. Bot. 2002, 56, 49–57. [Google Scholar] [CrossRef]
- Rivadeneyra-Domínguez, E.; Rodríguez-Landa, J.F.; Salas-Montero, D.R. Neuropatía atáxica tropical y Konzo asociadas al consumo excesivo de yuca? Arch. Neurocien. 2012, 17, 45−52. Available online: https://www.medigraphic.com/cgi-bin/new/resumen.cgi?IDARTICULO=35686 (accessed on 13 August 2021).
- Elias, M.; Panaud, O.; Robert, T. Assessment of genetic variability in a traditional cassava (Manihot esculenta Crantz) farming system, using AFLP markers. Heredity 2000, 85, 219–230. [Google Scholar] [CrossRef] [Green Version]
- Sambatti, J.B.M.; Martins, P.S.; Ando, A. Folk taxonomy and evolutionary dynamics of cassava: A case study in Ubatuba; Brazil. Econ. Bot. 2001, 55, 93–105. [Google Scholar] [CrossRef]
- Brito, C.L.L.; Viana, A.E.S.; Barbosa, G.M.; Lopes, S.C.; Santos, V.S.; Silva, V.A. Caracterização de Clones de Mandioca (Manihot esculenta Crantz) Por Meio de Descritores Morfológicos em Cândido Sales-Bahia. In Proceedings of the XV Congreso Brasileiro de Mandioca, Salvador, Brazil, 21–26 October 2013; Available online: https://www.embrapa.br/busca-de-publicacoes/-/publicacao/977440/caracterizacao-de-clones-de-mandioca-manihot-esculenta-crantz-por-meio-de-descritores-morfologicos-em-candido-sales-bahia (accessed on 12 November 2020).
- Marín, A.; Perdomo, D.; Albarrán, J.G.; Fuenmayor, F.; Zambrano, C. Evaluación agronómica, morfológica y bioquímica de clones élites de yuca a partir de vitroplantas. Interciencia 2008, 33, 365–371. Available online: http://www.redalyc.org/articulo.oa?id=3393350 (accessed on 15 December 2020).
- Acosta, A.; Alonso, R. Caracterización morfológica y extracción de ADN de 11 clones de yuca (Manihot esculenta Crantz) en la Universidad de EARTH, Coast Rica. Tierra Trop. 2006, 2, 67–75. Available online: http://usi.earth.ac.cr/glas/sp/PGs2003-2007.pdf (accessed on 25 October 2020).
- Ceballos, H.; de la Cruz, G.A. Taxonomía y morfología de la yuca. In La Yuca en el Tercer Milenio; Ospina, B., Ceballos, H., Eds.; Centro Internacional de Agricultura Tropical: Cali, Colombia, 2002; pp. 15–32. Available online: http://passthrough.fw-notify.net/download/496110/http://www.clayuca.org/sitio/images/publicaciones/yuca_tercer_milenio.pdf (accessed on 12 November 2020).
- Ramos, P.A.S. Caracterização Morfológica e Produtiva de Nove Variedades de Mandioca Cultivadas no Sudoeste de Bahia. Master‘s Thesis, Universidade Federal de Viçosa, Viçosa, Brazil, March 2007; p. 60. Available online: https://www.locus.ufv.br/handle/123456789/4647 (accessed on 25 October 2020).
- Anchundia, L.M.P. Caracterización Agronómica; Morfológica y Molecular del Banco de Germoplasma de Yuca (Manihot esculenta Crantz) de la Estación Experimental Portoviejo del INIAP. Master’s Thesis, Universidad Técnica de Manabí, Facultad de Agronomía, Manabí, Ecuador, 2010; p. 61. Available online: http://repositorio.iniap.gob.ec/handle/41000/4111 (accessed on 15 August 2020).
- Souza, L.S.; Alves, A.A.C.; De Oliveira, E.J. Phenological diversity of flowering and fruiting in cassava germplasm. Sci. Hortic. 2020, 265, 109253. [Google Scholar] [CrossRef]
- Polanco, D. Caracterización Morfológica, Isoenzimática, Contenido de Cianuro y Almidón en el Banco de Germoplasma in vivo de Yuca (Manihot Esculenta Crantz) de la Facultad de Agronomía de la Universidad Central de Venezuela. Master’s Thesis, Universidad Central de Venezuela, Maracay, Venezuela, 1998; p. 99. Available online: http://ve.scielo.org/scielo.php?script=sci_nlinks&ref=1436573&pid=S0378-1844200800050001000023&lng=es (accessed on 5 July 2020).
- Lowe, A.; Hanotte, O.; Garino, L. Standardization of molecular genetic techniques for the characterization of germplasm collection: The case of random amplified polymorphic DNA (RAPD). Plant Genet. Resour. Newslett. 1996, 107, 50–54. Available online: https://cgspace.cgiar.org/handle/10568/29494 (accessed on 13 April 2021).
- Demey, J.; Zambrano, A.; Fuenmayor, F.; Segovia, V. Relación entre caracterizaciones molecular y morfológica en una colección de yuca. Interciencia 2003, 28, 684–689. Available online: www.interciencia.org (accessed on 5 July 2020).
- Domínguez, C. Yuca: Investigació, Producción y Utilización; CIAT: Cali, Colombia, 1983; p. 656. Available online: http://ciat-library.ciat.cgiar.org/Articulos_Ciat/Digital/SB211.C4_Y85_Yuca_Investigaci%C3%B3n,_producci%C3%B3n_y_utilizaci%C3%B3n.pdf (accessed on 25 October 2020).
- Raghu, D.; Senthil, N.; Saraswathi, T.; Raveendran, M.; Gnanam, R.; Venkatachalam, R.; Shanmugasundaram, P.; Mohan, C. Morphological and simple sequence repeats (SSR) based finger printing of south Indian cassava germplasm. Int. J. Intergrat. Biol. 2007, 1, 141–149. Available online: http://www.classicrus.com/IJIB/Arch/2007/1020.pdf (accessed on 4 February 2021).
- Ampong-Mensah, G. Preliminary characterization of cassava germplasm from South-Western ecozone (Central and Western Region) of Ghana. Master’s Thesis, Department of Crop Science, University Cape Coast, Cape Coast, Ghana, 2000; pp. 269–390. [Google Scholar]
- Kaemmer, D.; Afza, R.; Weising, K.; Kahl, G.; Novak, F.J. Oligonucleotide and Amplification Fingerprinting of Wild Species and Cultivars of Banana (Musa spp.). Nat. Biotechnol. 1992, 10, 1030–1035. [Google Scholar] [CrossRef] [PubMed]
- Gepts, P. The use of molecular and biochemical markers in crop evolution studies. Evol. Biol. 1993, 27, 15–94. [Google Scholar] [CrossRef]
- Bonierbale, M.; Guevara, C.; Dixon, A.G.O.; Ng, N.Q.; Asiedu, R.; Ng, S.Y.C. Cassava. In Biodiversity in trust: Conservation and use of plant genetic resources in CGIAR Centres; Fuccilo, D., Sears, L., Stapleton, P., Eds.; Cambridge University Press: Cambridge, UK, 1997; pp. 1–20. Available online: https://books.google.com.co/books?id=jLOiSPWy518C&lpg=PP1&hl=es&pg=PA1#v=onepage&q&f=false (accessed on 25 October 2020).
- Nassar, N.M.A. Cassava: Some Ecological and Physiological Aspects Related to Plant Breeding. An Article Published Online with Gene Conserve. 2005. Available online: http://www.geneconserve.pro.br/artigo024.pdf (accessed on 1 February 2021).
- Ecuador País de las Orquídeas Home Page. Por qué Ecuador es un País Megadiverso? Available online: http://visit.ecuador.travel/orquideas/index.php?option=com_tz_portfolio&view=article&id=66%3Por-que-ecuador-es-un-pais-megadiverso&catid=16&Itemid=110 (accessed on 1 February 2021).
- El-Sharkawy, M.A.; Cadavid, L.F. Genetic Variation Within Cassava Germplasm in Response to Potassium. Exp. Agric. 2000, 36, 323–334. [Google Scholar] [CrossRef]
- Jarvis, A.; Ramirez-Villegas, J.; Campo, B.V.H.; Navarro-Racines, C.E. Is Cassava the Answer to African Climate Change Adaptation? Trop. Plant Biol. 2012, 5, 9–29. [Google Scholar] [CrossRef]
- Aparecido, L.E.D.O.; Moraes, J.R.D.S.C.D.; de Meneses, K.C.; Lorençone, P.A.; Lorençone, J.A.; Souza, G.H.D.O.; Torsoni, G.B. Agricultural zoning as tool for expansion of cassava in climate change scenarios. Theor. Appl. Clim. 2020, 142, 1085–1095. [Google Scholar] [CrossRef]
- El-Sharkawy, M.A. Stress-Tolerant Cassava: The Role of Integrative Ecophysiology-Breeding Research in Crop Improvement. Open J. Soil Sci. 2012, 2, 162–186. [Google Scholar] [CrossRef] [Green Version]
- Eokogbenin, E.; Setter, T.L.; Eferguson, M.; Emutegi, R.; Eceballos, H.; Eolasanmi, B.; Efregene, M. Phenotypic approaches to drought in cassava: Review. Front. Physiol. 2013, 4, 93. [Google Scholar] [CrossRef] [Green Version]
- Oliveira, E.J.D.; Aidar, S.D.T.; Morgante, C.V.; Chaves, A.R.D.M.; Cruz, J.L.; Coelho Filho, M.A. Genetic pa-rameters for drought-tolerance in cassava. Pesq. Agropec. Bras. 2015, 50, 233–241. [Google Scholar] [CrossRef]
- Nuwamanya, E.; Patrick, R.R.; Ssetumba, M.; Samuel, K.; Joseph, F.H.; Yona, B. Biochemical and secondary metabolites changes under moisture and temperature stress in cassava (Manihot esculenta Crantz). Afr. J. Biotechnol. 2014, 13, 3173–3186. [Google Scholar] [CrossRef] [Green Version]
- Directive 2006/21/EC of the European Parliament and of the Council of 15 March 2006 on the Management of Waste from Extractive Industries and Amanding Directive 2004/35/EC. The European Parliament and the Council of the European Union: EU. 2006. Available online: http://www.legislation.gov.uk/eudr/2006/21/introduction (accessed on 23 September 2020).
- Elias, M.; McKey, D.; Panaud, O.; Anstett, M.C.; Robert, T. Traditional management of cassava morphological and genetic diversity by the Makushi Amerindians (Guyana; South America): Perspectives for on-farm conservation of crop genetic re-sources. Euphytica 2001, 120, 143–157. Available online: https://www.academia.edu/14714146/Traditional_management_of_cassava_morphological_and_genetic_diversity_by_the_Makushi_Amerindians_Guyana_South_America_perspectives_for_onfarm_conservation (accessed on 4 February 2021). [CrossRef]
- Burns, A.; Gleadow, R.; Cliff, J.; Zacarias, A.; Cavagnaro, T. Cassava: The Drought; War and Famine Crop in a Changing World. Sustainability 2010, 2, 3572–3607. [Google Scholar] [CrossRef] [Green Version]
- INEC. Instituto Nacional de Estadística y Censos Home Page. Available online: www.ecuadorencifras.com (accessed on 11 February 2021).
- Hinostroza-Garcia, F.; Cárdenas, F.M.; Álvarez, H.; Cobeña, G. INIAP Portoviejo Una Variedad de Yuca para Procesa-Miento. INIAP-SENESCYT, 3rd ed.; INIAP: Quito, Ecuador, 2012; p. 2. Available online: https://repositorio.iniap.gob.ec/handle/41000/1115 (accessed on 13 August 2021).
- Peñuela, M.; Schwarz, A.; Monteros-Altamirano, A.; Zurita-Benavides, M.; Cayapa, R.; Romero, N. Guía de la Agrobiodiver-sidad: Tres comunidades kichwa: Atacapi, Alto Tena y Pumayacu; Universidad Regional Amazónica IKIAM: Tena, Ecuador, 2016; p. 130. ISBN 978-9942-8638-1-2. Available online: https://issuu.com/43347/docs/agrobiodiversidad_web_060217/3 (accessed on 25 October 2020).
- Muñoz, L.E.A.; Java, J.Z. Conocimientos tradicionales Ticuna en la agricultura de chagra y los mecanismos innovadores para su protección. Bol. Mus. Para. Emílio Goeldi. Ciências Hum. 2012, 7, 417–433. [Google Scholar] [CrossRef] [Green Version]
- Willemen, L.; Scheldeman, X.; Cabellos, V.S.; Salazar, S.R.; Guarino, L. Spatial patterns of diversity and genetic erosion of traditional cassava (Manihot esculenta Crantz) in the Peruvian Amazon: An evaluation of socio-economic and environmental indicators. Genet. Resour. Crop. Evol. 2007, 54, 1599–1612. [Google Scholar] [CrossRef]
- Duputié, A.; Massol, F.; David, P.; Haxaire, C.; McKey, D. Traditional Amerindian cultivators combine directional and ideotypic selection for sustainable management of cassava genetic diversity. J. Evol. Biol. 2009, 22, 1317–1325. [Google Scholar] [CrossRef] [PubMed]
- Boster, J. A comparison of the diversity of Jivaroan Gardens with that of the tropical forest. Hum. Ecol. 1983, 11, 47–68. [Google Scholar] [CrossRef]
- Parra-Quijano, M.; Iriondo, J.; Torres, E. Ecogeographical land characterization maps as a tool for assessing plant adaptation and their implications in agrobiodiversity studies. Genet. Resour. Crop. Evol. 2011, 59, 205–217. [Google Scholar] [CrossRef]


| Variables | CV * | Min | Max | Mean ± SD * |
|---|---|---|---|---|
| Total fresh weight of storage roots per plant, kg | 61.22 | 0.84 | 22.00 | 005.85 ± 3.58 |
| Height to first branching, cm | 42.67 | 10.00 | 233.33 | 096.87 ± 41.33 |
| Length of storage root, cm | 27.04 | 23.20 | 84.00 | 044.97 ± 12.16 |
| Plant height, cm | 24.63 | 83.33 | 393.33 | 251.03 ± 61.82 |
| Diameter of storage root, cm | 24.26 | 3.00 | 17.20 | 009.31 ± 2.30 |
| Distance between leaf scars, cm | 19.48 | 0.28 | 0.70 | 000.49 ± 0.10 |
| Width of leaf lobe, cm | 16.19 | 2.48 | 8.57 | 005.61 ± 0.91 |
| Number of leaf lobes | 14.18 | 5.00 | 11.00 | 007.76 ± 1.10 |
| Length of leaf lobe, cm | 13.13 | 11.95 | 29.90 | 020.37 ± 2.67 |
| Variables | Index of Deviation from the Mode | Mode |
|---|---|---|
| Pubescence on apical leaves | 0.96 | Absent |
| Colour of apical leaves | 0.88 | Light green |
| Length of root peduncle | 0.86 | Short |
| Colour of root cortex | 0.76 | Purple |
| Initial vigour of the plant | 0.70 | Good |
| Petiole colour | 0.67 | Red with green |
| Colour of end branches of adult plant | 0.62 | Dark green |
| Plant earliness | 0.62 | Intermediate |
| Shape of central leaflet | 0.56 | Elliptical lanceolate |
| Colour of stem epidermis | 0.53 | Dark green |
| Flowering | 0.52 | Present |
| Texture of root epidermis | 0.45 | Rough |
| Shape of root | 0.43 | Conical-cylindrical |
| Root constrictions | 0.38 | Absent |
| Colour of root pulp (parenchyma) | 0.26 | White |
| Cortex: ease of peeling | 0.25 | Easy |
| Shape of plant | 0.11 | Umbrella |
| Leaf colour | 0.07 | Dark green |
| Variables | CV | Min | Max | Mean ± SD |
|---|---|---|---|---|
| Altitude, m a.s.l. | 78.59 | 5.00 | 1566.00 | 360.99 ± 283.69 |
| Average annual temperature °C | 5.09 | 18.40 | 26.00 | 24.04 ± 1.22 |
| Isothermal *, °C | 4.73 | 7.00 | 9.00 | 8.32 ± 0.39 |
| Temperature seasonality **, °C | 26.08 | 31.70 | 92.60 | 57.11 ± 14.89 |
| Maximum temperature for warmest month, °C | 4.30 | 24.10 | 31.90 | 29.92 ± 1.29 |
| Minimum temperature for coldest month, °C | 6.64 | 12.90 | 21.80 | 18.35 ± 1.22 |
| Annual temperature range ***, °C | 6.10 | 7.80 | 13.60 | 11.57 ± 0.71 |
| Average temperature for the coldest trimester (coldest three months), °C | 5.14 | 17.60 | 25.60 | 23.29 ± 1.20 |
| Average temperature for the quarter with most rainfall (three rainiest months), °C | 6.23 | 18.30 | 26.50 | 24.32 ± 1.52 |
| The average temperature for the hottest trimester (hottest three months), °C | 5.42 | 18.70 | 26.50 | 24.72 ± 1.34 |
| Maximum temperature for January, °C | 4.54 | 23.00 | 31.00 | 29.08 ± 1.32 |
| Maximum temperature for February, °C | 4.42 | 23.10 | 31.20 | 29.19 ± 1.29 |
| Maximum temperature for March, °C | 5.04 | 23.20 | 31.50 | 29.39 ± 1.48 |
| Maximum temperature for April, °C | 5.37 | 23.30 | 31.90 | 29.44 ± 1.58 |
| Maximum temperature for May, °C | 4.82 | 23.10 | 31.00 | 28.83 ± 1.39 |
| Maximum temperature for June, °C | 4.35 | 22.40 | 30.10 | 27.96 ± 1.22 |
| Maximum temperature for July, °C | 4.47 | 21.90 | 29.90 | 27.76 ± 1.24 |
| Minimum temperature for January, °C | 7.29 | 14.00 | 22.60 | 19.62 ± 1.43 |
| Minimum temperature for February, °C | 7.65 | 14.10 | 22.80 | 19.71 ± 1.51 |
| Minimum temperature for March, °C | 7.96 | 14.20 | 22.90 | 19.94 ± 1.59 |
| Minimum temperature for April, °C | 7.70 | 14.20 | 23.00 | 19.86 ± 1.53 |
| Minimum temperature for May, °C | 7.05 | 14.10 | 23.00 | 19.62 ± 1.38 |
| Minimum temperature for June, °C | ||||
| Minimum temperature for July, °C | 7.16 | 13.30 | 22.50 | 19.11 ± 1.37 |
| Minimum temperature for August, °C | 6.93 | 13.00 | 22.20 | 18.61 ± 1.29 |
| Minimum temperature for September, °C | 6.67 | 12.90 | 22.10 | 18.35 ± 1.22 |
| Minimum temperature for October, °C | 6.19 | 13.1 | 21.8 | 18.62 ± 1.15 |
| Minimum temperature for November, °C | 6.21 | 13.60 | 22.00 | 18.91 ± 1.17 |
| Minimum temperature for December, °C | 6.13 | 13.80 | 22.30 | 19.32 ± 1.18 |
| January average temperature, °C | 5.48 | 18.50 | 26.20 | 24.32 ± 1.33 |
| February average temperature, °C | 5.53 | 18.60 | 26.30 | 24.42 ± 1.31 |
| March average temperature, °C | 6.13 | 18.70 | 26.60 | 24.64 ± 1.51 |
| April average temperature, °C | 6.22 | 18.70 | 26.80 | 24.62 ± 1.53 |
| May average temperature, °C | 5.63 | 18.60 | 26.40 | 24.20 ± 1.36 |
| June average temperature, °C | 5.40 | 17.80 | 26.00 | 23.50 ± 1.27 |
| July average temperature, °C | 5.32 | 17.40 | 25.70 | 23.16 ± 1.23 |
| August average temperature, °C | 4.90 | 17.80 | 25.70 | 23.41 ± 1.15 |
| October average temperature, °C | 4.56 | 18.60 | 25.80 | 23.97 ± 1.09 |
| December average temperature, °C | 4.76 | 18.70 | 26.10 | 24.31 ± 1.16 |
| Precipitation during the hottest quarter (the three hottest months), mm | 40.58 | 193.00 | 1615.00 | 809.62 ± 328.56 |
| Average precipitation for May, mm | 66.52 | 9.00 | 470.00 | 220.02 ± 146.36 |
| Average precipitation for August, mm | 101.75 | 2.00 | 349.00 | 113.67 ± 115.66 |
| Average precipitation for October, mm | 99.89 | 3.00 | 367.00 | 144.52 ± 144.37 |
| Sand content in the soil, % | 41.64 | 11.00 | 72.00 | 27.43 ± 13.98 |
| Sand content in the subsoil, % | 50.96 | 13.00 | 70.00 | 27.43 ± 13.98 |
| Gravel content in the subsoil, % | 217.40 | 0.00 | 49.00 | 6.03 ± 13.11 |
| Variables | Gradient/Soil Type Deviation Index | State/Type (Mode) |
|---|---|---|
| Slope | 0.28 | Flat |
| Total exchangeable bases in the soil surface | 0.82 | High fertility |
| Organic carbon content in the soil surface | 0.49 | Low |
| Cation exchange capacity in the surface soil | 0.76 | Low |
| Cation exchange capacity of the clay in the surface soil | 0.59 | Very high |
| Reference of the apparent density * of the surface soil | 0.48 | Volcanic soil horizons |
| Apparent density * reference of the subsoil | 0.28 | Volcanic soil horizons |
| pH of the surface soil in a water and soil solution | 0.79 | Slightly acidic |
| pH of the subsoil in a water and soil solution | 0.68 | Slightly acidic |
| Base saturation in the surface soil | 0.72 | A very acidic soil |
Publisher’s Note: MDPI stays neutral with regard to jurisdictional claims in published maps and institutional affiliations. |
© 2021 by the authors. Licensee MDPI, Basel, Switzerland. This article is an open access article distributed under the terms and conditions of the Creative Commons Attribution (CC BY) license (https://creativecommons.org/licenses/by/4.0/).
Share and Cite
Monteros-Altamirano, Á.; Tapia, C.; Paredes, N.; Alulema, V.; Tacán, M.; Roura, A.; Lima, L.; Sørensen, M. Morphological and Ecogeographic Study of the Diversity of Cassava (Manihot esculenta Crantz) in Ecuador. Agronomy 2021, 11, 1844. https://doi.org/10.3390/agronomy11091844
Monteros-Altamirano Á, Tapia C, Paredes N, Alulema V, Tacán M, Roura A, Lima L, Sørensen M. Morphological and Ecogeographic Study of the Diversity of Cassava (Manihot esculenta Crantz) in Ecuador. Agronomy. 2021; 11(9):1844. https://doi.org/10.3390/agronomy11091844
Chicago/Turabian StyleMonteros-Altamirano, Álvaro, Cesar Tapia, Nelly Paredes, Valeria Alulema, Marcelo Tacán, Alberto Roura, Luis Lima, and Marten Sørensen. 2021. "Morphological and Ecogeographic Study of the Diversity of Cassava (Manihot esculenta Crantz) in Ecuador" Agronomy 11, no. 9: 1844. https://doi.org/10.3390/agronomy11091844