The EBRAINS NeuroFeatureExtract: An Online Resource for the Extraction of Neural Activity Features From Electrophysiological Data
 Luca L. Bologna
 Roberto Smiriglia
 Dario Curreri
 Michele Migliore
- Institute of Biophysics, National Research Council, Palermo, Italy
The description of neural dynamics, in terms of precise characterizations of action potential timings and shape and voltage related measures, is fundamental for a deeper understanding of the neural code and its information content. Not only such measures serve the scientific questions posed by experimentalists but are increasingly being used by computational neuroscientists for the construction of biophysically detailed data-driven models. Nonetheless, online resources enabling users to perform such feature extraction operation are lacking. To address this problem, in the framework of the Human Brain Project and the EBRAINS research infrastructure, we have developed and made available to the scientific community the NeuroFeatureExtract, an open-access online resource for the extraction of electrophysiological features from neural activity data. This tool allows to select electrophysiological traces of interest, fetched from public repositories or from users’ own data, and provides ad hoc functionalities to extract relevant features. The output files are properly formatted for further analysis, including data-driven neural model optimization.
Introduction
Data analysis of electrophysiological traces is at the core of a wide range of studies in the neuroscientific field. On the one hand, the characterization of neural activity is a necessary step for understanding the behavior of individual cells (Petersen, 2017) and ensembles of neurons (Shahaf and Marom, 2001) and its correlates: the sensory, cognitive and behavioral counterpart of an electrophysiological measure (Rizzolatti and Craighero, 2004; Johansson and Flanagan, 2009). On the other hand, experimental findings are instrumental for the construction of detailed neural models, able to robustly and accurately reproduce the observed activity (Migliore et al., 2018). More specifically, the broader is the range of electrophysiological features extracted from the experimental observations (e.g., action potential amplitude and width, Inter Spike Intervals, resting potential, etc.), the more precise and biophysically detailed is the computational model based on those features.
Nowadays, the computational neuroscience community can rely on an increasing number of online, freely accessible tools and platforms for neural model building and collaborative sharing. Well-established, open and free simulation environments such as NEURON (Hines and Carnevale, 1997), Nest (Gewaltig and Diesmann, 2007; Eppler et al., 2009), and Brian (Goodman and Brette, 2008; Stimberg et al., 2019) are being constantly maintained and upgraded with new functionalities and fervent user communities contribute to their improvement with useful feedbacks. In addition, several platforms are available to the community, for model sharing, testing, running and publication, that are increasingly embodying an open access approach. For example, ModelDB1 (Branco et al., 2010; McDougal et al., 2015, 2017) has become a reference portal for computational neuroscientists aiming at archiving and sharing their work. The platform allows to: (1) upload any kind of neural models -which must be provided with ad hoc scripts to test their correct functioning; (2) label them; (3) run them on a dedicated simulation platform; (4) annotate, for each model, the relevant and/or relative scientific publications. Another collaborative public online resource is OpenSourceBrain (OSB) (Gleeson et al., 2019). OSB provides visualization, simulation, analysis, and sharing tools and services for standardized neural models. Thanks to the model description languages NeuroML (Gleeson et al., 2010; Cannon et al., 2014) and PyNN (Davison et al., 2009), models are defined in standardized formats that are automatically read by OSB for simulation and model details visualization. With respect to scientific data sharing, a number of platforms have been recently created (e.g., DANDI,2 Zenodo,3 Dryad,4 FigShare5) and the Neurodata Without Borders6 (Teeters et al., 2015) ecosystem is fostering the development of tools and services for data analysis and visualization7 ,8. Additionally, data analysis toolkits for electrophysiological measures are available -such as the Elephant software (Denker et al., 2018)- and scientific languages and environments (e.g., MATLAB, R, Python) already provide the necessary libraries for data processing (including analysis and visualization). Furthermore, the Allen Institute9 provides comprehensive datasets of neuroscientific images and electrophysiological data that users can explore, download and analyze thanks to a dedicated Software Development Kit (SDK). Also, the Knowledge Graph (KG) of the EBRAINS research infrastructure10 is promisingly building a reference portal for data -as well as models and software- produced in the framework of the Human Brain Project (HBP) (Amunts et al., 2016) and converging into the EBRAINS European research infrastructure.11 Unfortunately, to the best of our knowledge, none of the existing platforms allows automated online, point-and-click services for electrophysiological feature extraction. Indeed, the Allen Institute portal provides feature values on sets of neural activity data, but the number of features is limited and the extraction process cannot be performed online but only after downloading the data and launching the appropriate routines locally (via the above-mentioned Allen SDK).
In order to address these challenges, we built a web-based resource, the EBRAINS NeuroFeatureExtract (NFE),12 that not only allows to extract electrophysiological features from neural activity data, but also provides users with a user-friendly point-and-click interface for uploading their own data and feed them to the extraction workflow. The web application leverages the Electrophys Feature Extract Library (eFEL) and the BluePyEfe library (see section Methods/eFEL and Methods/BluePyEfe) and provides result files properly formatted for further analysis (e.g., neural model optimization via the BluePyOpt optimization library, see section “Methods”).
Methods
Overview
The EBRAINS NeuroFeatureExtract consists of a full stack web-based application implemented via the Python-based Django web framework13 and deployed on a dedicated Virtual Machine (VM) hosted on the CINECA supercomputing center14 and accessible/configurable through the OpenStack interface.15 The VM configuration presents 24GB RAM and 8 VirtualCPU (VCPU).
The web application consists of a frontend (client-side) and a backend (server-side) components that, despite residing on the same VM, are logically separated and communicate through dedicated Representational State Transfer (REST) Application Programmer Interface (API) calls. The frontend provides a user-friendly GUI that allows an easy point-and-click interaction with the tool functionalities and is implemented via HTML, Javascript, and CSS code. The backend serves the frontend requests by running the data fetching and management, the feature extraction operations and the result files creation; it is entirely developed in Python.16 The server manages the requests by creating dedicated folder trees, based on the file system organization (i.e., no sandbox process is spun off; the system resources are used instead), any time the NFE is accessed and initialized. All data management operations are performed by a system user with limited access and privileges to the VM resources, in order to limit security vulnerabilities. Finally, data and results are periodically removed (see section Methods/File formats).
The web server fulfilling the client requests is NGINX17 used in conjunction with the uWSGI web interface18 and the communication protocol used for accessing the web application is the Hypertext Transfer Protocol Secure (HTTPS). The web application is part of a larger Django project that includes a web resource called Hodgkin-Huxley Neuron Builder (see section Usage/Extracted features) in which the NFE is integrated. The code is available to the scientific community (Gleeson et al., 2017) on GitHub, under the LGPLv3 license.19
eFEL
The NFE core operations are based on the eFEL library, which provides the computational engine upon which the analysis of the electrophysiological traces relies. The software package is available, for command line installation, on PyPi,20 and its code and documentation are freely accessible on GitHub21 and ReadTheDocs,22 respectively. The core of the eFEL consists of a set of C++ libraries, which perform the low-level computations. This layer is exposed to the user via a wrapper built through a set Python API functions. No GUI is provided to the user.
The eFEL library provides the scientific community with a tool allowing the automatic extraction of electrophysiological features from in vivo, in vitro, and in silico neural activity recordings. The library allows to select among more than one hundred different features which are grouped by the following three categories: (1) Spike event features; (2) Spike shape features; (3) Voltage features.
Overall, spike event features provide information on the timing of the detected action potentials (AP, or spikes), such as the inverse of the timestamp of the first and last spikes, the inverse of the first to fifth Inter Spike Intervals (ISI, namely the time between two consecutive spikes) and the spike half width. Spike shape features provide information on the AP shape, such as the AP widths and heights and the AP mean amplitude. Finally, the voltage features report voltage related indices, such as the voltage base value (i.e., the membrane resting potential) and the maximum voltage during a stimulus.
In order to familiarize with the tool and to verify the correctness of the computed results, users can run, on a local machine, the unit tests included in the eFEL Github repository.
BluePyEfe
The output of the NFE consists of a set of .pdf and text (i.e., .json and .txt) files that display the neural activity and stimulus traces, report statistics on the extracted features and contain recording protocol information properly formatted for further processing (see section Usage/Results). Since the eFEL library APIs return the computed features in the form of Python value arrays and delegate to the user further post hoc analysis and data formatting and printing, we used an eFEL-wrapper Python package named BluePyEfe, in order to generate a consistent set of output files. This library is entirely built in Python and is available for installation on PyPi.23 The source code of the library is also publicly available on GitHub.24
The BluePyEfe workflow consists of three main steps: (1) the electrophysiological data are read and appropriately grouped and organized in Python dictionaries; (2) the features selected by the user are extracted and their mean values computed; the computation of the average values is first performed on data referring to the same cell; then, the individual cell mean values are averaged, in order to infer the global behavior of the provided data; (3) several output files are generated that report: the above-mentioned mean values (per cell and overall), the plot of the raw stimulus and membrane voltage traces, the values of individual feature extracted (see section Usage/Results).
As mentioned for the eFEL library, also the BluePyEfe includes a series of unit tests that the users can start from for familiarizing with the tool and verifying the generated output.
File Formats
The NFE allows the users to select data from a public dataset (currently provided by HBP members and collaborators but not limited to these contributors) and/or to upload their own data (see section Usage/Upload).
The platform is as much as possible agnostic with respect to the data format of the files the user can upload and we are aiming to extend the data upload functionality to a set as large as possible (e.g., all electrophysiological data formats accepted by the BluePyEfe and the Neo package; Garcia et al., 2014). Currently, the file formats accepted for upload are .abf (Axon Binary File), which must be uploaded together with a metadata file in .json format) and .json (i.e., text files with special formatting). The latter file type is structured in such a way to guarantee a fast access to both recorded data and related metadata. In the .json data file, the information is structured into dictionaries where the membrane voltage values and the timing information on the stimulus (i.e., start and end time of the delivered current) are grouped by stimulus amplitudes. A detailed description of the accepted file formats is available in the NFE’s Guidebook.25
The public data available in the NFE are currently stored in a dedicated Object Storage container at CSCS (Swiss National Supercomputing Centre) in .json format and are accessible from the NFE in read-only mode. A subset of the data collection contributed by HBP members and collaborators are also available (in their original format), stored, categorized and indexed in the KG, which allows public contribution from the broader neuroscientific community and is expected to become a standard reference for data publication and sharing. A tight integration between the NFE and the KG is currently under development and will disclose to the NFE’s users a continuous and seamless access to a plethora of electrophysiological data (see section “Discussion”).
Usage
Overview
The NFE GUI consists of a number of point-and-click user friendly HTML pages that guide the user through the complete feature extraction workflow (see Figure 1). On the Overview page, a short introduction to the tool is given and a quick-tour section can be unfolded with basic guidelines to the use of the web application. On the right side of the header panel, three icons are provided, which redirect to the NFE’s homepage, the NFE’s Guidebook and a video tutorial, respectively.
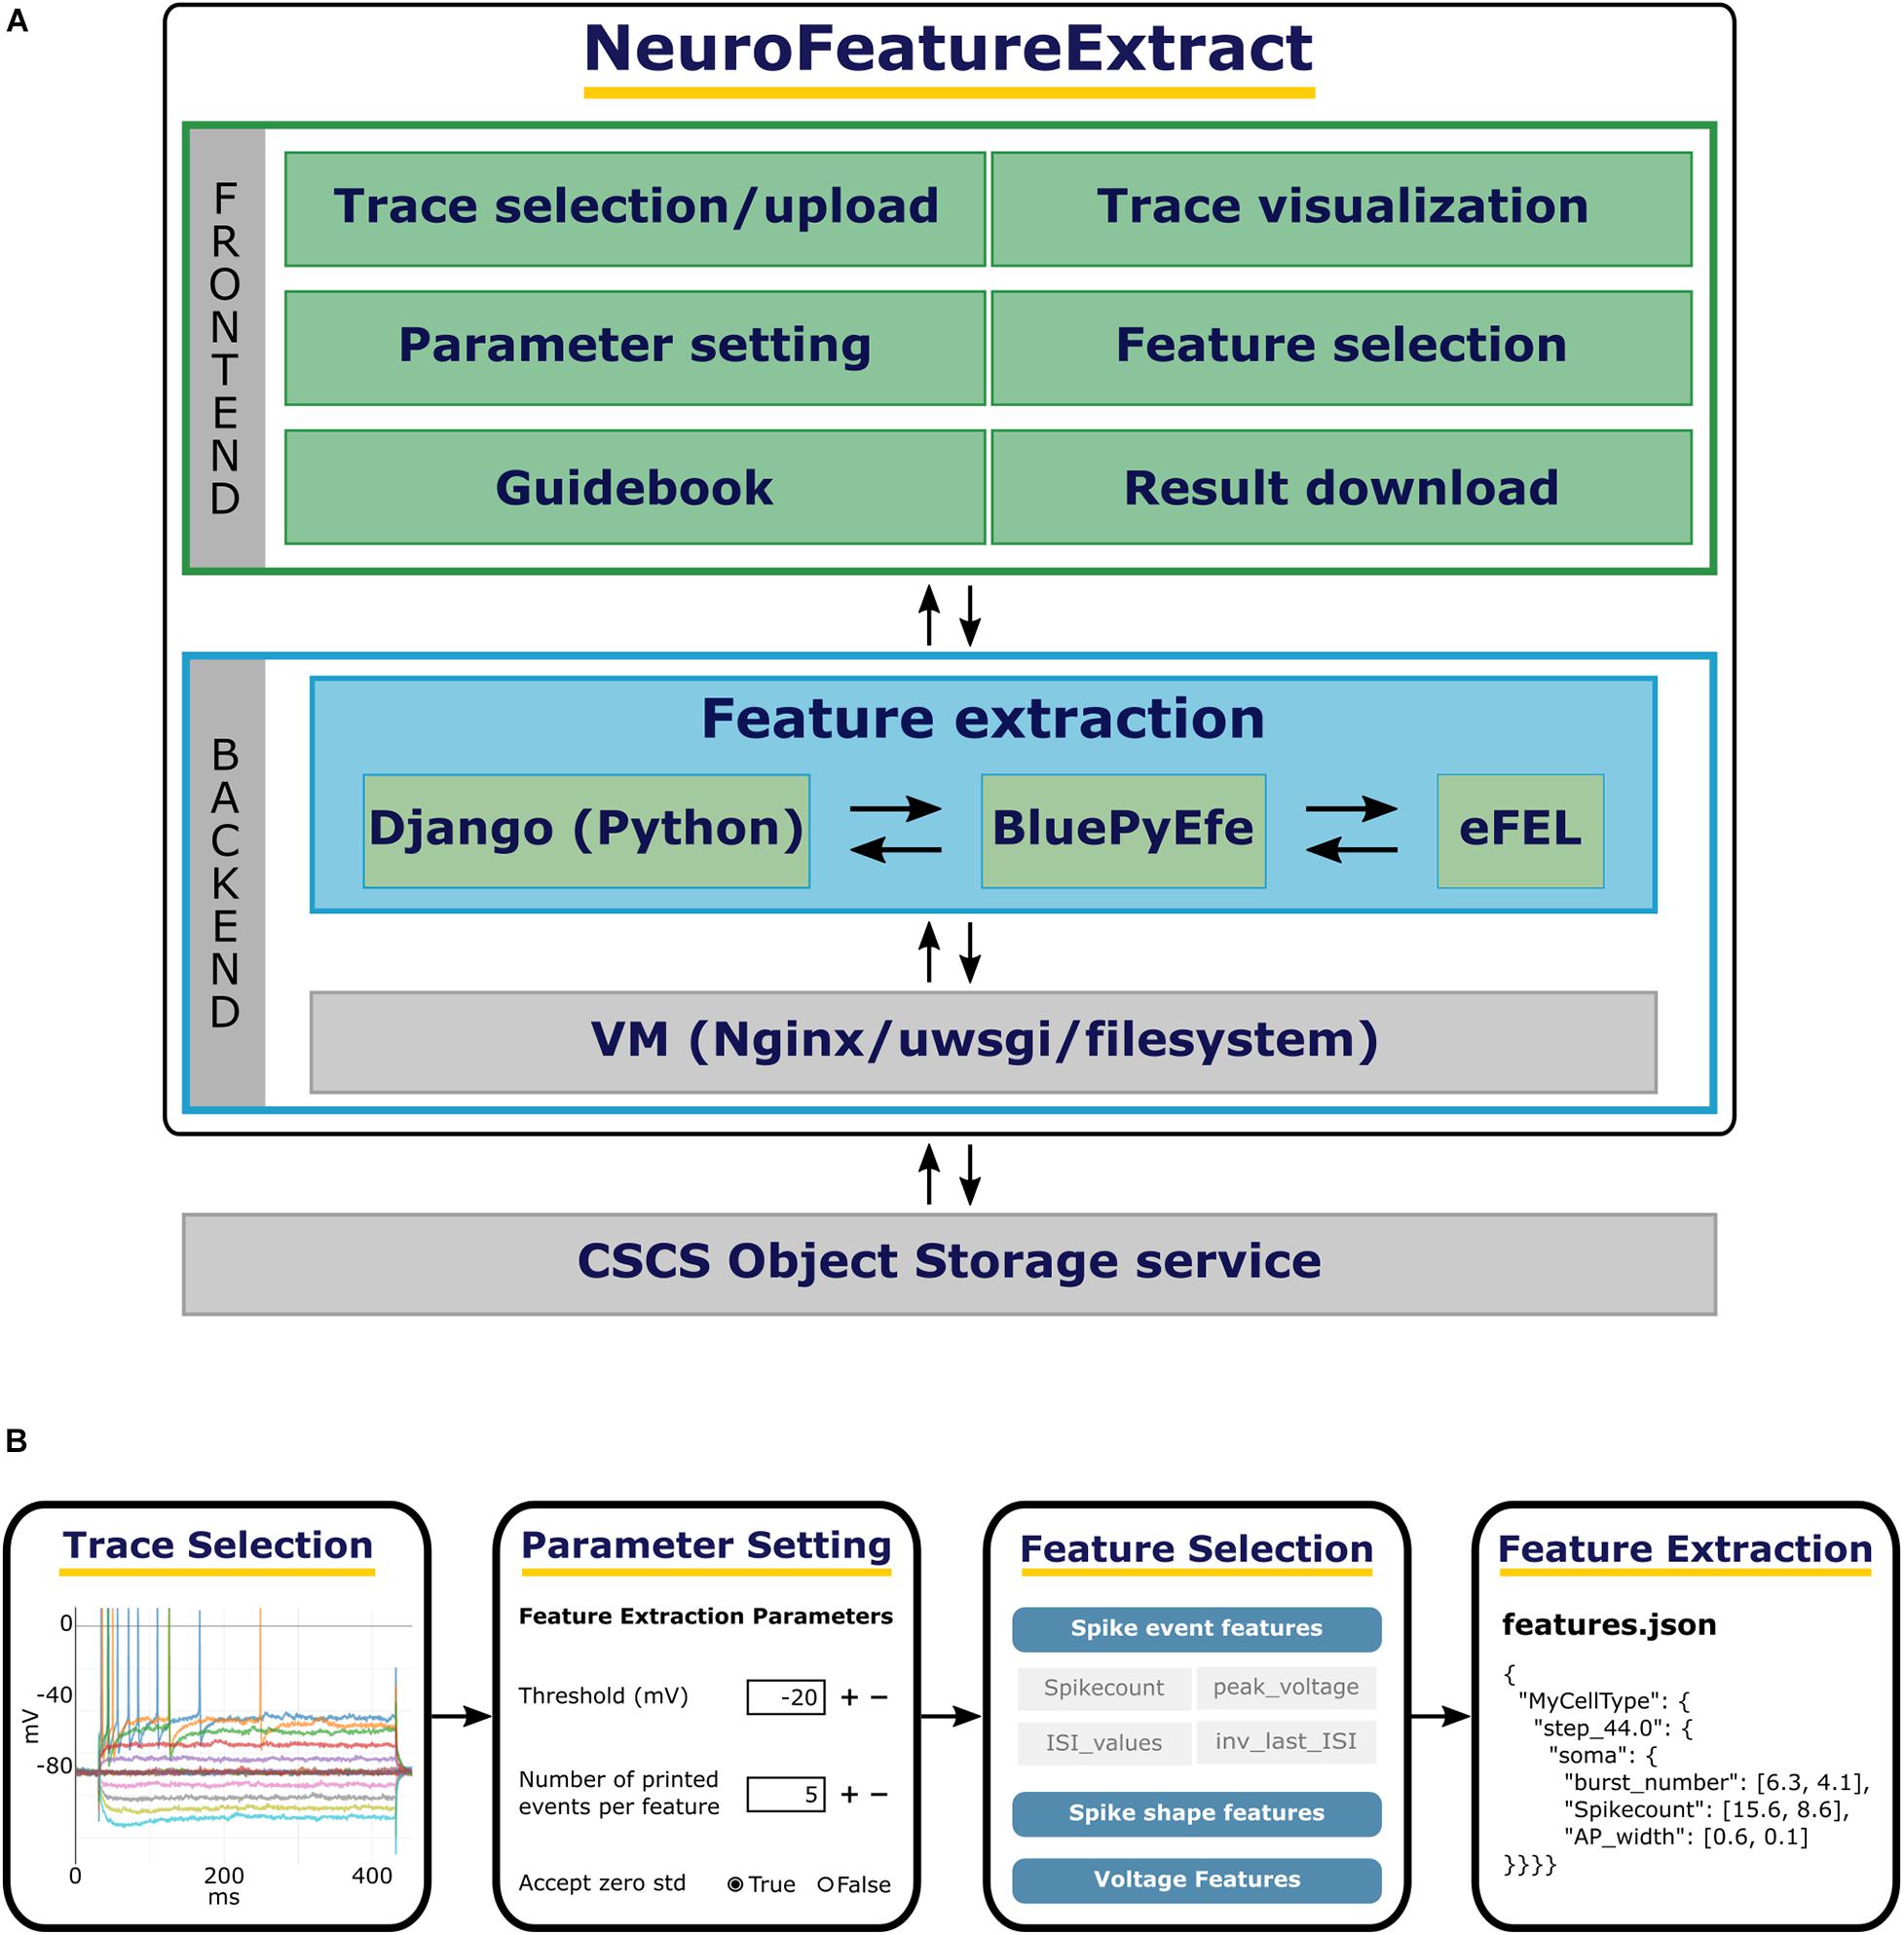
Figure 1. The NFE architecture and workflow. (A) From top to bottom: the NFE’s frontend provides a point-and-click interface to execute the trace selection, upload, visualization as well as the parameter setting and feature selection operations. The backend performs the feature extraction on the selected traces via the BluePyEfe library which in turn leverages the eFEL software. The traces made available to the users are stored in a CSCS container. (B) From left to right: individual traces are selected from the public dataset or from the files uploaded by the user; if needed, the extraction parameters are appropriately set; the features of interest are selected and, finally, the result files are downloaded and used for further analysis or model optimization.
Data Selection
The “Trace selection” page is divided into three sections. The top panel allows to configure a number of extraction parameters, which will be fed to the BluePyEfe instance on the backend server side. The central section allows to select the electrophysiological traces to analyze. The current list contains public data and is constantly updated with the neuroscientific community contributions. The bottom section allows the users to upload and use their own electrophysiological data in the feature extraction process.
Feature Extraction Parameters
Three feature extraction parameters can be currently set by the user.
The Threshold (mV) parameter is the membrane potential threshold adopted for action potential detection and is particularly useful when a hard threshold (usually set to -20 or -30 mV) is not able to detect all the recorded action potentials (see section “Results”). The Accept zero std parameter is a flag (i.e., can be either True or False); if set to False it will collect (for final averaging and printing, see section Methods/BluePyEfe) only mean feature values that present either a mean value of zero or a standard deviation value greater than zero; otherwise, if set to True, all mean values (different than not a number -or “nan”) will be taken into account. We introduced this functionality in the BluePyEfe (and exposed it through the NFE GUI) because, while in general mean and standard deviation values make sense (and are strictly defined) when computed from a pool of samples, in specific cases, the users might want to account for features (e.g., the Spikecount) extracted from individual traces, for analysis purposes. Finally, the Convert zero feature value applies a post extraction data correction on the computed feature values. The user is provided with two dropdown menus on the GUI. The leftmost menu presents two options: nan and stim_end while the rightmost one displays a list of selectable features (see Figure 2A). When either nan or stim_end is selected, the values of the checked features are converted to nan or to the stimulus end time, respectively, if their value is zero after the feature extraction has been performed. This functionality is only available for a subset of features and is instrumental in the fine tuning of the model optimization process that the user might want to undergo by adopting the NFE result files (see section Usage/Extracted features).
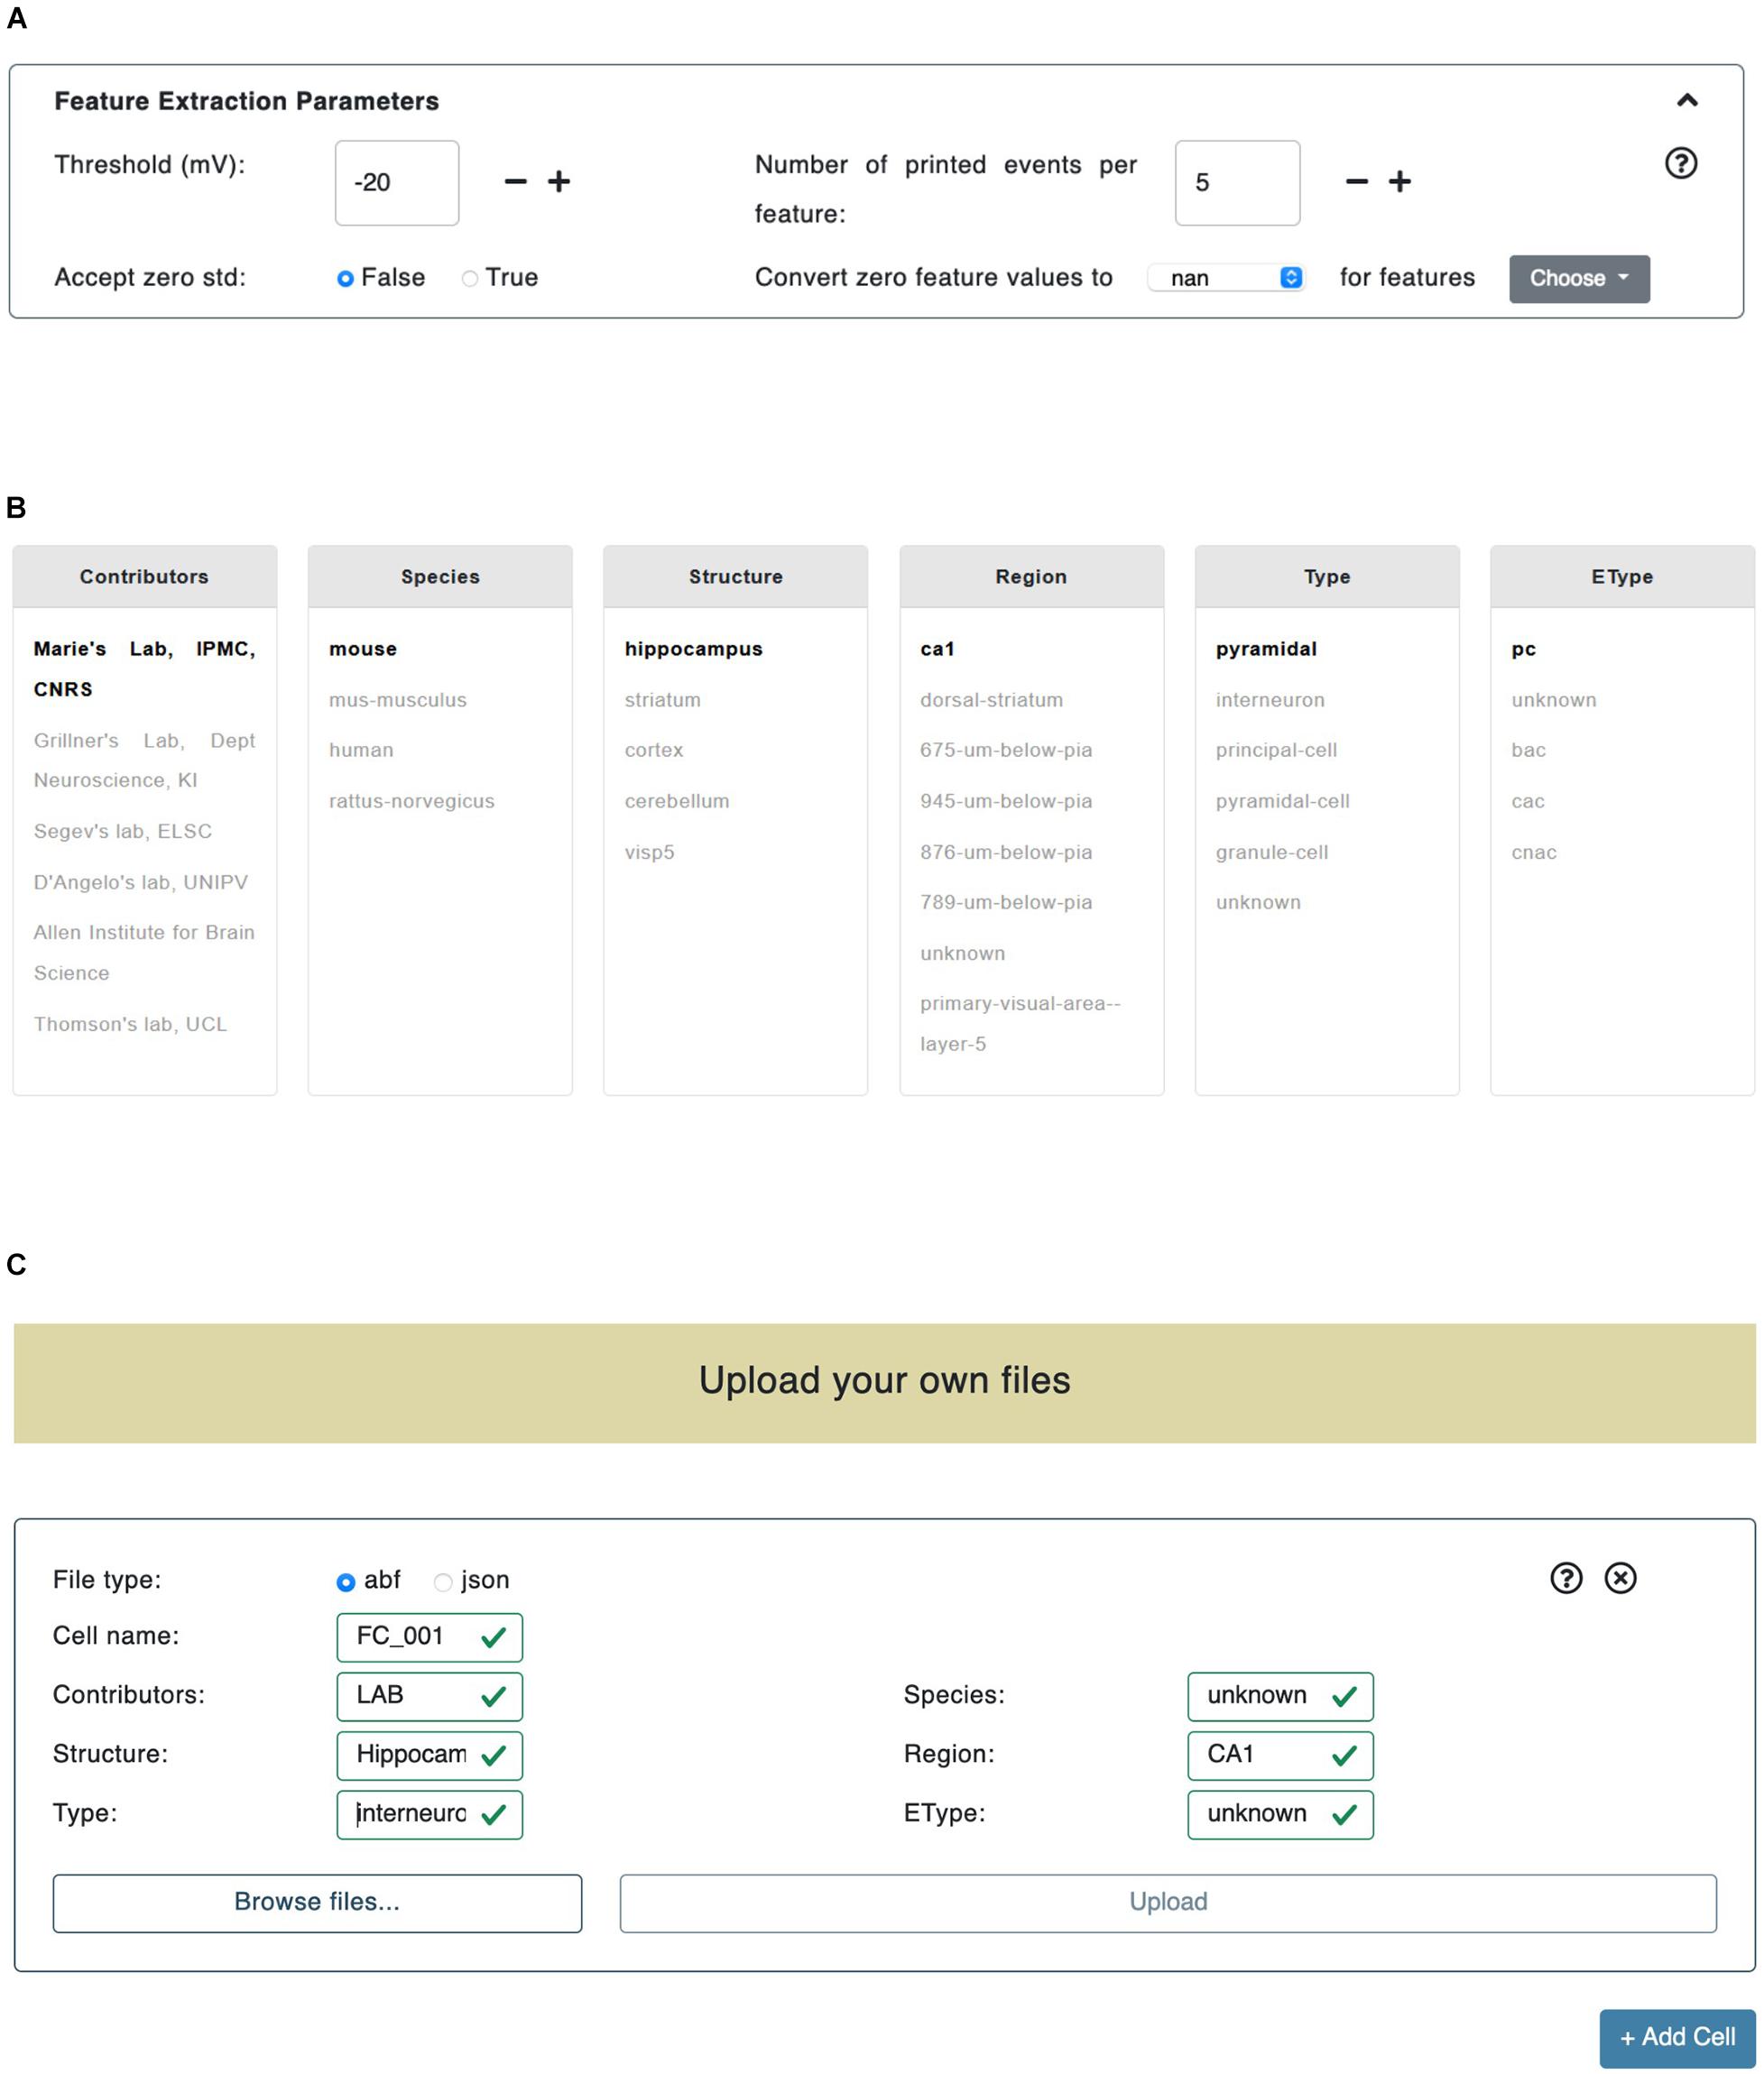
Figure 2. Trace selection page. (A) In the “Feature Extraction Parameters” panel the users can set the parameters adopted in the feature extraction process. (B) The data files provided by HBP members and collaborators are categorized by metadata (e.g., Contributors, Species, Structure, etc.). By clicking on a specific key, all the remaining fields are automatically updated (i.e., their color is changed) in order to reflect the available choices left to the users. (C) The upload panel allows to upload either .abf or .json files. Any number of panels can be added (through the bottom-right “+Add Cell” button): all the files uploaded in a single panel are considered as recorded from the same cell.
Datasets
The central section of the Trace selection page allows the user to select the electrophysiological data to be used for the feature extraction from a pool of public data files. The recordings are grouped by six criteria: (1) Contributors (e.g., contributor names); (2) Species (e.g., human, rats, mice); (3) Structure (e.g., hippocampus, cerebellum, striatum); (4) Region (e.g., CA1, dorsal-striatum, primary visual area); (5) Type (e.g., interneurons, granule-cells, principal-cells), and (6) EType (e.g., continuous adapting cells or cAC, continuous non-adapting cells or cNAC) (see Figure 2B). When a value, belonging to any of the above-mentioned categories, is selected, the metadata of the data files fulfilling the selection are parsed in order to find any match with the remaining categories. The entries, in any category other than the most recently selected, that are not found in the metadata, are grayed out in the panel. Also, if after a first selection in a given category, only one match is found in another selection box, the latter is set to bold. This allows to guide the users in their further selections. An example of this logic is given in Figure 2B, where the Contributors/Marie’s Lab, IPMC, CNRS entry has been selected. The datasets are continuously being updated and tightly linked to the KG (see section Methods/File formats). We encourage the NFE users to register their data in the KG and, successively, make them publicly available in the dedicated NFE data section. The KG data registration is implemented through an agile curation process and is supported upon request at support@ebrains.eu.
Upload
In addition to the selection of contributed electrophysiological traces, users can also upload their own data through the NFE GUI. Uploaded files are inserted through dedicated panels which are dynamically created/deleted via ad hoc buttons (see Figure 2C). Once a new panel is displayed, the type of data that will be uploaded through that panel has to be specified (at the moment two formats are available: .abf and .json, see section Methods/File formats). All the files uploaded via a specific panel will be considered as referring to (namely, being recorded from) the same cell: this will allow to group the statistics of cell-specific features into cell-specific files (see section “Results”). In order to specify the type of cell the uploaded files refer to, a number of fields must be compulsorily filled out (e.g., Cell id, Species, Structure, Region, etc.). The neural traces uploaded by the users and the public ones can be inclusively selected for feature extraction. The files uploaded by the users are only temporarily stored on the server hosting the NFE, as this is a technical requirement for the execution of the workflow. At execution time, they are not accessible by any user other than the one who uploaded them in that every feature extraction process has its own unique session variables that allow to create a dedicated folder structure in which data, results and temporary files are stored (see section “Overview”). All uploaded files, as well as results and temporary data, are deleted from the server 2 h after they have been created (this time window is suitable to give the users enough time to complete the workflow) and are not anymore retrievable by either the NFE or data owners (a new upload is required if the users want to perform further analysis—or repeat previous ones—on the same data).
Trace Visualization and Selection
A user-friendly interface is available for the selection of the electrophysiological traces to be processed. All the traces belonging to the same recording are collectively visualized in the same plot, which is in turn embedded into a dedicated panel showing the name of the relative file and the property of the cell from which the neural activity has been recorded. Different colors are adopted for different traces and individual trace labels are coupled with the stimulus amplitude (and unit) delivered during the signal acquisition. By clicking on a label, the corresponding trace is selected and collected for further processing (i.e., the feature extraction procedure, see Figure 3). For every recording, a voltage correction value can be set in case a holding voltage has been applied during the experiment. When applied, all the traces belonging to the same file are shifted by the inserted value. This functionality is part of the BluePyEfe software library and has been implemented (and exposed in the NFE) because, in many cases, recordings are carried out and stored with a membrane voltage shifted to zero (for experimental reasons) and this implies that a standard action potential detection threshold (of about -20 or -30 mV) might fail in detecting the recorded spikes.
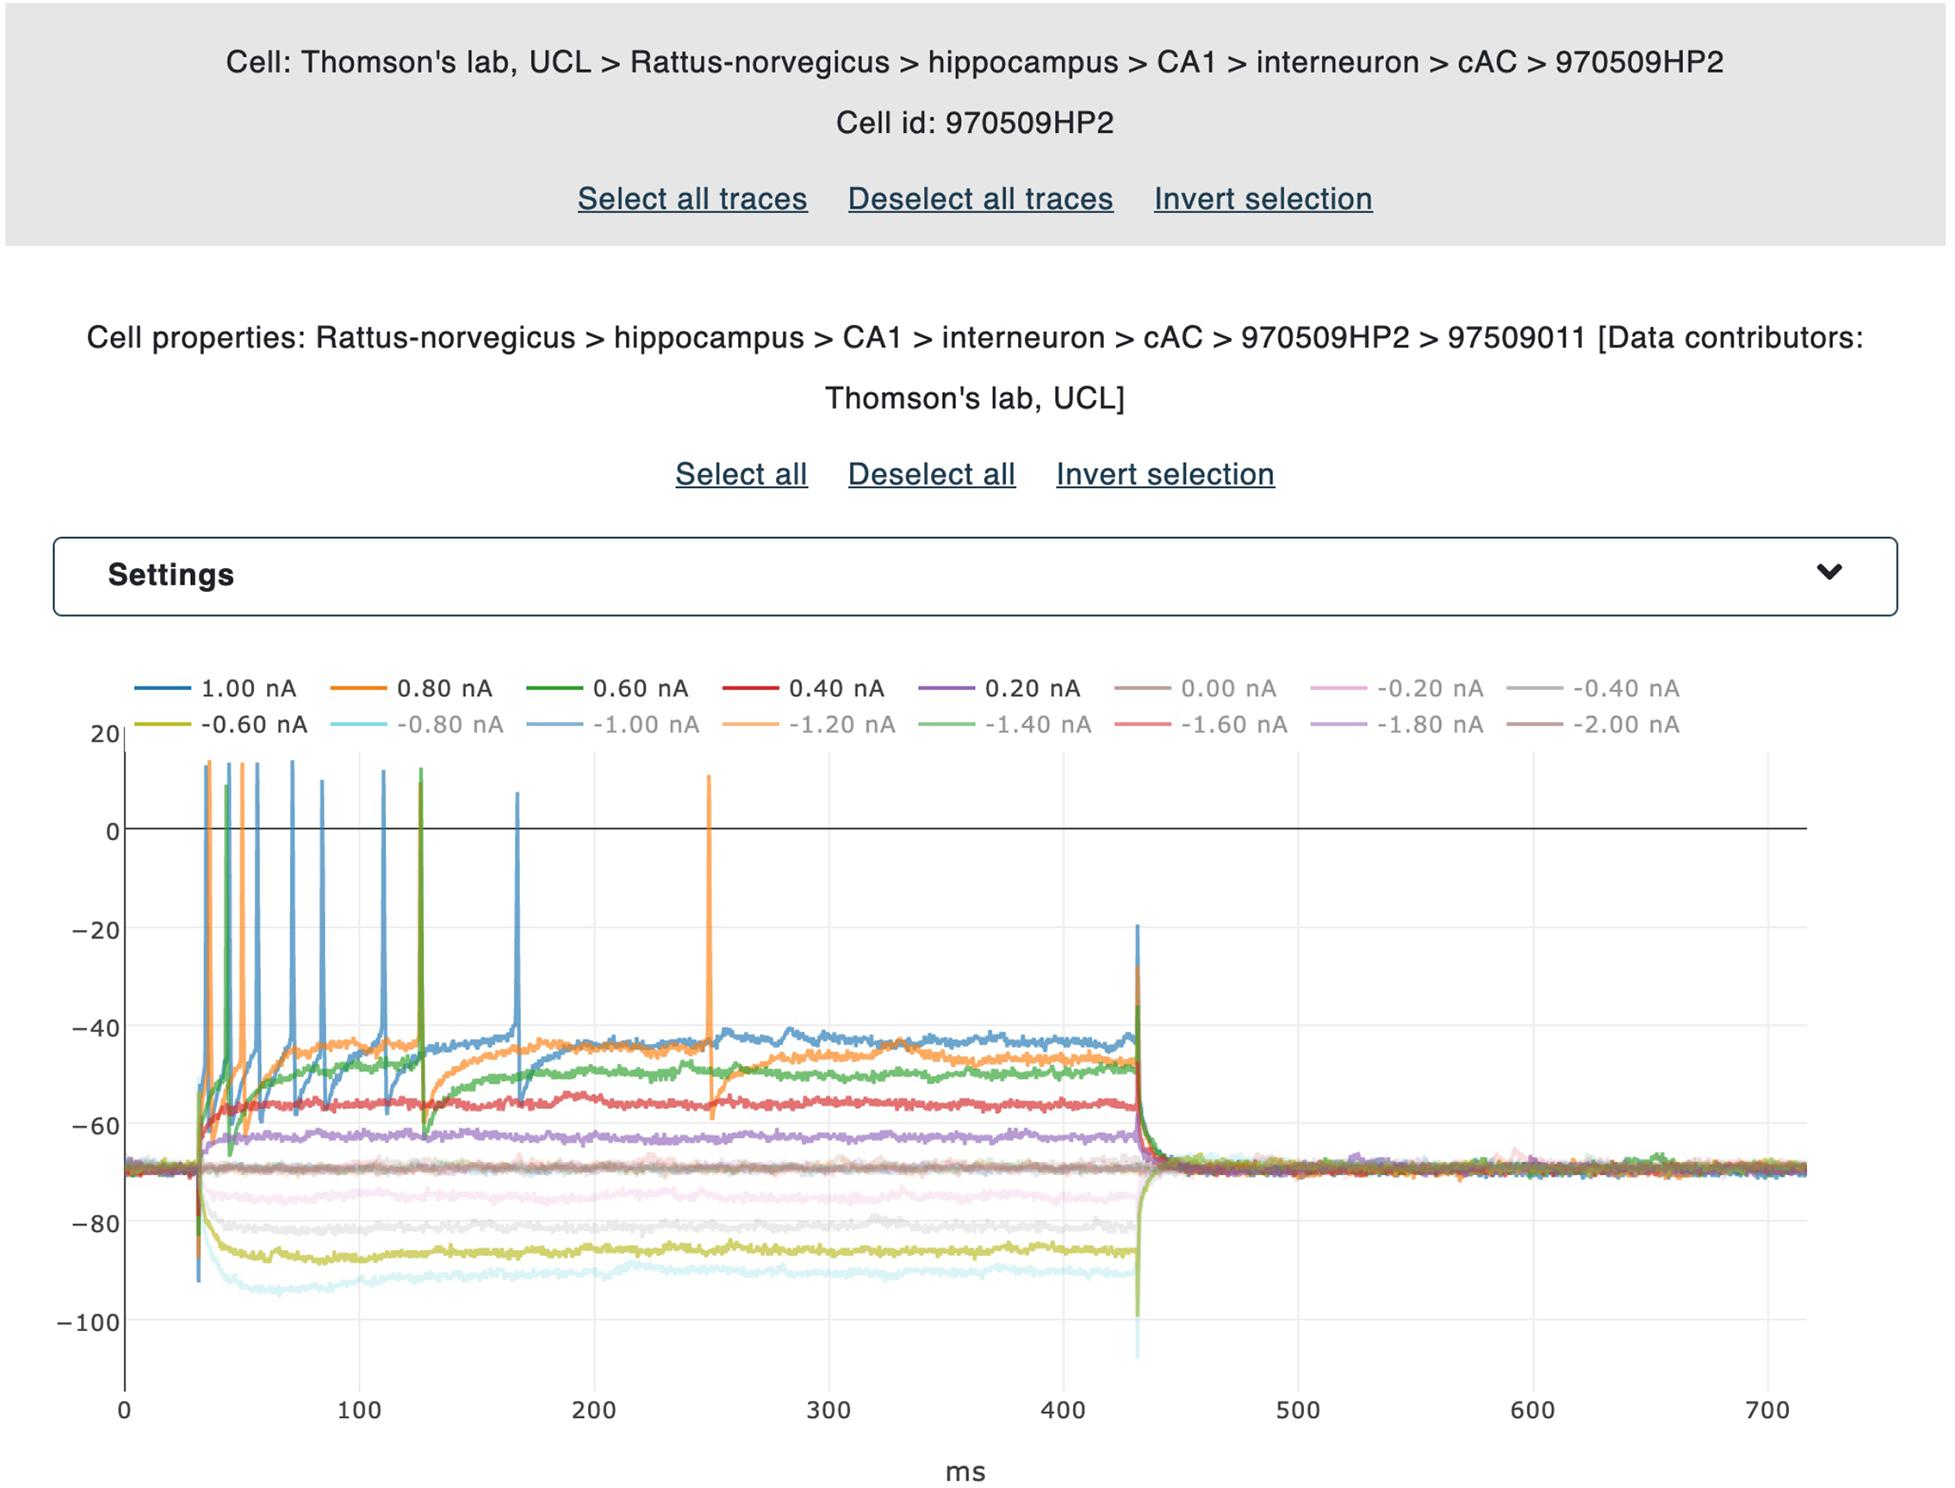
Figure 3. Trace selection panel. The traces belonging to individual files are displayed (together with the corresponding metadata) in interactive panels. By clicking on the legend labels, the user selects the traces to be gathered for the feature extraction. All selected traces are highlighted for ease of visualization. Data from Migliore et al. (2018).
Feature Selection
The last step, before the actual feature extraction process is launched, consists in the feature selection (via a point-and-click interface, see Figure 4). The features that the users can select are those available and documented in the eFEL python package (except for a small number of features that require the stimulus waveform in order to be extracted) and are grouped by category (see section Methods/eFEL).
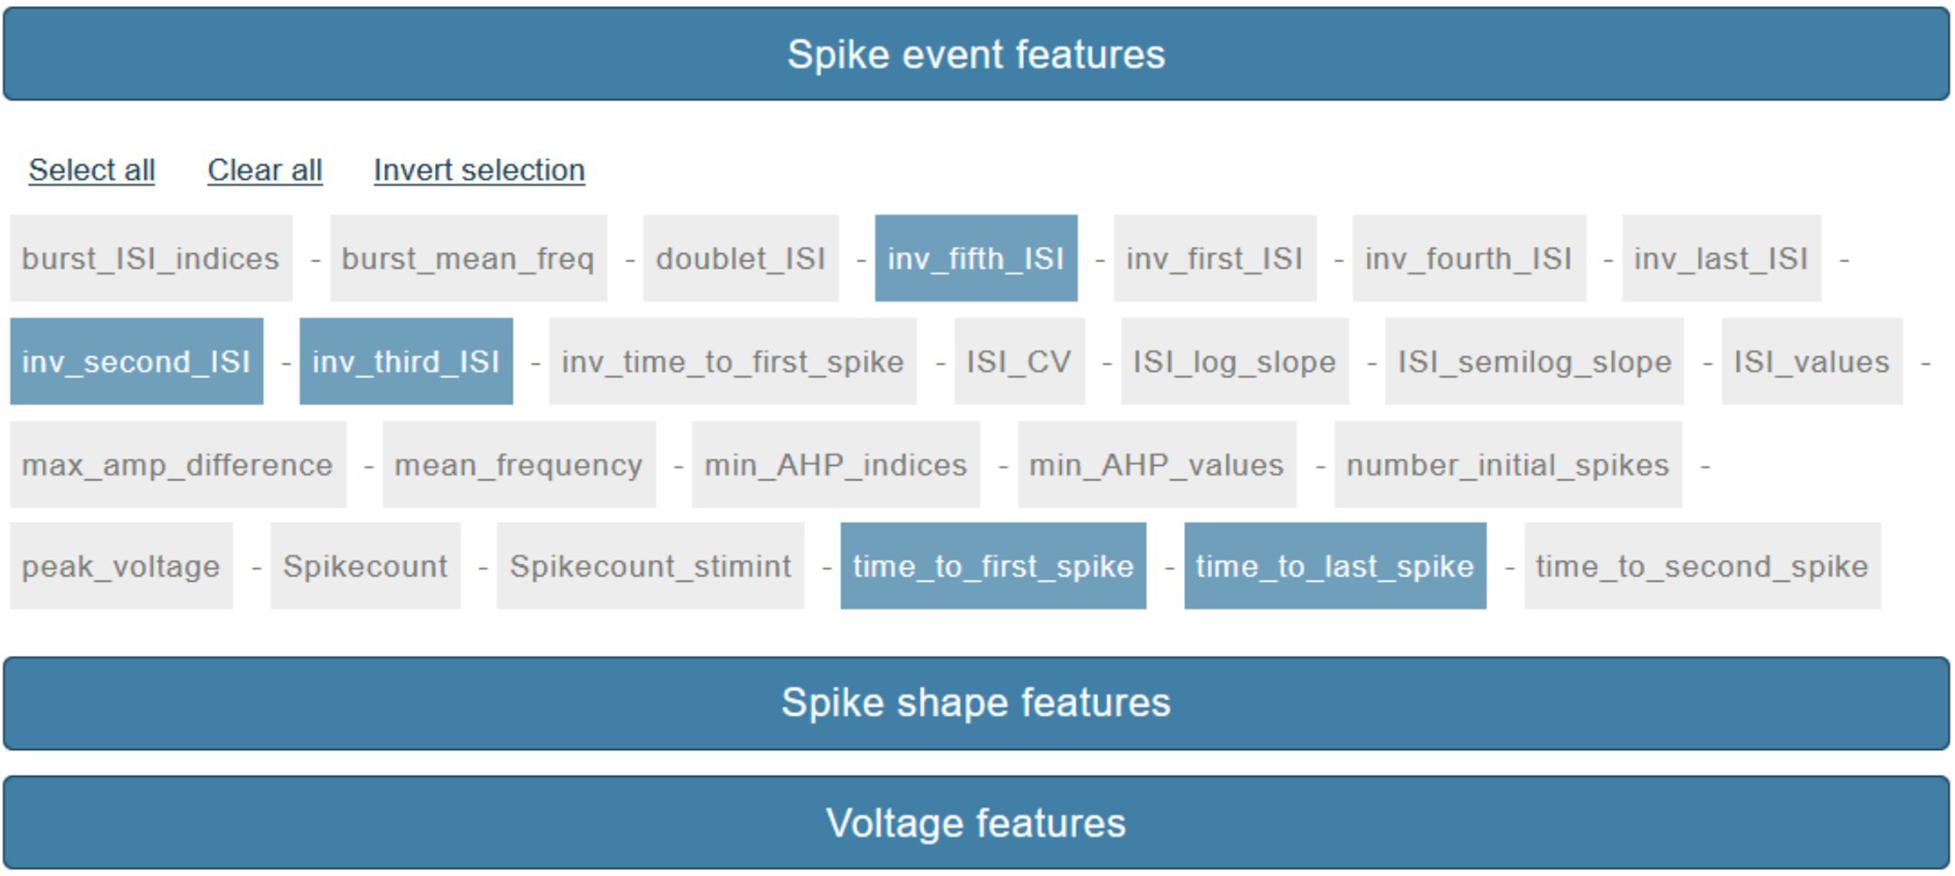
Figure 4. Feature selection panel. About seventy features are currently available for selection via a point-and-click interface. Features are grouped by three categories: “Spike event features,” “Spike shape features,” “Voltage features.”
Extracted Features
The feature extraction results are available for download as a .zip file, after the data processing is completed (see Figure 5A). The results folder contains the output files generated by the BluePyEfe Python package, which in turn leverages the eFEL library (see sections Methods/BluePyEfe and Methods/eFEL), and passed “as is” to the user. More specifically, in the main folder, a subfolder for each cell is created that contains: (1) a .pdf file displaying the electrophysiological traces from which the features have been extracted (see Figure 5B); (2) a .pdf file displaying the corresponding stimulus traces; (3) a .pdf file containing the plot of the mean values and standard deviations of the extracted features (computed on sets of traces recorded upon delivery of the same stimulus); (4) a features.json files containing mean values and standard deviations of the computed features grouped by stimulus amplitude (see Figure 5C); (5) a protocols.json file where the stimulation protocols is reported in appropriately structured Python dictionaries. In addition to the results obtained for individual cells, the same files listed above are generated (and saved in the root of the results folder) where the statistics and plots have been computed after averaging among individual cells. In addition, the all_feature_table.txt tab-separated text file is included, where individual features extracted from individual traces are reported in tabular format. This notation provides the users with a helpful mean to compute higher order statistics on raw (i.e., not averaged) feature values. It is worth noting that the result files are explicitly formatted to be compatible with the neural optimization software library BluePyOpt (Van Geit et al., 2016). This Python tool (freely available online on PyPi26 and GitHub27) allows to optimize neural models via genetic algorithms and is being extensively used by neuroscientists for optimizing different types of neural models against experimental data (Migliore et al., 2018; Masoli et al., 2020; Rizza et al., 2021). The NFE is integrated in the Hodgkin-Huxley Neuron Builder web application that provides the community with an easy-to-use interface able to facilitate the optimization workflow.28
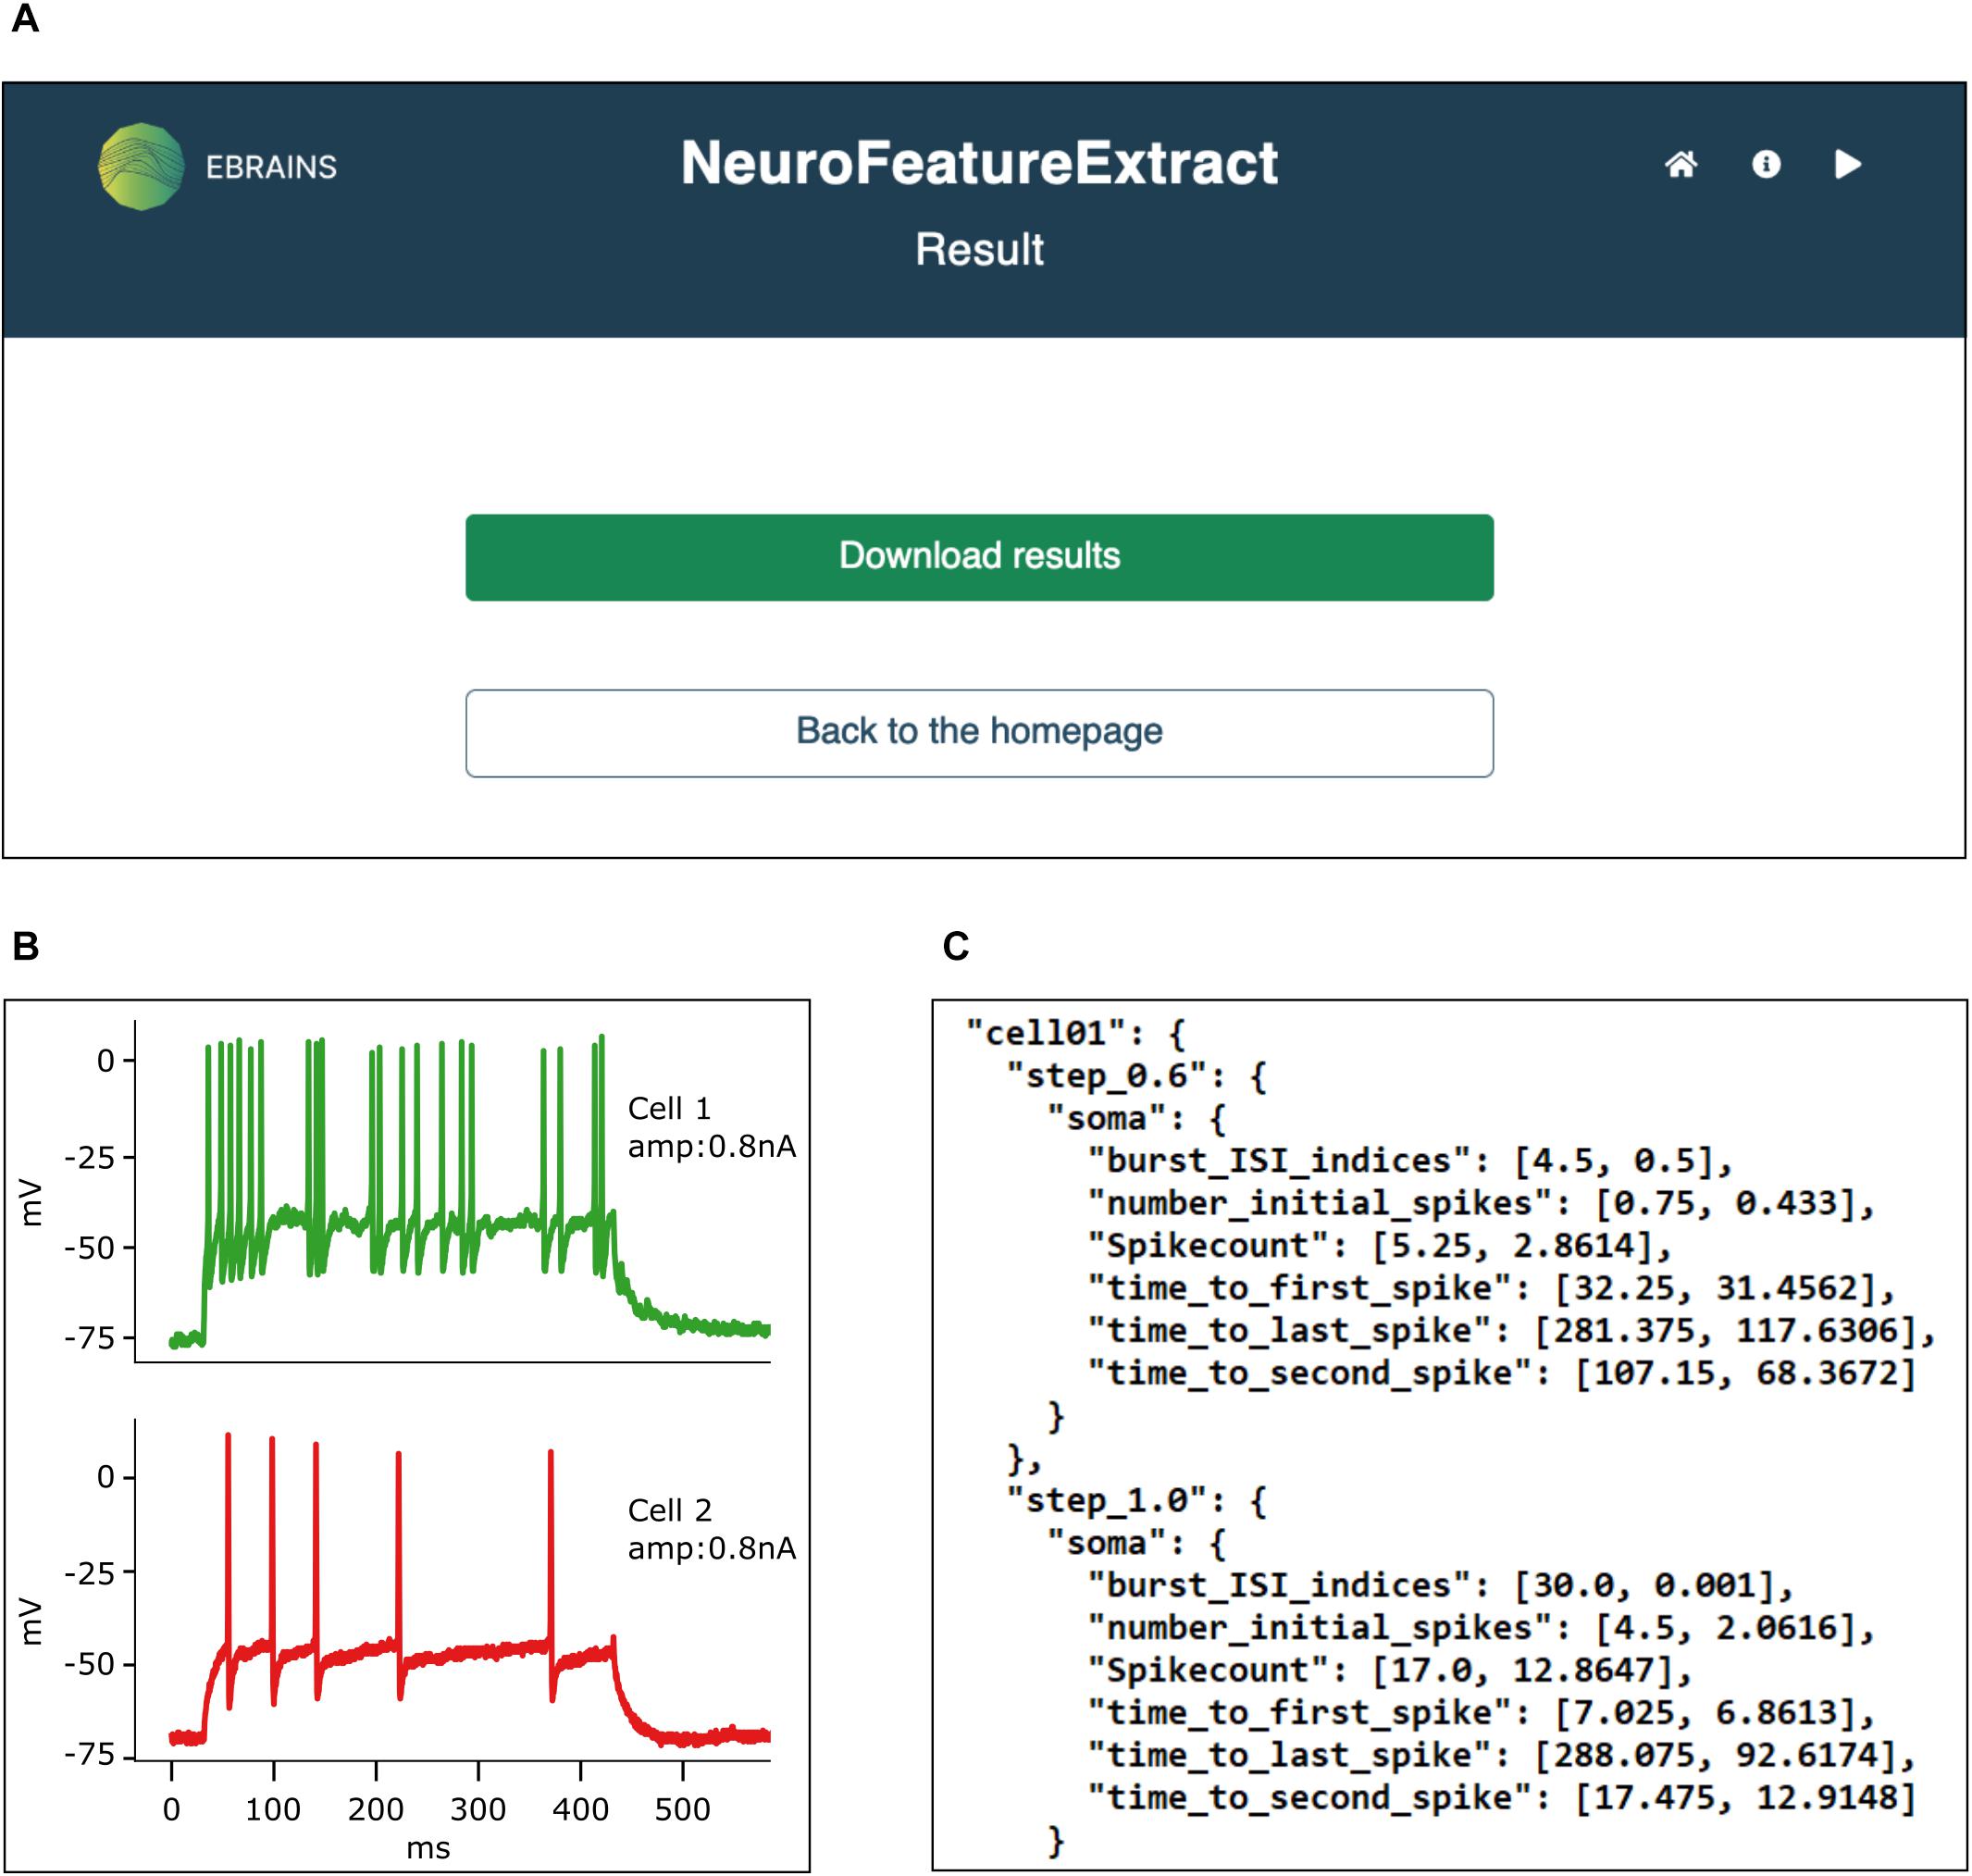
Figure 5. Result panel. (A) All results are downloadable from the web interface in a unique .zip file. (B) The traces from which the features have been extracted are printed to .pdf files. (C) Feature mean and standard deviation values are saved in appropriately formatted .json files, ready to be fed to the BluePyOpt neural model optimizer. Data from Migliore et al. (2018).
In order to demonstrate the usefulness of the functionalities available in the NFE, we selected three traces from the HBP dataset for feature extraction and went through the entire extraction pipeline. These recordings have been acquired from mouse cerebellar granule cells via patch clamp experiments and are shown in Figure 6. While the signal-to-noise ratio of all experiments is high and action potentials seem to be unambiguously detectable, if only upon visual inspection (Figures 6A–C), the stimulus highest values induce an activity drift in one of the recordings (Figure 6C). This behavior is bound to affect the validity of the extracted feature values, in that the default spike detection threshold (i.e., -20 mV) would fail to correctly identify a collection of action potentials occurring jointly with the drift, for high stimulus amplitudes (Figures 6C–E). To address this issue, the users can zoom in and out the traces, via the trace visualization interactive panels (Figure 4), in order to identify a suitable threshold able to guarantee a correct spike detection for all the recordings. Then, via the Feature Extraction Parameters panel (Figure 2A), the appropriate threshold can be set before the feature extraction is triggered.
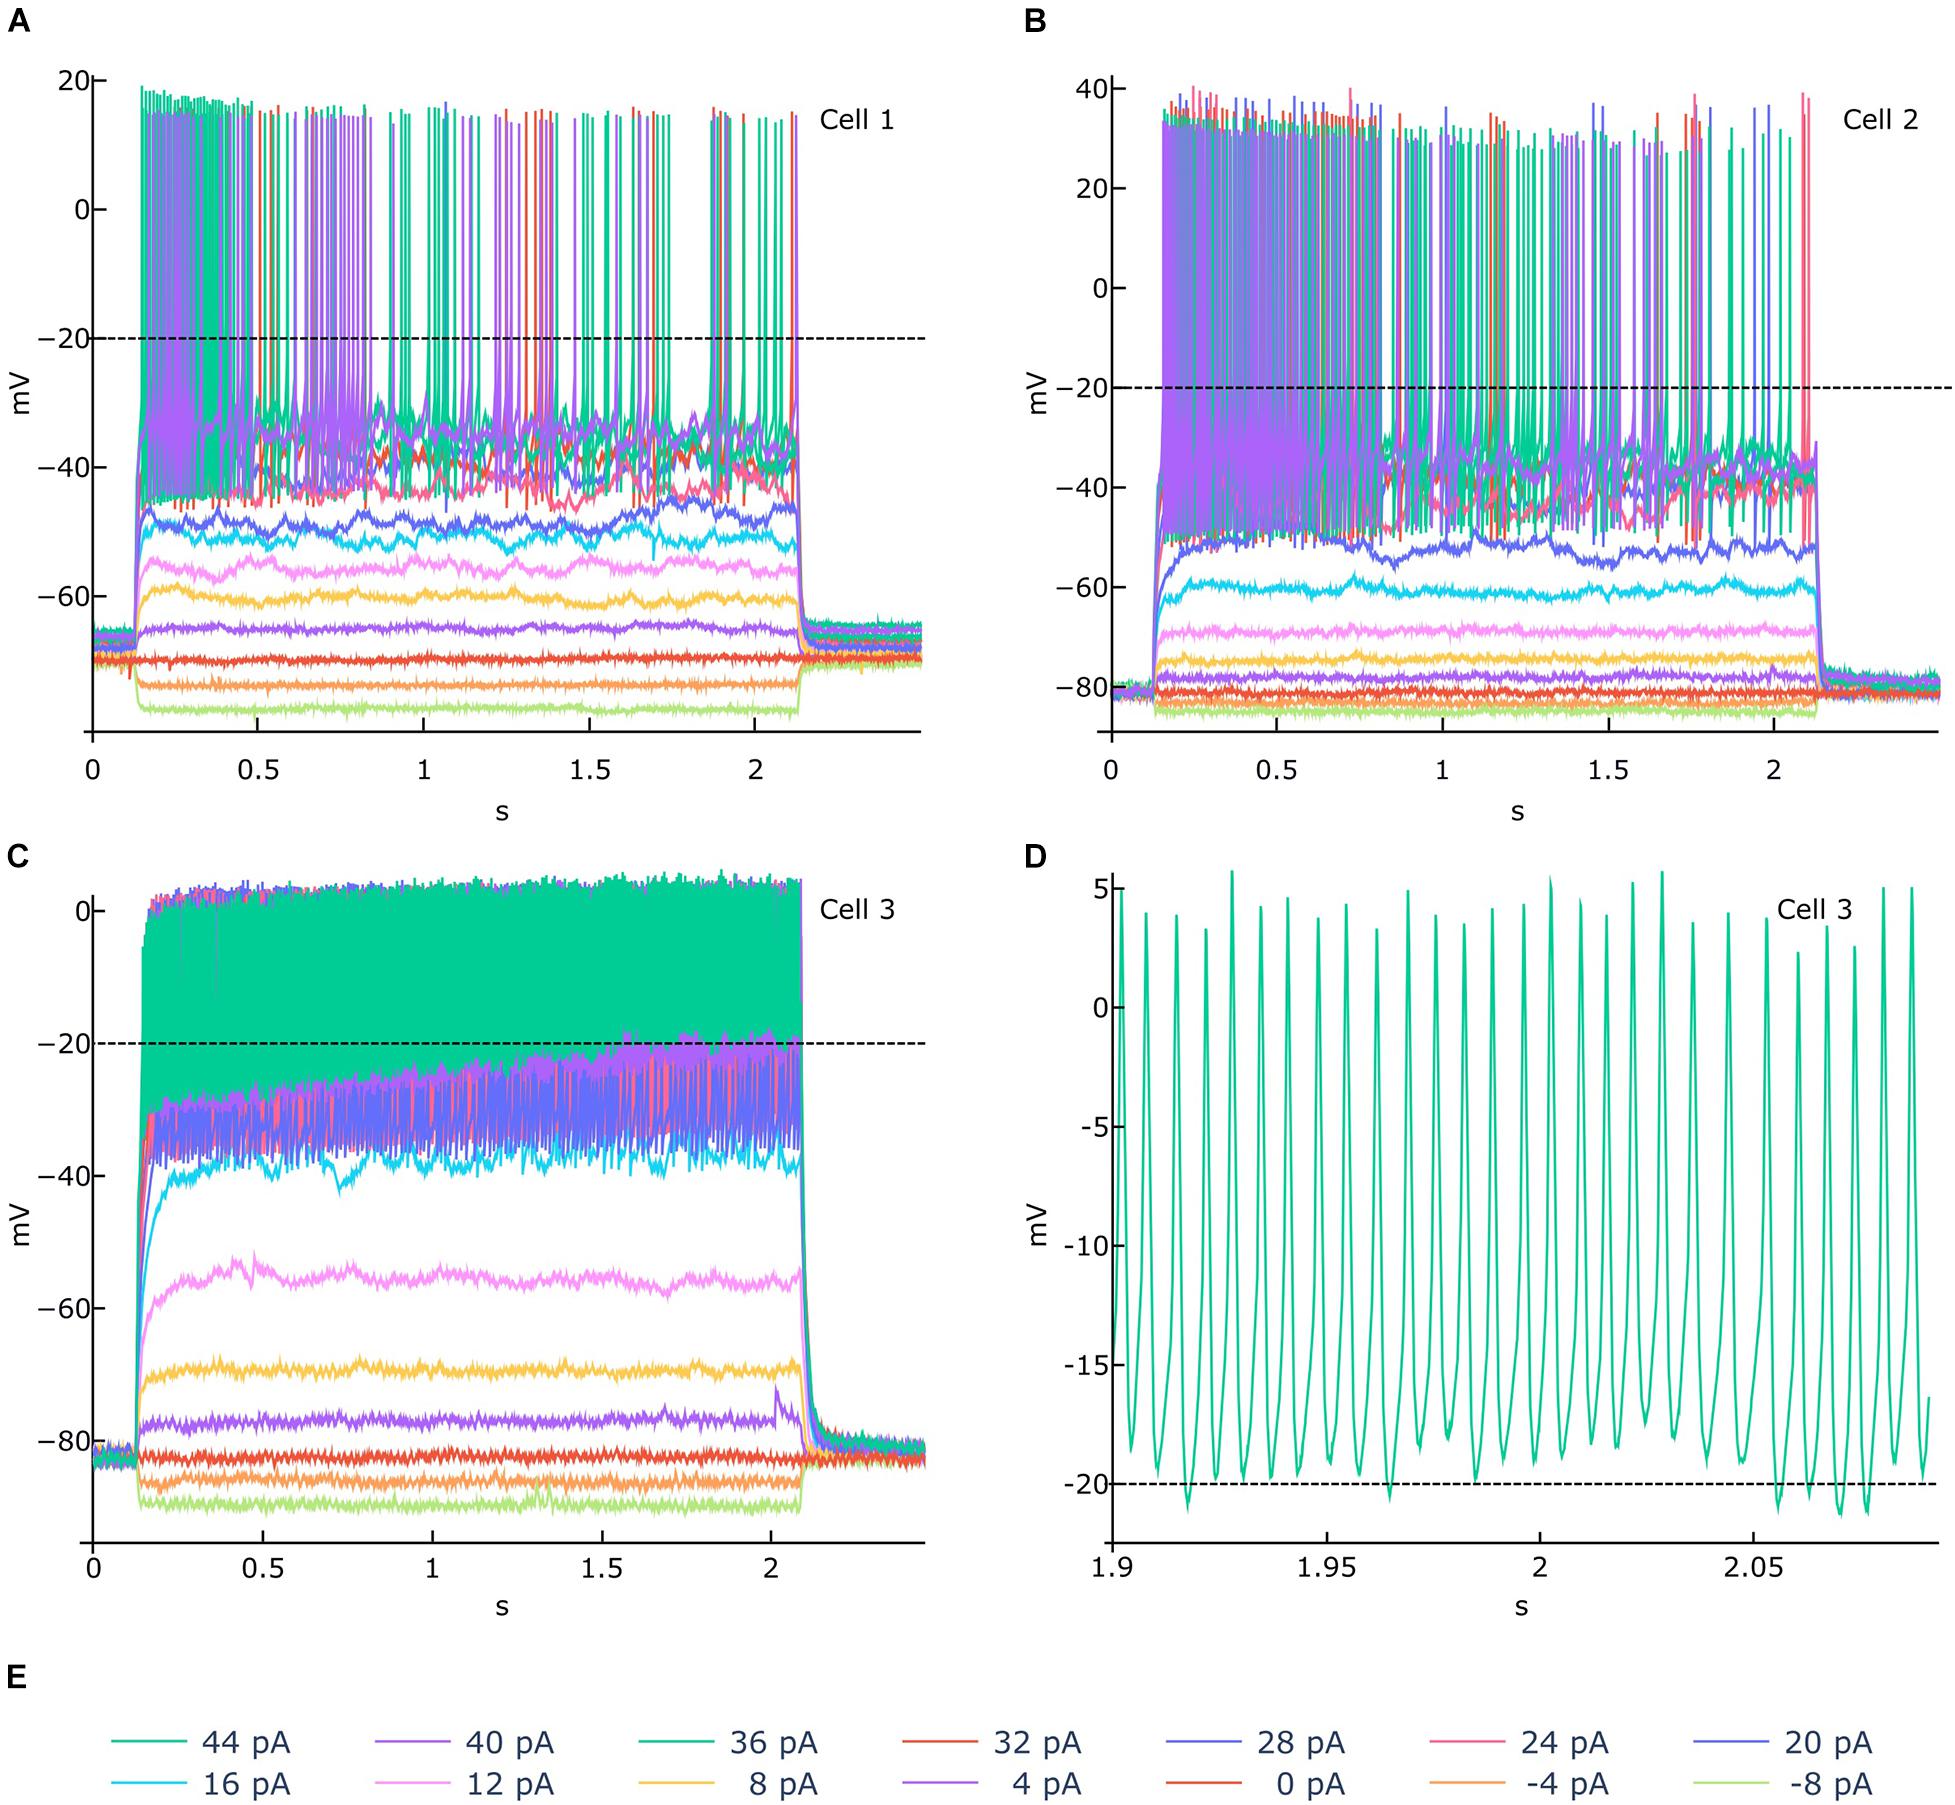
Figure 6. Feature extraction parameter tuning. (A–C) Example of electrophysiological recordings (related to 3 different cells) acquired upon delivery of the 14 stimuli displayed in (E) (amplitudes from -8 to 44 pA, at 4 pA intervals). In (A,B) a −20 mV spike detection threshold (the default value) is appropriate for identifying all the action potentials. In (C), an activity drift is observed for stimuli greater than 16 pA. If a −20 mV threshold is used in this case, the spike detection process would fail to recognize a significant number of action potentials, in that they occur above the threshold itself, as shown in (D) (zoomed activity chunk for the 44 pA recording of Cell 3). For such a scenario, the NFE trace visualization panels (see Figure 3) allows to identify an appropriate threshold that can be set through the panel dedicated to the extraction parameters tuning (see Figure 2A). Data courtesy of Prof. E. D’Angelo.
In order to quantify the impact of a wrong spike detection threshold setting, we extracted the mean and standard deviation of the Burst Number, Mean Frequency, Spike Count and Action Potential Width features, for the traces shown in Figure 6 (we only considered the 44pA stimulus amplitude for demonstration purposes) upon adoption of two different thresholds. These values are reported in Table 1.
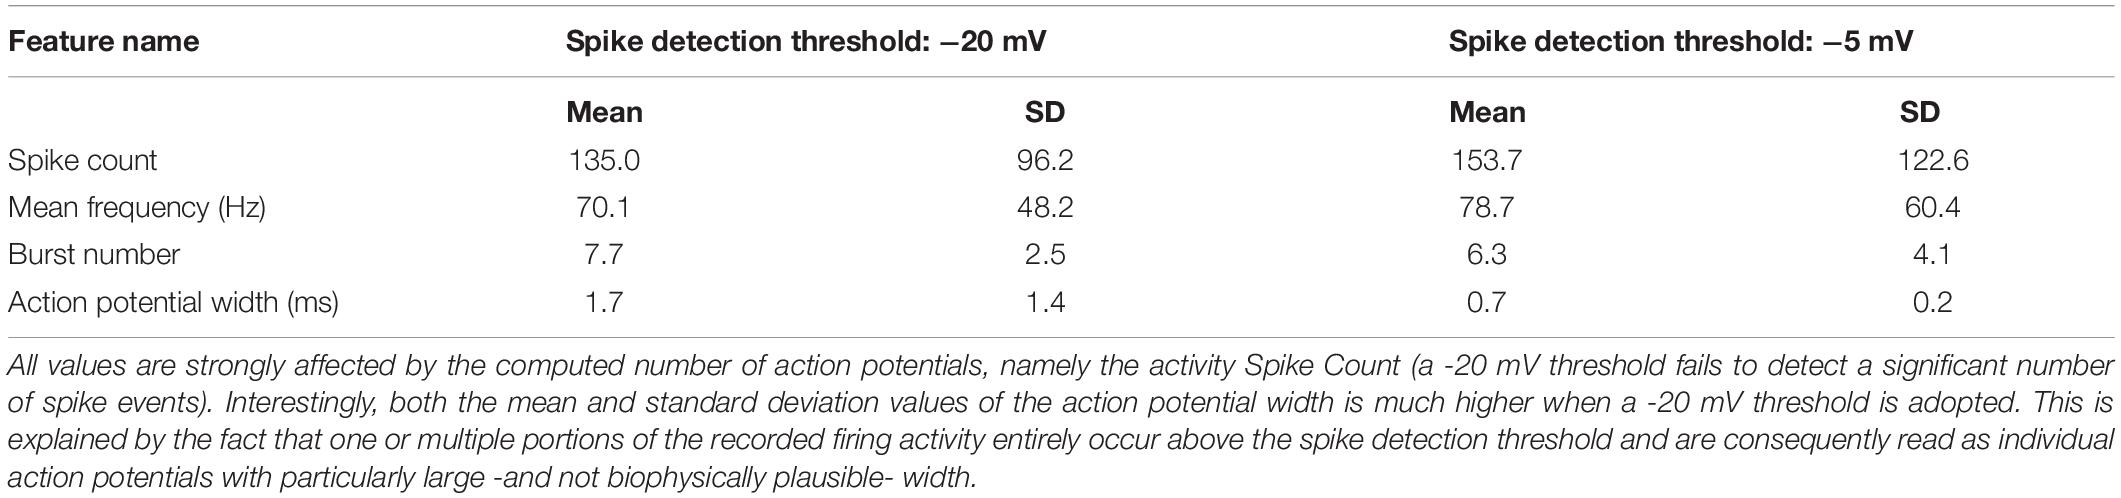
Table 1. Mean and standard deviation values of four features extracted from the traces shown in Figure 6 (for stimulus amplitude equal to 44pA).
Discussion
In the framework of the HBP (Amunts et al., 2016), we have developed an online tool for the extraction of electrophysiological features from either recorded or simulated neural activity. The NFE is a web application freely accessible on the internet that provides the community with a user-friendly interface for: (1) visualization and selection of neural signals; (2) selection of electrophysiological features of interest; (3) feature extraction.
The NFE provides the users with a set of recordings contributed by the HBP consortium and partners that are, or are being, integrated in the EBRAINS research infrastructure data management engine (i.e., the EBRAINS KG). In addition, a unique feature of the NFE is the possibility to upload user’s own data files to be analyzed individually or in conjunction with the recordings selected from the EBRAINS available dataset. The application currently accepts two different file formats for the upload: (1) .abf files (i.e., axon binary format), which needs to be provided together with a metadata file and (2) .json files containing all the data and metadata required to perform the feature extraction procedure. In particular, the latter format has been designed so as to be created by computational neuroscientists or experimentalists with basic knowledge of software programming. In fact, accepted .json files are text files that contain neural traces and related info (e.g., stimulus amplitude, stimulus start and end time, data units) in appropriately structured dictionaries, easily accessible by the underlying feature extraction software package, the BluePyEfe, which has been purposefully extended to support this data format (see section “Methods”).
Another key feature of NFE is the varied repertoire of the generated outputs. Not only the .json files needed to be fed to the BluePyOpt neural model optimizer are produced, but also the features extracted from individual traces are stored (upon selection of the relevant option) in a properly formatted .txt file, easily manageable for further processing.
Finally, usability is made simpler by a dedicated documentation and an interactive video tutorial that guide the users through the entire feature extraction workflow.
While the NFE already offers a self-consistent means for data analysis on electrophysiological traces, the tool is being currently extended with further features.
For example, the interaction with the EBRAINS KG is being made tighter: a dedicated engine that periodically verifies the availability of suitable data for the feature extraction procedure is currently under development. Not only will this functionality allow to check in a (quasi) real-time manner which data have been added to the KG and whether these data are eligible for feature extraction (i.e., they refer to step current experiments and contain the needed metadata), but also it will perform a seamless interaction with the KG for data reading and fetching.
Also, we will further develop the NFE so as to allow the users to keep track of the data files from which the features have been extracted, the extraction process parameters and the version of the software packages used for the entire workflow. In order to achieve this goal, we will leverage the EBRAINS provenance tracking engine and store the relevant metadata in the EBRAINS KG so as to allow the users to both fetch previous processes relevant information and use them for novel feature extraction procedures or for feature extraction validation.
Data Availability Statement
Publicly available datasets were analyzed in this study. This data can be found here: https://hbp-bsp-hhnb.cineca.it/efelg/docs/dataset/.
Author Contributions
MM and LB contributed to conception and design of the study and wrote the first draft. LB, RS, DC, and MM chose the methodology to adopt. LB, RS, and DC developed the software. MM supervised the study. All authors contributed to manuscript revision, read, and approved the submitted version.
Funding
This project has received funding from the European Union’s Horizon 2020 Framework Programme for the Research and Innovation under Specific Grant Agreements Nos. 720270, 785907, and 945539 (Human Brain Project SGA1, SGA2, and SGA3). The funders had no role in study design, data collection and analysis, decision to publish, or preparation of the manuscript.
Conflict of Interest
The authors declare that the research was conducted in the absence of any commercial or financial relationships that could be construed as a potential conflict of interest.
Publisher’s Note
All claims expressed in this article are solely those of the authors and do not necessarily represent those of their affiliated organizations, or those of the publisher, the editors and the reviewers. Any product that may be evaluated in this article, or claim that may be made by its manufacturer, is not guaranteed or endorsed by the publisher.
Acknowledgments
We thank the CINECA consortium (Bologna, Italy), for access to their supercomputer systems.
Footnotes
- ^ https://senselab.med.yale.edu/ModelDB/
- ^ https://www.dandiarchive.org/
- ^ https://zenodo.org
- ^ https://datadryad.org/
- ^ https://figshare.com
- ^ https://nwb.org
- ^ https://github.com/NeurodataWithoutBorders/nwb-jupyter-widgets/
- ^ http://nwbexplorer.opensourcebrain.org
- ^ https://alleninstitute.org/
- ^ https://kg.ebrains.eu/
- ^ www.ebrains.eu
- ^ https://hbp-bsp-hhnb.cineca.it/efelg/
- ^ www.djangoproject.com
- ^ www.cineca.it
- ^ www.openstack.org
- ^ www.python.org
- ^ www.nginx.com
- ^ https://uwsgi-docs.readthedocs.io/
- ^ https://github.com/cnr-ibf-pa/hbp-bsp-hh-neuron-builder/tree/master/efelg
- ^ https://pypi.org/project/efel/
- ^ https://github.com/BlueBrain/eFEL
- ^ https://efel.readthedocs.io/en/latest/
- ^ https://pypi.org/project/bluepyefe/
- ^ https://github.com/BlueBrain/BluePyEfe
- ^ https://hbp-bsp-hhnb.cineca.it/efelg/docs/
- ^ https://pypi.org/project/bluepyopt/
- ^ https://github.com/BlueBrain/BluePyOpt
- ^ https://hbp-bsp-hhnb.cineca.it/hh-neuron-builder/
References
Amunts, K., Ebell, C., Muller, J., Telefont, M., Knoll, A., and Lippert, T. (2016). The human brain project: creating a european research infrastructure to decode the human brain. Neuron 92, 574–581. doi: 10.1016/j.neuron.2016.10.046
Branco, T., Clark, B. A., and Häusser, M. (2010). Dendritic discrimination of temporal input sequences in cortical neurons. Science 329, 1671–1675. doi: 10.1126/science.1189664
Cannon, R. C., Gleeson, P., Crook, S., Ganapathy, G., Marin, B., Piasini, E., et al. (2014). LEMS: a language for expressing complex biological models in concise and hierarchical form and its use in underpinning neuroML 2. Front. Neuroinform. 8:79. doi: 10.3389/fninf.2014.00079
Davison, A. P., Brüderle, D., Eppler, J., Kremkow, J., Muller, E., Pecevski, D., et al. (2009). PyNN: a common interface for neuronal network simulators. Front. Neuroinform. 2:11. doi: 10.3389/neuro.11.011.2008
Denker, M., Yegenoglu, A., and Grün, S. (2018). Collaborative HPC-enabled workflows on the HBP collaboratory using the elephant framework. Neuroinformatics 2018:19. doi: 10.12751/incf.ni2018.0019
Eppler, J. M., Helias, M., Muller, E., Diesmann, M., and Gewaltig, M. O. (2009). PyNEST: a convenient interface to the NEST simulator. Front. Neuroinform. 2:12. doi: 10.3389/neuro.11.012.2008
Garcia, S., Guarino, D., Jaillet, F., Jennings, T., Pröpper, R., Rautenberg, P. L., et al. (2014). Neo: an object model for handling electrophysiology data in multiple formats. Front. Neuroinform. 8:10. doi: 10.3389/fninf.2014.00010
Gewaltig, M. O., and Diesmann, M. (2007). NEST, (NEural Simulation Tool). Scholarpedia 2:1430. doi: 10.4249/scholarpedia.1430
Gleeson, P., Cantarelli, M., Marin, B., Quintana, A., Earnshaw, M., Sadeh, S., et al. (2019). Open source brain: a collaborative resource for visualizing, analyzing, simulating, and developing standardized models of neurons and circuits. Neuron 103, 395–411.e5. doi: 10.1016/j.neuron.2019.05.019
Gleeson, P., Crook, S., Cannon, R. C., Hines, M. L., Billings, G. O., Farinella, M., et al. (2010). NeuroML: a language for describing data driven models of neurons and networks with a high degree of biological detail. PLoS Comput. Biol. 6:e1000815. doi: 10.1371/journal.pcbi.1000815
Gleeson, P., Davison, A. P., Silver, R. A., and Ascoli, G. A. (2017). A commitment to open source in neuroscience. Neuron 96, 964–965. doi: 10.1016/j.neuron.2017.10.013
Goodman, D., and Brette, R. (2008). Brian: a simulator for spiking neural networks in python. Front. Neuroinform. 2:5. doi: 10.3389/neuro.11.005.2008
Hines, M. L., and Carnevale, N. T. (1997). The NEURON simulation environment. Neural Comput. 9, 1179–1209. doi: 10.1162/neco.1997.9.6.1179
Johansson, R. S., and Flanagan, J. R. (2009). Coding and use of tactile signals from the fingertips in object manipulation tasks. Nat. Rev. Neurosci. 10, 345–359. doi: 10.1038/nrn2621
Masoli, S., Ottaviani, A., Casali, S., and D’Angelo, E. (2020). Cerebellar golgi cell models predict dendritic processing and mechanisms of synaptic plasticity. Edited by Hermann Cuntz. PLoS Comput. Biol. 16:e1007937. doi: 10.1371/journal.pcbi.1007937
McDougal, R. A., Morse, T. M., Carnevale, T., Marenco, L., Wang, R., Migliore, M., et al. (2017). Twenty years of modelDB and beyond: building essential modeling tools for the future of neuroscience. J. Comput. Neurosci. 42, 1–10. doi: 10.1007/s10827-016-0623-7
McDougal, R. A., Morse, T. M., Hines, M. L., and Shepherd, G. M. (2015). ModelView for modelDB: online presentation of model structure. Neuroinformatics 13, 459–470. doi: 10.1007/s12021-015-9269-2
Migliore, R., Lupascu, C. A., Bologna, L. L., Romani, A., Courcol, J. D., Antonel, S., et al. (2018). The physiological variability of channel density in hippocampal ca1 pyramidal cells and interneurons explored using a unified data-driven modeling workflow. PLoS Comput. Biol. 14:1–25. doi: 10.1371/journal.pcbi.1006423
Petersen, C. C. H. (2017). Whole-cell recording of neuronal membrane potential during behavior. Neuron 95, 1266–1281. doi: 10.1016/j.neuron.2017.06.049
Rizza, M. F., Locatelli, F., Masoli, S., Sánchez-Ponce, D., Muñoz, A., Prestori, F., et al. (2021). Stellate cell computational modeling predicts signal filtering in the molecular layer circuit of cerebellum. Sci. Rep. 11:3873. doi: 10.1038/s41598-021-83209-w
Rizzolatti, G., and Craighero, L. (2004). The mirror-neuron system. Annu. Rev. Neurosci. 27, 169–192. doi: 10.1146/annurev.neuro.27.070203.144230
Shahaf, G., and Marom, S. (2001). Learning in networks of cortical neurons. J. Neurosci. 21, 8782–8788. doi: 10.1523/jneurosci.21-22-08782.2001
Stimberg, M., Brette, R., and Goodman, D. F. (2019). Brian 2, an intuitive and efficient neural simulator. eLife 8:e47314. doi: 10.7554/eLife.47314
Teeters, J. L., Godfrey, K., Young, R., Dang, C., Friedsam, C., Wark, B., et al. (2015). Neurodata without borders: creating a common data format for neurophysiology. Neuron 88, 629–634. doi: 10.1016/j.neuron.2015.10.025
Keywords: electrophysiology, data analysis, online resources, neural models, EBRAINS
Citation: Bologna LL, Smiriglia R, Curreri D and Migliore M (2021) The EBRAINS NeuroFeatureExtract: An Online Resource for the Extraction of Neural Activity Features From Electrophysiological Data. Front. Neuroinform. 15:713899. doi: 10.3389/fninf.2021.713899
Received: 24 May 2021; Accepted: 05 August 2021;
Published: 26 August 2021.
Edited by:
Sharon Crook, Arizona State University, United StatesReviewed by:
Tuomo Mäki-Marttunen, Simula Research Laboratory, NorwayAnkur Sinha, University College London, United Kingdom
Copyright © 2021 Bologna, Smiriglia, Curreri and Migliore. This is an open-access article distributed under the terms of the Creative Commons Attribution License (CC BY). The use, distribution or reproduction in other forums is permitted, provided the original author(s) and the copyright owner(s) are credited and that the original publication in this journal is cited, in accordance with accepted academic practice. No use, distribution or reproduction is permitted which does not comply with these terms.
*Correspondence: Michele Migliore, michele.migliore@cnr.it