Effects of Adding Eubiotic Lignocellulose on the Growth Performance, Laying Performance, Gut Microbiota, and Short-Chain Fatty Acids of Two Breeds of Hens
 Baosheng Sun
 Linyue Hou1,2†
  Yu Yang
- 1Laboratory of Poultry Production, College of Animal Science, Shanxi Agricultural University, Jinzhong, China
- 2Department of Modern Agriculture, Zunyi Vocational and Technical College, Zunyi, China
Eubiotic lignocellulose is a new and useful dietary fiber source for chickens. However, few studies have been undertaken on the impacts of its use as a supplement in different chicken breeds. In this experiment, 108 Chinese native breed Bian hens (BH) and 108 commercial breed ISA Brown hens (IBH) were chosen. They were randomly divided into three groups, and 0, 2, or 4% eubiotic lignocellulose was added to their feed during the growing periods (9–20 weeks), respectively. We aimed to observe the impacts of adding eubiotic lignocellulose on the growth and laying performance, gut microbiota, and short-chain fatty acid (SCFA) of two breeds of hens. In this study, the addition of eubiotic lignocellulose had no significant effect on the growth performance and gut microbial diversity in the two breeds of chickens (P > 0.05). Compared with the control group, adding 4% eubiotic lignocellulose significantly increased the cecum weight, laying performance (P < 0.05), but had no significant effect on the SCFA of BH (P > 0.05); however, adding 4% significantly inhibited the intestinal development, laying performance, butyrate concentration, and SCFA content of IBH (P < 0.05). Moreover, the relative abundances of the fiber-degrading bacteria Alloprevotella and butyrate-producing bacteria Fusobacterium in the 4% group of BH were significantly higher than those in the 4% group of IBH (P < 0.05), resulting in the concentration of butyrate was significantly higher than those in it (P < 0.05). Combining these results suggests that the tolerance of BH to a high level of eubiotic lignocellulose is greater than that of IBH and adding 2-4% eubiotic lignocellulose is appropriate for BH, while 0–2% eubiotic lignocellulose is appropriate for IBH.
Introduction
Dietary fiber is important for the growth and production performance of chickens. Studies have shown that adding 1% insoluble fiber to the diet of 8 weeks old Hy-Line brown hens significantly increased the feed utilization rate (1). Added chito-oligosaccharide to layer diets improved the digestibility of dry matter and crude protein (2). Adding mannan-oligosaccharides at the levels of 1 and 1.5 g/kg of diet improved the laying performance and feed efficiency of old hens (3). Dietary fiber can also affect the development of chicken's gastrointestinal tract. Fiber intake can stimulate gizzard function and increase the relative length and weight of chicken cecum (4). However, the tolerance of different chicken breeds to dietary fiber is usually different. It reported that high fiber level significantly reduced the daily gain of broilers, but had no effect on the daily gain of layers (5). In addition, dietary fiber is a source of carbon source and energy for gut microorganisms. The consumption of a high-fiber diet helps to increase the richness and diversity of the gut microbiota (6). Adding chicory extract to the diet of laying hens significantly reduced the number of cecal harmful bacteria (7). The gut microbiota in different chicken breeds was usually different. Distinct differences in gut microbiota between Indian native chickens and commercial chickens have been observed (8).
Among various dietary fiber supplementation, eubiotic lignocellulose has been proven to be a new and effective dietary fiber source for chickens. It is made from special pure wood, and it is a synergistic combination of soluble fiber and insoluble fiber. Its fiber content is as high as 85%, so no great adjustment is required if we want to increase the dietary fiber level of the feed (9). Generally, adding 1.0–1.5% can positively affect the digestion process of poultry. Research has shown that adding 1–1.5% eubiotic lignocellulose to broilers increases their feed intake by 6.7–9.4% (10). Adding 1% eubiotic lignocellulose from the 50th week of life was found to increase the laying production of hens by 1.7% and reduce the feed waste rate by 20% (9).
However, monogastric animals, such as chickens, humans (11), and even pandas (12), lack endogenous fiber-degrading enzymes and must rely on gut microorganisms to degrade dietary fiber, including eubiotic lignocellulose. The members of the Bacteroidetes phylum are “generalists” that degrade dietary fiber polysaccharides. It can utilize a wide range of dietary polysaccharides from plant sources via unique polysaccharide utilization locus (PUL) (13, 14). Bacteroides and Prevotella are excellent fiber-degrading bacterial genera belonging to the Bacteroidetes phylum. Bacteroides thetaiotamicron is one of the best fiber-degrading species, and it can degrade the most complex glycan, rhamnogalacturonan-II (RG-II) (15). In contrast, the members of the Firmicutes phylum are regarded as “specialists” for fiber-degradation. The excellent fiber-degrading genera in Firmicutes include Ruminococcus, Fibrobacter (16), Clostridium and Roseburia (17) etc. Ruminococcus can degrade dietary fiber into monosaccharides through cellulase or the cellulosome mechanism (18). Some monosaccharides can be used as a carbon source and as energy for gut microbial growth, thus increasing the microbial diversity (7). The leftover monosaccharides enter the cytoplasm and are then fermented to produce short-chain fatty acids (SCFAs) by SCFA-producing bacteria, mainly including acetate, propionate, and butyrate, which account for 90–95% of SCFAs. Cecum is the main site for microbial fiber-degradation and fermentation in chickens. Pathways for the biosynthesis of SCFAs from dietary fiber fermentation differ (19). Bifidobacterium produces acetate using the bifid-shunt way (20). Acetate is the main way for the body to obtain energy from dietary fiber. Propionibacterium can produce propionate by a succinate-propionate pathway (21) and it synthesize glycogen in the liver. Faecalibacterium can ferment glucose into butyrate (22). Butyrate provides ~70% energy for normal colonic epithelial cells (23).
Therefore, we speculated that the previous observed effect of eubiotic lignocellulose on the growth and laying performance of chickens may be closely related to gut microorganisms and their metabolites—SCFAs—but there is limited related research available. In addition, there have been few studies on the impact of adding eubiotic lignocellulosese to different chicken breeds. Given this, a total of 108 Chinese native breed Bian hens (BH) and 108 commercial breed ISA Brown hens (IBH) were chosen for study because the tolerance of Chinese native breed to dietary fiber is usually better than that of commercial breed. They were randomly divided into three groups which were given feed containing three levels of added eubiotic lignocellulose (0, 2, and 4%) for 9–20 weeks. Our aims were to evaluate the impacts of adding eubiotic lignocellulose on the growth performance, laying performance, gut development, gut microbiota, and SCFAs of two breeds of chickens; determine an appropriate additive amount of eubiotic lignocellulose; and provide a theoretical basis for the application of this new feed additives.
Materials and Methods
Experiment Design and Animal Management
This experiment was approved by the Shanxi Agricultural University Animal Experiment Ethics Committee (license number: SXAU-EAW-2017-002Chi.001). In total, 108 Chinese native breed BH and 108 commercial breed IBH were chosen. Each breed was randomly divided into three groups. Each group owned six cages with six chickens per cage. One cage was a replicate. These three groups were fed 0, 2, or 4% eubiotic lignocellulose OptiCell (OC) to the basic diets (Table 1) during growing periods (9-20 weeks). Groups one and two were named the OC-low (OL) group and OC-high (OH) group, respectively. The control group was referred to as the OC-free (OF) group. Samples were harvested to measure the gut microbiota, the concentration of SCFAs, and other parameters at the end of the 20-week study period.
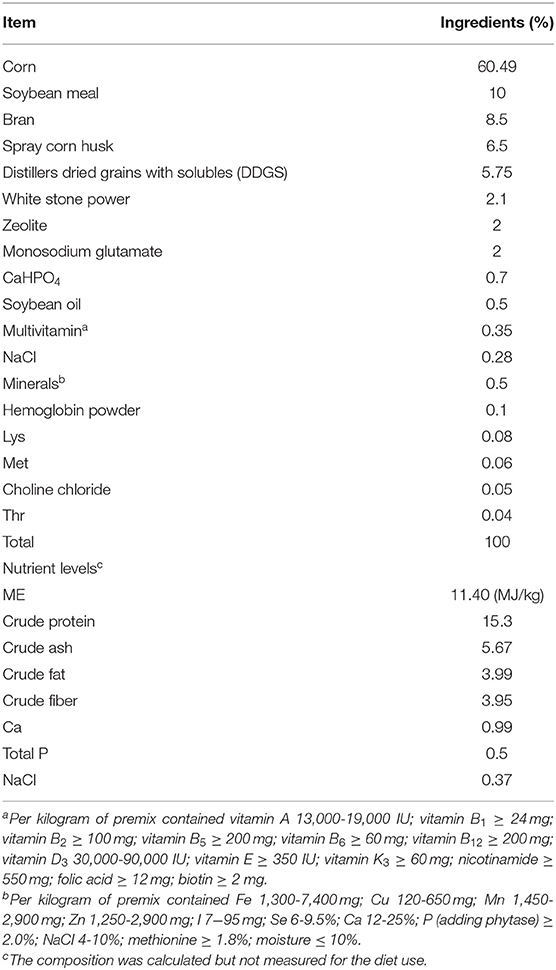
Table 1. Ingredients and nutrient levels of diets used during weeks 9–20.
The bought eubiotic lignocellulose (Beijing e-feed and e-vet cooperation, Beijing, China) in this study was developed by Agromed Ltd. (Austria). It was made from special fresh timber. It contains total dietary fiber (TDF) 88%, crude fiber 59%, soluble TDF 1.3%, NDF 78%, ADF 64%, lignin 25-30%, energy ~0%, crude protein 0.9%, crude fat 0.8%, moisture 8%, crude ash 1.0%, minerals and trace elements 1.3%.
Chickens were given free access to water and diet. The management of the temperature, light, and humidity was carried out according to the breeding manual of IBH. No immunization schedule was performed to avoid impacts on the gut microbiota of chickens.
Sampling
The body weight and feed intake of each group of chickens were recorded. The age of laying the first egg in each group was recorded, and all eggs laid on each day in every replicate were collected for seven weeks. Chickens with similar weights from each replicate per group (n = 6) were chosen at 20 weeks old. They were slaughtered humanely using the oral bloodletting slaughtering method and then the length and weight of their gastrointestinal tracts were measured. The left cecum chyme of each chicken was squeezed into a multiple cryogenic tube that had been set to zero, and weighed. The cryogenic tubes were quickly placed into a liquid nitrogen tank and stored at −80°C for DNA extraction (24) and the 16S rRNA gene sequence of the gut microbiota and the determination of SCFAs.
Measurements
Growth Performance
The average daily feed intake (ADFI) per chicken per group was computed. ADFI = total feed consumption per week ÷ seven days ÷ numbers of chickens. The average daily gain (ADG) per chicken per group was calculated as follows: ADG = (weights of chickens this week—weights of chickens last week) ÷ seven days ÷ number of chickens.
Laying Performance
The age of at which the first egg was laid and the number of eggs laid per replicate were recorded. The average weekly egg weight per group was calculated. Data pertaining to the weights of softshell eggs, and eggs that were too large or too small, were removed. In addition, the average daily laying rate per group was calculated. Laying rate (%) = the total number of eggs per week per group ÷ seven days ÷ number of chickens per group.
Development of the Gastrointestinal Tract
The weight or length of the crop, gizzard, small intestine, and cecum were measured. The crop rate and gizzard rate were calculated. Crop (gizzard) rate (%) = weight of crop (gizzard) ÷ body weight of chicken × 100.
16S rRNA Gene Sequencing
The 16S rRNA gene of the gut microbiota was sequenced by Gene de novo Biotechnology Ltd (Guangzhou, China) using High-Throughput Sequencing Technology (25).
The accession number can be found below: NCBI Sequence Read Archive (SRA); PRJNA719301.
Bioinformatics Analysis: (1) Quality control and reads assembly. Raw reads were further filtered using FASTP. Paired-end clean reads were merged as raw tags using FLSAH (26). Raw tag filtering: Noisy raw tag sequences were filtered via the QIIME pipeline under specific filtering conditions (27) to obtain high-quality clean tags. Chimera checking and removal: clean tags were searched against the reference database for reference-based chimera checking using the UCHIME algorithm. All chimeric tags were removed, and effective tags were finally obtained. (2) Operational taxonomic units (OTUs) cluster. Effective tags were clustered into OTUs with ≥97% similarity using the UPARSE pipeline (28). Venn analysis was performed in R project to identify OTUs. (3) Microbial diversity was analyzed. The alpha diversity indexes were analyzed using QIIME. The comparison of microbial alpha diversity among groups was performed via Kruskal–Wallis using the Vegan package in the R project (29). Beta diversity was assessed. Sequence alignment was carried out using Muscle (30). Microbial beta diversity analyses among groups were performed via Kruskal–Wallis using the Vegan package in the R project. In addition, principal coordinates analysis (PCoA) of unweighted unifrac distances was calculated and plotted in the R project. (4) Bacteria biomarker features of each group were screened by Metastats (31) and LEfSe (linear discriminant analysis (LDA) effect size) software (32). Metastats showed significantly different bacteria using P < 0.01 or 0.05. The value of LDA of certain microbes >2 represents that the difference is significant.
The Concentration of SCFAs
The concentration (mmol/100 g) of SCFAs including acetate, propionate, and butyrate in the cecum chyme was measured using the internal standard method with High Performance Gas Chromatography (Trace 1300, Thermo Fisher Scientific, America) (33). Next, the contents (mmol) of acetate, propionate and butyrate in the total cecum chyme were calculated. The content of a certain SCFA = the concentration of a certain SCFA (mmol/100 g) × the weight of the total cecum chyme (g) × 100.
Statistical Analysis
Statistical analyses of indexes were performed using one-way analysis of variance (ANOVA) via the SPSS 22.0 software. The T-test was used to compare indexes between the two breeds of hens. The results are expressed as the means with pooled standard error of the mean (SEM) (34). A P-value < 0.05 was considered significant.
Results
For simplicity, the “Bian hens–20 weeks” are named BHT, and the “ISA Brown hens–20 weeks” are named IBHT. BHT includes the BHT-OL, BHT-OL and BHT-OF groups, and IBHT includes the IBHT-OL, IBHT-OL and IBHT-OF groups.
Growth Performance
There were no differences among the three groups of Bian hens (BH) and ISA brown hens (IBH) in terms of growth performance, including the body weight (BW), average daily feed intake (ADFI), and average daily gain (ADG) (P > 0.05).
Laying Performance
On average, hens in the BH-OL and OH groups laid their first eggs at 21 and 22 weeks, respectively, while the hens in the OF group laid their first eggs at 24 weeks old. The OL and OH groups produced 45 and 12 eggs earlier than the OF group, respectively. The laying rates in the OL and OH groups were 14.17 and 5.36%, respectively, while the OF group had yet to lay any eggs (Table 2). This suggests that adding eubiotic lignocellulose to feed can effectively advance the laying age of BH and increase economic benefits. The egg weights and laying rates among the three groups were not significantly different during the laying period (24-27 weeks), but the egg weights of the OL and OH groups were significantly higher than those of the OF group at 24 weeks (P < 0.05) (Table 2).
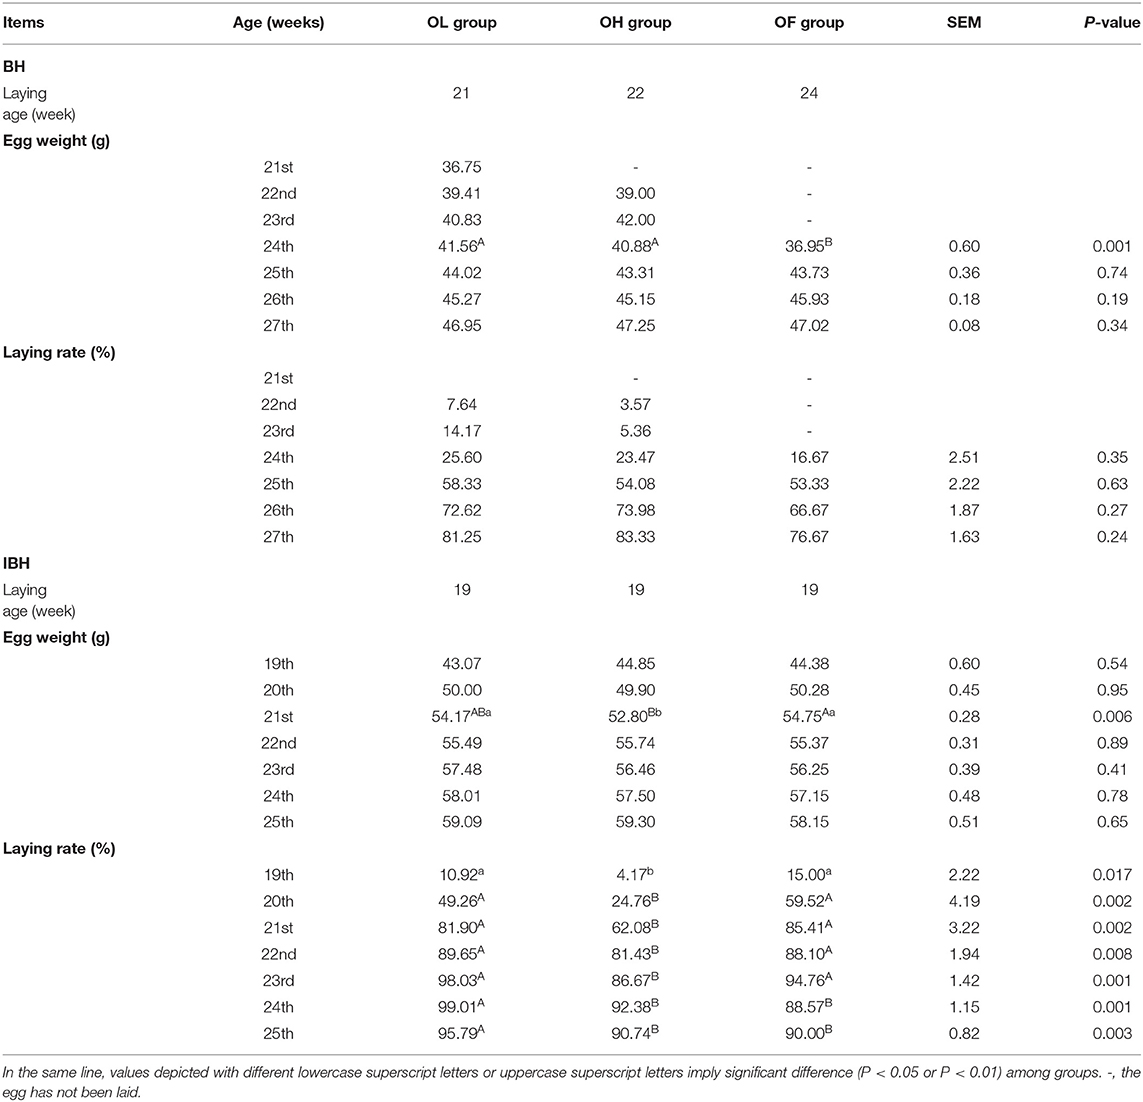
Table 2. Effect of adding eubiotic lignocellulose on the laying performance of BH and IBH.
In contrast with BH, all the IBH groups laid their first eggs at 19 weeks old. There was no significant difference in egg weight among the three groups within different laying periods (19-25 weeks), but egg weights in the OL and OF groups were significantly higher than that in the OH group at 21 weeks (P < 0.05), and the average daily laying rates in the OL and OF groups were significantly higher than that of the OH group (P < 0.01) (Table 2). As such, adding a high level (4%) of eubiotic lignocellulose inhibited the laying rate of IBH.
Development of Gastrointestinal Tract
Comparison of Development of Gastrointestinal Tract Among Groups
There were no significant differences among the three groups of BH, except that the cecum weight of hens in the OL group was significantly higher than that of hens in the OH group (P < 0.05) (Table 3). However, for IBH, the weight of the crop in the OL and OH groups was significantly lower than in the OF group (P < 0.01). In addition, in IBH the weight and length of the small intestine and cecum were significantly lower in the OH group than in the OF group (P < 0.05) (Table 3). This indicates that the addition of eubiotic lignocellulose inhibited the development of the gut in IBH.
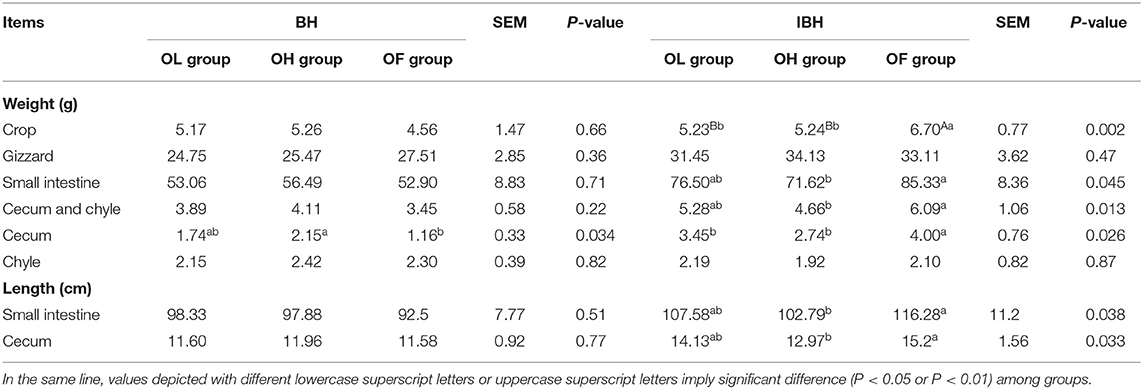
Table 3. Effect of adding eubiotic lignocellulose on the development of gastrointestinal tract among groups in BH and IBH.
Comparison of Development of Gastrointestinal Tract Between BH and IBH
The values representing the development of the gastrointestinal tract in BH were significantly lower than those of IBH (P < 0.05 or P < 0.01), except for crop ratio, gizzard ratio and cecum chyme weight (P > 0.05) (Figure 1). In addition, BH preferred granular corn to powder feed (Figures 2A–C), while IBH preferred powder feed and avoided granular corn (Figures 2D–F).
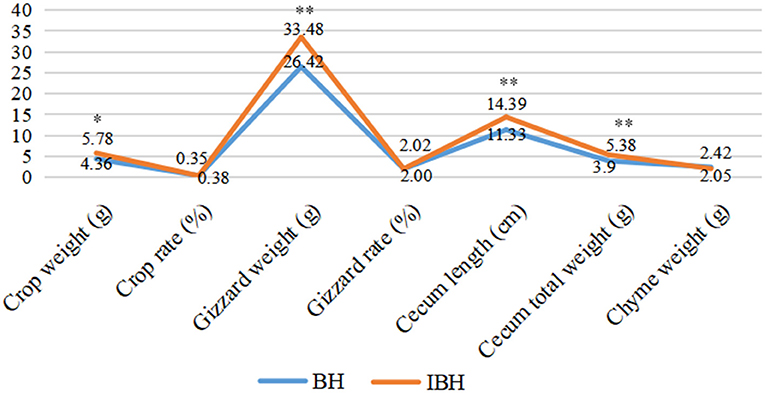
Figure 1. Comparison of effect of adding eubiotic lignocellulose on the development of gastrointestinal tract between BH and IBH. * or ** imply significant difference (P < 0.05 or P < 0.01).
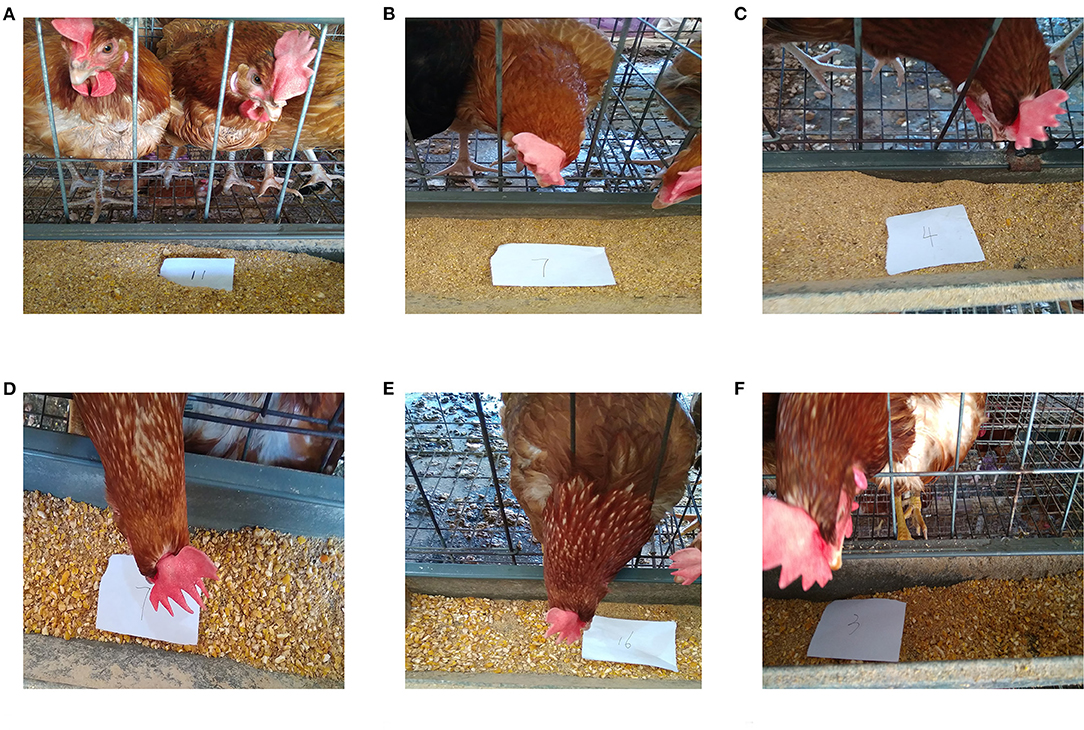
Figure 2. Leftovers of Bian hens–20 weeks (BHT) and ISA Brown hens–20 weeks (IBHT). (A-C) Part of the powder feed remained in the BHT's chute. (D-F) Part of the powder feed remained in the IBHT's chute.
OTUs and Gut Microbial Diversity
Comparison of OTUs and Gut Microbial Diversity Among Groups
In BH, the differences between the numbers of total OTUs and unique OTUs in the OL (1,004, 114) and OH groups (984, 102) and those in the OF group (1,007, 130) were minor. In IBH, the number of OTUs in the OH group (1,180, 208) was slightly higher than in the OL (1,057, 116) and OF groups (983, 88). There were no significant differences in gut microbial α-diversity or β-diversity among the three groups of BH and IBH (P > 0.05).
Comparison of OTUs and Gut Microbial Diversity Between BH and IBH
The number of total and unique OTUs of BH-OH group (984, 178) were less than those in IBH-OH group (1,180, 374) (Figures 3A–C). The β-diversity of BH-OH group (0.18) was also significantly lower than those in IBH-OH group (0.23) (P < 0.05) (Figure 3D). The PCoA clustering graph shows that the samples were clearly clustered by breed (Figure 3E).
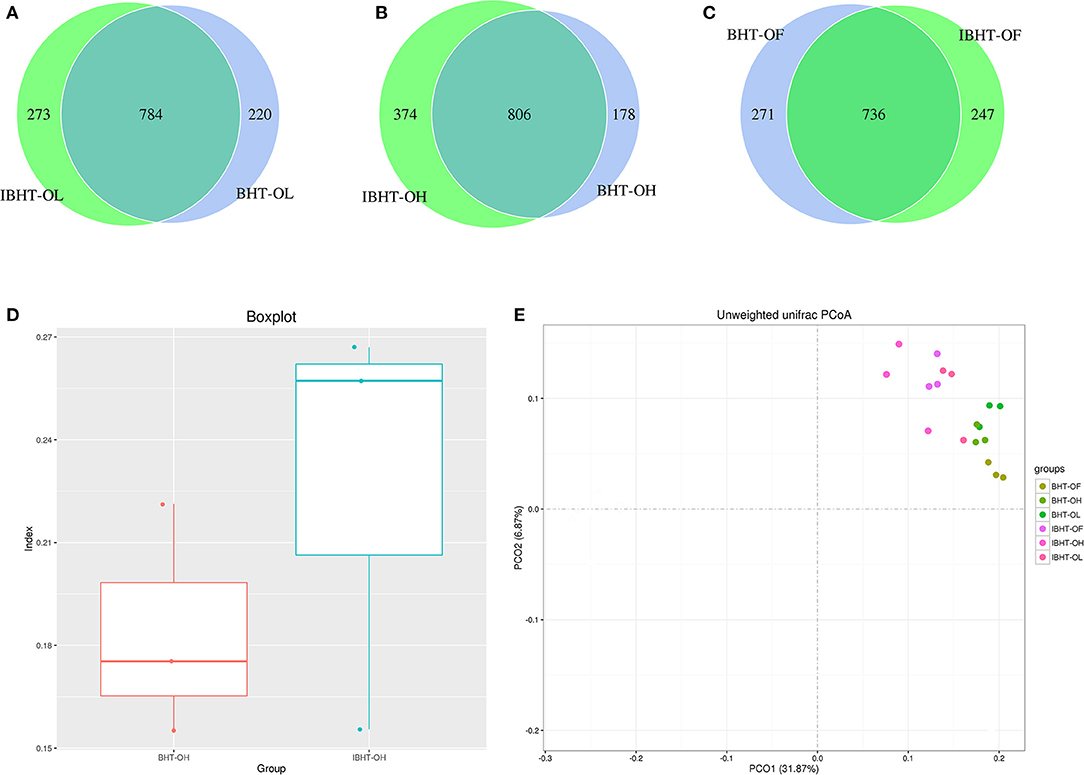
Figure 3. Comparison of OTUs (operational taxonomic units), PCoA (principal coordinates analysis), and gut microbial diversity between Bian Hens–20 weeks (BHT) and ISA Brown Hens–20 weeks (IBHT). (A-C) The Venn diagram of comparison of OTUs between BHT and IBHT. The overlapping parts show the number of OTUs shared by two groups, while the values on either side are the numbers of unique OTUs in each group, respectively. (D) Box plot of β-diversity between BHT and IBHT. (E) Principal coordinates analysis (PCoA) of samples of BHT and IBHT. Different color dots represent samples from different groups of two breeds.
Gut Microbial Composition
An LEfSe of gut microbial composition was constructed using LDA (linear discriminant analysis). Figures 4–6 showed certain microbes that displayed significant differences (LDA value > 2) between groups or breeds. Fiber-degradation bacteria and SCFAs-producing bacteria with significant differences in these figures were concentrated on.
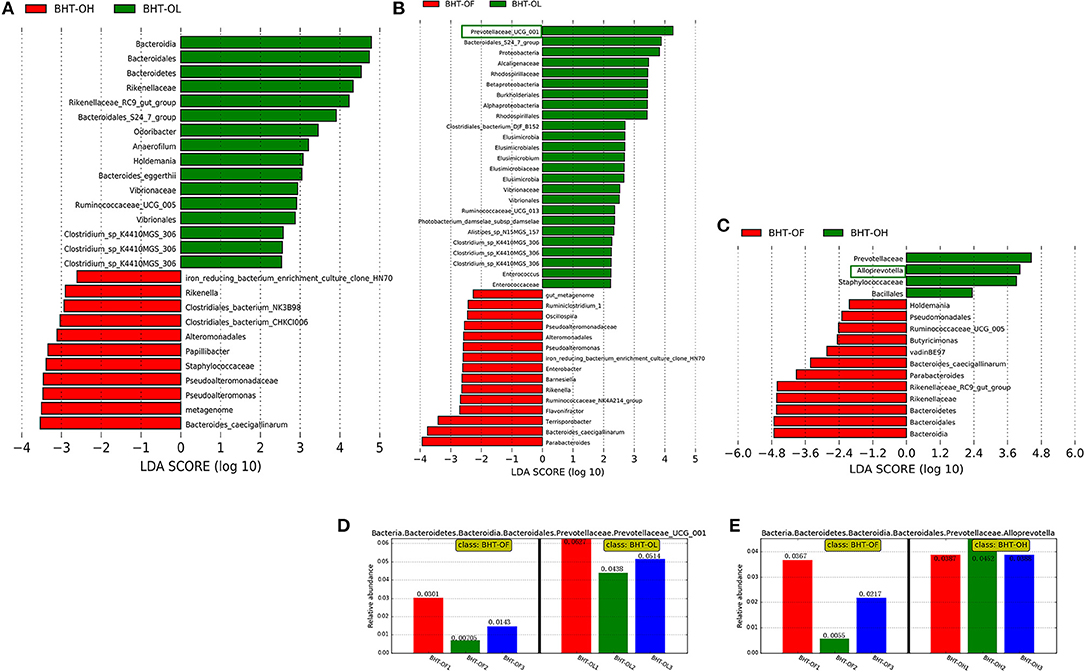
Figure 4. Linear discriminant analysis (LDA) among the groups of Bian hens–20 weeks (BHT) and abundance histograms of the dominant bacteria. (A) BHT-OL vs. BHT-OH. (B) BHT-OL vs. BHT-OF. (C) BHT-OF vs. BHT-OH. A value of LDA > 2 represents that the difference in the relative abundances of certain microbes was significant between groups. (D) The abundance histogram of dominant fiber-degrading genus Prevotellaceae_UCG-001 (green frame, Figure 2B) in the OL group compared to the OF group. (E) The Abundance histogram of dominant fiber-degrading genus Alloprevotella (green frame, Figure 2C) in the OH group compared to the OF group. OL, OptiCell (OC)-low; OH, OC-high; OF, OC-free.
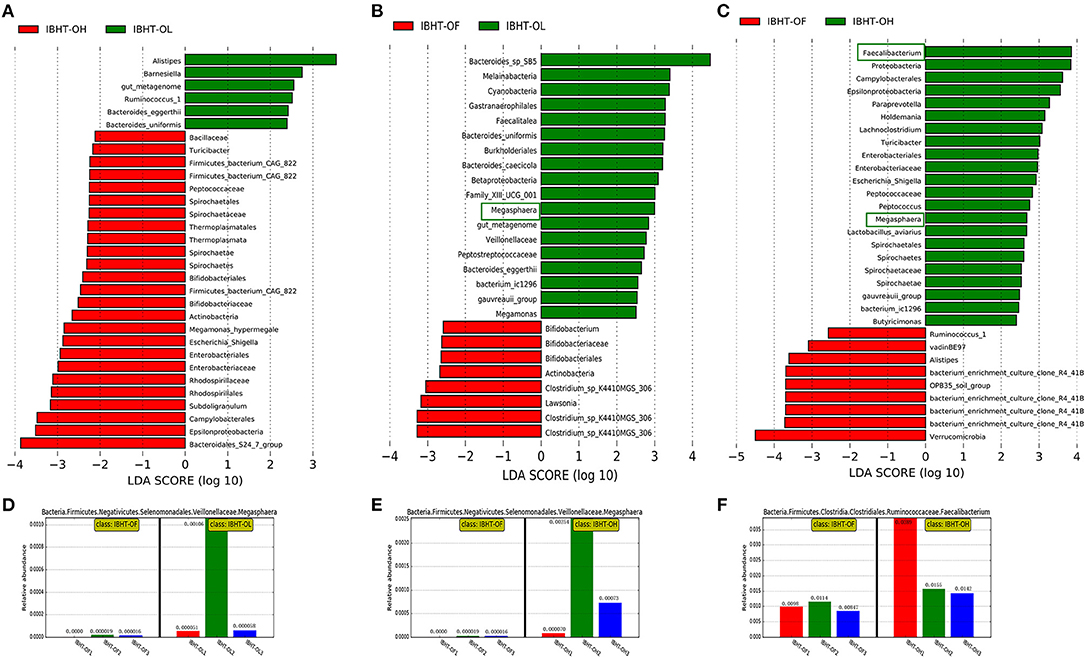
Figure 5. LDA (linear discriminant analysis) among groups of ISA Brown hens–20 weeks (IBHT) and abundance histograms of the dominant bacteria. (A) IBHT-OL vs. IBHT-OH. (B) IBHT-OL vs. IBHT-OF. (C) IBHT-OH vs. IBHT-OF. (D,E) The abundance histogram of dominant butyrate-producing genus Megasphaera in the OL group (green frame, B) and OH group (green frame, C) compared to the OF group. (F) The abundance histogram of dominant butyrate-producing genus Faecalibacterium (green frame, C) in the OH group compared to the OF group.
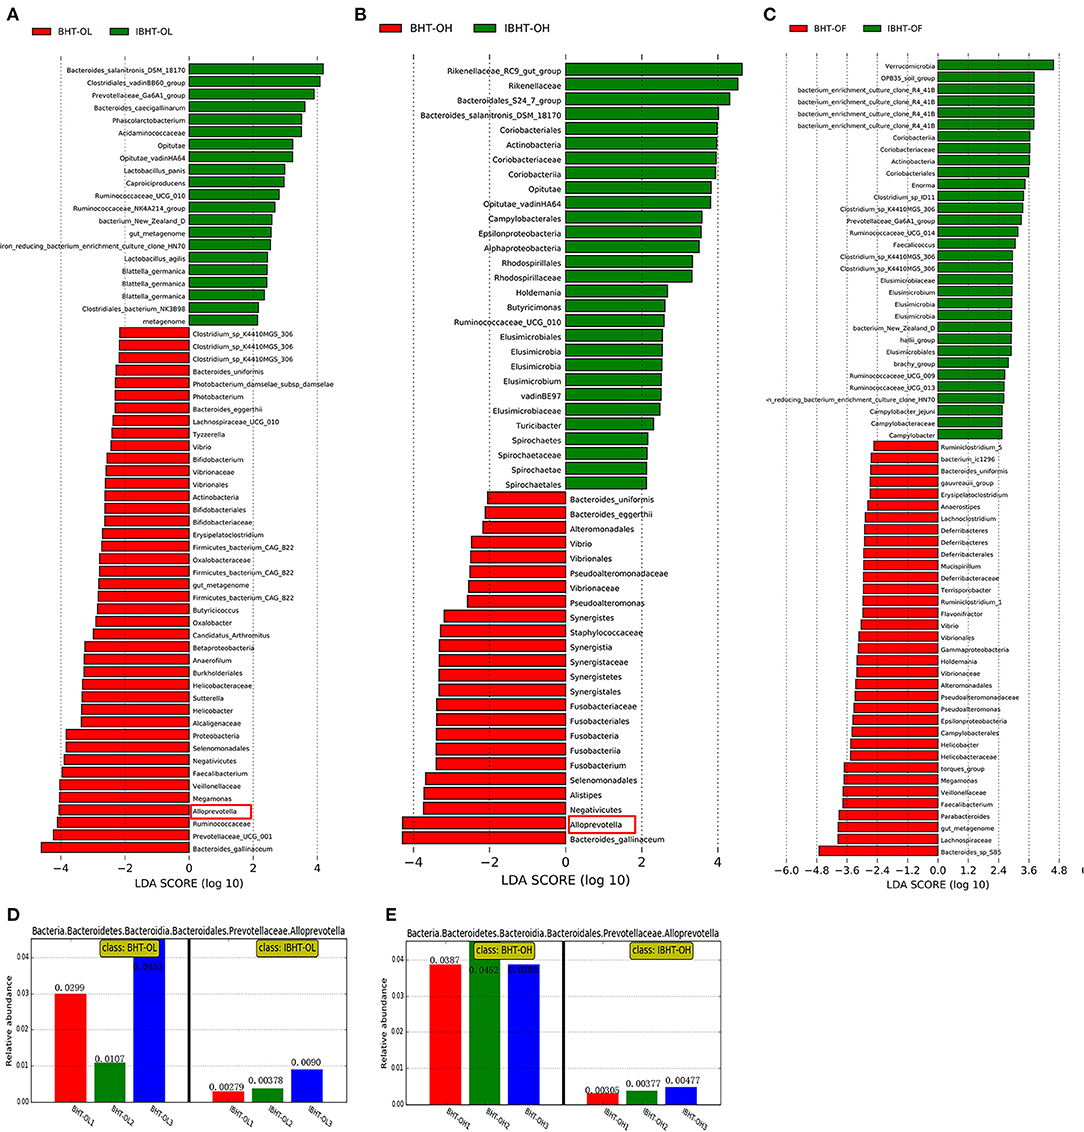
Figure 6. Linear discriminant analysis (LDA) between Bian hens–20 weeks (BHT) and ISA Brown hens–20 weeks (IBHT) and abundance histograms of the dominant bacteria. (A) BHT-OL vs. IBHT-OL. (B) BHT-OH vs. IBHT-OH. (C) BHT-OF vs. IBHT-OF. (D,E) Abundance histograms of dominant fiber-degradation genus Alloprevotella in BH compared to those in IBH.
Comparison of Gut Microbial Composition Among the Groups
In BH, the relative abundances of the fiber-degrading genera Prevotellaceae_UCG-001 in the OL group (5.27%) [Figure 4B (green frame), Figure 4D] and Alloprevotella in the OH group (4.09%) [Figure 4C (green frame), Figure 4E] were significantly greater than those in the OF group (1.72, 2.13%) (P < 0.05).
In IBH, the relative abundance of the butyrate producer Megasphaera in the OL (0.039%) [Figure 5B (green frame), Figure 5D] and OH groups (0.11%) [Figure 5C (green frame), Figure 5E] was significantly greater than that in the OF group (0.0013%) (P < 0.05). In addition, the relative abundance of the butyrate-producing genus Faecalibacterium in the OH group (2.29%) [Figure 5C (green frame), Figure 5F] was significantly greater than that in the OF group (0.99%) (P < 0.05).
Comparison of Gut Microbial Composition Between BH and IBH
The relative abundances of fiber-degrading bacterial genera Alloprevotella (2.86%) [Figure 6B (red frame), Figure 6D], and Prevotellaceae_UCG-001 (5.27%) and butyrate-producing bacteria Faecalibacterium (2.77%) in the BH-OL group were significantly greater than those in the IBH-OL group (0.52, 1.79, 1.06%) (P < 0.05), respectively.
In addition, the relative abundances of fiber-degrading bacterial genera Alloprevotella (4.09%) [Figure 6C (red frame), Figure 6E] and butyrate-producing bacteria Fusobacterium (0.59%) of BH-OH group were significantly higher than those in the IBH-OH group (0.39, 0.11%) (P < 0.05), respectively.
Notably, Bacteroides thetaiotaomicron, which was one of the best fiber-degrading bacterial species, was detected in all groups of BH (0.0037, 0.0014, 0.0015%), but it was lacking in the IBH groups (0, 0, 0%). It may be unique to BH.
Concentration of SCFAs
Comparison of Gut Microbial Composition Among Groups
In BH, there were no significant differences among the groups in the concentration (mmol/100 g) and content (mmol) of SCFAs in the cecum chyme (P > 0.05), but the levels of SCFAs in the OL and OH groups were higher than those in the OF group (Table 4). In contrast, in IBH, the level of SCFAs in the OH group was lower than those in the OL and OF groups (Table 4). In particular, the concentration of butyrate in the OH group was significantly lower than that in the OL and OF groups (P < 0.05). In addition, the content of SCFAs in the total cecum chyme of the OH group was also significantly lower than in the OL and OF groups (P < 0.01) (Table 4).
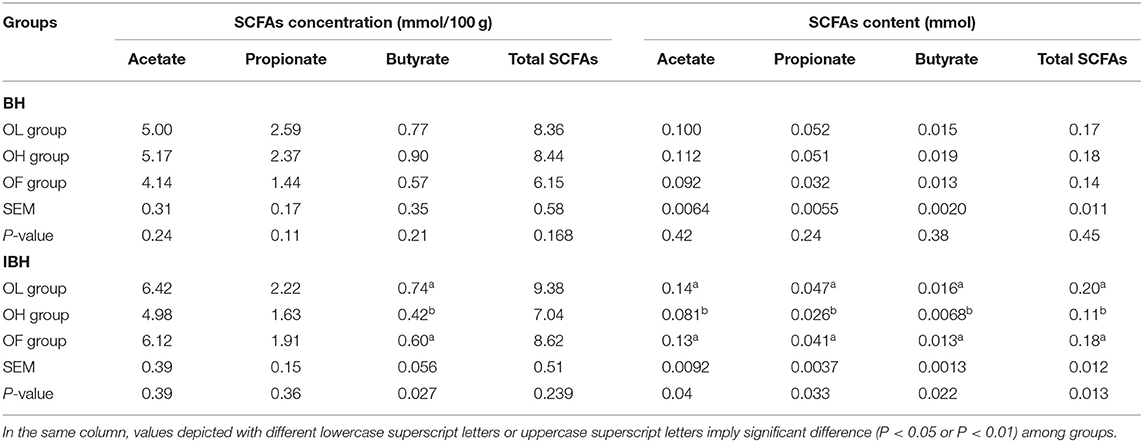
Table 4. Effect of eubiotic lignocellulose on the concentration of and content of SCFAs in BH and IBH.
Comparison of Gut Microbial Composition Between BHT and IBHT
The concentration (mmol/100 g) of butyrate in the IBHT-OH group was also significantly lower BHT-OH group (P < 0.05).
Discussion
Effect of Adding Eubiotic Lignocellulose on Growth Performance
In this study, the effect of adding eubiotic lignocellulose on the growth performance of Bian hens and ISA Brown hens was not significant. One reason for this result is that there were no significant differences in feed intake. This was supported by research suggesting that increasing dietary fiber has no significant effects on the ADFI of Ross 308 broilers and Hy-Line W36 layers within the 1–21d age period (6). The other reason was that eubiotic lignocellulose itself provides almost no energy, and SCFAs acetate which are produced by gut microbe degradation (11) showed no significant differences among groups in this study, resulting in no significant differences in growth performance among groups. Acetate is the main way for the body to obtain energy from dietary fiber (35). The oxidation of acetate provides 0.876 MJ/mol of energy. It can provide 1.2–10% of the total daily energy for human beings (36).
Effect of Adding Eubiotic Lignocellulose on Laying Performance
Our results showed that the addition of eubiotic lignocellulose to the diet of BH aged 9–20 weeks significantly advanced the day of at which the first egg was laid, as well as their laying rate. Studies also have shown that the adding of 1% eubiotic lignocellulose to the diets of hens aged 30–38 weeks increases the egg production rate by 1.2% and the profit by 2% while reducing the feed conversion rate by 6% (9). However, adding 4% eubiotic lignocellulose inhibited the egg production of IBH in this study. This indicates that the tolerance of the Chinese native breed BH to eubiotic lignocellulose is stronger than that of the commercial breed IBH. One explanation may be that the addition of 4% eubiotic lignocellulose significantly inhibits the development of intestinal tissues, such as those in the small intestine of IBH, and thus reduces production performance. This is because dietary fiber is a kind of nutrient diluent, and a high fiber concentration has a negative effect on the digestion and absorption of nutrients in the intestine (37). One study also showed that 1-21-day-old laying hens had a greater capacity for fiber digestion and fermentation than broilers, which may be due to the relatively long intestinal tracts of laying hens (6).
The other reason may be that adding 4% prebiotic lignocellulose had little effect on the cecum of BH but inhibited the development of the cecum and reduced the total weight of the cecum chyme, resulting in the lower SCFA contents in the total cecum chyme. Cecum is the main contributor to fiber degradation and fermentation in chickens (38). SCFAs fermented from dietary fiber can act as energy and carbon sources for poultry (39). Chicken can derive about 8% of their energy from SCFAs (40), while ostriches can derive as much as 76% and promote the laying performance (41). SCFAs can also enhance host immunity. Therefore, the lower SCFA contents of the 4% group of IBH may lead to a poor laying performance. The mechanism enabling the BH to have a greater tolerance to high levels of eubiotic lignocellulose than IBH needs further exploration.
Effect of Adding Eubiotic Lignocellulose on Development of the Gastrointestinal Tract
In the present study, the addition of a high level of eubiotic lignocellulose (4%) improved the development of the cecum in BH. This was supported by research which reported that consumption of a high fiber diet can also increase the relative length and weight of the chicken cecum (3). However, added 4% eubiotic lignocellulose significantly inhibited the development of the gastrointestinal tract, including the cecum, in IBH. This further supports the idea that BH have a stronger tolerance to dietary fiber than IBH. This effect may be linked to the different feeding habits of the two breeds of chicken. Poultry often pick larger food particles, leaving powder (42, 43). It was found that feeding with whole grain increased the gizzard weight of broilers. On the contrary, the gizzards of poultry fed a fine-grain diet were underdeveloped (44). Interestingly, in this experiment, BH preferred granular corn, while IBH preferred powder. This preference may have helped to stimulate the development of the crop and gizzards of BH, resulting in the absence of a significant difference in crop and gizzard rate between BH and IBH.
Effect of Adding Eubiotic Lignocellulose on the Gut Microbiota and SCFAs
In this experiment, the addition of eubiotic lignocellulose did not increase the microbial diversity, but it did increase the relative abundances of the fiber-degrading bacteria Prevotellaceae_UCG-001 and Alloprevotella, which are homologous with the Prevotella in BH. Prevotella is an excellent fiber-degrading bacterial genus with a strong fiber-degrading ability in Bacteroidetes (45). Some research has also shown that the consumption of dietary fiber can increase the abundance of Prevotella (46, 47). Therefore, although there were no great differences in concentrations of SCFAs among the BH groups, the levels of SCFAs in the OL and OH groups were higher than those in the OF group.
Moreover, in this study, the addition of 4% eubiotic lignocellulose increased the concentrations of the butyrate-producing bacteria Megasphaera and Faecalibacterium in the IBH group compared with the OF group. Butyrate-producing bacteria Faecalibacterium can ferment glucose into butyrate (22, 48). However, because of the lower cecal length and chyme weight, the butyrate concentration (mmol/100 g chyme) and SCFAs content (mmol) in the total cecum chyme of the OH group were lower than in the OF group. This may have caused the poor laying performance of this group. Currently, most research focuses on the effects of the concentration of SCFAs on the host. In fact, the effects of the SCFAs content in total chyme on the nutrition and health of the host should be emphasized. However, it seems impractical to sample and weigh the total chyme levels in the colons of humans or the rumen of cattle.
Effect of Breeds on the Gut Microbiota and SCFAs
In this experiment, the relative abundances of the fiber-degrading bacteria genus Alloprevotella and the butyrate-producing bacteria Fusobacterium in the BH-OH group were significantly greater than in the IBH-OH group, resulting in the effective degradation and fermentation of lignocellulose into butyrate. Furthermore, the concentration of butyrate in the BH-OH group was significantly higher than that in the IBH-OH group. Butyrate is the preferred raw material for intestinal cells (49). About 95% of butyrate is absorbed into epithelial cells, which is then rapidly oxidized into ketones for ATP synthesis, providing ~70% of their energy (23) and promoting epithelial cell proliferation (50). Therefore, one reason for the poor development of the cecum in the IBH-OH group may have been that the low content of butyrate failed to provide sufficient energy for the epithelial cells.
In addition, in the present study, the excellent fiber-degrading bacterial species Bacteroides thetaiotaomicron was only detected in BH, but was lacking in IBH. B. thetaiotaomicron is one of the best fiber-degrading bacteria. More than a quarter of this genome can motivate the degradation of polysaccharides (such as rhamnogalacturonan II (RG-II), which is known to be the most complex glycan in pectin) into monosaccharides (15, 51). These differences should also be reasons that the tolerance of BH to eubiotic lignocellulose was greater than that of IBH. This was also consist with some reports which showed that the gut microbiota in different chicken breeds was usually different (8, 52, 53). That was maybe because the gut microbiota and their hosts have co-evolved for a long time, and some microbiota only colonize specific hosts. For example, Japanese people who eat lots of sushi carry the unique bacteria Bacteroides plebeius, which degrade Porphyra polysaccharide, while North Americans lack such bacteria (54).
Conclusion
The tolerance of BH to eubiotic lignocellulose was shown to be greater than that of IBH. Adding 2–4% eubiotic lignocellulose is appropriate for BH, while 0–2% eubiotic lignocellulose is appropriate for IBH.
Data Availability Statement
The datasets presented in this study can be found in online repositories. The names of the repository/repositories and accession number(s) can be found below: https://www.ncbi.nlm.nih.gov/sra/PRJNA719301.
Ethics Statement
The animal study was reviewed and approved by this experiment was approved by the Shanxi Agricultural University Animal Experiment Ethics Committee (license number: SXAU-EAW-2017-002Chi.001).
Author Contributions
YY: conceptualization, resources, and funding acquisition. LH: methodology and visualization. BS and LH: formal analysis, investigation, and data curation. BS: writing—original draft preparation, writing—review, and editing. YY and BS: project administration. All authors contributed to the article and approved the submitted version.
Funding
This research was funded by the Construction of Animal Husbandry Key Project of 1331 Project in Shanxi Province (J202011315) and the Construction of Double First-Class Key Disciplines of Animal Husbandry (J202111303) and the Modern Mountain Region Ecological Poultry Innovation Talent Team in Zunyi City (Zunyi Science and Technology Talents [2021] No. 5).
Conflict of Interest
The authors declare that the research was conducted in the absence of any commercial or financial relationships that could be construed as a potential conflict of interest.
Publisher's Note
All claims expressed in this article are solely those of the authors and do not necessarily represent those of their affiliated organizations, or those of the publisher, the editors and the reviewers. Any product that may be evaluated in this article, or claim that may be made by its manufacturer, is not guaranteed or endorsed by the publisher.
References
1. Redig P. The avian ceca: obligate combustion chambers or facultative afterburners? The conditioning influence of diet. J Exp Zool Suppl. (1989) 252:66-9. doi: 10.1002/jez.1402520511
2. Meng QW, Yan L, Ao X, Jang HD, Cho JH, Kim IH. Effects of chito-oligosaccharide supplementation on egg production, nutrient digestibility, egg quality and blood profiles in laying hens. Asian-Aust J Anim Sci. (2010) 23:1476–81. doi: 10.5713/ajas.2010.10025
3. Ghasemiana M, Jahanian R. Dietary mannan-oligosaccharides supplementation could affect performance, immunocompetence, serum lipid metabolites, intestinal bacterial populations, and ileal nutrient digestibility in aged laying hens. Anim Feed Sci Technol. (2016) 213:81–9. doi: 10.1016/j.anifeedsci.2015.12.012
4. Pandit RJ, Hinsu AT, Patel NV, Koringa PG, Jakhesara SJ, Thakkar JR, et al. Microbial diversity and community composition of caecal microbiota in commercial and indigenous Indian chickens determined using 16Sr DNA amplicon sequencing. Microbiome. (2018) 6:1-13. doi: 10.1186/s40168-018-0501-9
5. Walugembe M, Rothschild MF, Persia ME. Effects of high fiber ingredients on the performance, metabolizable energy and fiber digestibility of broiler and layer chicks. Anim Feed Sci Technol. (2014) 188:46–52. doi: 10.1016/j.anifeedsci.2013.09.012
6. Duke GE, Ecclestone E, Kirkwood S, Louis CF, Bedbury HP. Cellulose digestion by domestic turkeys fed low or high fibre diets. J Nutr. (1984) 114:95-102. doi: 10.1093/jn/114.1.95
7. Schnorr SL, Candela M, Rampelli S, Centanni M, Consolandi C, Basaglia G, et al. Gut microbiome of the Hadza hunter-gatherers. Nat Commun. (2014) 5:3654. doi: 10.1038/ncomms4654
8. Shang H, Hu T, Lu Y, Wu H. Effects of chicory water-soluble extract on egg-yolk cholesterol, gut microflora and performance of laying hens. Chin J Anim Nutr. (2010) 22:1037-45.
9. Kroismayr A. Choosing the right fibre for poultry-eubiotic lignocellulose. Int Poult Prod. (2014) 22:17-9.
10. Kroismayr A, Roberts SA. Eubiotic lignocellulose-a new tool for swine nutritionists. Int Pig Top. (2010) 24:23-5.
11. Kaoutari AE, Armougom F, Gordon JI, Raoult D, Henrissat B. The abundance and variety of carbohydrate-active enzymes in the human gut microbiota. Nat Rev Microbiol. (2013) 11:1-9. doi: 10.1038/nrmicro3050
12. Zhu L, Wu Q, Dai J, Zhang S, Wei F. Evidence of cellulose metabolismby the giant panda gut microbiome. PANS. (2011) 108:17714-9. doi: 10.1073/pnas.1017956108
13. Larsbrink J, Rogers TE, Hemsworth GR, McKee LS, Tauzin AS, Spadiut O, et al. A discrete genetic locus confers xyloglucan metabolism in select human gut Bacteroidetes. Nature. (2014) 506:498-502. doi: 10.1038/nature12907
14. Accetto T, Avguštin G. Polysaccharide utilization locus and CAZYme genome repertoires reveal diverse ecological adaptation of Prevotella species. Syst Appl Microbiol. (2015) 38:453-461. doi: 10.1016/j.syapm.2015.07.007
15. Luis AS, Briggs J, Zhang XA, Farnell B, Gilbert HJ. Dietary pectic glycans are degraded by coordinated enzyme pathways in human colonic Bacteroides. Nat Microbiol. (2018) 3:210-9. doi: 10.1038/s41564-017-0079-1
16. Suen G, Weimer PJ, Stevenson DM, Aylward FO, Boyum J, Deneke J. The complete genome sequence of Fibrobacter succinogenes s85 reveals a cellulolytic and metabolic specialist. PLos ONE. (2011) 6:e18814. doi: 10.1371/journal.pone.0018814
17. Leth ML, Ejby M, Workman C, Ewald DA, Pedersen SS, Sternberg C, et al. Differential bacterial capture and transport preferences facilitate co-growth on dietary xylan in the human gut. Nat Microbiol. (2018) 3:570-80. doi: 10.1038/s41564-018-0132-8
18. Artzi L, Bayer EA, Moraïs S. Cellulosomes: bacterial nanomachines for dismantling plant polysaccharide. Nat Rev Microbiol. (2016) 15:1-13. doi: 10.1038/nrmicro.2016.164
19. Koh A, Vadder FD, Kovatcheva-Datch P, Bäckhed F. From dietary fiber to host physiology: short-chain fatty acids as key bacterial metabolites. Cell. (2016) 165:1332-45. doi: 10.1016/j.cell.2016.05.041
20. Derrien M, van Hylckama Vlieg JET. Fate, activity, and impact of ingested bacteria within the human gut microbiota. Trends Microbiol. (2015) 23:354-66. doi: 10.1016/j.tim.2015.03.002
21. Hilpert W, Dimroth P. Conversion of the chemical energy of methylmalonyl-CoA decarboxylation into a Na+ gradient. Nature. (1984) 296:584-5. doi: 10.1038/296584a0
22. Duncan SH, Hold GL, Harmsen HJ, Stewart CS, Flint HJ. Growth requirements and fermentation products of Fusobacterium prausnitzii, and a pro-posal to reclassify it as Faecalibacterium prausnitzii gen. nov., comb. Nov Int J Syst Evol Microbiol. (2002) 52:2141-6. doi: 10.1099/00207713-52-6-2141
23. Donohoe DR, Garge N, Zhang X, Sun W, O'Connell TM, Bunger MK, et al. The microbiome and butyrate regulate energy metabolism and autophagy in the mammalian colon. Cell Metab. (2011) 13:517-26. doi: 10.1016/j.cmet.2011.02.018
24. Zhang S, Zhong G, Shao D, Wang Q, Hu Y, Wu T, et al. Dietary supplementation with Bacillus subtilis promotes growth performance of broilers by altering the dominant microbial community. Poult Sci. (2021) 100:100935. doi: 10.1016/j.psj.2020.12.032
25. Sun B, Hou L, Yang Y. The development of the gut microbiota and short-chain fatty acids of layer chickens in different growth periods. Front Vet Sci. (2021) 8:1-13. doi: 10.3389/fvets.2021.666535
26. Magoč T, Salzberg SL. FLASH: fast length adjustment of short reads to improve genome assemblies. Bioinformatics. (2011) 27:2957-63. doi: 10.1093/bioinformatics/btr507
27. Bokulich NA, Subramanian S, Faith JJ, Gevers D, Gordon JI, Knight R, et al. Quality-filtering vastly improves diversity estimates from Illumina amplicon sequencing. Nat Methods. (2013) 10:57-9. doi: 10.1038/nmeth.2276
28. Edgar RC. UPARSE, highly accurate OTU sequences from microbial amplicon reads. Nat Methods. (2013) 10:996-8. doi: 10.1038/nmeth.2604
29. Oksanen J, Blanchet FG, Kindt R, Legendre P, O'Hara RB, Simpson G L, et al. Vegan, community ecology package. R package version 1.17-4. Acesso. (2010) 23:2010.
30. Edgar RC. MUSCLE, multiple sequence alignment with high accuracy andhigh throughput. Nucleic Acids Res. (2004) 32:1792-7. doi: 10.1093/nar/gkh340
31. White JR, Nagarajan N, Pop M. Statistical methods for detecting differentially abundant features in clinical metagenomic samples. PLoS Comput Biol. (2009) 5:e1000352. doi: 10.1371/journal.pcbi.1000352
32. Segata N, Izard J, Waldron L, Gevers D, Miropolsky L, Garrett WS, et al. Metagenomic biomarker discovery and explanation. Genome Biol. (2011) 12:R60. doi: 10.1186/gb-2011-12-6-r60
33. Hou L, Sun B, Yang Y. Effects of added dietary fiber and rearing system on the gut microbial diversity and gut health of chicken. Animals. (2020) 10:1-22. doi: 10.3390/ani10010107
34. Hu Y, Wang L, Shao D, Wang Q, Wu Y, Han Y, et al. Selectived and reshaped early dominant microbial community in the cecum with similar proportions and better homogenization and species diversity due to organic acids as AGP alternatives mediate their effects on broilers growth. Front Microbiol. (2020) 10:2948. doi: 10.3389/fmicb.2019.02948
35. Reese AT, Dunn RR. Drivers of microbiome biodiversity: a review of general rules, feces, and ignorance. Microbiology. (2018) 9:e01294-18. doi: 10.1128/mBio.01294-18
36. Frost GS, Walton GE, Swann JR, Psichas A, Costabile A, Johnson LP, et al. Impacts of plant-based foods in ancestral hominin diets on the metabolism and function of gut microbiota in vitro. MBio. (2014) 5:e00853–14. doi: 10.1128/mBio.00853-14
37. Krogdahl Å. Antinutrients affecting digestive functions and performance inpoultry. In: Proceedings of the 7th European Poultry Conference. Paris (1986). p. 239–48.
38. Stevens E, Hume ID. Contributions of microbes in vertebrate gastrointestinal tract to production and conservation of nutrients. Physiol Rev. (1998) 78:393–427. doi: 10.1152/physrev.1998.78.2.393
39. Dunkley KD, Dunkley CS, Njongmeta NL, Callaway TR, Hume ME, Kubena LF, et al. Comparison of in vitro fermentation and molecular microbial profiles of high-fiber feedsubstrates incubated with chicken cecal inocula. Poult Sci. (2007) 86:801-10. doi: 10.1093/ps/86.5.801
40. Jo'zefiak D, Rutkowski A, Martin S. Carbohydrate fermentation in the avian ceca: a review. Anim Feed Sci Technol. (2004) 113:1–15. doi: 10.1016/j.anifeedsci.2003.09.007
41. Swart D, Mackie RI, Hayes JP. Influence of live mass, rate of passage and site of digestion on energy-metabolism and fiber digestion in the ostrich (struthio-camelus var domesticus). S Afr J Anim Sci. (1993) 23:119-26.
42. Singh Y, Amerah AM, Ravindran V. Whole grain feeding: methodologies and effects on performance, digestive tract development and nutrient utilisation of poultry. Anim Feed Sci Technol. (2014) 190:1–18. doi: 10.1016/j.anifeedsci.2014.01.010
43. Xiao Y, Zhang S, Tong H, Shi S. Comprehensive evaluation of the role of soy and isoflavone supplementation in humans and animals over the past two decades. Phytother Res. (2018) 32:384–94. doi: 10.1002/ptr.5966
44. Jimenez-Moreno E, Gonzalez-Alvarado JM, González Sánchez D, Lázaro R, Mateos GG. Effects of type and particle size of dietary fiber on growth performance and digestive traits of broilers from 1 to 21 days of age. Poult Sci. (2010) 89:2197-212. doi: 10.3382/ps.2010-00771
45. Gorvitovskaia A, Holmes SP, Huse SM. Interpreting Prevotella and Bacteroides as biomarkers of diet and lifestyle. Microbiome. (2016) 4:15. doi: 10.1186/s40168-016-0160-7
46. Wang X, Tsai T, Deng F, Wei X, Zhao J, Knapp J, et al. Longitudinal investigation of the swine gut microbiome from birth to market reveals stage and growth performance associated bacteria. Microbiome. (2019) 7:109. doi: 10.1186/s40168-019-0721-7
47. Filippo CD, Cavalieri D, Paola MD, Ramazzotti M, Poullet JB, Massart S, et al. Impact of diet in shaping gut microbiota revealed by a comparative study in children from Europe and rural Africa. PNAS. (2010) 107:14691-6. doi: 10.1073/pnas.1005963107
48. Shi S, Wu S, Shen Y, Zhang S, Xiao Y, He X, et al. Iron oxide nanozyme suppresses intracellular Salmonella Enteritidis growth and alleviates infection in vivo. Theranostics. (2018) 8:6149–62. doi: 10.7150/thno.29303
49. Roediger WE. Utilization of nutrients by isolated epithelial cells of the ratcolon. Gastroenterology. (1982) 83:424–9. doi: 10.1016/S0016-5085(82)80339-9
50. Roediger WE. Role of anaerobic bacteria in the metabolic welfare of the colonic mucosa in man. Gut. (1980) 21:793–8. doi: 10.1136/gut.21.9.793
51. Hehemann JH, Correc G, Barbeyron T, Helbert W, Michel G. Transfer ofcarbohydrate-active enzymes from marine bacteria to Japanese gut microbiota. Nature. (2010) 464:908-12. doi: 10.1038/nature08937
52. Zhao L, Wang G, Siegel P, He C, Wang H, Zhao W, et al. Quantitative genetic background of the host influences gut microbiomes in chickens. Sci Rep. (2013) 3:1163. doi: 10.1038/srep01163
53. Wu S, Shen Y, Zhang S, Xiao Y, Shi S. Salmonella interacts with autophagy to offense or defense. Front. Microbiol. (2019) 11:721. doi: 10.3389/fmicb.2020.00721
Keywords: eubiotic lignocellulose, hens, gut microbiota, short-chain fatty, laying performance, dietary fiber, Bian chicken, ISA brown chicken
Citation: Sun B, Hou L and Yang Y (2021) Effects of Adding Eubiotic Lignocellulose on the Growth Performance, Laying Performance, Gut Microbiota, and Short-Chain Fatty Acids of Two Breeds of Hens. Front. Vet. Sci. 8:668003. doi: 10.3389/fvets.2021.668003
Received: 24 February 2021; Accepted: 29 July 2021;
Published: 13 September 2021.
Edited by:
Shourong Shi, Chinese Academy of Agricultural Sciences, ChinaReviewed by:
Guanhong Li, Jiangxi Agricultural University, ChinaYupaporn Chaiseha, Suranaree University of Technology, Thailand
Copyright © 2021 Sun, Hou and Yang. This is an open-access article distributed under the terms of the Creative Commons Attribution License (CC BY). The use, distribution or reproduction in other forums is permitted, provided the original author(s) and the copyright owner(s) are credited and that the original publication in this journal is cited, in accordance with accepted academic practice. No use, distribution or reproduction is permitted which does not comply with these terms.
*Correspondence: Yu Yang, 345605203@qq.com
†These authors have contributed equally to this work