
First-Principle Study of Co-Adsorption Behavior of H2O and O2 on δ-Pu (100) Surface

1
Department of Nuclear Engineering, Xi’an Research Institute of High-Tech, Xi’an 710025, China
2
State Key Laboratory for Mechanical Behavior of Materials, Xi’an Jiaotong University, Xi’an 710049, China
*
Authors to whom correspondence should be addressed.
†
These authors contributed equally to this work.
Coatings 2021, 11(9), 1098; https://doi.org/10.3390/coatings11091098
Submission received: 19 August 2021
/
Revised: 7 September 2021
/
Accepted: 8 September 2021
/
Published: 11 September 2021
(This article belongs to the Special Issue Trends and Advances in Anti-wear Materials)
Abstract
:The surface corrosion of plutonium in air is mainly the result of the interaction with O2 and H2O in air. In this paper, the co-adsorption behavior of O2 and H2O on a δ-Pu (100) surface is studied by the first-principle method. Two different cases of preferential adsorption of H2O and O2 are considered, respectively. Bader charge analysis and adsorption energy analysis are carried out on all stable adsorption configurations, and the most stable adsorption configurations are found under the two conditions. The results of differential charge density analysis, the density of states analysis and Crystal Orbital Hamilton Populations (COHP) analysis show that the two molecules can promote each other’s adsorption behavior, which leads to the strength and stability of co-adsorption being far greater than that of single adsorption. In the co-adsorption configuration, O atoms preferentially interact with Pu atoms in the surface layer, and the essence is that the 2s and 2p orbitals of O overlap and hybridize with the 6p and 6d orbitals of Pu. H atoms mainly form O–H bonds with O atoms and hardly interact with Pu atoms on the surface layer.
1. Introduction
Plutonium plays a key role in the fields of national defense and energy. It is located at the boundary between light actinides with delocalized 5f electrons and heavy actinides with localized 5f electrons [1,2]. Plutonium is chemically active and tends to interact with gases such as O2, CO2, H2 and H2O in the air, which affects its service life severely [3,4,5,6,7]. Some experimental studies [8,9] showed that the corrosion rate of Pu in humid air is much higher than that in dry air. In order to reveal the mechanism of this phenomenon, many scholars have studied the high-speed oxidation mechanism of Pu in humid air [10,11,12]. The results show that the plutonium hydride PuHx is produced by the interaction between H2O and O2 in humid air and the surface of plutonium. H atoms released by this reaction will not form H2 molecules but will react with the inner Pu to form PuHx, and the generated H2O molecules will continue to interact with the surface of plutonium, repeating this reaction process, resulting in rapid corrosion of plutonium., i.e., H2O molecules in the air catalyze the corrosion of plutonium. The adsorption behavior of H2O and O2 molecules on the surface of plutonium is the first step of the interaction. Therefore, it is of great importance to study the single adsorption and co-adsorption behavior of H2O and O2 molecules on the surface of plutonium for understanding the corrosion mechanism of plutonium in air.
Due to the strong toxicity and radioactivity of plutonium, experimental research is facing great difficulties. Therefore, in recent years, many scholars have completed a lot of research works on the adsorption behavior of active atoms or molecules on the surface of pure plutonium or correspondence compounds. Taking the adsorption of CO molecules on δ-Pu (100) surface as an example, Delley et al. studied this problem by using the first-principle method under the framework of density functional theory (DFT) [13,14] and DMOL3 program [13,15]. The results show that the adsorption of CO on δ-Pu (100) surface is the most stable, and the interaction between them is mainly located at the first layer of the surface model, and the essence of the interaction is the overlapping hybridization of the hybrid orbitals of CO molecules with the orbitals of Pu5f, Pu6d and Pu7s [16,17]. Meanwhile, Gérald et al. [18] studied the adsorption behavior of H2O on the surface of PuO2 (110) by DFT calculation combined with the GGA+U method. The results show that the adsorption energy of H2O on the surface of PuO2 (110) is −0.87 eV, and the molecular adsorption state is only a metastable state. H2O will dissociate at last, and the dissociation energy is −1.12 eV. After dissociation, H atoms in H2O molecules combine with an O atom on the surface of PuO2 (110) to form hydroxyl OH, which is adsorbed on the surface together with the remaining hydroxyl OH. Huda et al. [19,20] revealed that the most stable adsorption sites of O atoms on δ-Pu (100) and δ-Pu (111) surfaces are hollow sites, and the adsorption of O2 molecules increase the work function of the plutonium surface and make it more difficult for electrons to escape from the surface.
Plutonium polymorphs have six phase structures, among which δ- Pu has the best ductility [2,21]. δ-Pu has two low index crystalline surfaces, namely, (100) surface and (111) surface. The localization degree of 5f electrons on the (100) surface is higher than that on the (111) surface [22]. In the present work, we intend to study the co-adsorption behavior of O2 and H2O on δ-Pu (100) surface by the first-principle method. First of all, it is necessary to build a variety of co-adsorption models for optimization to obtain a stable adsorption configuration and calculate its adsorption energy. Then, the adsorption strength will be analyzed by comparing the structural changes of H2O and O2 and δ-Pu (100) surface before and after adsorption. Bader charge analysis, differential charge density analysis, electronic density of states analysis and COHP calculation will be carried out on the most stable adsorption configuration in order to reveal the charge transfer, bonding strength and bonding nature in the adsorption process. The adsorption properties will be judged according to the final analysis results. This work will provide a necessary reference for revealing the influence of the combined action of O2 and H2O on the corrosion behavior of plutonium.
2. Computational Model and Method
2.1. Calculation Method
All the optimization calculations in this paper are completed by using the material calculation software VASP [23,24] based on first-principle. The plane wave basis set is expanded by the Projection Addressed Wave (PAW) [25,26] method, and the exchange correlation effect is described by Generalized Gradient Approximation (GGA) [27] method. PAW-PBE pseudopotential is used to treat H, O and Pu elements. Under this pseudopotential, 16 electrons (6s27s26p66d25f4) of Pu element are regarded as valence electrons, and 6 electrons (2s22p4) of O element are regarded as valence electrons. When the crystal unit cell is optimized, the K-point grid in the Brillouin zone is set to 7 × 7 × 7, and when the surface model is optimized and the adsorption configuration is optimized, the K-point grid in the Brillouin zone is set to 5 × 5 × 1; when calculating the density of states, the K-point grid in the Brillouin zone is set to 11 × 11 × 3, and all are generated by the Monkhorst–Pack method [28]; the plane wave truncation energy is uniformly set to 500 eV.
Adsorption energy is an important parameter to investigate adsorption stability. In this paper, the adsorption energy of each optimized adsorption configuration is compared to determine whether the adsorption configuration can exist stably. Negative adsorption energy indicates that adsorption is exothermic and adsorption configuration can exist stably, while regular adsorption energy indicates that adsorption is endothermic and adsorption configuration cannot exist stably, and the configuration with the most heat release is the most stable adsorption configuration. The calculation method of adsorption energy is shown in Formula (1).
In the above formula, Ea represents adsorption energy, Et represents the total energy of the optimized adsorption configuration, E1 represents the energy of H2O molecule optimized separately, E2 represents the energy of O2 molecule optimized separately and Es represents the energy of four-layer δ-Pu (100) surface optimized separately.
2.2. Computational Model
The δ-Pu crystal has an fcc structure, and the lattice constants optimized in this paper are a = b = c = 4.776 Å, α = β = γ = 90°. The lattice constants obtained from experiment [18] are a = b = c = 4.637 Å, α = β = γ = 90°. The difference between them is about 2.9%, which shows that the calculation in this paper is in good agreement with the experiment. When determining the surface model, we performed a supercell test on the δ-Pu (100) surface and calculated the surface energy of the p(2 × 2), p(2 × 3) and p(3 × 3) supercells. The corresponding coverage is 0.25 ML, 0.14 ML and 0.1 ML, respectively. The results show that the surface energies of p(2 × 2), p(2 × 3) and p(3 × 3) supercells are 0.047 eV/Å2, 0.043 eV/Å2 and 0.036 eV/Å2, respectively. The difference is very small, which has no significant influence on the main results of this paper. In order to improve the calculation efficiency, we use p(2 × 2) supercell as the surface base for calculation. Some literature [16,17] also used p(2 × 2) supercells and obtained good calculation results. Thus, in this paper, a 4-layer p(2 × 2) supercell plate periodic model is used to simulate the surface of δ-Pu (100), and the two layers on the surface are relaxed for optimization, while the lower two layers are fixed for optimization. After optimization, the relaxed two layers all declined to varying degrees. As shown in Figure 1a, the interlayer spacing was 2.111 Å, 1.998 Å and 2.388 Å from top to bottom. Before constructing the adsorption model, we also optimized the structure of O2 molecule and H2O molecule. The results show that the bond length of O2 molecule is 1.235 Å, the bond length of H–O bond in H2O molecule is 0.971 Å and the bond angle of H–O–H is 104.39°. Using this model, we studied the single adsorption of O2 and H2O molecules on δ-Pu (100) surface and found the most stable adsorption structure of the two gas molecules on δ-Pu (100) surface. O2 will dissociate after adsorption, and its most stable adsorption structure is that two O atoms occupy two bridge sites of the outermost atoms on the surface of δ-Pu (100), and the adsorption energy is −7.281 eV. As shown in Figure 1b, the bond lengths of the four Pu–O bonds are all 2.054 Å. H2O is adsorbed on the inclined top of the top surface of δ-Pu (100) in a molecular state. The adsorption energy of its most stable adsorption configuration is −0.305 eV, and its adsorption strength is far less than that of O2. As shown in Figure 1c, the plane of H2O molecule is basically parallel to the surface of δ-Pu (100), and it does not dissociate. The bond length of H–O bond becomes 0.984 Å, the bond angle (H–O–H) becomes 104.81°, the distance between O atom and the nearest Pu atom is 2.660 Å, and the average distance between two H atoms and the nearest Pu atom is 2.983 Å. According to the adsorption energy, charge analysis and electronic structure analysis of the most stable adsorption configurations of the two molecules, we think that the adsorption of O2 on δ-Pu (100) surface is strong chemical adsorption, and the adsorption of H2O on δ-Pu (100) surface is physical adsorption.
As for the single adsorption behavior of O2 molecule on the surface of δ-Pu (100), the calculation results of Jijun G et al. [29] show that O2 molecule initially placed in parallel to the heart position is dissociated after adsorption, and the two dissociated O atoms are stably adsorbed on a heart position and a bridge position on the surface of δ-Pu (100), which is the most stable, with adsorption energy of 7.290 eV. According to the calculation results of M N Huda and A K Ray [20], O2 molecule initially placed in the heart position and parallel to the surface of δ-Pu (100) also undergoes dissociation after adsorption, and the dissociated two O atoms are stably adsorbed at the two heart positions on the surface of δ-Pu (100), respectively, with adsorption energy of 8.236 eV. There is a paper [30] showing the adsorption of a single O atom on δ-Pu (111). The results show that O atom is preferentially adsorbed at the heart site, and the adsorption energy is 6.153 eV. With regard to the single adsorption behavior of H2O molecule on δ-Pu surface, the literature [31] studies the adsorption behavior of H2O molecule on δ-Pu (111) surface by DMOL3 software and WIEN2K program. The results show that H2O molecule will be adsorbed on the top site of δ-Pu (111) surface in parallel, which is also a weak physical adsorption. The research results of Hongyuan W [32] also show that the adsorption of water on δ-Pu (100) and δ-Pu (111) surfaces is weak physical adsorption. Therefore, although there are slight numerical differences between our results and those of previous scholars, the basic results obtained are not much different. The adsorption of O2 molecule on δ-Pu surface is a strong chemical adsorption, and virtually all of them will be dissociated, and the dissociated two O atoms will be preferentially adsorbed at the bridge position and the heart position. The adsorption of water on δ-Pu surface is a weak physical adsorption and tends to be parallel adsorption.
Two main situations are considered when constructing the co-adsorption model. Firstly, in the case of H2O preferential adsorption, the O2 adsorption model is constructed; that is, the most stable adsorption configuration of H2O single adsorption is taken as the substrate. Secondly, in the case of O2 preferential adsorption, the H2O adsorption model is constructed; that is, the most stable adsorption configuration of O2 single adsorption is taken as the substrate.
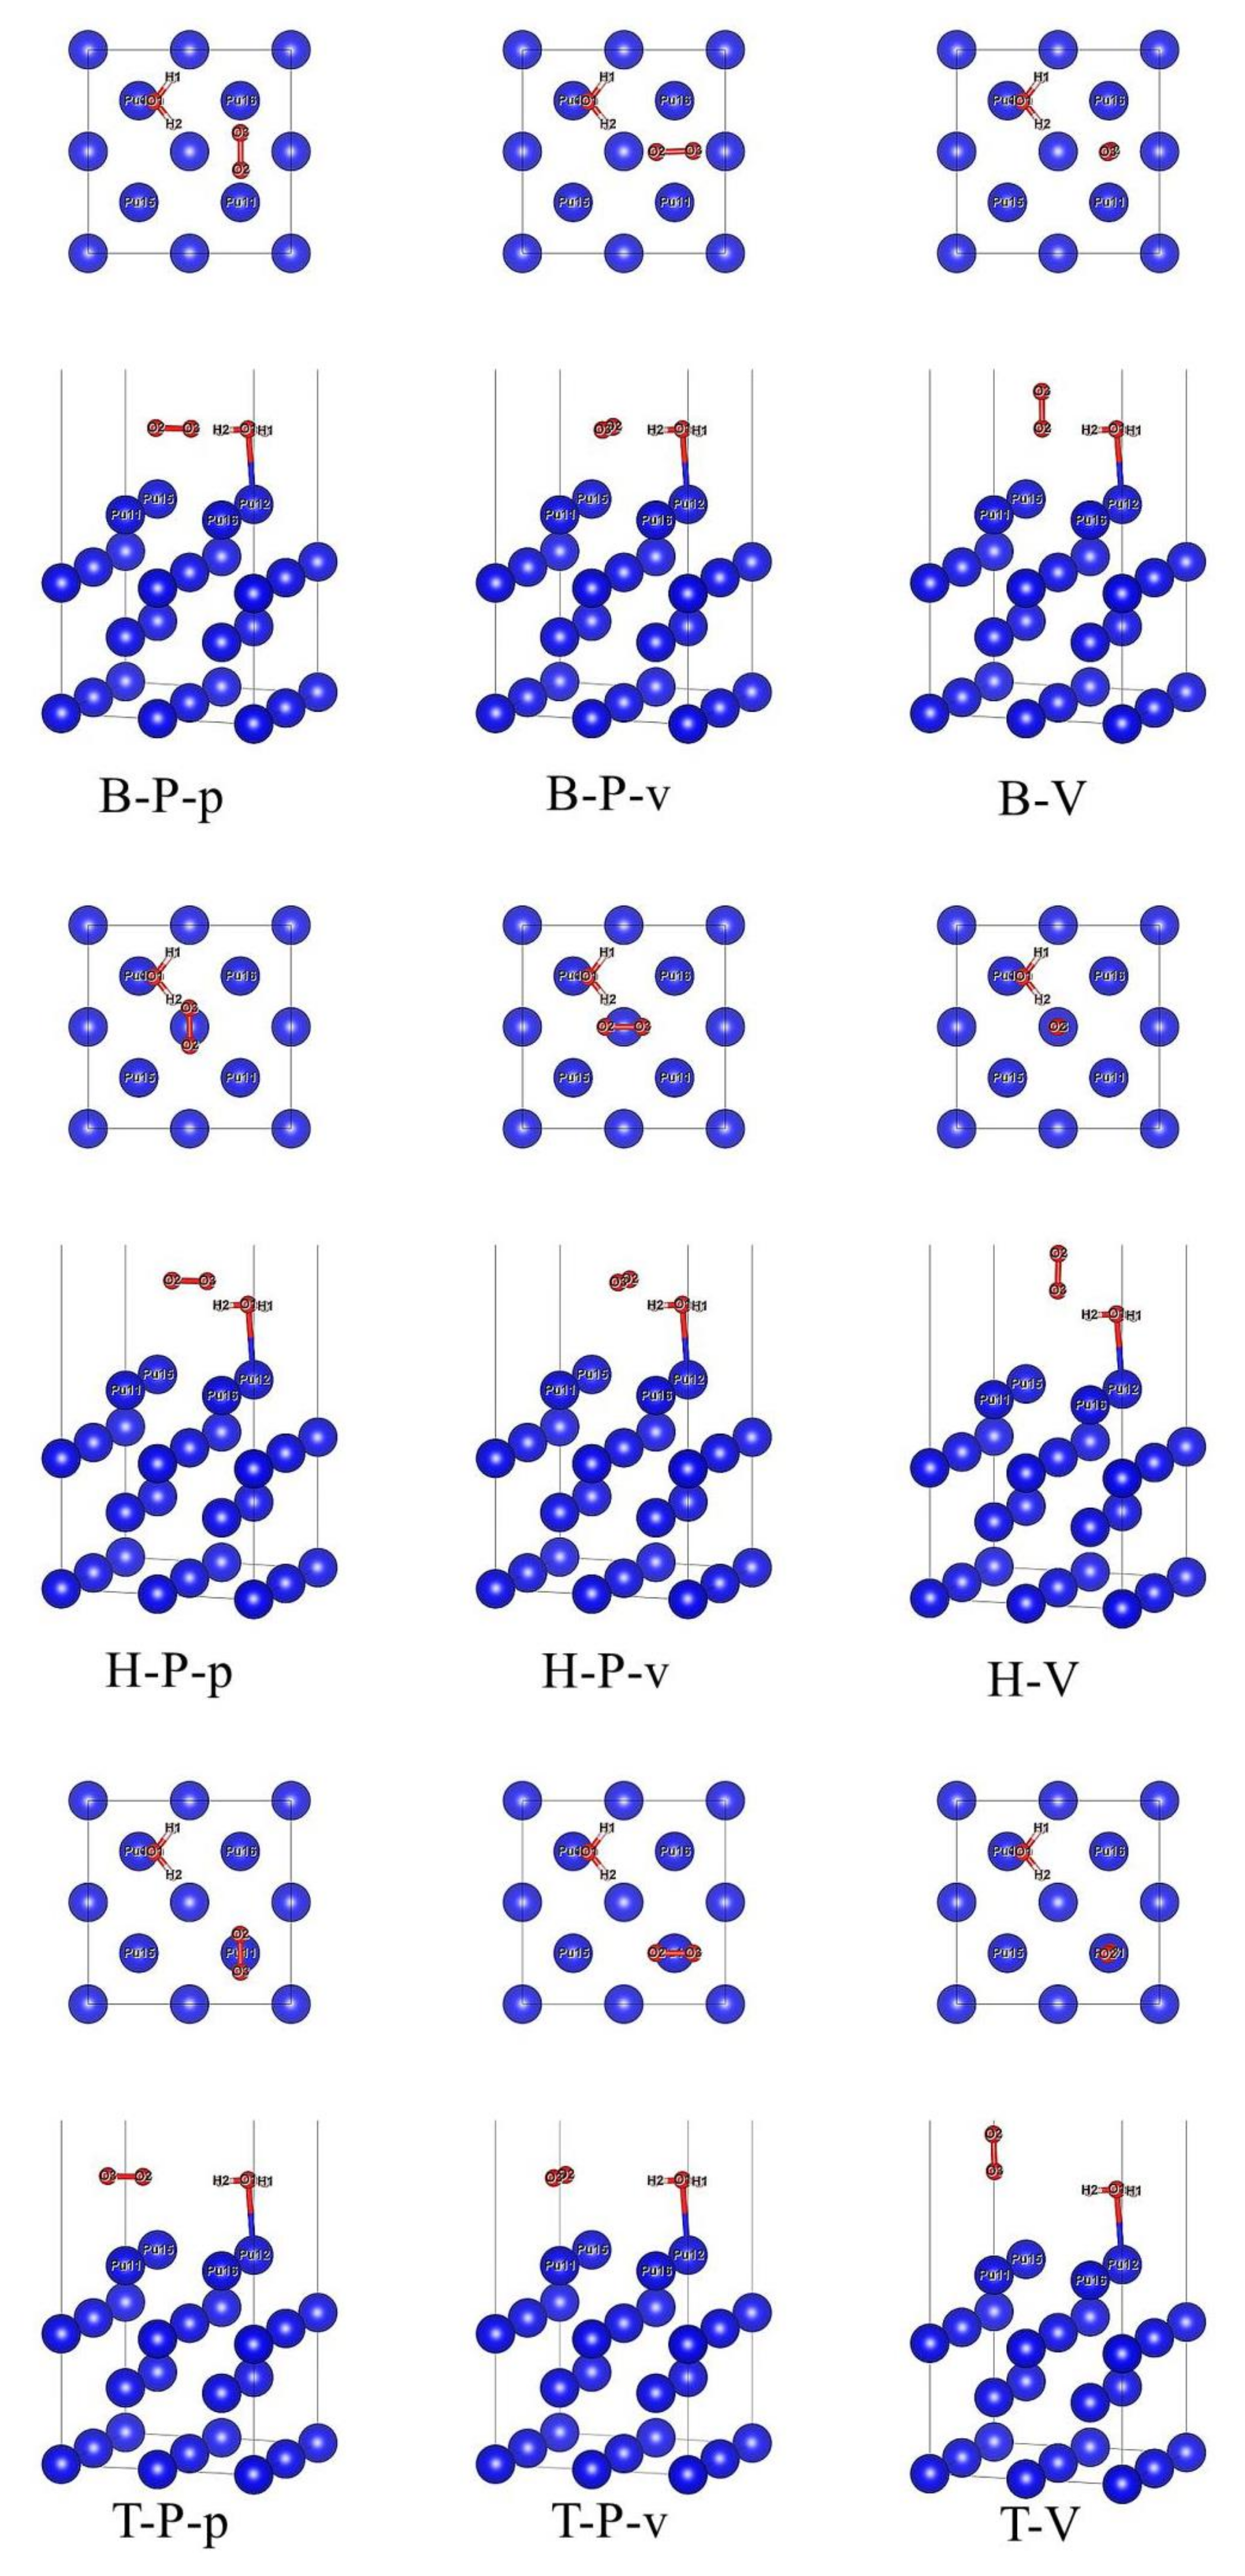
When the most stable adsorption configuration of H2O single adsorption is used as the substrate, we place the O2 molecule on the three adsorption positions of bridge (B), center (H) and top (T) on the surface of δ-Pu (100). The O2 molecule at each adsorption site can be divided into two cases: parallel (P) to the surface of δ-Pu (100) and vertical (V) to the surface of δ-Pu (100). At the same time, the connecting line between O2 molecule and two H atoms in H2O molecule in the matrix is considered to be parallel (P) or vertical (V). Based on this consideration, nine initial adsorption configurations are constructed, such as B-P-v, which represents that O2 molecules were placed at the bridge position on the surface of δ-Pu (100), parallel to the surface of δ-Pu (100) and perpendicular to the connecting line of two H atoms. All initial adsorption configurations based on the most stable adsorption configuration of H2O single adsorption are shown in Figure 2.
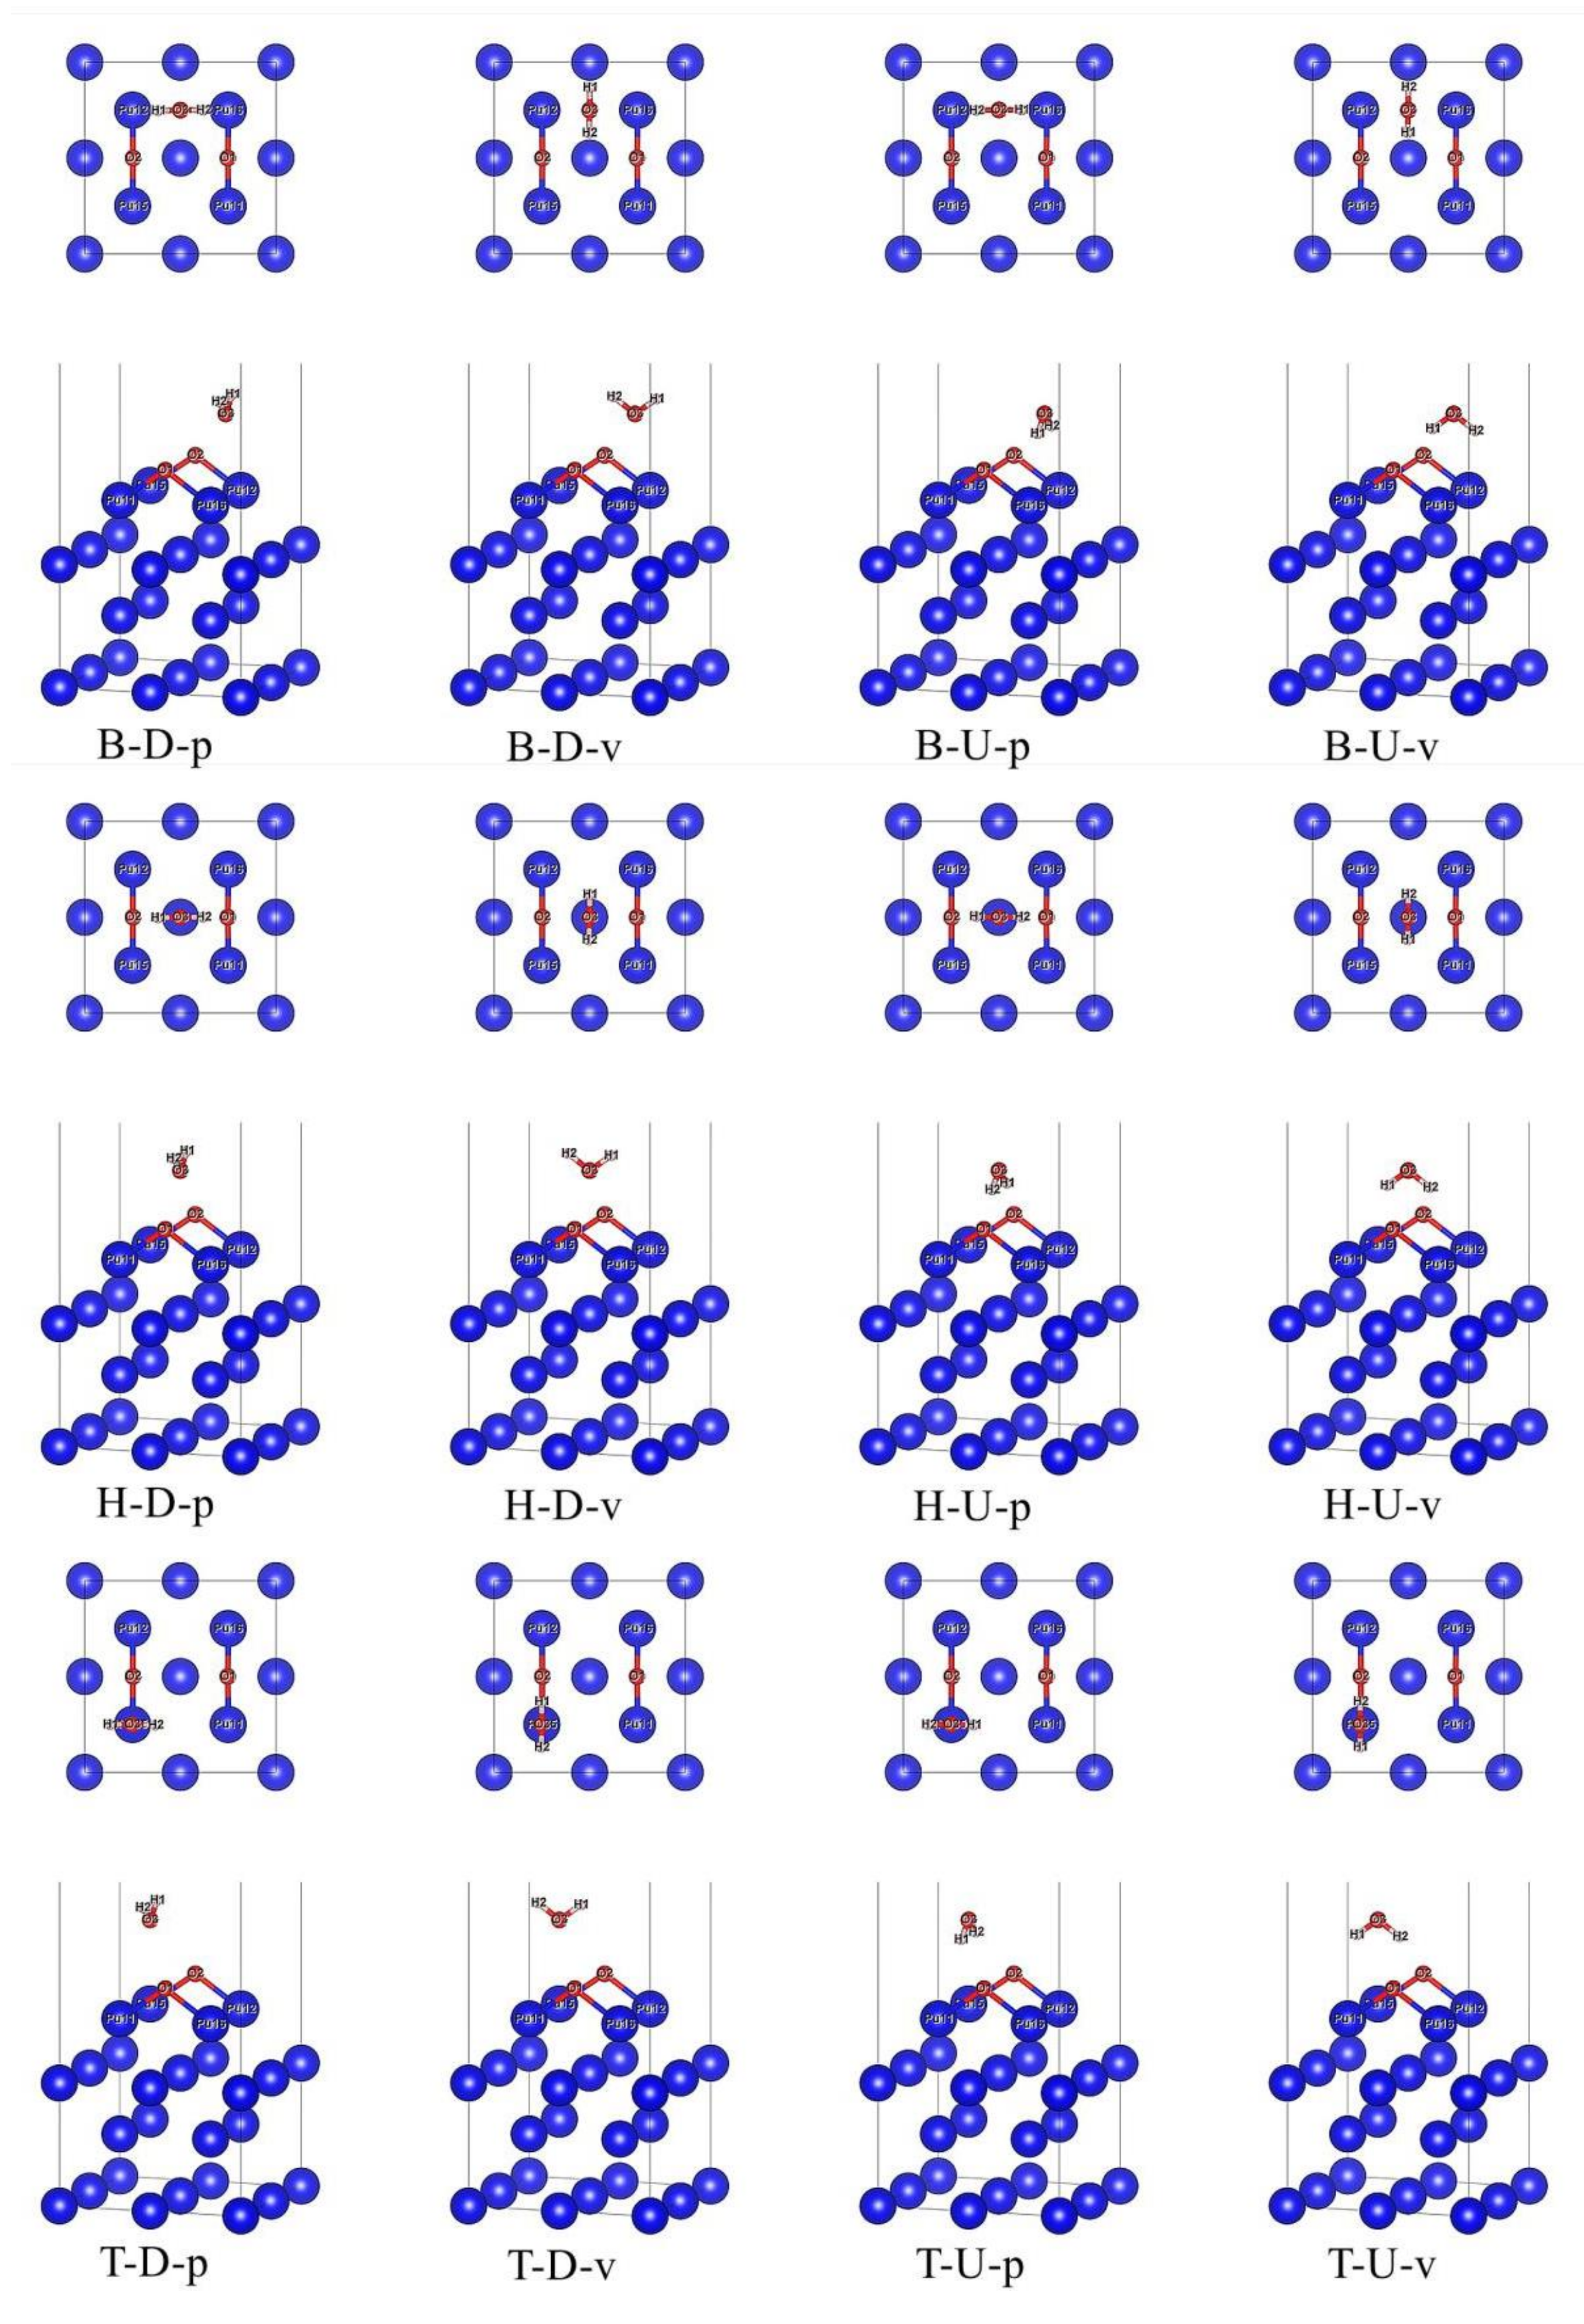
When the most stable adsorption configuration of O2 single adsorption is taken as the substrate, we also consider placing H2O molecule on the bridge (B), heart (H) and top (T) adsorption sites of δ-Pu (100) surface, respectively. H2O molecule at each adsorption site can be divided into two cases: O atom facing down (D) and perpendicular to δ-Pu (100) surface and O atom facing up (U) and perpendicular to δ-Pu (100) surface. At the same time, the connection between two H atoms in H2O molecule and the connection between two O atoms in matrix is considered to be parallel (P) or perpendicular (V). Therefore, 12 initial adsorption configurations were constructed, such as B-D-p, representing that H2O molecule is placed at the bridge position on the surface of δ-Pu (100) and is perpendicular to the surface of δ-Pu (100), with O atoms facing downwards. The connecting line of two H atoms in H2O molecule is parallel to the connecting line of two O atoms in the matrix. All initial adsorption configurations based on the most stable adsorption configuration of O2 single adsorption are shown in Figure 3.
3. Results and Discussions
3.1. Adsorption Configuration and Adsorption Energy
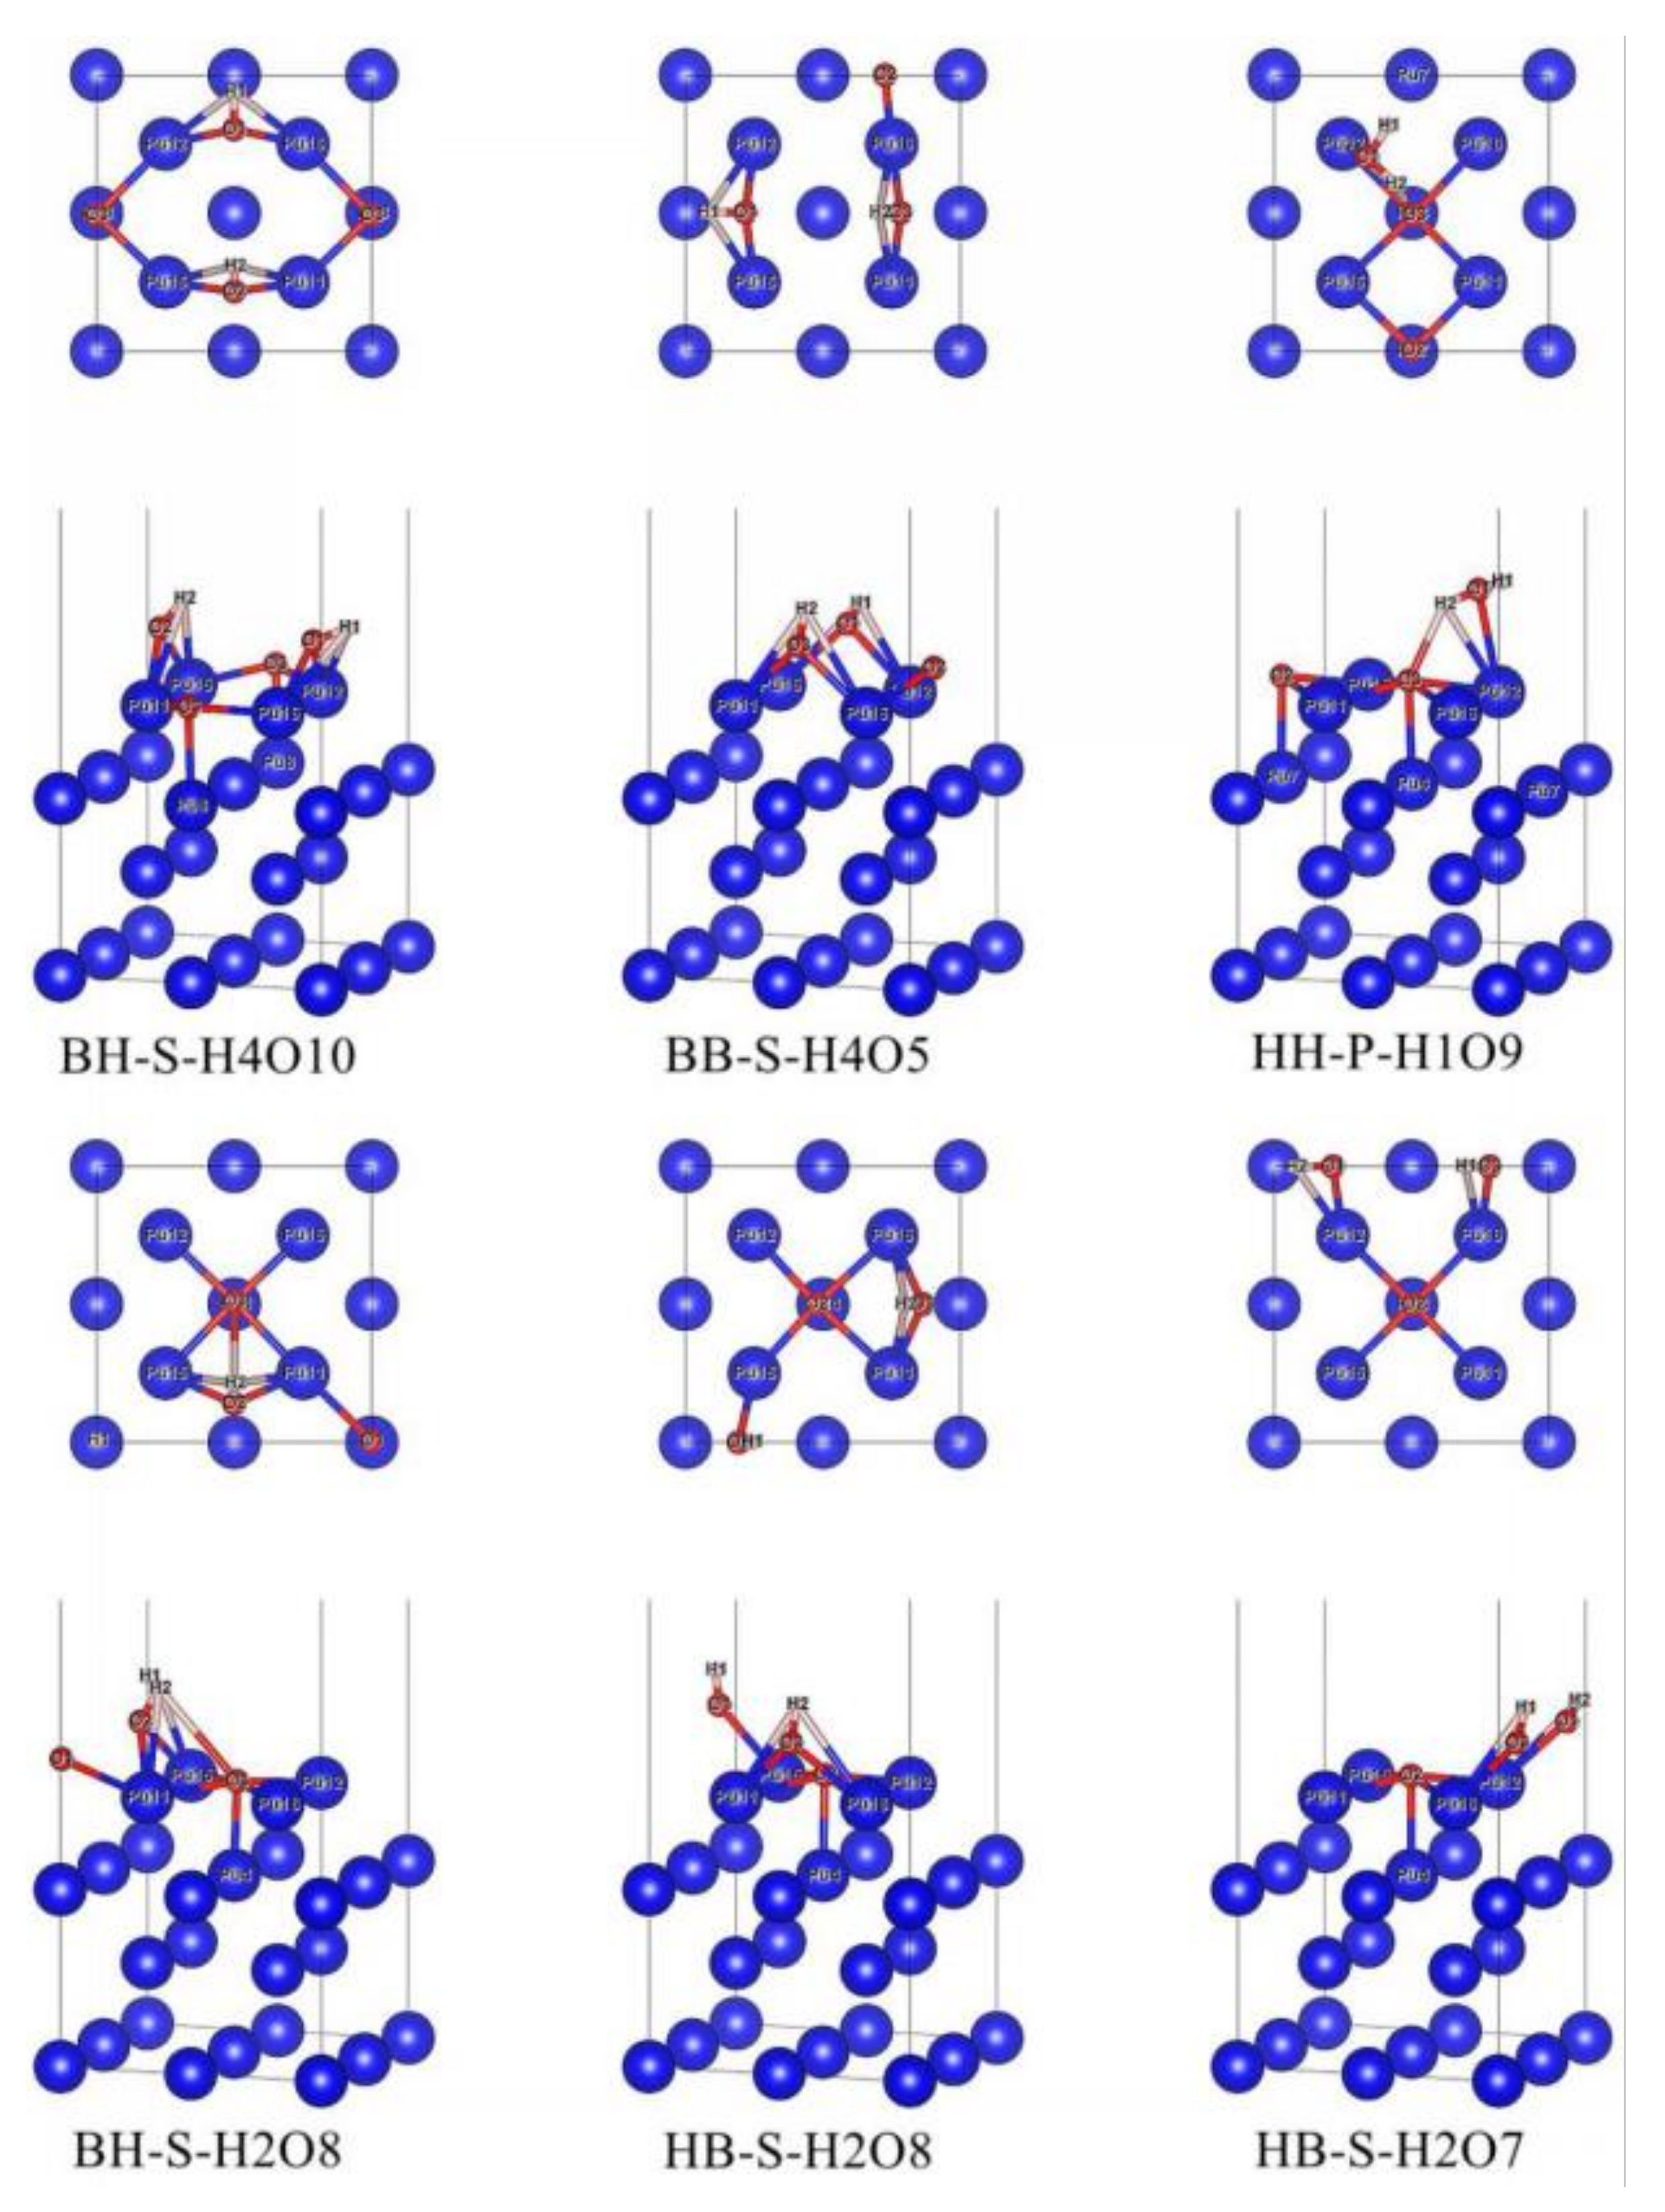
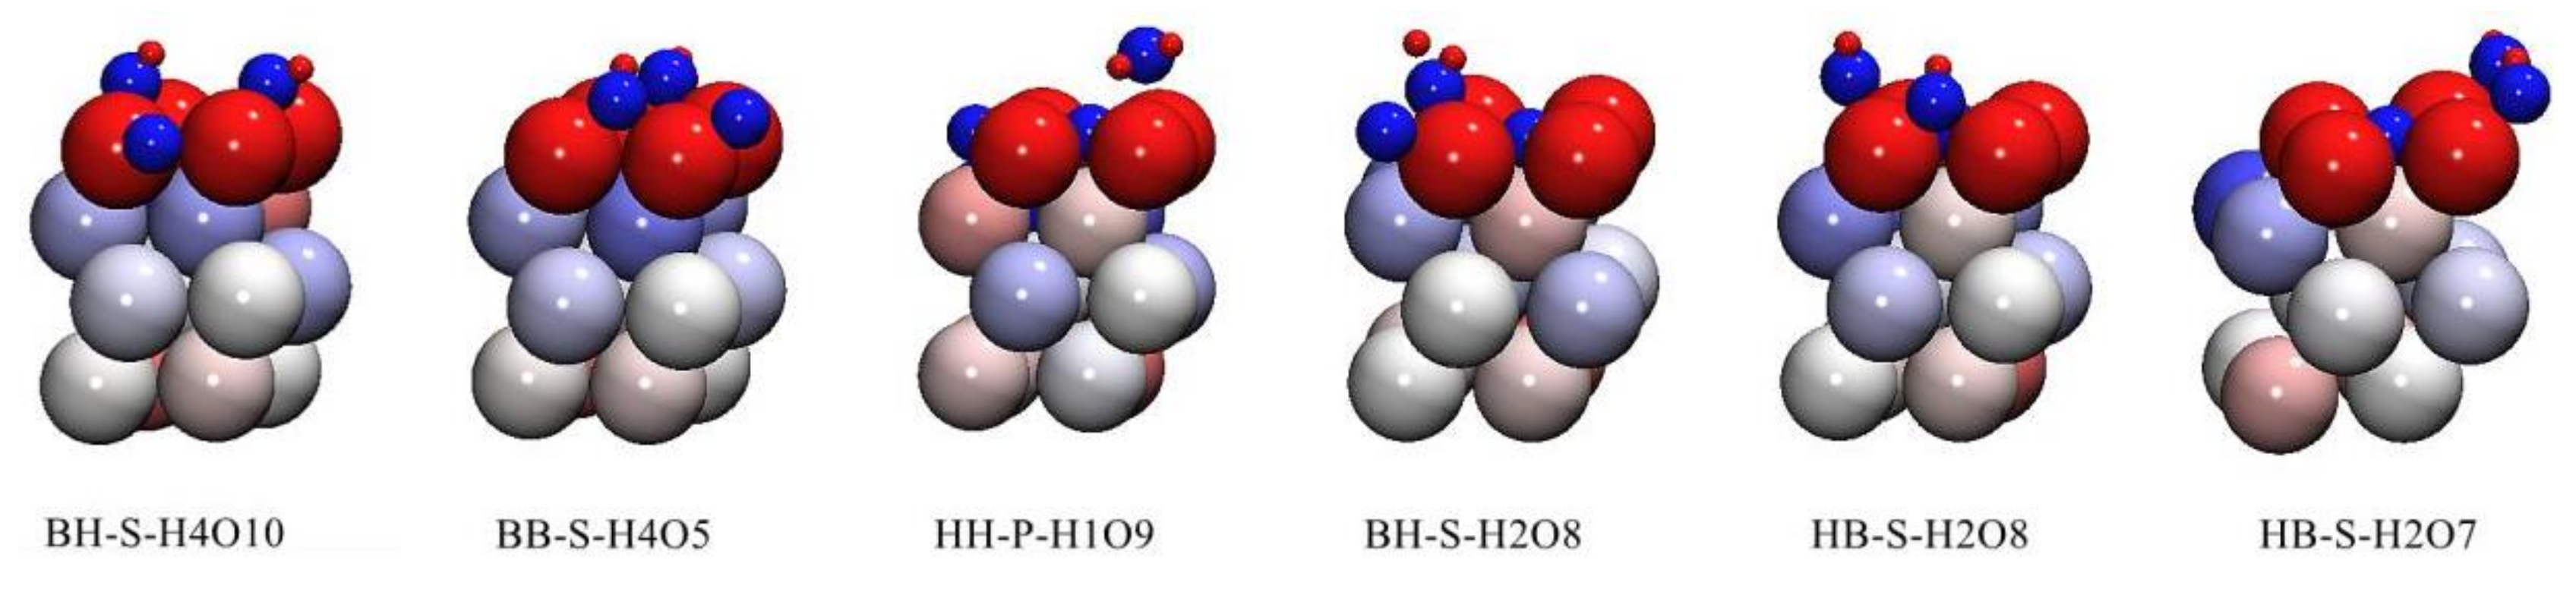
In the case of preferential adsorption of H2O, nine initial adsorption configurations in Figure 2 are optimized, and finally, six stable adsorption configurations are obtained, as shown in Figure 4. In these six stable adsorption configurations, all O2 molecules dissociate into two O atoms (O2 and O3). The naming of stable adsorption configuration is based on the adsorption positions of δ-Pu (100) surface occupied by O2 atoms and O3 atoms, respectively, after dissociation (B stands for bridge position, H stands for heart position and T stands for top position), the relative position between the connecting line of O2 and O3 atoms and δ-Pu (100) surface (S stands for tilt, P for parallel and V for vertical), the total number of bonds between all H atoms and neighboring Pu atoms on δ-Pu (100) surface and the total number of bonds between all O atoms and the δ-Pu (100) surface. HB-S-H2O8, for example, indicates that the O2 atom occupies the center position of the δ-Pu (100) surface, the O3 atom occupies the bridge position of the δ-Pu (100) surface, and the connecting line between the O2 atom and O3 atom inclines to the δ-Pu (100) surface; the total number of bonds between the H atom and neighboring Pu atoms is two and the total number of bonds between the O atom and neighboring Pu atoms is eight.
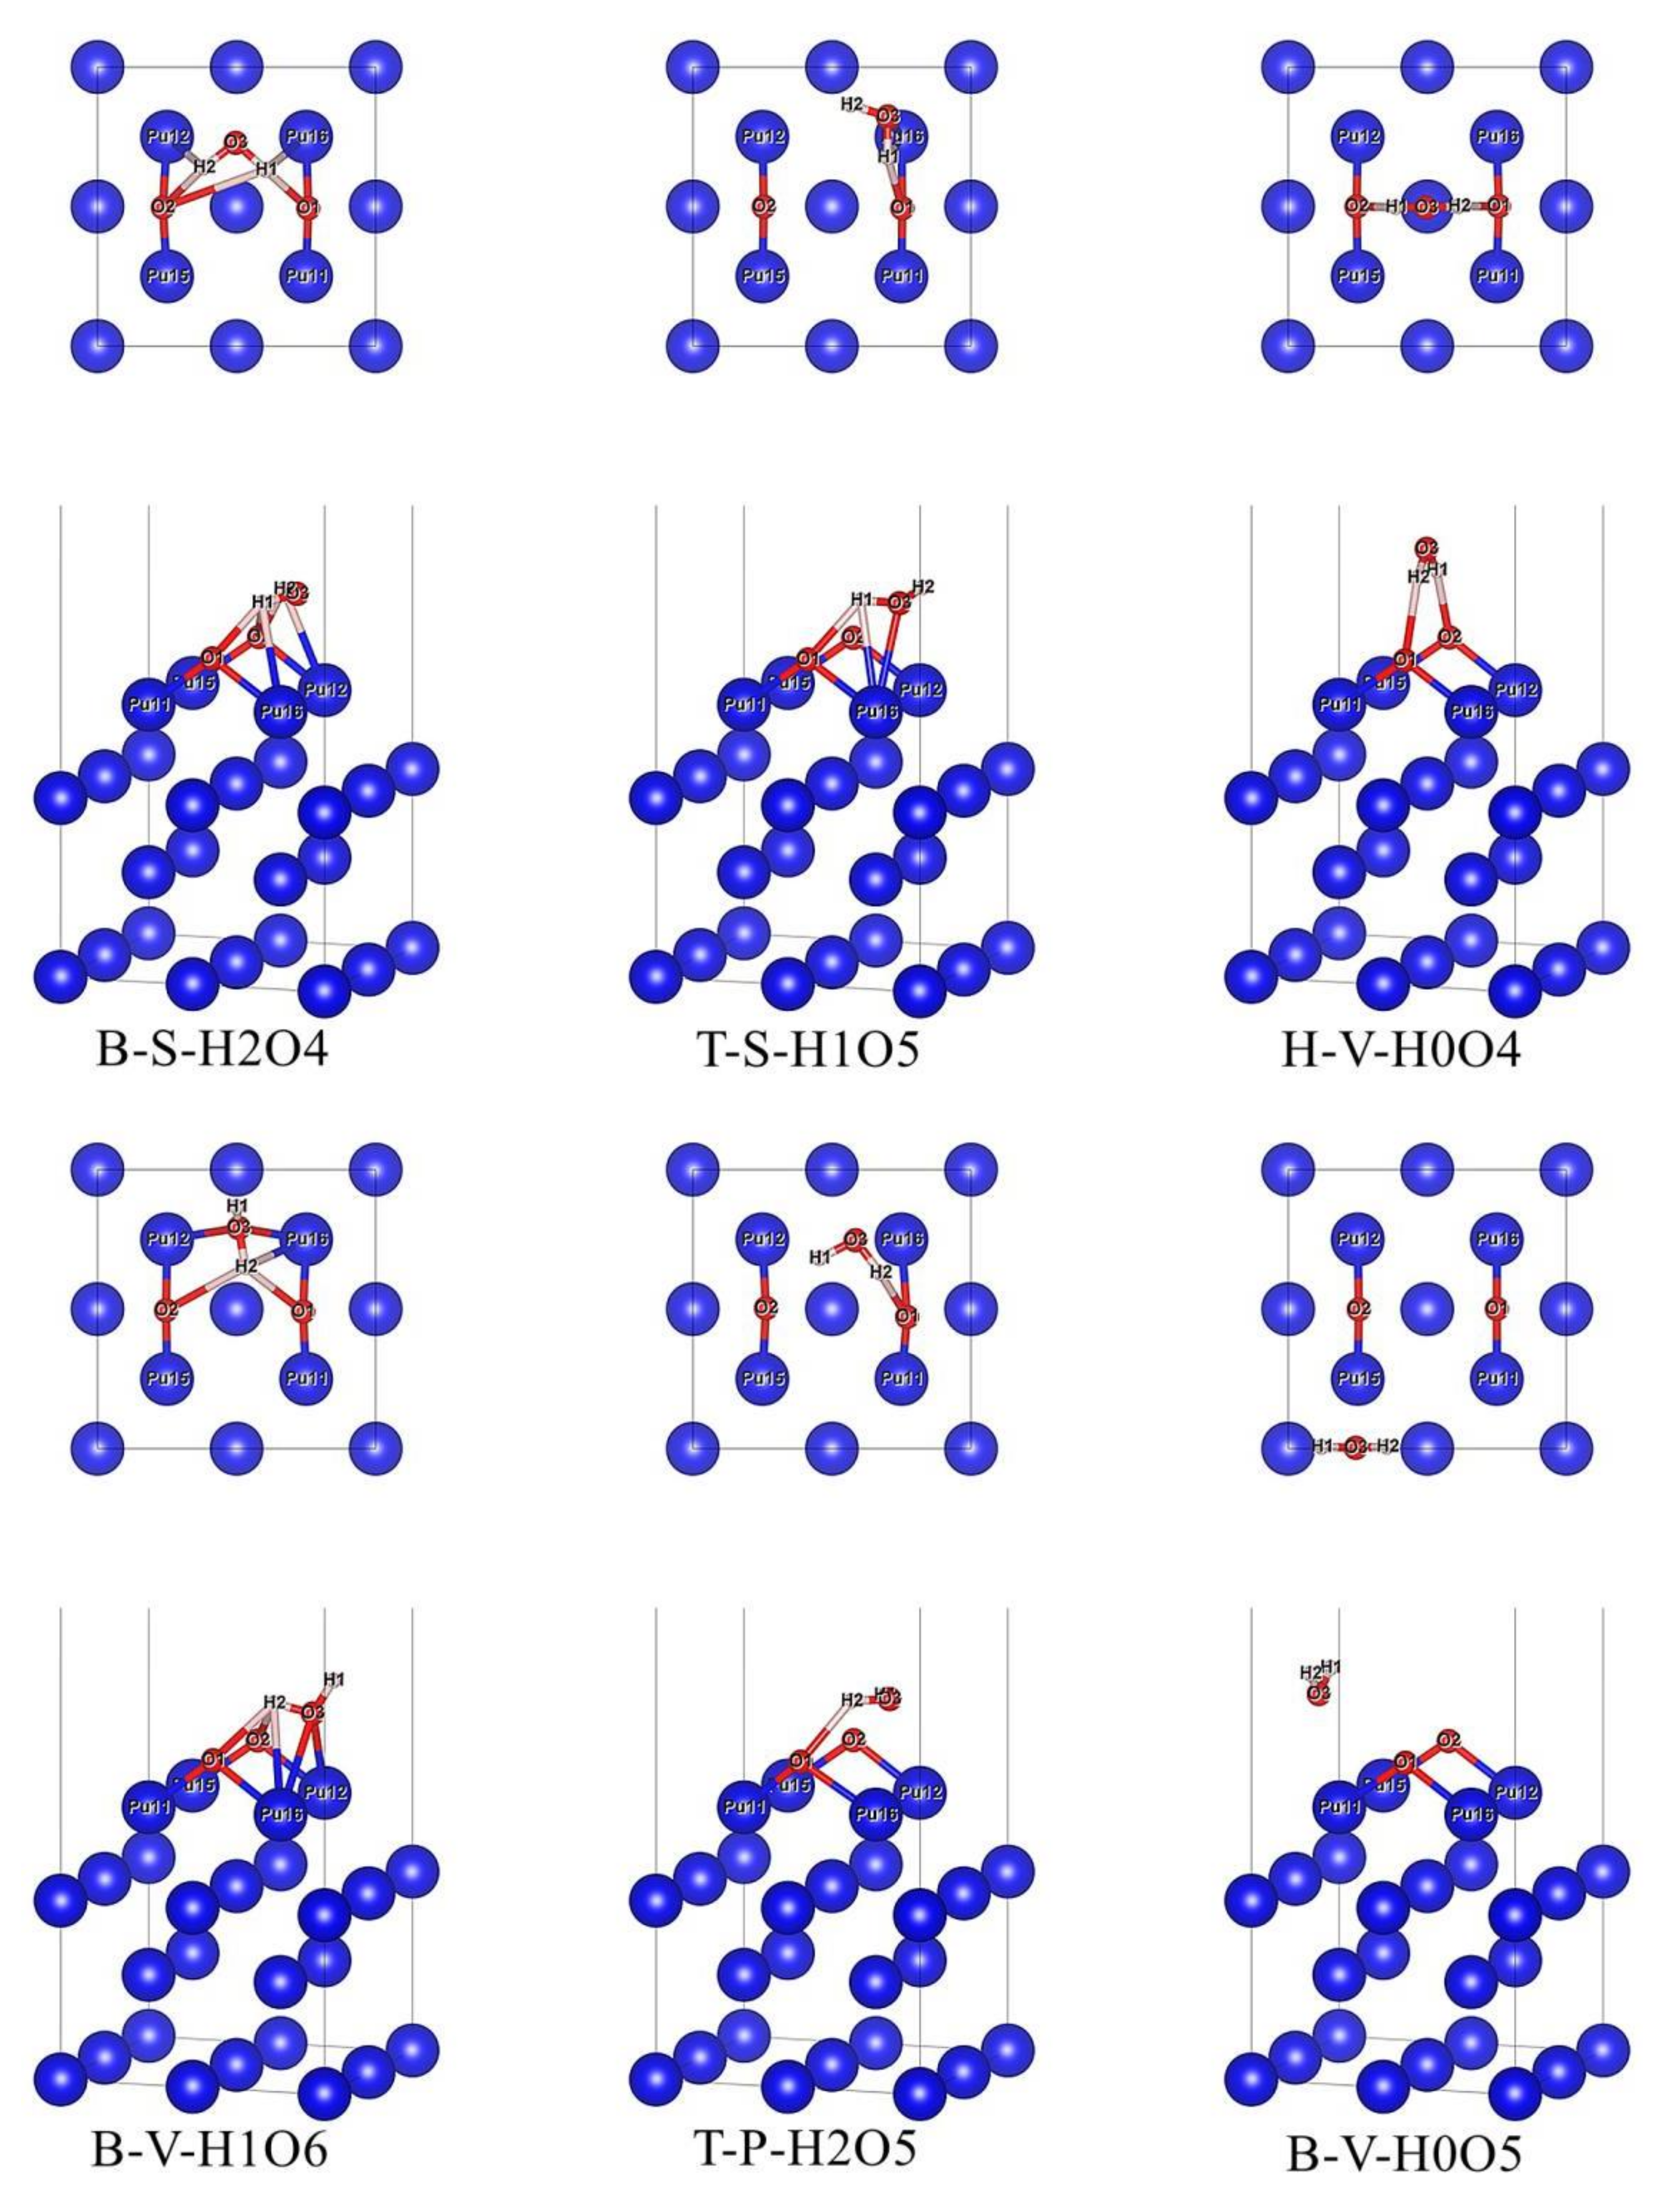
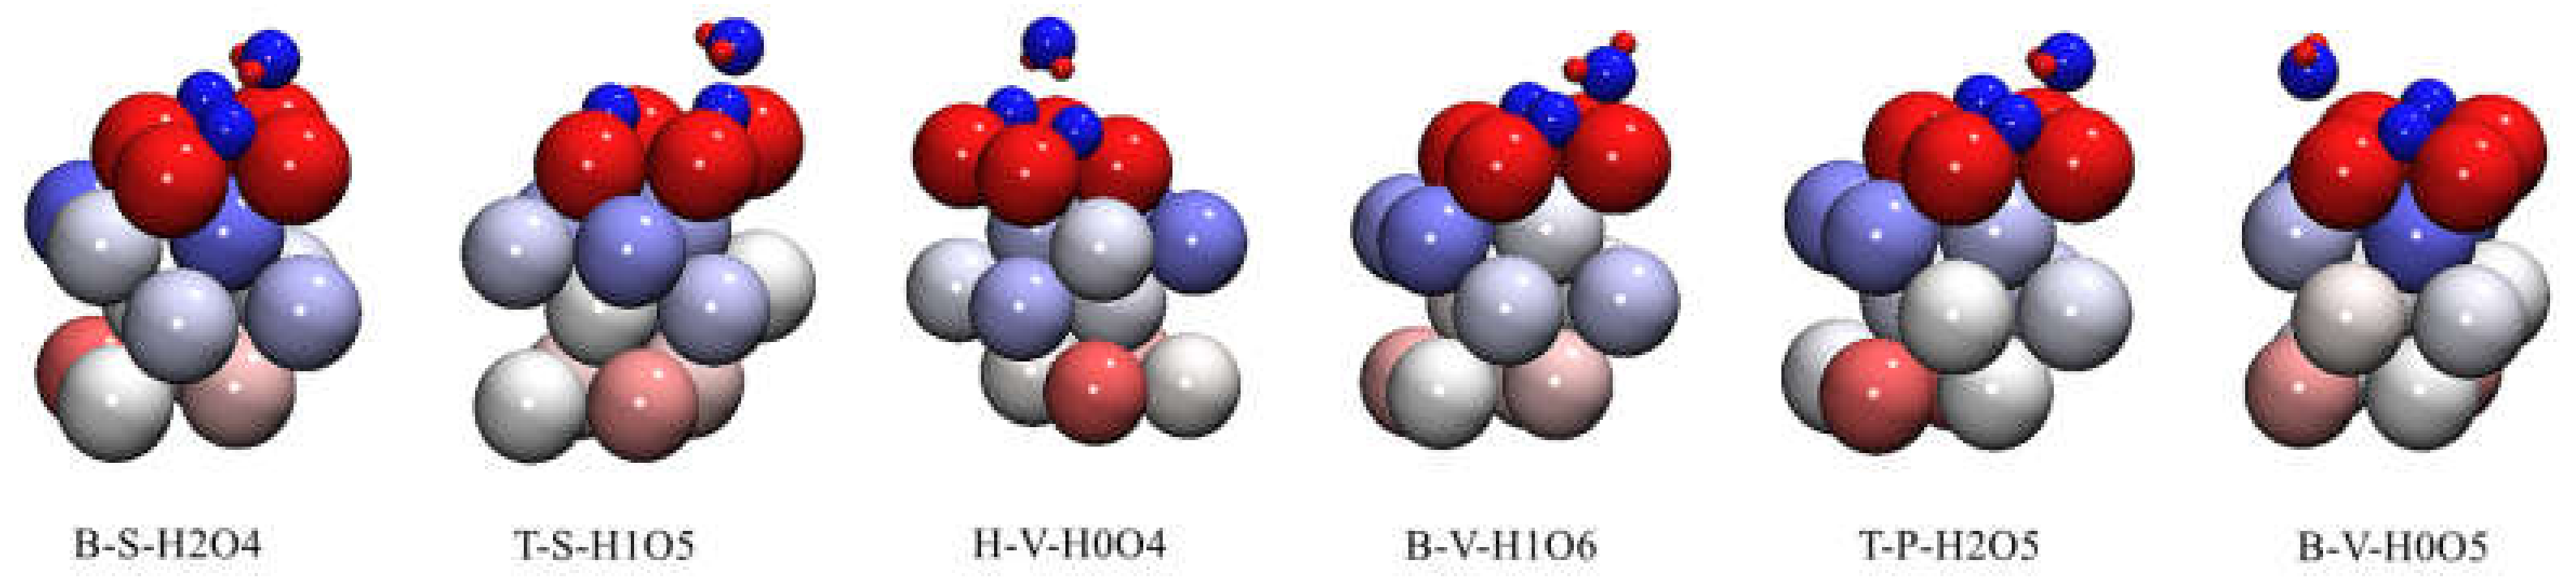
In the case of preferential adsorption of O2, 12 initial adsorption configurations in Figure 3 were optimized, and finally, 6 stable adsorption configurations were obtained, as shown in Figure 5. In these six stable adsorption configurations, H2O molecules do not dissociate, but the bond length and bond angle have changed in different degrees. The naming of stable adsorption configuration is based on the adsorption position of the δ-Pu (100) surface occupied by H2O molecule (B stands for bridge position, H stands for heart position and T stands for top position), the relative position of the H2O molecule plane and δ-Pu (100) surface (S stands for tilt, P for parallel and V for vertical), the total number of bonds between all H atoms and neighboring Pu atoms on the δ-Pu (100) surface and the total number of bonds between all O atoms and the δ-Pu (100) surface. For example, T-P-H2O2 means that the H2O molecule occupies the center of the δ-Pu (100) surface, and the plane of H2O molecules is parallel to δ-Pu (100) surface. The total number of bonds between H atoms and neighboring Pu atoms is two, and the total number of bonds between O atoms and neighboring Pu atoms is five.
Combined with the data in Figure 2 and Figure 4 and Table 1, the co-adsorption model obtained under the condition of preferential adsorption of H2O is analyzed. From the point of view of adsorption energy, the adsorption energy of six stable co-adsorption configurations is all less than that of the most stable adsorption configuration of O2 single adsorption (−7.281 eV). This shows that the adsorption of O2 after preferential adsorption of H2O will release more heat than the adsorption of O2 alone on the pure δ-Pu (100) surface, and the adsorption will be more stable. The preferential adsorption of the H2O molecule will promote the adsorption of O2 to a great extent. At the same time, the adsorption energies of the six stable adsorption configurations are not much different, and the heat released by adsorption is more than 8 eV. The BH-S-H4O10 configuration with the smallest adsorption energy is only 1.596 eV lower than the HB-S-H2O7 configuration with the largest adsorption energy. It can be considered that the co-adsorption of O2 and H2O can coexist in the case of preferential adsorption of H2O. The adsorption configuration BH-S-H4O10 gives off heat up to 9.731 eV, in which the adsorption distance of O atoms and H atoms is the smallest among the six configurations, and the total number of bonds between O atoms and H atoms and Pu atoms near the surface is also the largest. Based on these phenomena, we can conclude that BH-S-H4O10 is the most stable adsorption configuration based on the most stable adsorption configuration of H2O single adsorption.
After optimization, O2 molecules dissociate, and the dissociated O2 and O3 atoms tend to occupy the bridge position and heart position of the δ-Pu (100) surface. Among the six stable adsorption configurations, except the HH-P-H1O9 configuration, H2O molecules preferentially adsorbed in the other five configurations also undergo dissociation. In HH-P-H1O9 configuration, the bond length and bond angle of H2O molecule preferentially adsorbed also increased to a small extent, and its plane is no longer parallel to the δ-Pu (100) surface, but there is a slight inclination, which indicates that H2O molecules are activated to a greater extent. It is worth noting that the O atom dissociated from the O2 molecule and occupying the bridge site on the surface of δ-Pu (100) will generally combine with an H atom dissociated from an H2O molecule to form a hydroxyl group (OH) to be adsorbed on the bridge site, while the O atom occupying the center of δ-Pu (100) will form at least five Pu–O bonds with neighboring Pu atoms. These phenomena are the key factors to improve adsorption stability and cause adsorption exotherm. It can be seen from the data in Table 1 that the average bond length of Pu–O bonds with six stable adsorption configurations ranges from 2.277 Å to 2.481 Å, which is slightly larger than that of Pu–O bonds in plutonium oxide crystals (PuO: 1.830 Å, PuO2: 1.810 Å) [33,34]. The average bond length of Pu–H bonds ranges from 2.821 Å to 2.996 Å, which is also slightly larger than that of Pu–H bonds in plutonium hydride crystals (PuH2: 2.340 Å, PuH3: 2.388 Å) [35,36]. This shows that when H2O is preferentially adsorbed, O atoms and H atoms in O2 and H2O will have strong bonding with Pu atoms on the surface of δ-Pu (100), thus greatly improving the adsorption stability.
Similarly, combined with the data in Figure 3 and Figure 5 and Table 1, the co-adsorption model obtained when O2 is preferentially adsorbed is analyzed. From the point of view of adsorption energy, the adsorption energy of the six stable co-adsorption configurations is far less than that of the most stable adsorption configuration of H2O single adsorption (−0.305 eV). This shows that the adsorption of H2O after preferential adsorption of O2 will also release more heat than the adsorption of H2O on pure δ-Pu (100) surface, and the adsorption will be more stable. The preferential adsorption of O2 molecules will greatly promote the adsorption of H2O. The adsorption energies of the six stable adsorption configurations are all large, but the difference is obvious. The adsorption energies of B-S-H2O4, T-S-H1O5 and H-V-H0O4 are all greater than 8.5 eV, while the adsorption energies of B-V-H1O6, T-P-H2O5 and B-V-H0O5 are all less than 5.5 eV. By analyzing the three configurations with higher adsorption energy and the three configurations with lower adsorption energy, it can be found that compared with the three configurations with lower adsorption energy, there are more interactions between H atoms in the post-adsorbed H2O molecules and the preferentially adsorbed substrate O atoms, and the interaction distance is shorter. It can be seen that the interaction between H atoms in H2O molecules and O atoms on the substrate has an important influence on the adsorption energy. Among the six adsorption configurations, B-S-H2O4 gives off the most heat. In this configuration, the deformation of the H2O molecule is the largest, the bond angle is reduced by 4.775 compared with that of H2O single adsorption and the bond length increases the most among the six adsorption configurations. At the same time, the length of the Pu–O bond and Pu–H bond and the adsorption distance between the O atom and H atom is also smaller. These phenomena fully explain that the B-S-H2O4 configuration is the most stable adsorption configuration based on the most stable adsorption configuration of O2 single adsorption.
dH–O: The distance between H atom and O atom, dH-Pu/dO-Pu: Average bonding length between adsorbed H/O atoms and Pu atoms adjacent to the surface layer, θH–O–H: The angle of H–O–H, hH-S/dO-S: average adsorption height of C/O atoms from Pu atoms in the first layer, Eads: adsorption energy of co-adsorption of O2 and H2O. The distance unit is (Å), the angle unit is (°) and the energy unit is (eV).
After optimization, compared with single adsorption, the bond length of two bonds of the H2O molecule is no longer the same, and the bond angle has changed to a greater extent, and its symmetry has been destroyed. In the six stable adsorption configurations, the bond lengths of two bonds of H2O molecules have increased or decreased in different degrees, but the range of increase or decrease is no more than 0.01 Å. In comparison, the bond angles vary from −4.775° to 4.092°. This shows that the preferential adsorption of two O atoms increases the activation degree of H2O molecules. Among the six stable adsorption configurations, H2O molecules in three configurations are adsorbed on the bridge position of the δ-Pu (100) surface; two are located at the top position and one is located at the heart position, which indicates that the co-adsorption of O2 and H2O can coexist with multiple adsorption configurations and preferentially adsorb on the bridge position. At the same time, according to the adsorption energy, H2O molecules tend to obliquely adsorb on δ-Pu (100) surface. The adsorption of H2O molecules also affects the adsorption symmetry of O atoms on the substrate to a small extent, and the two O atoms preferentially adsorbed are still in the original bridge position, but the bond lengths of the four Pu–O bonds formed by them and the adjacent Pu atoms are no longer completely the same, and the variation range is no more than 0.2 Å. It can also be seen from Table 1 that the average bond length of Pu–O bonds in six stable adsorption configurations ranges from 2.067 Å to 2.325 Å, which is closer to the bond length of Pu–O bonds in plutonium oxide crystals than that in the co-adsorption model when H2O is preferentially adsorbed, and the average bond length of Pu–H bonds ranges from 2.728 Å to 2.947 Å, which is also closer to the bond length of Pu–H bonds in plutonium hydride. These phenomena also indicate that the strong bonding between O atoms on the substrate and H atoms in H2O and between O atoms and δ-Pu (100) surface is the key factor to improve the adsorption stability.
To sum up, for the co-adsorption of O2 and H2O on the surface of δ-Pu (100), the preferentially adsorbed molecules will greatly promote the adsorption of the post-adsorbed molecules, thus greatly increasing the heat released by adsorption and improving the adsorption stability. The interaction between H atoms in H2O and O atoms dissociated from O2 and the interaction between all H atoms and O atoms and Pu atoms adjacent to the δ-Pu (100) surface are also the key factors to improve adsorption stability. It is worth noting that in the case of preferential adsorption of O2, the adsorption energy of three optimized stable adsorption configurations is lower than that of the most stable adsorption configuration of O2 because the interaction between H atoms in H2O and O atoms on the substrate weakens the adsorption stability to a certain extent.
3.2. Bader Charge Distribution Analysis
The adsorption of atoms and molecules on the surface of δ-Pu (100) is bound to be accompanied by the mutual transfer of charges with Pu atoms, and the analysis of charge transfer is very helpful for understanding the nature of adsorption [15,37]. Bader charge calculation [38,39,40] is a commonly used charge analysis method, and its calculation formula is as follows.
In Formula (2), Qnet represents the net charge of atoms, Qbader is the calculated Bader charge and Qvalence is the number of pseudoelectrons of each element determined by the pseudopotential method. The net charge numbers of the six stable adsorption configurations obtained under H2O preferential adsorption are shown in Table 2, and the net charge numbers of the six stable adsorption configurations obtained under O2 preferential adsorption are shown in Table 3. The negative value of net charge means that the system has lost electrons and is positively charged, and the corresponding valence is positive. If the value of the net charge is regular, it means that the system has obtained electrons which are negatively charged, and the corresponding valence is negative.
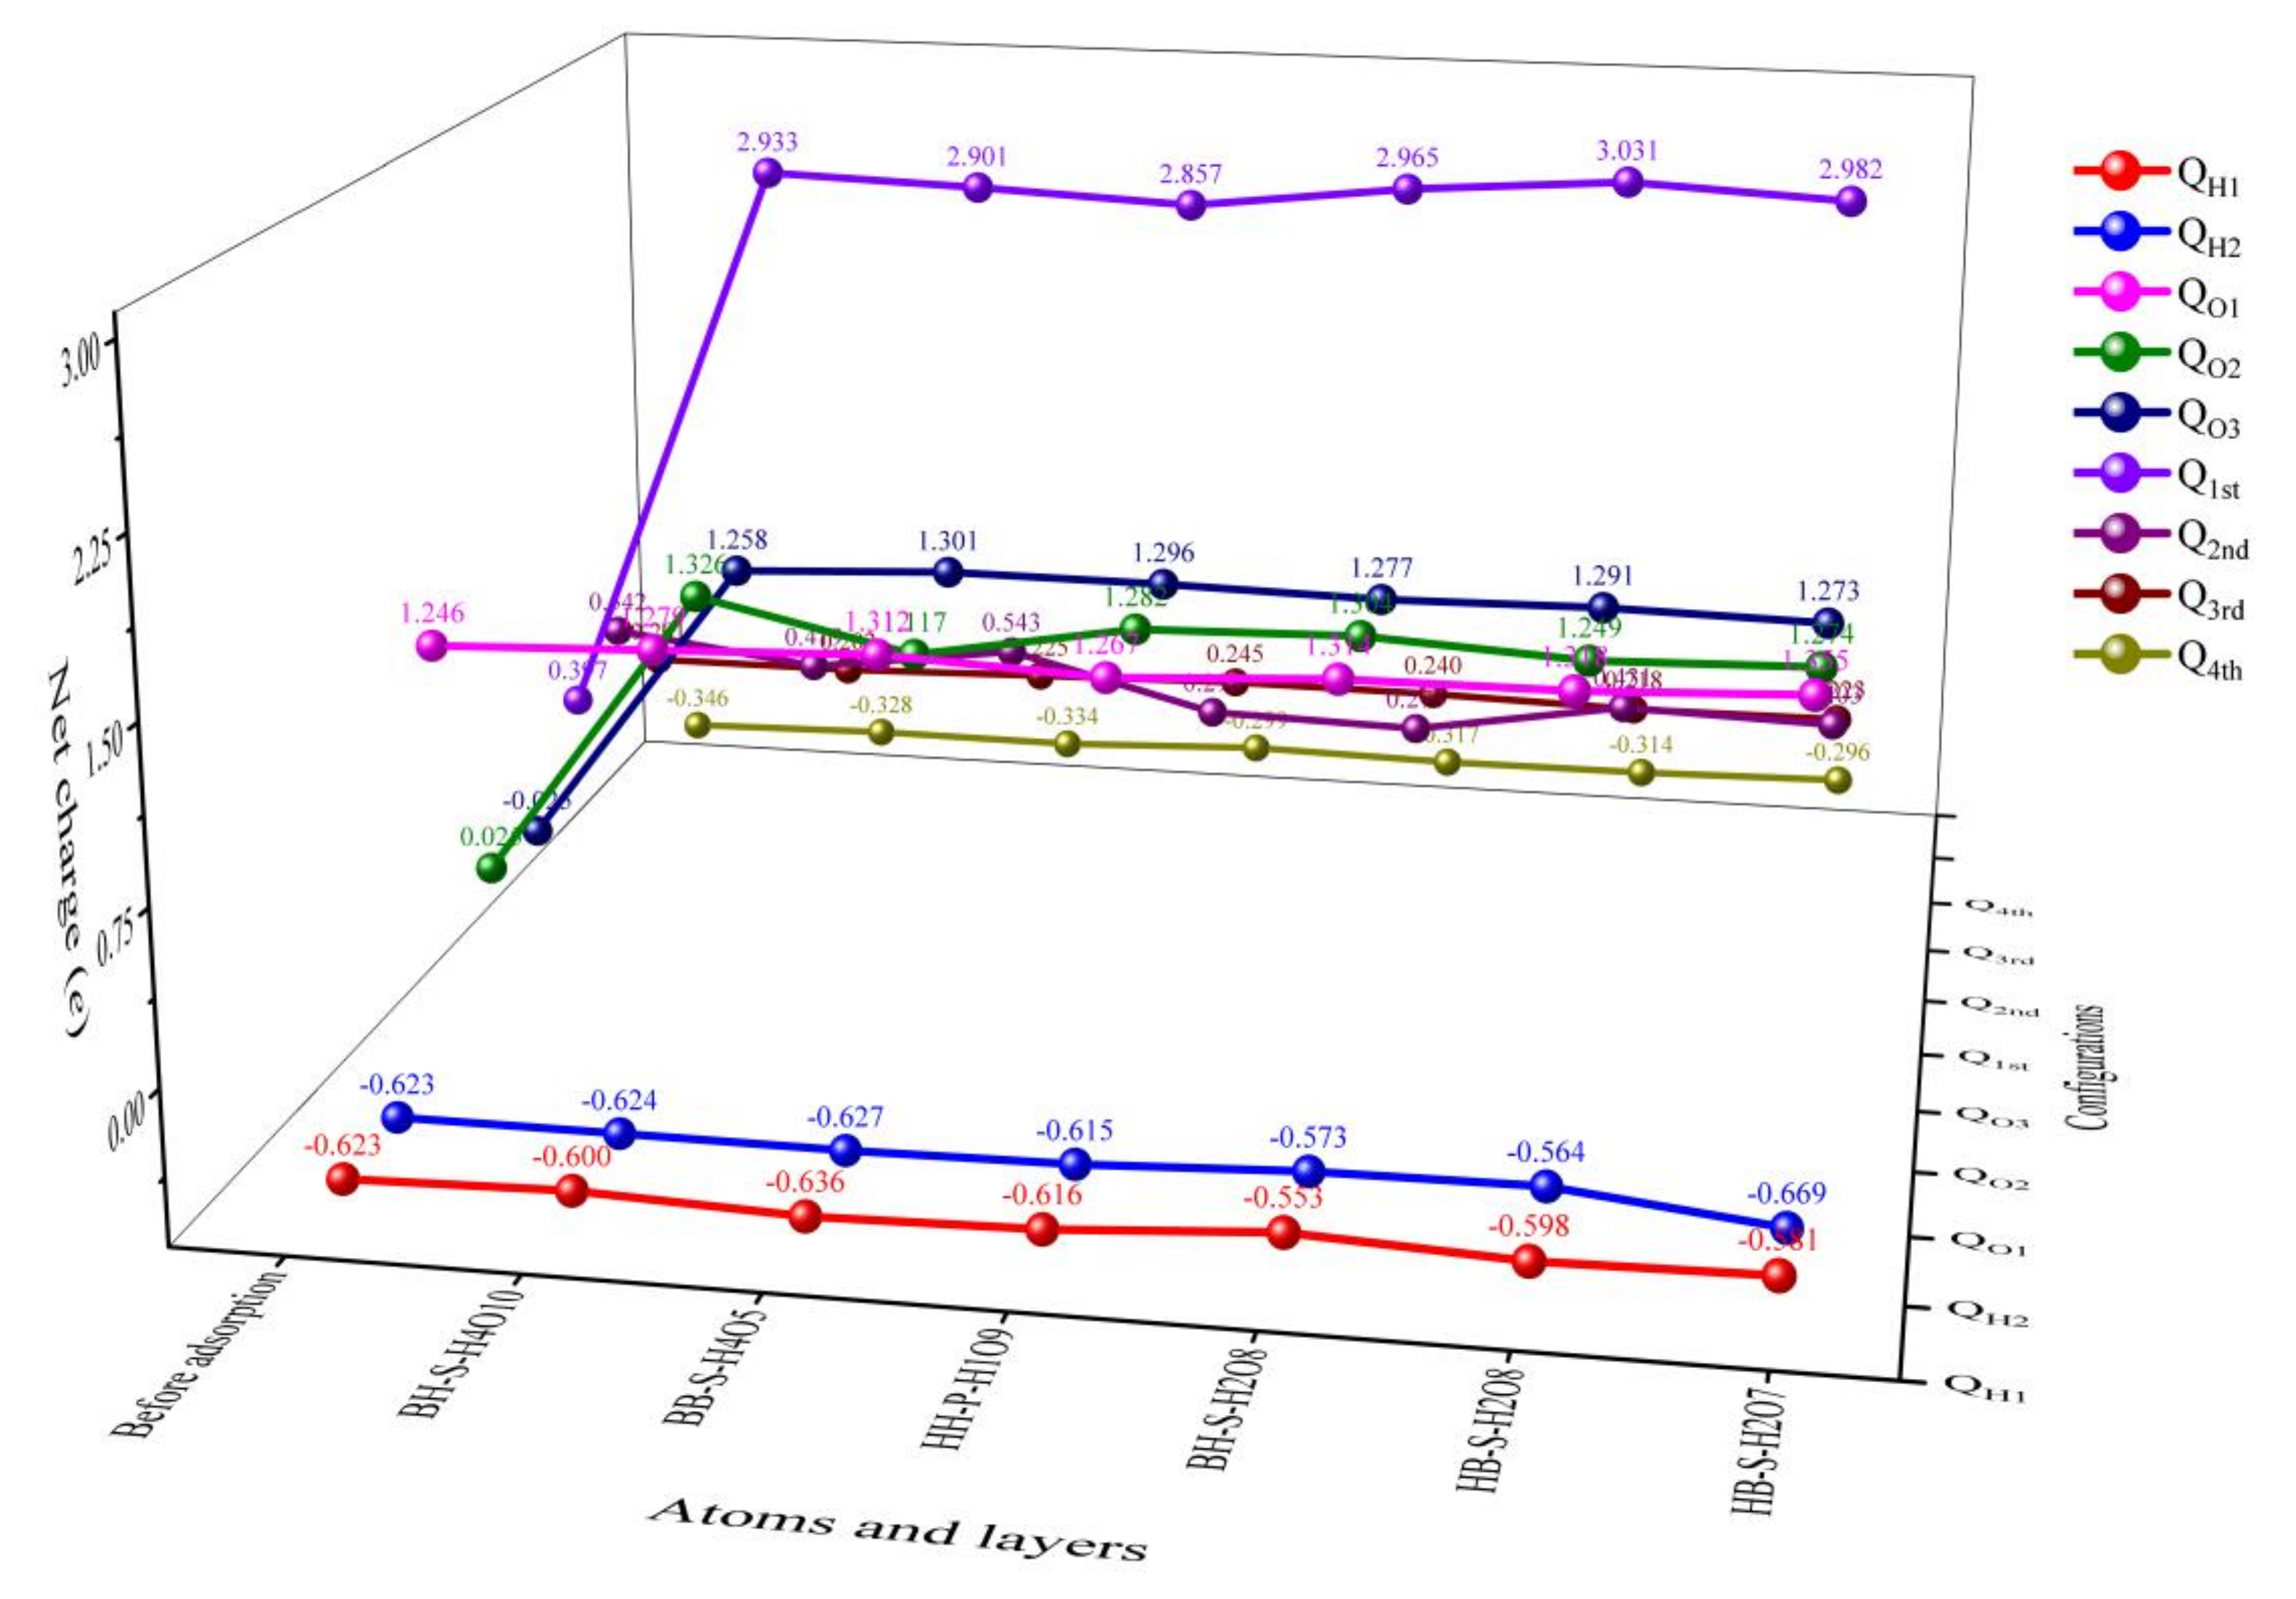
Combining the data in Table 2 with Figure 4 and Figure 6, it can be seen that when co-adsorption is carried out under the condition of preferential adsorption of H2O, on the whole, the atoms or molecules co-adsorbed on the surface of δ-Pu (100) receive electrons, the Pu atoms in the four layers of δ-Pu (100) lose electrons and the charge is transferred from the surface of δ-Pu (100) to the adsorbed atoms or molecules. Among the six stable adsorption configurations, when the two O atoms produced by O2 dissociation are located at the bridge position and the heart position, the charge transfer amount is large, ranging from 2.640 e to 2.769 e. When the two O atoms produced by O2 dissociation are located in the heart, the charge transfer amount is small, which is 2.613 e. When two O atoms produced by O2 dissociation are located at the bridge position, the charge transfer amount is the smallest, which is 2.467 e. After the completion of co-adsorption, among the six adsorption configurations, only the H2O molecules preferentially adsorbed in the HH-P-H1O9 configuration do not dissociate, and the number of charges obtained by H2O molecules is also the smallest, which is 0.036 e. Only two H atoms of H2O molecules preferentially adsorbed in BH-S-H2O2 configuration are dissociated from O1 atoms, but the total charge of H1, H2 and O1 atoms is the largest, which is 0.188 e. In the other four adsorption configurations, one H atom of H2O molecule preferentially adsorbed is separated from the O1 atom and combined with one O atom dissociated from O2, while the other H atom is not separated from the O1 atom. The total charge of H1, H2 and O1 atoms is between 0.036 e and 0.188 e. This shows that the greater the dissociation degree of H2O adsorbed preferentially, the greater the number of charges obtained and the greater the degree of interaction with other atoms. Among the six stable adsorption configurations, compared with the configuration before adsorption, the outermost Pu atoms on the surface of δ-Pu (100) generally lose charge, and the charge amount changes the most, ranging from −2.634 e to −2.460 e. Pu atoms in the subsurface layer also generally lose charge, and the change of charge is smaller than that in the outermost layer, ranging from −0.269 e to 0.001 e. The general charge of Pu atoms in the third layer is much smaller than that in the two layers on the surface, ranging from 0.001 e to 0.044 e. The charge of Pu atoms in the bottom layer is also common, and the change of charge is almost the same as that of Pu atoms in the third layer, ranging from 0.012 e to 0.050 e. It can be seen that the change of charge on the surface of δ-Pu (100) decreases layer by layer, and the charge transfer between co-adsorbed atoms and molecules mainly occurs in two layers of the surface.
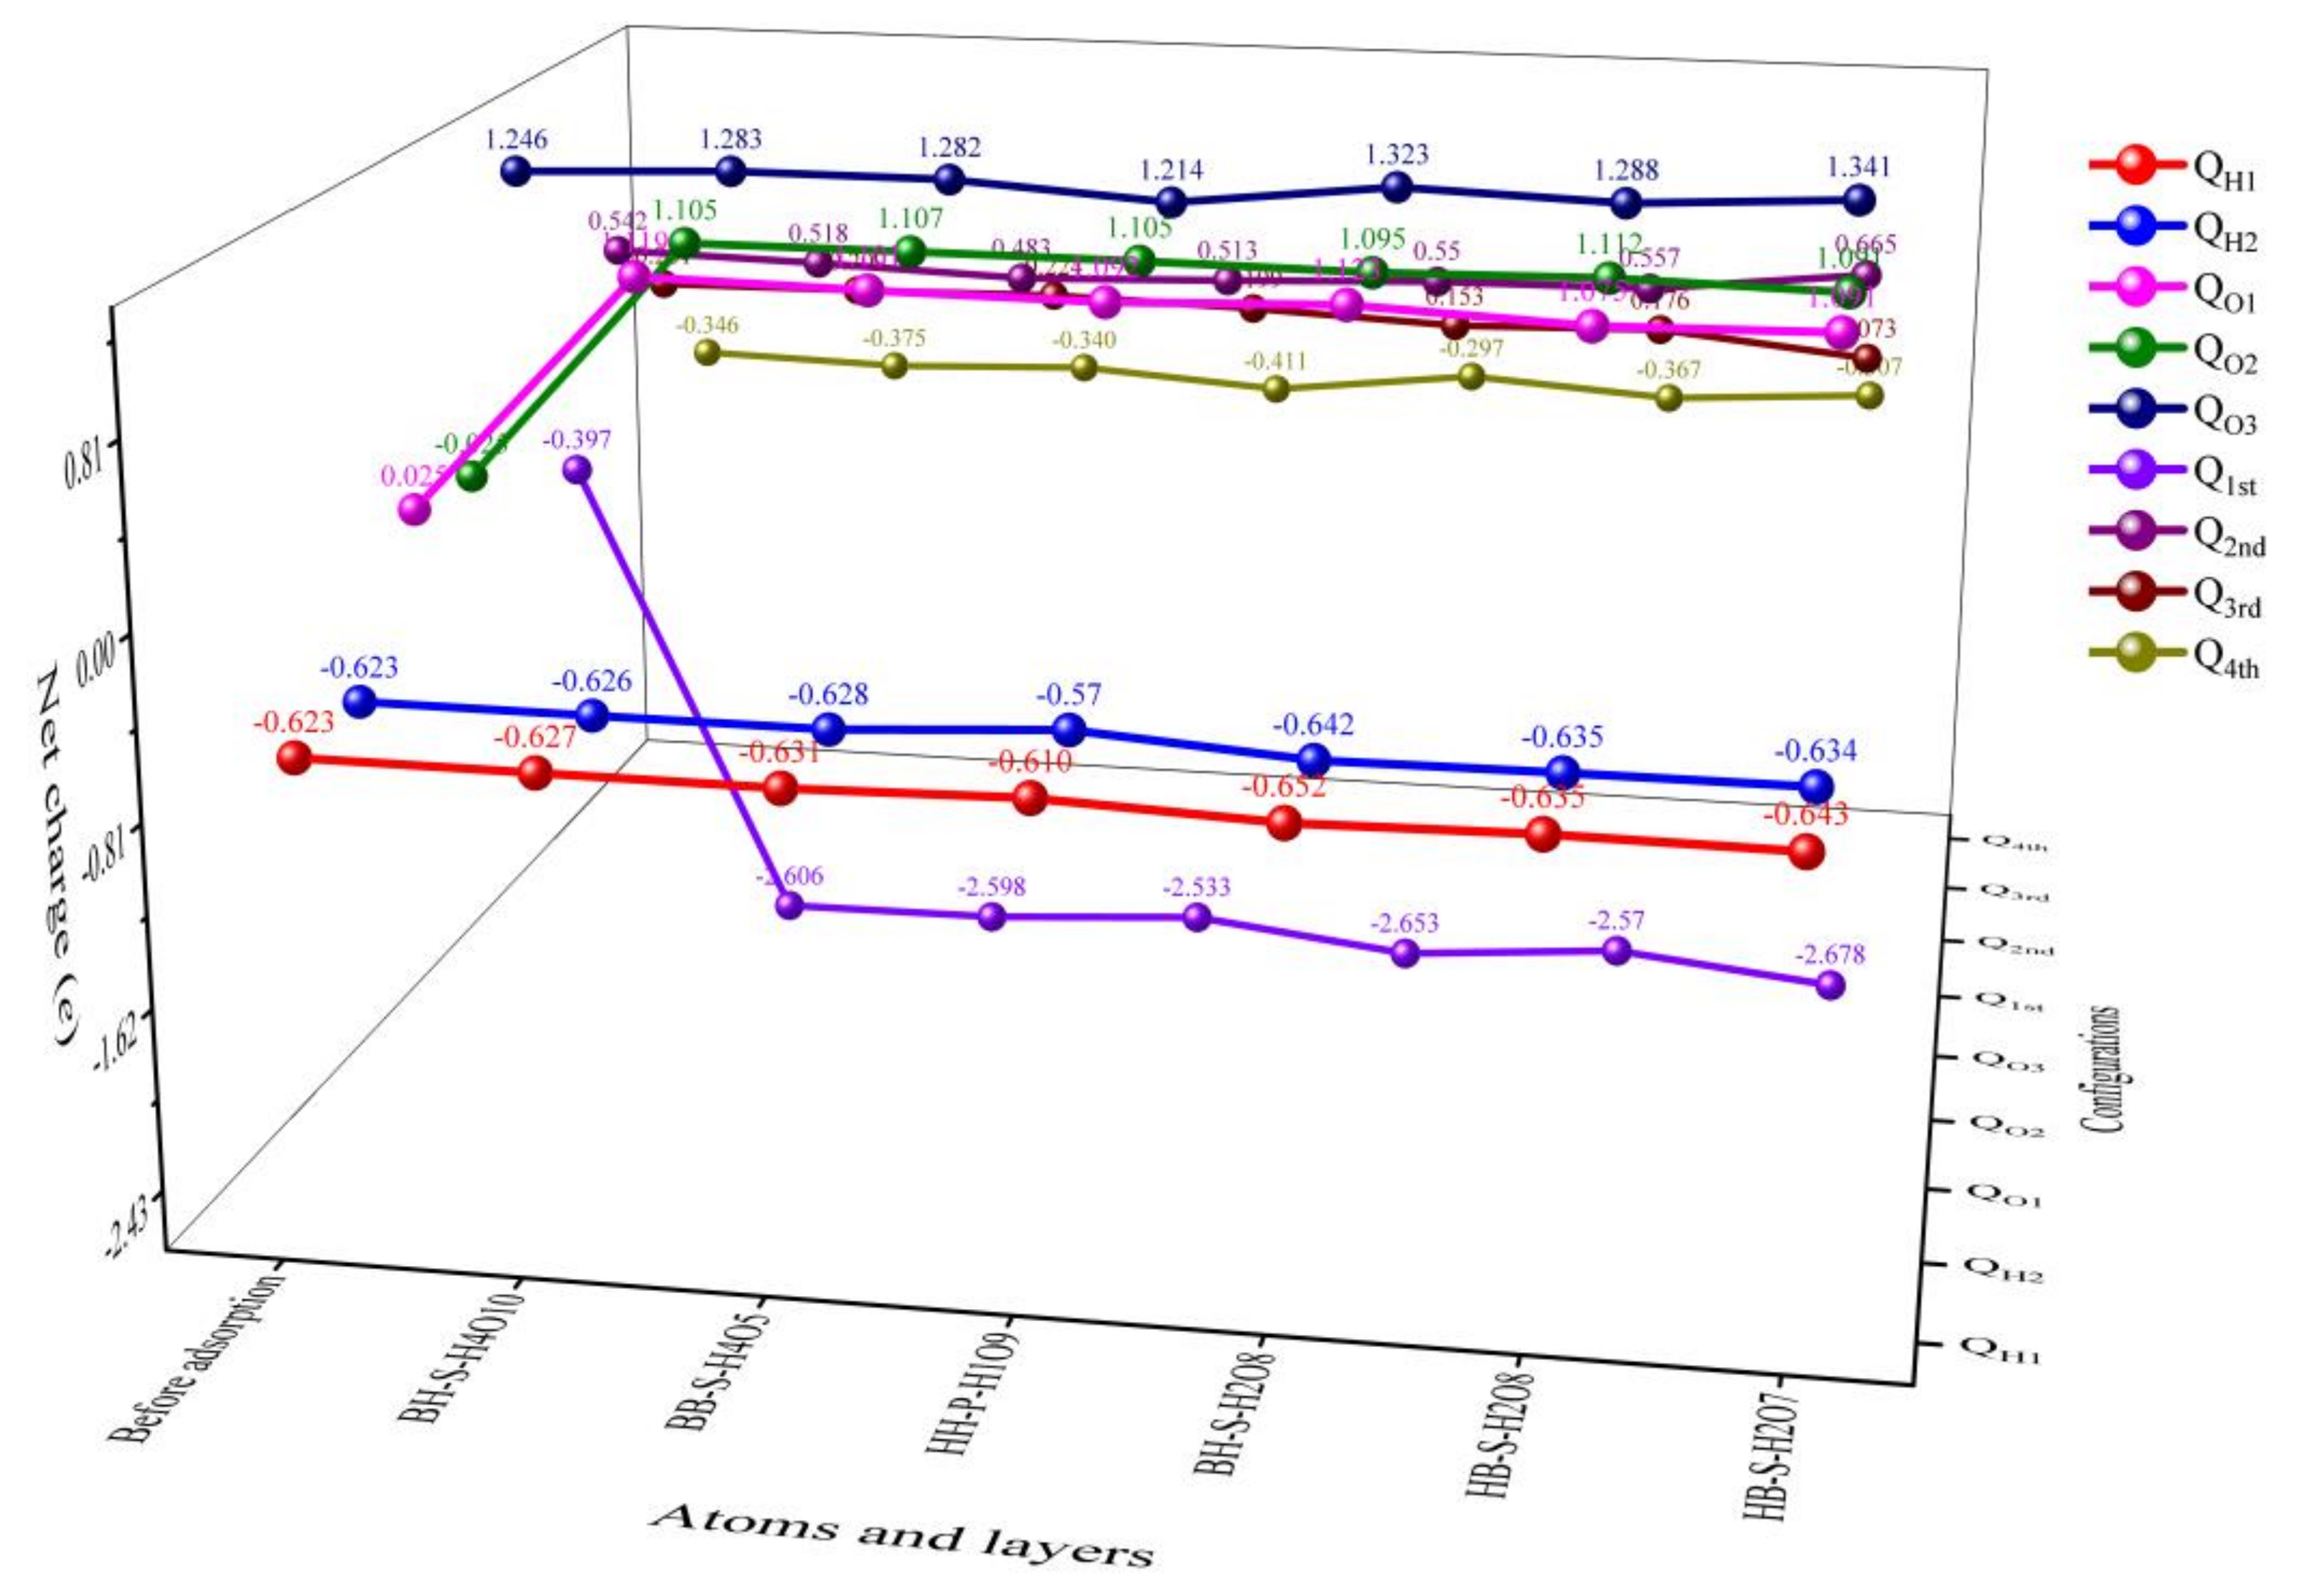
Similarly, when the data in Table 3 are analyzed in combination with Figure 5 and Figure 7, it can be found that, similar to H2O preferential adsorption, when co-adsorption is carried out under the condition of preferential adsorption of O2, the atoms or molecules co-adsorbed on the surface of δ-Pu (100) receive electrons, and the Pu atoms in the four layers of δ-Pu (100) lose electrons and the charge is transferred from the surface of δ-Pu (100) to the adsorbed atoms or molecules. However, the charge transfer amounts of the six stable adsorption configurations are generally smaller than those of the adsorption configurations with preferential adsorption of H2O. The total charge transfer numbers of the six stable adsorption configurations are all between 2.2 e and 2.3 e, and the total charge transfer numbers of H2O molecules at the bridge position are generally higher than those at the heart position and the top position. After co-adsorption, H2O molecules generally receive an electric charge, but compared with before adsorption, the electric charge has little change, ranging from 0.018 e to 0.064 e. The two O atoms preferentially adsorbed are also universally obtained electrons. Compared with those before adsorption, the charge of the O1 atom ranges from 1.050 e to 1.098 e, and that of the O2 atom ranges from 1.120 e to 1.137 e. It can be seen that the charge of Pu atoms on the surface of δ-Pu (100) mainly transfers to two O atoms preferentially adsorbed, and the amount of transfer to H2O molecule adsorbed afterward is very small. By analyzing the surface delamination of δ-Pu (100), it is found that the charge of the outermost Pu atom ranges from −2.281 e to −2.136 e, that of the subsurface Pu atom ranges from -0.059 e to 0.123 e, that of the Pu atom in the third layer ranges from −0.128 e to 0.023 e and that of the bottom Pu atom ranges from −0.065 e to 0.049 e. It can be seen that the charge change of the topmost Pu atoms is much larger than that of the following three layers, which indicates that the charge transfer mainly occurs between the topmost Pu atoms and the co-adsorbed atoms and molecules, while the other three layers have less charge transfer.
Figure 8 and Figure 9 show the charge of each atom after co-adsorption. According to the analysis of Figure 4 and Figure 5, all O atoms in the 12 co-adsorption configurations are negatively charged, and all H atoms and Pu atoms on the surface of δ-Pu (100) are positively charged. From the point of view of the degree of charge transfer, the charge transfer of all adsorption configurations mainly occurs between Pu atoms and adsorbed atoms on the surface of δ-Pu (100). These phenomena are highly consistent with the charge data obtained in Table 2 and Table 3.
3.3. Differential Charge Density Analysis
The differential charge density diagram can more intuitively show the charge gain and loss of each region in the adsorption configuration and plays an important role in analyzing the charge transfer and bonding between adsorbed molecular atoms and Pu atoms on the surface of δ-Pu (100) [41,42]. The formula for calculating the differential charge density is as follows.
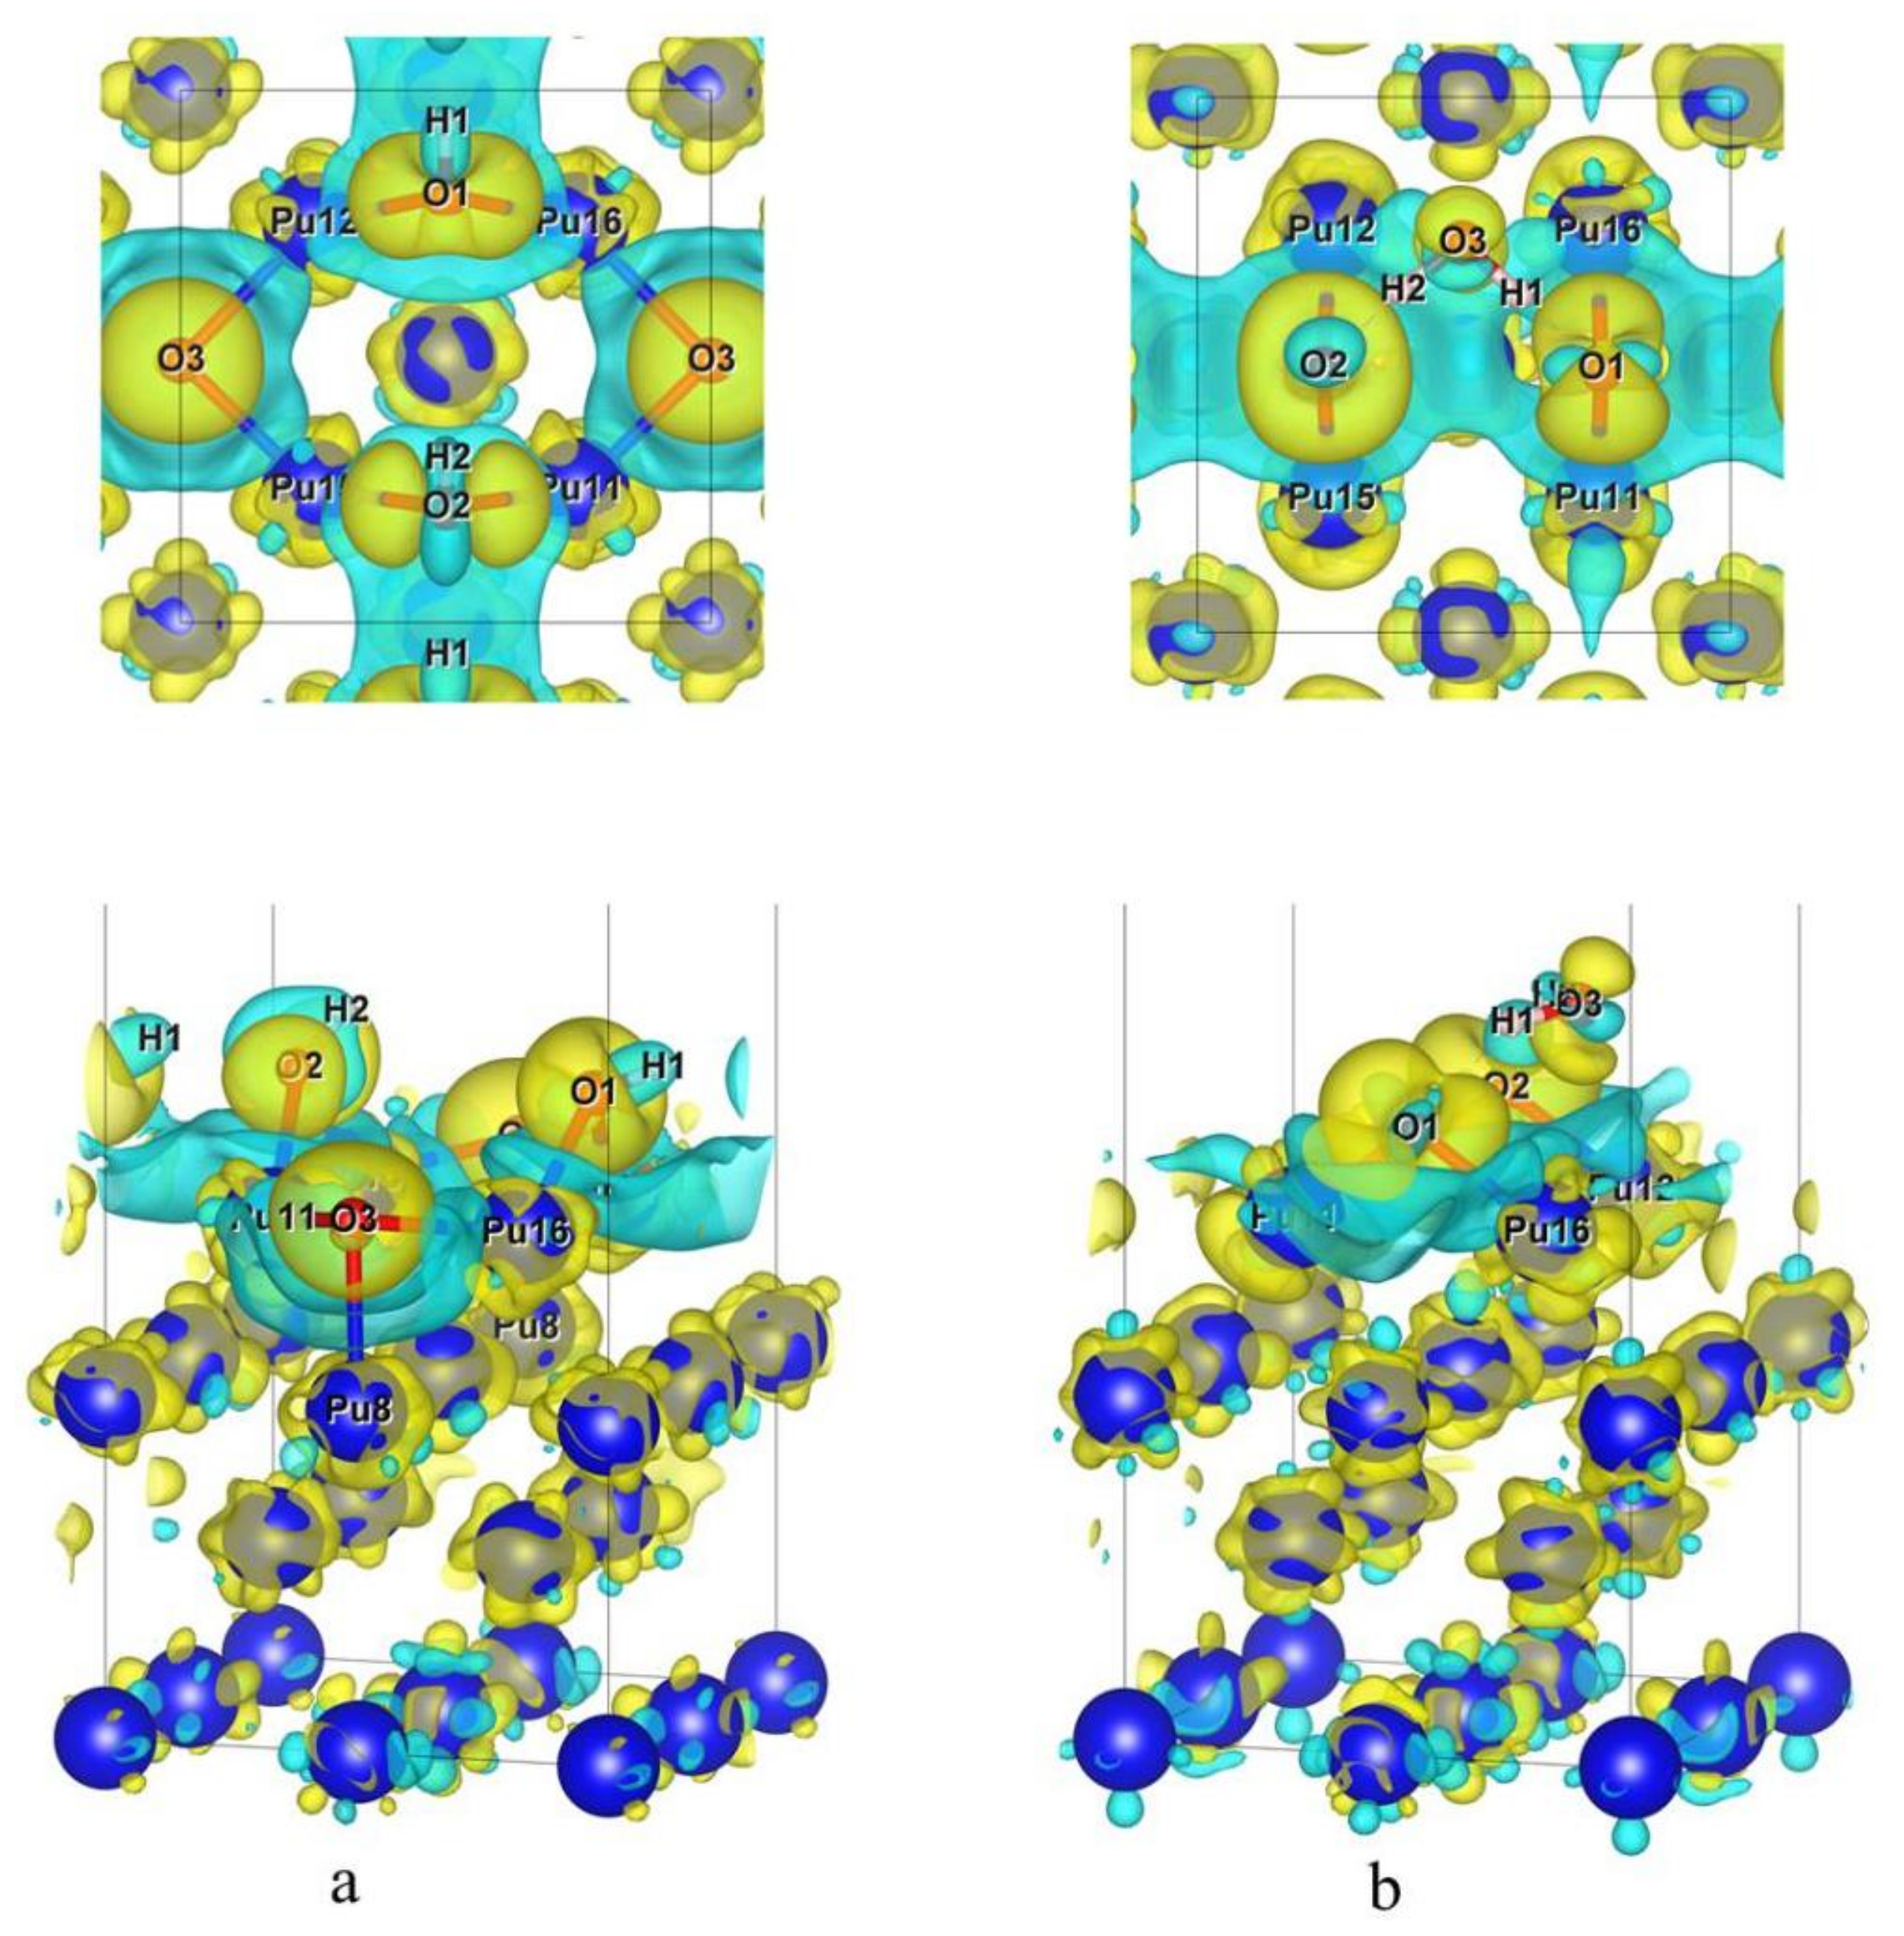
In the above formula, Δρ represents differential charge density, ρt represents charge density of stable adsorption configuration, ρa represents charge density of all the H atoms and O atoms after adsorption and ρs represents charge density of δ-Pu (100) surface after adsorption. Figure 10a,b shows differential charge density diagrams of the most stable adsorption configuration optimized for H2O preferential adsorption and the most stable adsorption configuration optimized for O2 preferential adsorption, respectively.
Comparing and analyzing Figure 10a,b, it can be concluded that among the two most stable adsorption configurations obtained by preferential adsorption of H2O (BH-S-H4O10) or O2 (B-S-H2O4), the charge transfer degree between the δ-Pu (100) surface and adsorbed atoms or molecules is greater when H2O is preferentially adsorbed than when O2 is preferentially adsorbed. It is possible that O3 atoms in the BH-S-H4O10 configuration and Pu8 atoms in the subsurface layer also have a large degree of charge transfer, while the charge transfer in the B-S-H2O4 configuration mainly occurs between adsorbed atoms and molecules and Pu atoms in the outermost layer. It may be due to the fact that the O3 atom in BH-S-H4O10 configuration and the Pu8 atom in the subsurface layer also have a large degree of charge transfer, while the charge transfer in the B-S-H2O4 configuration mainly occurs between adsorbed atoms and molecules and Pu atoms in the outermost layer. Generally speaking, in the two most stable adsorption configurations, the decreased degree of charge density around all adsorbed O atoms is far less than the increased degree, which indicates that there is a high concentration of charge distribution around O atoms. Similarly, the charge density around all Pu atoms nearest to the O atom changes obviously. The charge density on one side near the O atom generally decreases and on the other side generally increases. From O to Pu along the Pu–O bond, the charge density first decreases and then increases, which means that the Pu–O bond has ionic behavior. In the BH-S-H4O10 configuration, the charge density around two H atoms decreases, which indicates that the charge of H atoms obviously transfers to O atoms and the O–H bond also has ionic bond behavior. In the B-S-H2O4 configuration, the charge density around two H atoms is almost unchanged. These phenomena indicate that in the process of co-adsorption, charge transfer mainly occurs between Pu atoms and O atoms in the two layers of the surface, and there is also a weak charge transfer between H atoms and O atoms, while there is almost no charge transfer between H atoms and Pu atoms. These conclusions are consistent with the results of the Bader charge analysis.
3.4. Electronic Density of States Analysis
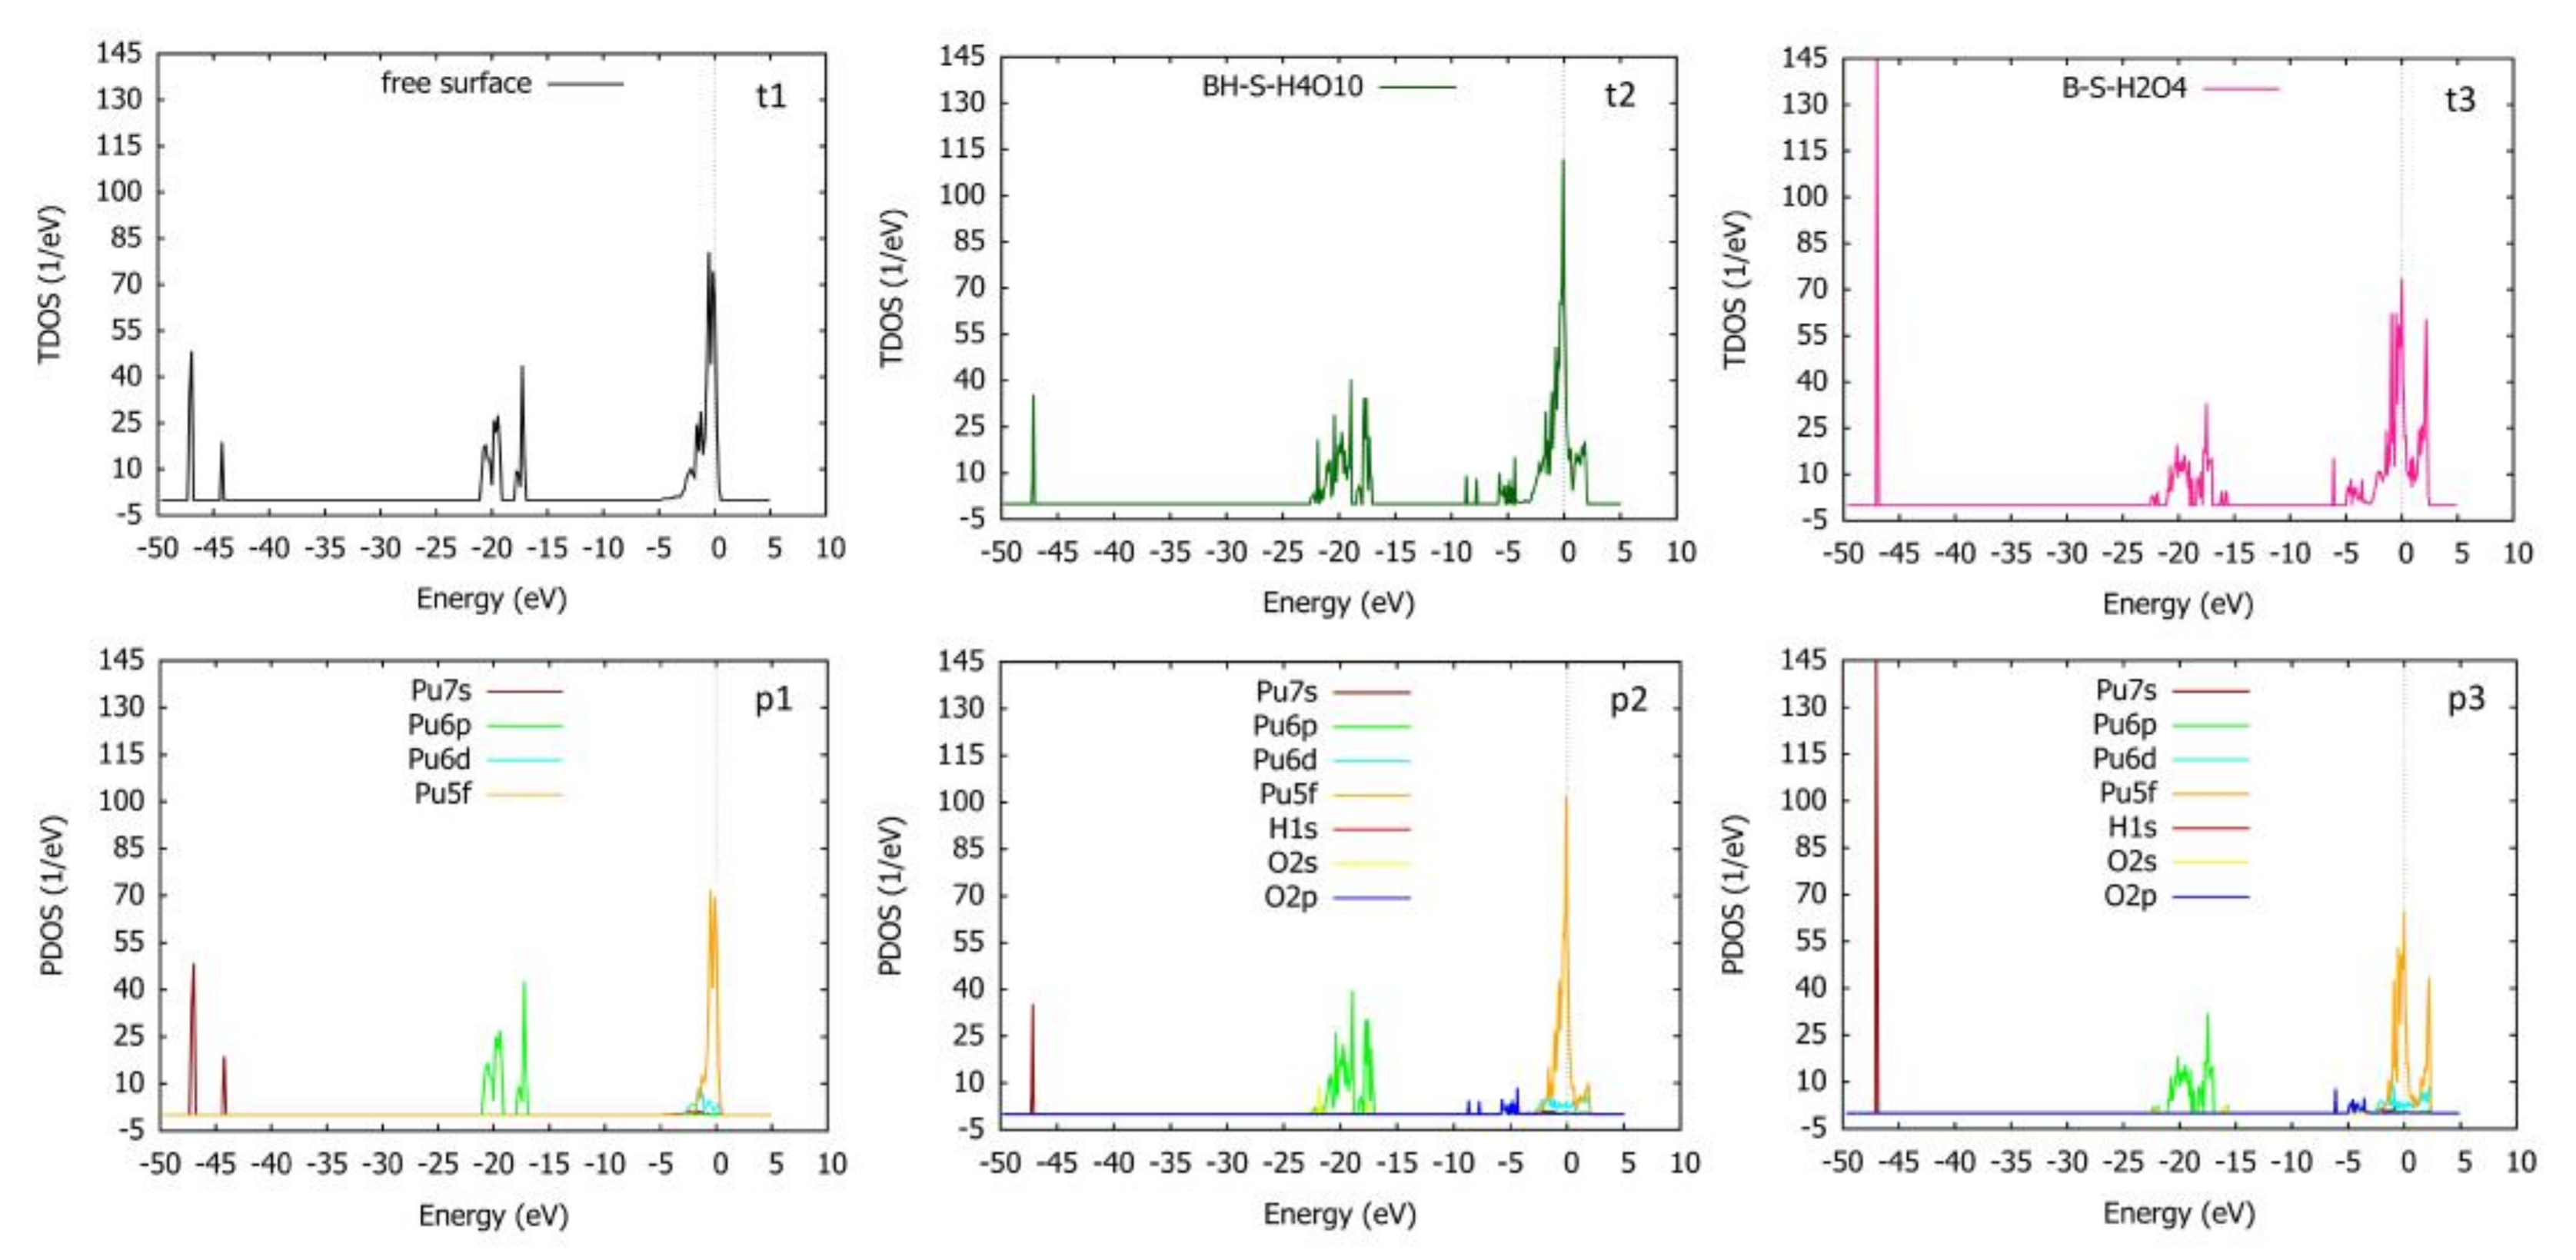
By analyzing the total density of states (TDOS) and partial density of states (PDOS) of the system, it is possible to more specifically understand the electronic structure of the adsorption system and the nature of the bonding between the adsorbed molecules or atoms and the adsorbed surface atoms [43]. It can be seen from t1 and p1 in Figure 11 that the electronic structure on the surface of pure δ-Pu (100) is strongly localized, and the electronic states are mainly localized in three energy regions: −47 eV~−44 eV, −21 eV~−17 eV and −5 eV~0.5 eV, with a large number of electronic states in the high energy region. The electronic states in the energy range of −47 eV~−44 eV are mainly contributed by Pu7s orbitals, those in the energy range of −21 eV~−17eV are mainly contributed by Pu6p orbitals and those in the energy range of −5 eV~0.5 eV are mainly contributed by Pu5f and Pu6d orbitals. In the most stable co-adsorption model obtained by preferential adsorption of H2O, the broadening and peak value of the low-energy region of TDOS decreased, while the broadening and peak value of the middle-energy region and high-energy region increased. Comparing figure t2 with figure p2, it can be concluded that the change of states density in the low-energy region is due to the decrease of peak and broadening of Pu7s orbitals, the change of states density in the middle-energy region is due to the occupation of O2s orbitals and the increase of Pu6p orbitals and the change of state density in the high-energy region is due to the occupation of O2p orbitals, the increase of Pu6p orbitals and the increase of peak and broadening of Pu5f orbitals. Comparative analysis of figure t2 and figure t3 shows that in the most stable co-adsorption model obtained by preferential adsorption of O2, the peak value of low energy region of TDOS increases and the broadening decreases, which is mainly due to the increase of peak value and the decrease of broadening of Pu7s orbitals. The broadening of the middle energy region increases and the peak value decreases, which is due to the occupation of O2s orbitals and the decrease of Pu6p orbitals broadening and the increase of peak value. In the high-energy region, the broadening increases and the peak value decreases, which is due to the occupation of O2p orbitals, the decrease of peak value and the increase of broadening of Pu5f and Pu6d orbitals. Generally speaking, no matter the preferential adsorption of H2O or O2, after co-adsorption, the electronic structure of the system retains the local characteristics of the pure surface before adsorption, but the broadening and peak value of each element orbitals have some changes. From these phenomena, we can find that the H1s orbitals contribute little to the total density of states, and the interaction between the δ-Pu (100) surface and adsorbed atoms mainly occurs between Pu atoms and O atoms.
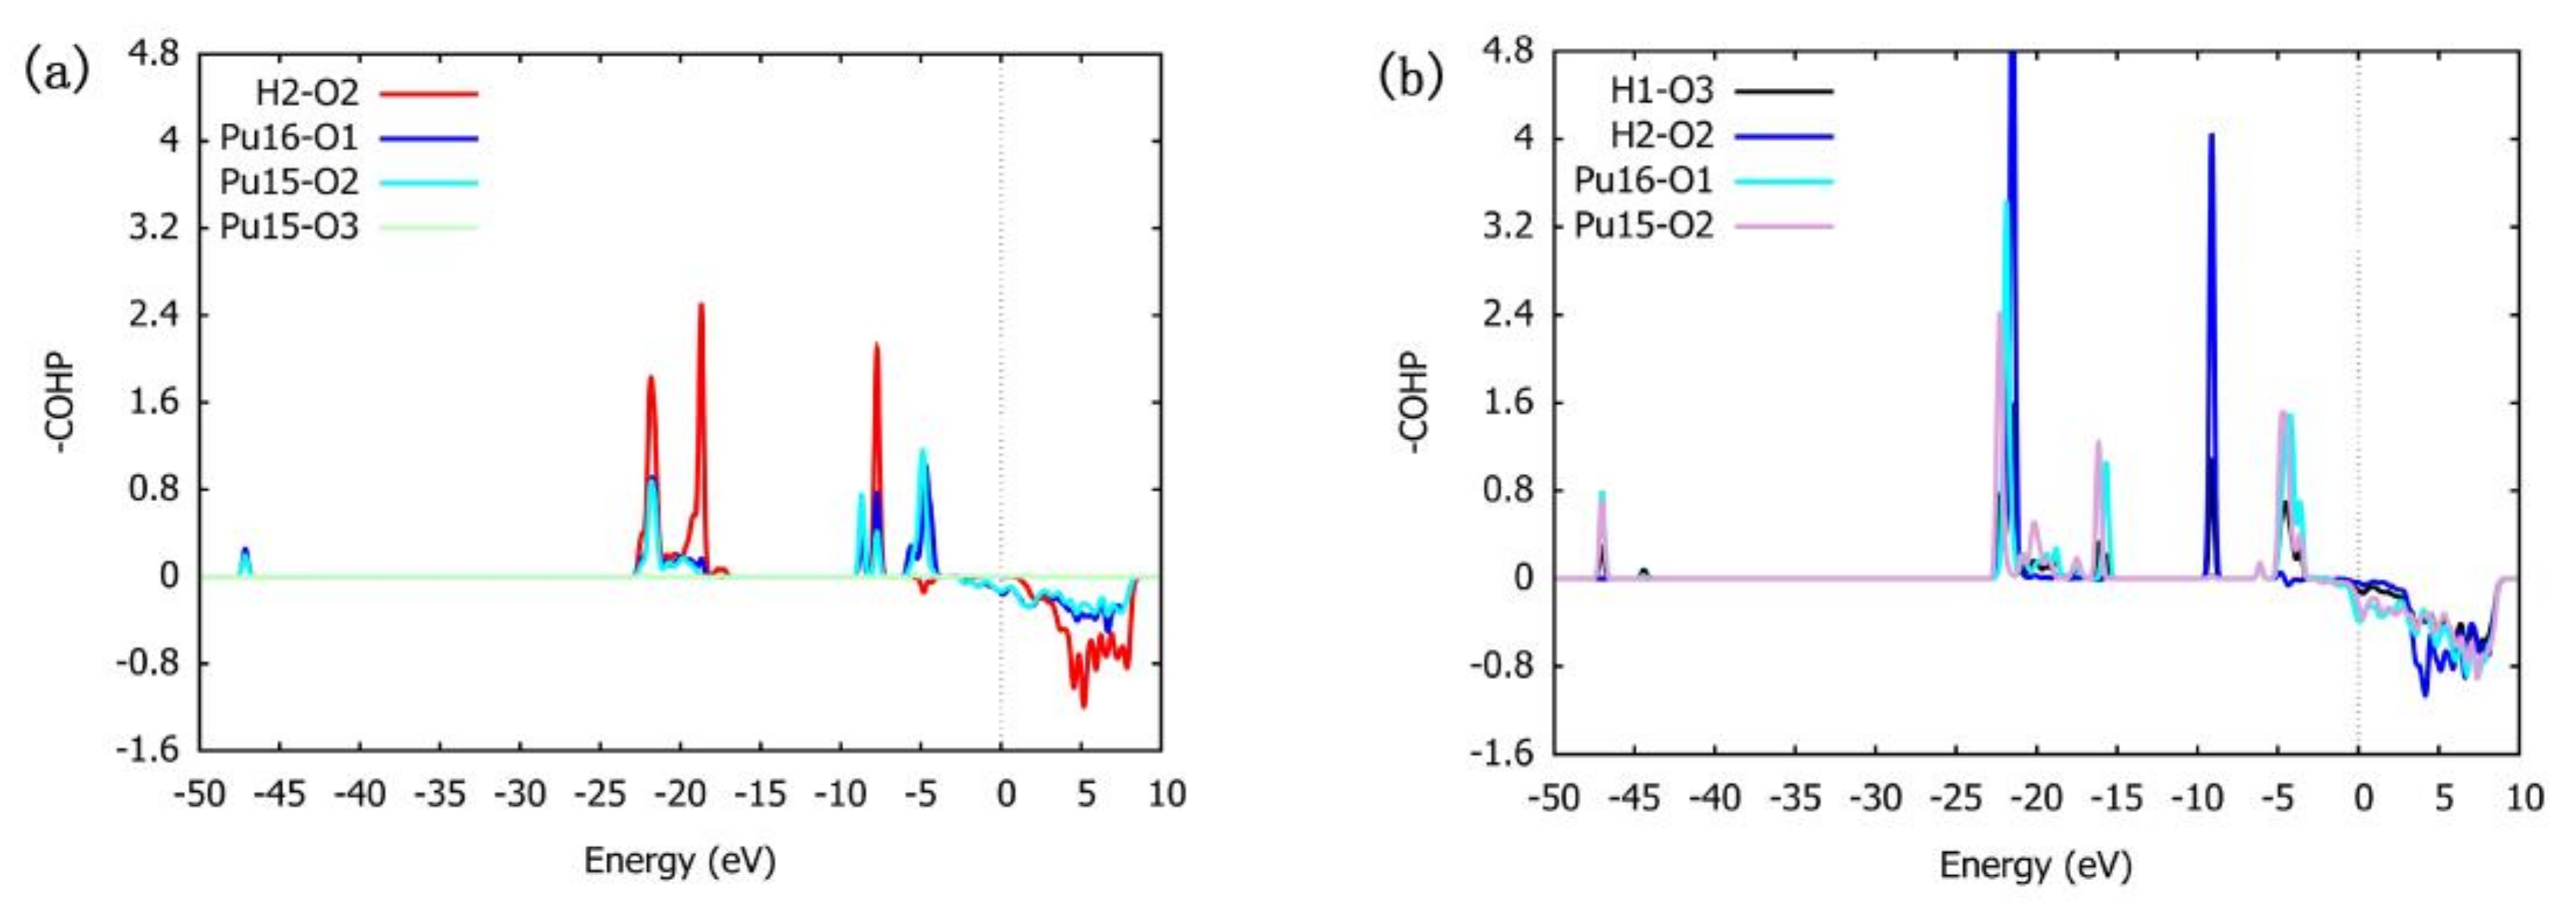
In order to compare the interaction intensity between adjacent atoms in the two most stable adsorption configurations after adsorption more intuitively, we calculated COHP (Hamiltonian population of crystal orbit) and ICOHP [44,45] of the interaction between adjacent atoms by using the LOBSTER program [46,47]. The value of –COHP is positive for bonding and negative for anti-bonding. ICOHP is the integral value of COHP from negative infinity to Fermi level, which can represent the interaction intensity between atoms. The more negative ICOHP value indicates the stronger bonding between atoms, and the more positive ICOHP value indicates the stronger anti-bonding between atoms.
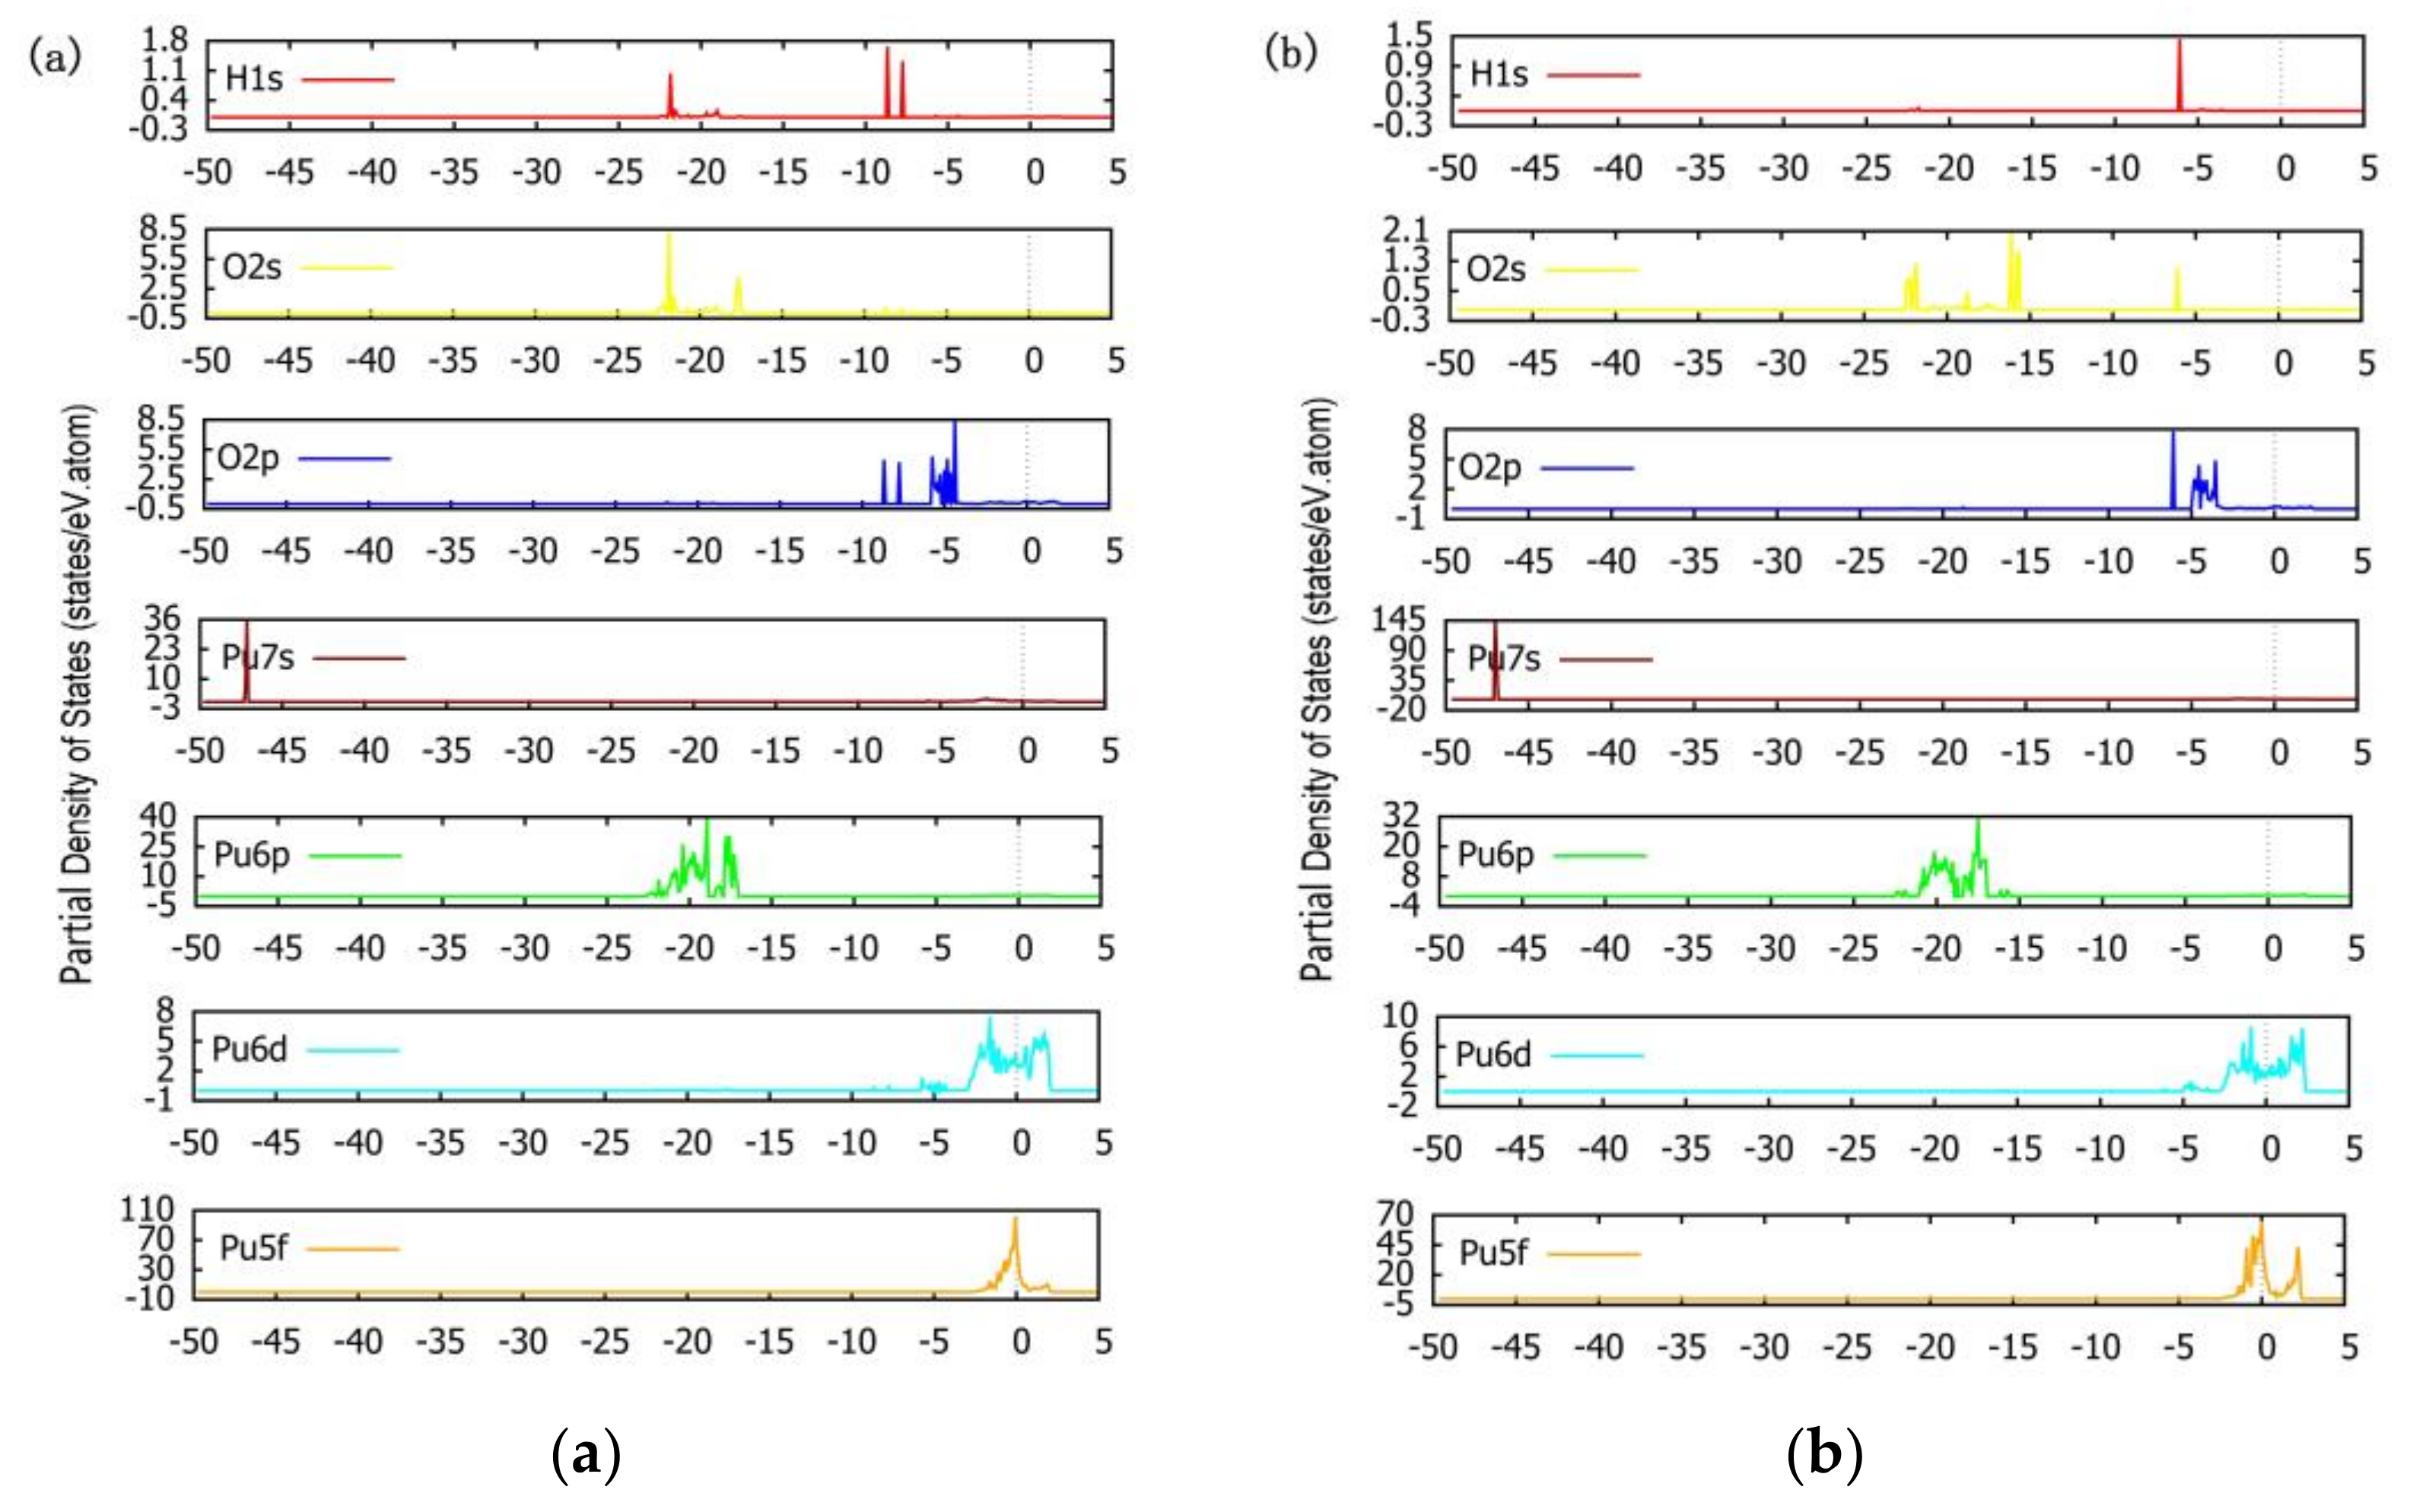
According to the analysis of Figure 12a combined with Figure 4 and the calculated ICOHP value, in the BH-S-H4O10 configuration, there are bonding interactions between H atoms and O atoms and between Pu atoms and O atoms below the Fermi level. Among them, the interaction between H atom and O atom is the strongest; the ICOHP value of H1-O1 is −3.74661 and the ICOHP value of H2-O2 is −3.95609. The interaction between the Pu atom and O atom at the bridge site is also strong; the ICOHP value of Pu16-O1 is −2.09331 and the ICOHP value of Pu15-O2 is −1.84934. The interaction between the Pu atom and O atom at bridge position is the weakest; the ICOHP value of Pu15-O3 is −0.01555. Therefore, when H2O is preferentially adsorbed, the phenomenon that O atoms combine with H atoms to form hydroxyl groups will make adsorption more stable, and O atoms at the bridge position are more likely to interact with neighboring Pu atoms than O atoms at the heart position. It can be seen from Figure 13a that the interaction between H atoms and O atoms is due to the overlapping hybridization of H1s orbitals and O2p and O2s orbitals, and the essence of the interaction between Pu atoms and O atoms lies in the overlapping hybridization between Pu6p and O2s orbitals and Pu6d and O2p orbitals.
Similarly, by analyzing Figure 12b with Figure 5 and calculated ICOHP values, it can be concluded that in the B-S-H2O4 configuration below the Fermi level, several interactions investigated are bonding interactions. The H–O bond in H2O has the strongest interaction, with the ICOHP value of H1-O3 being −3.82643 and the ICOHP value of H2-O3 being −3.83875. The interaction strength between the H atom and preferentially adsorbed O atom is much smaller than that of the H–O bond in H2O, and the ICOHP values of H1-O1 and H2-O2 are −0.28860 and −0.21112, respectively. The interaction strength between Pu atoms and preferentially adsorbed O atoms is related to the relative position between Pu atoms and H2O molecules. The bonding strength between Pu atoms far away from H2O molecules and preferentially adsorbed neighboring O atoms is greater, and the ICOHP values of Pu11-O1 and Pu15-O2 are −4.05682 and −4.03007, respectively. The bonding strength between Pu atoms near H2O molecules and preferentially adsorbed neighboring O atoms is smaller, and the ICOHP values of Pu16-O1 and Pu12-O2 are −4.05682 and −4.03007, respectively. This shows that the adsorption of H2O will weaken the bonding strength between preferentially adsorbed O atoms and Pu atoms, which may be due to the attraction of H atoms to preferentially adsorbed O atoms. It can be seen from Figure 13b that the electronic structure of H1s orbitals is more localized than that of BH-S-H4O10 configuration, and there are obvious hybridization peaks between H1s orbitals and O2p and O2s orbitals at −6 eV. The strong interaction of the H–O bond is due to the overlapping hybridization of H1s orbitals with O2p and O2s orbitals. Consistent with the BH-S-H4O10 configuration, the essence of the interaction between the Pu atom and O atom is also the overlapping hybridization of O2s and Pu6p orbitals and O2p and Pu6d orbitals.
3.5. Surface Work Function Analysis
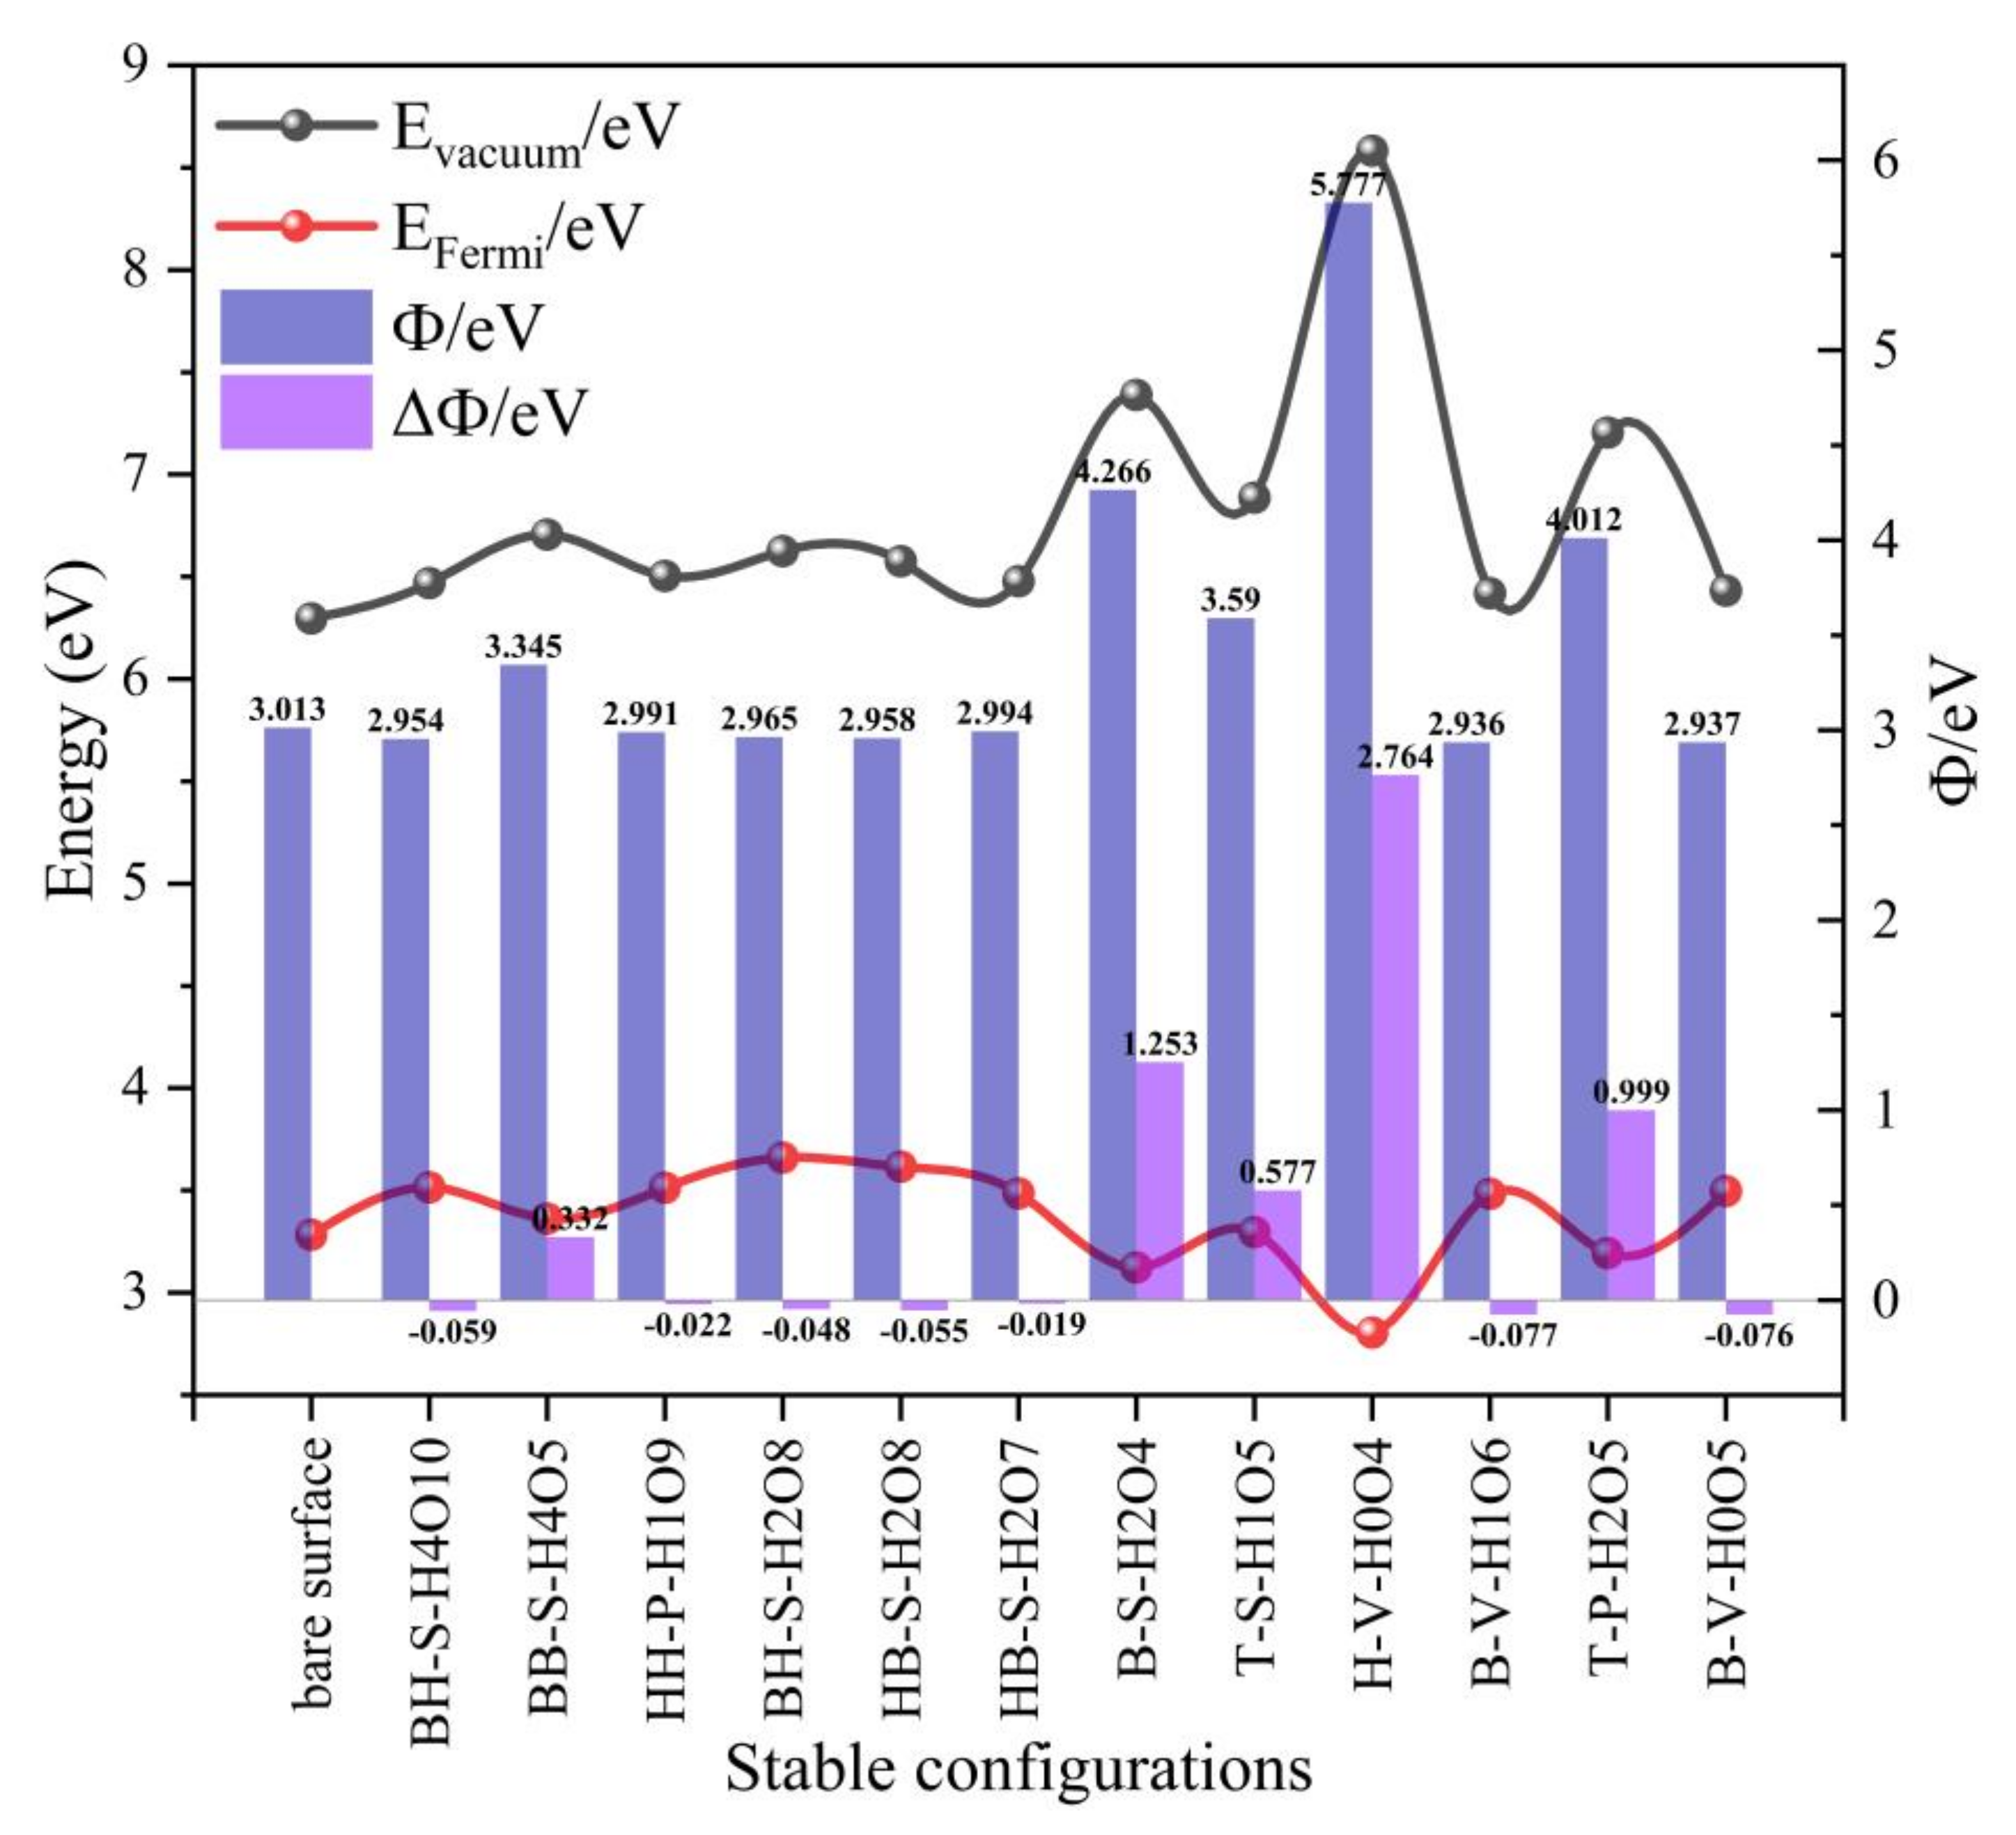
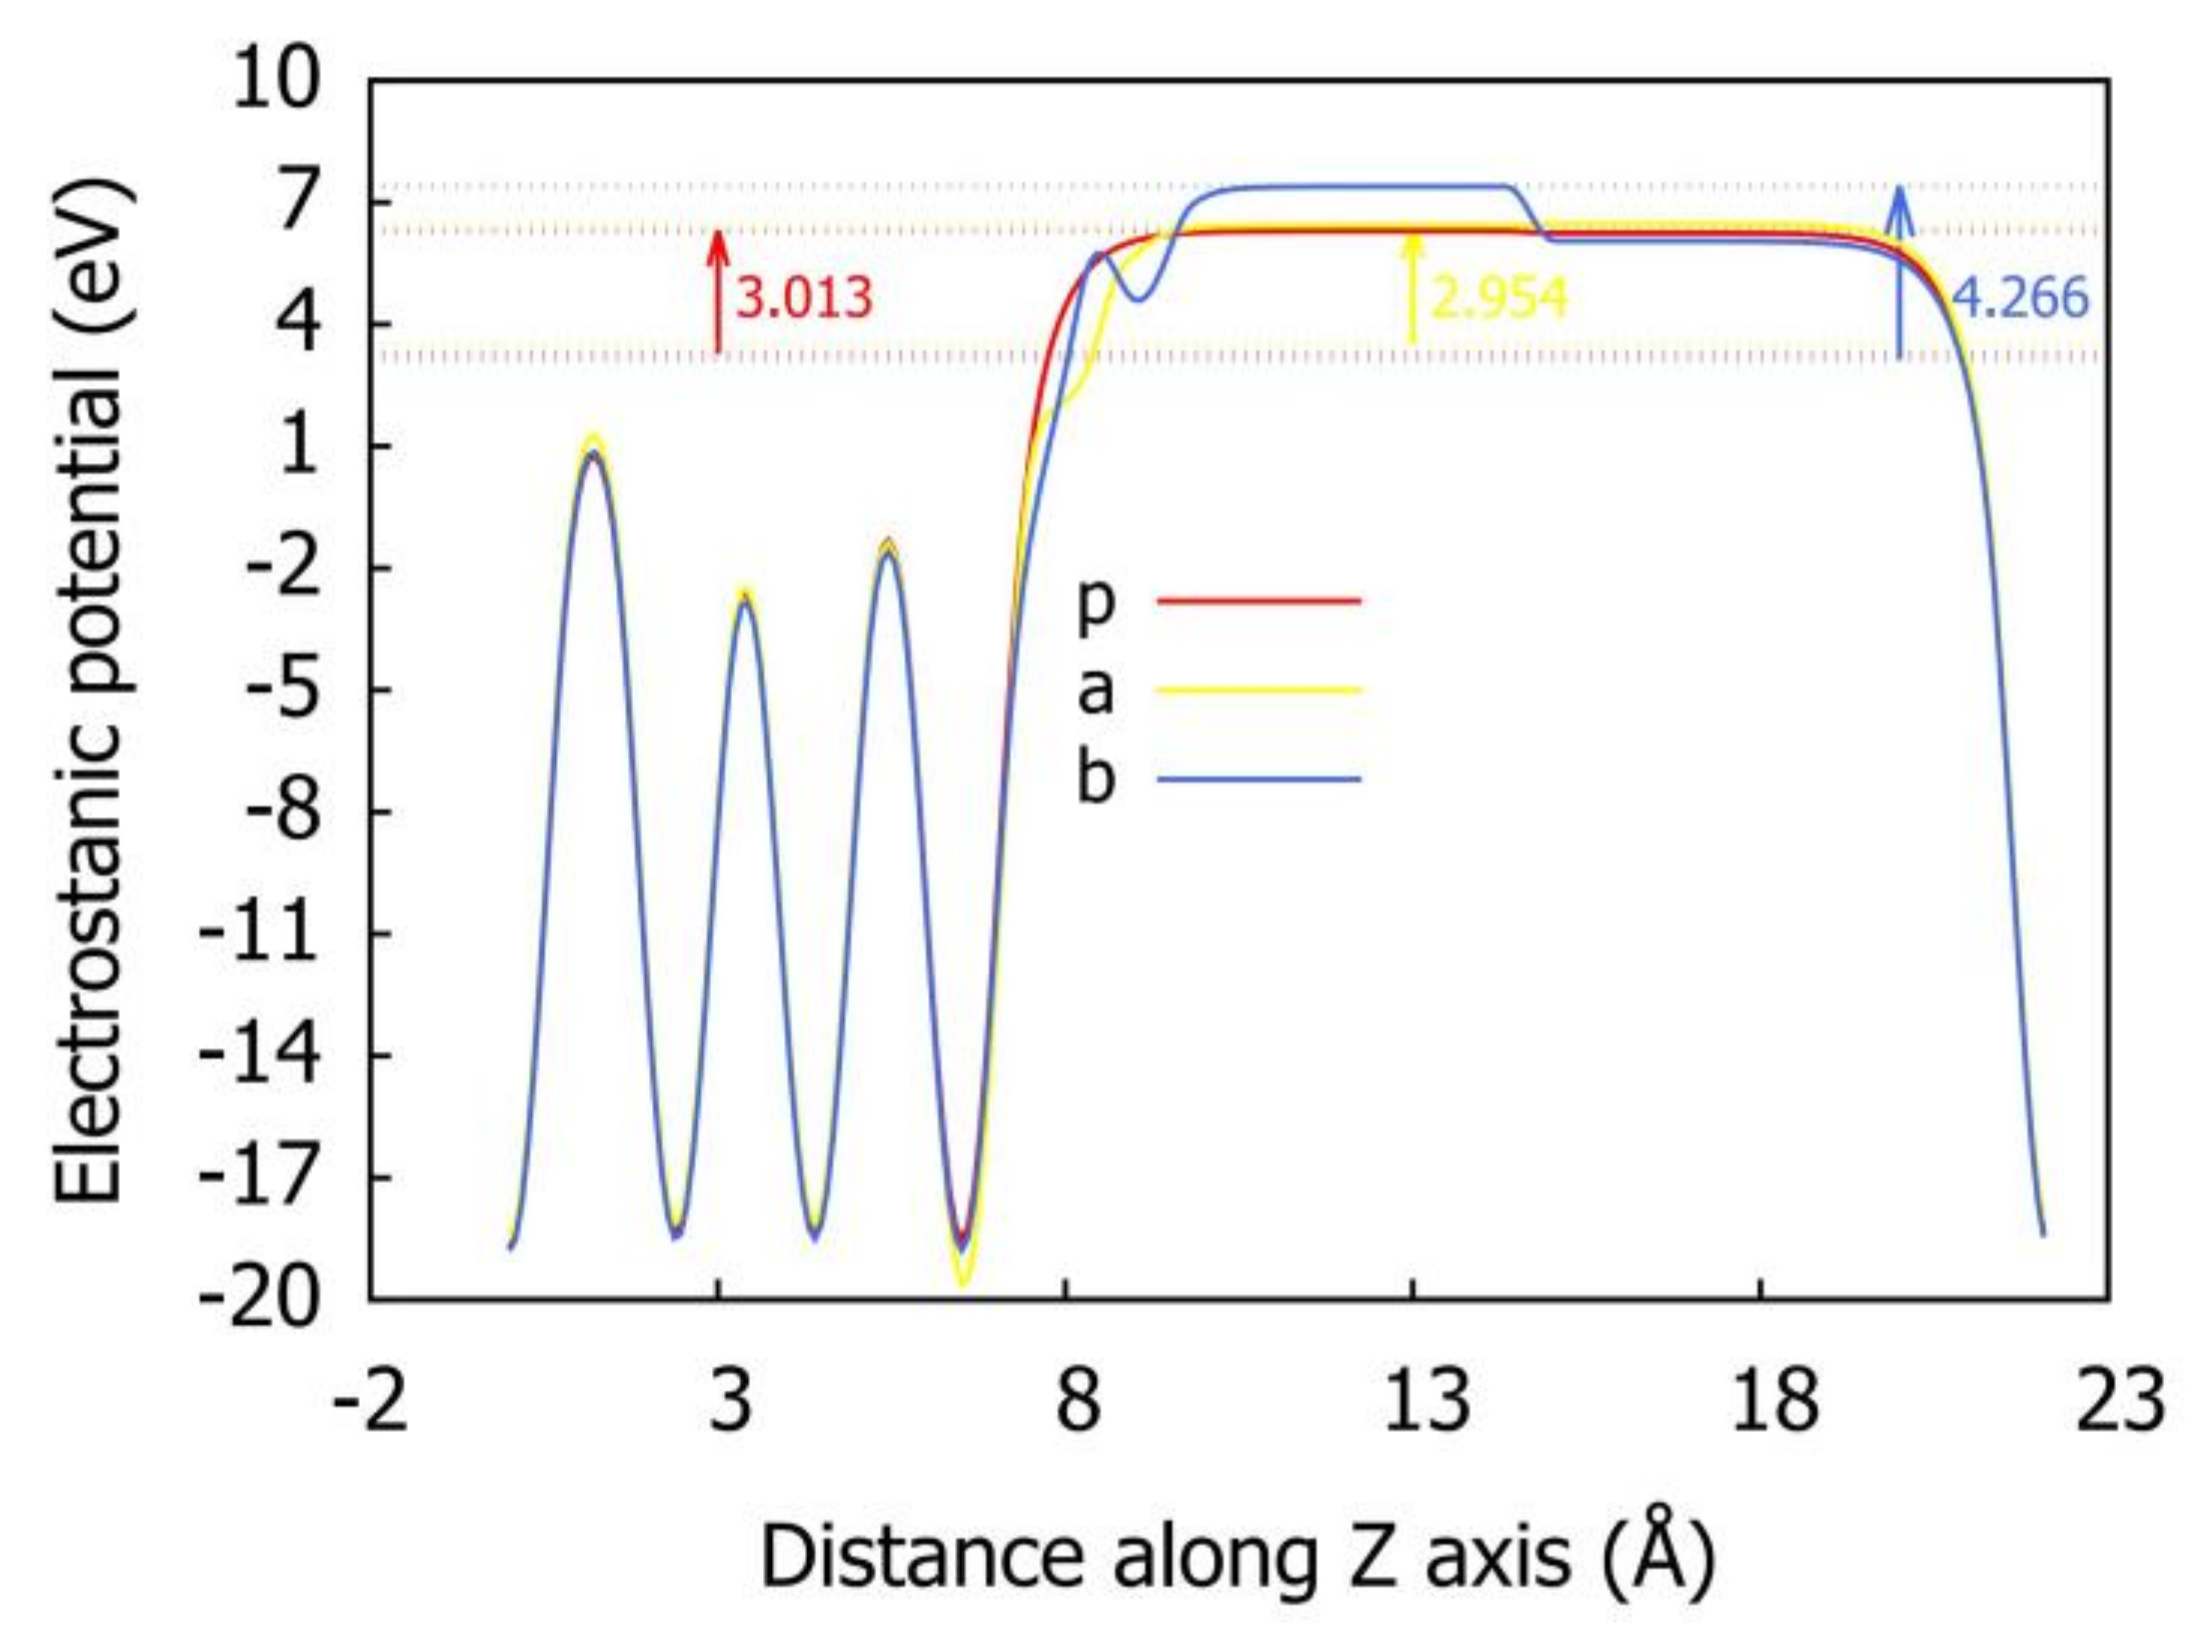
By analyzing the data in Table 4 and Figure 14, it can be seen that among the six stable adsorption configurations optimized for preferential adsorption of H2O, except for the configuration BB-S-H4O5, the surface work function increases, and the other five configurations decrease to a small extent, with the decreasing range being between 0.022 eV and 0.059 eV. It can be seen that the co-adsorption during H2O preferential adsorption has little effect on the work function of δ-Pu (100) surface; that is, it has little effect on the difficulty of electrons escaping from the surface, but the high probability will make electrons escape from the surface more easily and make the surface relatively stable. Among the six stable adsorption configurations optimized under the condition of preferential adsorption of O2, except for B-V-H1O6 configuration and B-V-H0O5 configuration, the surface work functions of the other four configurations all increased more, ranging from 0.577 eV to 2.764 eV, and the degree of increase is heart position > bridge position > top position. This shows that the co-adsorption when O2 is preferentially adsorbed tends to decrease the surface stability of δ-Pu (100) and increase the difficulty of electrons escaping from the surface. Based on these phenomena, we can conclude that different types of preferential adsorption molecules have different influences on the co-adsorption process, which proves that it is reasonable for us to consider two different preferential adsorption methods. Figure 15 more intuitively shows the most stable adsorption configuration in two cases and the change of electrostatic potential on the pure δ-Pu (100) surface.
Evacuum: the distance between H atom and O atom, EFermi: Fermi level, Ф: surface work function (Ф=Evacuum- EFermi), ΔФ: the difference of surface work function between adsorption configuration and pure δ-Pu (100) surface.
4. Conclusions
In this paper, the co-adsorption behavior of O2 and H2O on the δ-Pu (100) surface is studied by the first-principle method. The results are in good agreement with the experimental facts. Compared with single adsorption, the co-adsorbed two molecules promote each other, and the adsorption stability and strength are greatly increased.
Firstly, by comparing the adsorption energy of each stable adsorption configuration, the two most stable adsorption configurations, BH-S-H4O10 and B-S-H2O4, are obtained when H2O is preferentially adsorbed and O2 is preferentially adsorbed. At the same time, we find that the co-adsorption in both cases coexisted with multiple adsorption configurations. When the H2O preferential adsorption is used as the substrate for co-adsorption, two O atoms dissociated from O2 molecules interacted and bonded with Pu atoms adjacent to the surface and H atoms dissociated from H2O molecules, which greatly improved the adsorption stability. When co-adsorption is carried out on the basis of O2 preferential adsorption, H2O molecules will preferentially adsorb at the bridge site in an inclined state. The difference is that the adsorbed H2O molecules do not have much influence on the adsorption configurations of the two O atoms preferentially adsorbed.
Secondly, the results of charge analysis show that whether H2O or O2 is preferentially adsorbed, the charge transfer mainly occurs between Pu atoms on the surface and adsorbed atoms and molecules. Pu atoms on the surface generally lose electrons, O atoms generally gain electrons and H atoms generally lose electrons.
Thirdly, through the analysis of electronic structure, we find that both the Pu–O bond and H–O bond in the co-adsorption configuration have ionic bond behavior, and the H–O interaction is stronger than the Pu–O interaction. The essence of the Pu–O interaction is the overlapping hybridization between O2s and O2p orbitals and Pu6p and Pu6d orbitals. Co-adsorption of the two molecules does not change the localization of the electronic structure on the surface of δ-Pu (100). In contrast, the surface work function of the optimized co-adsorption configuration is smaller when H2O is preferentially adsorbed, and electrons escape from the surface more easily. After co-adsorption, the surface is more stable.
Author Contributions
G.W. and Z.Z. made equal contributions to the article. Conceptualization, G.W.; methodology, Z.Z. and P.Z.; formal analysis, G.W. and X.C.; investigation, P.Z. and X.C.; data curation, Z.Z.; writing—original draft preparation, G.W. and Z.Z.; supervision, G.W. and Y.L. All authors have read and agreed to the published version of the manuscript.
Funding
This work was funded by the National Natural Science Foundation of China (22076219), Postgraduate Funds of the Xi’an Research Institute of High-Tech (2020HY10301).
Informed Consent Statement
Informed consent was obtained from all subjects involved in the study.
Acknowledgments
We thank Xinli Sun, Jintao Wang and Guoxun Ji at the Computing Center of Xi’an Research Institute of High-Tech for their assistance with data analysis.
Conflicts of Interest
The authors declare no conflict of interest.
References
- Shim, J.H.; Haule, K.; Kotliar, G. Fluctuating valence in a correlated solid and the anomalous properties of δ-plutonium. Nature 2007, 446, 513–516. [Google Scholar] [CrossRef] [Green Version]
- Hecker, S.S. Plutonium—An Element Never at Equilibrium. Metall. Mater. Trans. A 2008, 39, 1585–1592. [Google Scholar] [CrossRef]
- Luo, W.; Wang, Q.; Wang, X.; Gao, T. The plutonium chemistry of Pu+O2 system: The theoretical investigation of the plutonium–oxygen interaction. J. Iran. Chem. Soc. 2019, 16, 1157–1162. [Google Scholar] [CrossRef]
- Atta-Fynn, R.; Ray, A.K. A first principles study of the adsorption and dissociation of CO2 on the δ-Pu (111) surface. Eur. Phys. J. B Condens. Matter Complex Syst. 2009, 70, 171–184. [Google Scholar] [CrossRef]
- Qi, C.B.; Wang, T.; Li, R.S.; Wang, J.T.; Qin, M.A.; Tao, S.H. First-principles study of co-adsorption behavior of O2 and CO2 molecules on δ-Pu (100) surface. Chin. Phys. B 2021, 30, 026601. [Google Scholar] [CrossRef]
- Goldman, N.; Morales, M.A. A First-Principles Study of Hydrogen Diffusivity and Dissociation on δ-Pu (100) and (111) Surfaces. J. Phys. Chem. C 2017, 121, 17950–17957. [Google Scholar] [CrossRef]
- Li, P.; Niu, W.; Gao, T.; Wang, H.; Water, O. Water OH Bond Activation by Gas-Phase Plutonium Atoms: Reaction Mechanisms and Ab Initio Molecular Dynamics Study. Chemphyschem 2015, 15, 3078–3088. [Google Scholar] [CrossRef] [PubMed]
- Wilkinson, W.D. Plutonium and its alloys. Nature 1960, 188, 826–827. [Google Scholar]
- Raynor, J.B.; Sackman, J.F. Oxidation of Plutonium in Moist Air and Argon. Nature 1963, 197, 587–588. [Google Scholar] [CrossRef]
- Haschke, J.M.; Allen, T.H.; Morales, L.A. Surface and Corrosion Chemistry of PLUTONIUM. Fas Org. 2000, 26, 252–273. [Google Scholar]
- Hecker, S.S.; Stevens, M.F. Mechanical Behavior of Plutonium and Its Alloys. Los Alamos Sci. 2000, 26, 336–355. [Google Scholar]
- Haschke, J.M.; Allen, T.H.; Morales, L.A. Reactions of plutonium dioxide with water and oxygen-hydrogen mixtures: Mechanisms for corrosion of uranium and plutonium. U.S. Dep. Energy 1999, 1–43. [Google Scholar]
- Delley, B. An all-electron numerical method for solving the local density functional for polyatomic molecules. J. Chem. Phys. 1990, 92, 508–517. [Google Scholar] [CrossRef]
- Delley, B. A scattering theoretic approach to scalar relativistic corrections on bonding. Int. J. Quantum Chem. 1998, 69, 423–433. [Google Scholar] [CrossRef]
- Delley, B.J. From molecules to solids with the DMol3 approach. J. Chem. Phys. 2000, 113, 7756–7764. [Google Scholar] [CrossRef]
- Luo, W.H.; Meng, D.Q.; Li, G.; Chen, H.C. Density functional study of CO adsorption on Pu (100) surface. Acta Phys. Sin. 2008, 57, 160–164. [Google Scholar]
- Xiong, X.L.; Wei, H.Y.; Luo, S.Z.; Wang, G.Q.; Hui, R. Adsorption structure and electronic state of CO adsorbed on δ-Pu (100) surface. J. Sichuan Univ. (Nat. Sci. Ed.) 2011, 48, 126–132. [Google Scholar]
- Jomard, G.; Bottin, F.; Geneste, G. Water adsorption and dissociation on the PuO2 (110) surface. J. Nucl. Mater. 2014, 451, 28–34. [Google Scholar] [CrossRef]
- Huda, M.N.; Ray, A.K. Electronic structures and bonding of oxygen on plutonium layers. Eur. Phys. J. B Condens. Matter Complex Syst. 2004, 40, 337–346. [Google Scholar] [CrossRef]
- Huda, M.N.; Ray, A.K. A density functional study of molecular oxygen adsorption and reaction barrier on Pu (100) surface. Phys. Condens. Matter 2005, 43, 131–141. [Google Scholar] [CrossRef]
- Hecker, S.S.; Stevens, M.F. Aging of Plutonium and Its Alloys. Los Alamos Sci. 2000, 26, 238–243. [Google Scholar]
- Li, G.; Lai, X.C.; Sun, Y. An All-electron FLAPW Study of Geometric and Electronic Structures for δ-Pu Monolayer. Acta Phys. Chim. Sin. 2005, 21, 686–689. [Google Scholar]
- Kresse, G.; Furthmüller, J. Furthmüller. Efficient Iterative Schemes for Ab Initio Total-Energy Calculations Using a Plane-Wave Basis Set. Phys. Rev. B 1996, 54, 11169. [Google Scholar] [CrossRef]
- Kresse, G.; Hafner, J. Ab initio molecular dynamics for open-shell transition metals. Phys. Rev. B 1993, 48, 13115–13118. [Google Scholar] [CrossRef]
- Blochl, P.E. Projector augmented-wave method. Phys. Rev. B 1994, 50, 17953–17979. [Google Scholar] [CrossRef] [Green Version]
- Kresse, G.; Joubert, D. From ultrasoft pseudopotentials to the projector augmented-wave method. Phys. Rev. B 1999, 59, 1758–1775. [Google Scholar] [CrossRef]
- Perdew, J.P.; Burke, K.; Ernzerhof, M. Generalized gradient approximation made simple. Phys. Rev. Lett. 1996, 77, 3865. [Google Scholar] [CrossRef] [PubMed] [Green Version]
- Monkhorst, H.J.; Pack, J.D. Special points for Brillouin-zone integrations. Phys. Rev. B 1976, 13, 5188–5192. [Google Scholar] [CrossRef]
- Jijun, G.; Guoping, L.; Hongyuan, W. First-principles study on adsorption behavior of O2 on δ-Pu (100) surface. Comput. Appl. Chem. 2013, 30, 026601. [Google Scholar]
- Dholabhai, P.P.; Ray, A.K. Adsorption structure and electronic state of oxygen on δ-Pu (111) surface. Comput. Appl. Chem. 2009, 26, 913–916. [Google Scholar]
- Atta-Fynn, R.; Ray, A.K. A Relativistic DFT Study of Water Adsorption on delta-Plutonium (111) Surface. Chem. Phys. Lett. 2009, 470, 233–239. [Google Scholar] [CrossRef]
- Hongyuan, W. Adsorption, dissociation and diffusion of atoms and molecules on δ-Pu. China Acad. Eng. Phys. 2010, 75, 506. [Google Scholar]
- Green, D.W.; Reedy, G.T. ChemInform Abstract: INFRARED SPECTRA OF MATRIX-ISOLATED PLUTONIUM OXIDES. Chem. Inf. 1978, 9, 544–551. [Google Scholar] [CrossRef]
- Haire, R.G. High-temperature vaporization of transplutonium oxides. J. Alloy. Compd. 1994, 213, 185–190. [Google Scholar] [CrossRef]
- The Materials Project. Materials Data on PuH2 (SG:225) by Materials Project. 2020. [CrossRef]
- The Materials Project. Materials Data on PuH3 (SG:194) by Materials Project. 2016. [CrossRef]
- Wei, S.; Ma, L.; Yang, Z.; Dai, X.; Zhang, K. Electronic Structure and Characteristic of Co Chemisorptionon Si (100) SurfaceCo. J. Semicond. 2003, 24, 1040–1043. [Google Scholar]
- Sanville, E.; Kenny, S.D.; Smith, R.; Henkelman, G. Improved grid-based algorithm for Bader charge allocation. J. Comput. Chem. 2010, 28, 899–908. [Google Scholar] [CrossRef] [PubMed]
- Tang, W.; Sanville, E.; Henkelman, G. A grid-based Bader analysis algorithm without lattice bias. J. Phys. Condens. Matter Inst. Phys. J. 2009, 21, 084204. [Google Scholar] [CrossRef] [PubMed]
- Yu, M.; Trinkle, D.R. Accurate and efficient algorithm for Bader charge integration. J. Chem. Phys. 2011, 134, 064111. [Google Scholar] [CrossRef] [Green Version]
- Kim, S.K.; Shin, J.; Moon, S.H.; Kim, J.; Lee, S.C. Theoretical Investigation of the Adsorption and C–C Bond Scission of CCH3 on the (111) and (100) Surfaces of Pd: Comparison with Pt. J. Phys. Chem. C 2013, 117, 18131–18138. [Google Scholar] [CrossRef]
- Tsuji, Y.; Yoshizawa, K. Adsorption and Activation of Methane on the (110) Surface of Rutile-type Metal Dioxides. J. Phys. Chem. C. Nanomater. Interfaces 2018, 122, 15359–15381. [Google Scholar] [CrossRef]
- Li, X.F.; Li, Q.K.; Cheng, J.; Liu, L.; Yan, Q.; Wu, Y.; Zhang, X.H.; Wang, Z.Y.; Qiu, Q.; Luo, Y. Conversion of Dinitrogen to Ammonia by FeN3-Embedded Graphene. J. Am. Chem. Soc. 2016, 138, 8706. [Google Scholar] [CrossRef] [PubMed]
- Deringer, V.L.; Tchougréeff, A.L.; Dronskowski, R. Crystal Orbital Hamilton Population (COHP) Analysis As Projected from Plane-Wave Basis Sets. J. Phys. Chem. A 2011, 115, 5461–5466. [Google Scholar] [CrossRef] [PubMed]
- Dronskowski, R.; Bloechl, P.E. Crystal orbital Hamilton populations (COHP): Energy-resolved visualization of chemical bonding in solids based on density-functional calculations. J. Phys. Chem. B 1993, 97, 8617–8624. [Google Scholar] [CrossRef]
- Nelson, R.; Ertural, C.; George, J.; Deringer, V.; Dronskowski, R. LOBSTER: Local orbital projections, atomic charges, and chemical bonding analysis from Projector-Augmented- Wave-Based DFT. J. Comput. Chem. 2020, 41. [Google Scholar] [CrossRef] [PubMed]
- Maintz, S.; Deringer, V.L.; Tchougréeff, A.L.; Dronskowski, R. LOBSTER: A tool to extract chemical bonding from plane-wave based DFT. J. Comput. Chem. 2016, 37, 1030–1035. [Google Scholar] [CrossRef] [Green Version]
Figure 1.
(a) The surface structure of four layers δ-Pu (100). (b) The most stable adsorption configuration of O2 single adsorption. (c) The most stable adsorption configuration of H2O single adsorption.
Figure 1.
(a) The surface structure of four layers δ-Pu (100). (b) The most stable adsorption configuration of O2 single adsorption. (c) The most stable adsorption configuration of H2O single adsorption.

Figure 2.
Initial co-adsorption model based on the most stable adsorption configuration of H2O single adsorption.
Figure 2.
Initial co-adsorption model based on the most stable adsorption configuration of H2O single adsorption.

Figure 3.
Initial co-adsorption model based on the most stable adsorption configuration of O2 single adsorption.
Figure 3.
Initial co-adsorption model based on the most stable adsorption configuration of O2 single adsorption.

Figure 4.
Stable co-adsorption configuration based on the most stable adsorption configuration of H2O single adsorption.
Figure 4.
Stable co-adsorption configuration based on the most stable adsorption configuration of H2O single adsorption.

Figure 5.
Stable co-adsorption configuration based on the most stable adsorption configuration of O2 single adsorption.
Figure 5.
Stable co-adsorption configuration based on the most stable adsorption configuration of O2 single adsorption.

Figure 6.
The trend figure of net charge distribution of co-adsorption stable configuration obtained when H2O is preferentially adsorbed.
Figure 6.
The trend figure of net charge distribution of co-adsorption stable configuration obtained when H2O is preferentially adsorbed.

Figure 7.
The trend figure of net charge distribution of co-adsorption stable configuration obtained when O2 is preferentially adsorbed.
Figure 7.
The trend figure of net charge distribution of co-adsorption stable configuration obtained when O2 is preferentially adsorbed.

Figure 8.
The atom charge of stable adsorption configuration obtained by preferential adsorption of H2O: red indicates positive charge, blue indicates negative charge and the charge range is −0.30 e~0.30 e.
Figure 8.
The atom charge of stable adsorption configuration obtained by preferential adsorption of H2O: red indicates positive charge, blue indicates negative charge and the charge range is −0.30 e~0.30 e.

Figure 9.
The atom charge of stable adsorption configuration obtained by preferential adsorption of O2: red indicates positive charge, blue indicates negative charge and the charge range is −0.30 e~0.30 e.
Figure 9.
The atom charge of stable adsorption configuration obtained by preferential adsorption of O2: red indicates positive charge, blue indicates negative charge and the charge range is −0.30 e~0.30 e.

Figure 10.
(a) Differential charge density diagram of BH-S-H4O10; (b) differential charge density diagram of B-S-H2O4 (electron density isosurface is 0.0035 e/Å3, yellow indicates an increase in charge density, while blue-green indicates a decrease in charge density; the top is a top view and the bottom is a perspective view).

Figure 11.
The density of state diagrams of δ-Pu (100) surface before preferential adsorption, the most stable adsorption configuration (BH-S-H4O10) obtained by preferential adsorption of H2O and the most stable adsorption configuration (B-S-H2O4) obtained by preferential adsorption of O2. t1: total density of states of pure δ-Pu (100) surface, p1: partial density of states of pure δ-Pu (100) surface, t2: total density of states of BH-S-H4O10, p2: partial density of states of BH-S-H4O10, t3: total density of states of B-S-H2O4, p3: partial density of states of B-S-H2O4; the dotted line in the figure represents the position of the Fermi level.

Figure 12.
The COHP between adjacent atoms in the two most stable adsorption configurations. (a) BH-S-H4O10 (b) B-S-H2O4 (dotted line in the figure indicates where Fermi level is located).
Figure 12.
The COHP between adjacent atoms in the two most stable adsorption configurations. (a) BH-S-H4O10 (b) B-S-H2O4 (dotted line in the figure indicates where Fermi level is located).

Figure 13.
The partial density of states (PDOS) of the two most stable adsorption configurations (a): BH-S-H4O10, (b): B-S-H2O4. (The dotted line in the figure indicates the location of the Fermi level.).
Figure 13.
The partial density of states (PDOS) of the two most stable adsorption configurations (a): BH-S-H4O10, (b): B-S-H2O4. (The dotted line in the figure indicates the location of the Fermi level.).

Figure 14.
The trend of changes in the surface work function of all stable adsorption configurations after optimization of co-adsorption of O2 and H2O on the δ-Pu (100) surface. (Evacuum: the distance between H atom and O atom, EFermi: Fermi level, Ф: surface work function (Ф = Evacuum − EFermi), ΔФ: the difference of surface work function between adsorption configuration and pure δ-Pu (100) surface.)

Figure 15.
The variation of electrostatic potential distance along z axis before and after co-adsorption. (p: pure δ-Pu (100) surface, a: BH-S-H4O10 configuration, b: B-S-H2O4 configuration).
Figure 15.
The variation of electrostatic potential distance along z axis before and after co-adsorption. (p: pure δ-Pu (100) surface, a: BH-S-H4O10 configuration, b: B-S-H2O4 configuration).


Table 1.
Structural parameters and adsorption energy after co-adsorption of O2 and H2O on δ-Pu (100) surface.
Table 1.
Structural parameters and adsorption energy after co-adsorption of O2 and H2O on δ-Pu (100) surface.
| Preferential Adsorption Molecule | Stable Configuration | Initial Configuration | Bond | dH–O | dH–Pu | dO–Pu | θH–O–H | hH–S | hO–S | Eads |
|---|---|---|---|---|---|---|---|---|---|---|
| H2O | BH-S-H4O10 | B-P-v | H1–O1 H2–O2 | 0.993 0.976 | 2.916 | 2.391 | - | 2.169 | 0.965 | −9.731 |
| BB-S-H4O5 | B-P-p | H1–O1 H2–O3 | 0.992 0.975 | 2.893 | 2.277 | - | 2.182 | 1.455 | −9.496 | |
| HH-P-H1O9 | H-V | H1–O1 H2–O1 H2–O3 | 0.976 0.987 2.052 | 2.821 | 2.481 | 105.872 | 2.624 | 1.159 | −9.461 | |
| BH-S-H2O8 | H-P-v | H1–O1 H2–O2 | 0.979 0.980 | 2.960 | 2.425 | - | 2.264 | 0.975 | −8.477 | |
| HB-S-H2O8 | H-P-p | H1–O1 H2–O3 | 0.974 0.980 | 2.996 | 2.416 | - | 2.477 | 1.169 | −8.325 | |
| HB-S-H2O7 | T-P-p | H1–O3 H2–O1 | 0.976 0.991 | 2.895 | 2.404 | - | 2.180 | 1.196 | −8.135 | |
| O2 | B-S-H2O4 | H-D-v | H1–O1 H2–O2 H1–O3 H2–O3 | 1.866 1.954 0.991 0.986 | 2.807 | 2.082 | 100.035 | 2.531 | 2.082 | −8.740 |
| T-S-H1O5 | B-U-v | H1–O1 H1–O3 H2–O3 | 1.944 0.989 0.975 | 2.728 | 2.199 | 106.259 | 2.780 | 1.681 | −8.727 | |
| H-V-H0O4 | H-U-v | H1–O2 H2–O1 H1–O3 H2–O3 | 2.033 2.116 0.978 0.977 | - | 2.067 | 102.433 | 3.028 | 2.008 | −8.673 | |
| B-V-H1O6 | B-D-v | H2–O1 H1–O3 H2–O3 | 2.155 0.974 0.986 | 2.947 | 2.325 | 108.902 | 2.763 | 1.553 | −5.431 | |
| T-P-H2O5 | H-D-p | H2–O1 H1–O3 H2–O3 | 1.909 0.983 0.986 | 2.900 | 2.245 | 100.548 | 2.624 | 1.697 | −4.202 | |
| B-V-H0O5 | T-D-p | H1–O3 H2– O3 | 0.980 0.979 | - | 2.194 | 108.788 | 2.717 | 1.505 | −3.772 |
Table 2.
Net charge distribution of co-adsorption stable configuration obtained when H2O is preferentially adsorbed.
Table 2.
Net charge distribution of co-adsorption stable configuration obtained when H2O is preferentially adsorbed.
| Initial Configuration | Stable Configuration | H2O | O2 | Qtotal/e | Layers | ||||||
|---|---|---|---|---|---|---|---|---|---|---|---|
| QH1/e | QH2/e | QO1/e | QO2/e | QO3/e | Q1st/e | Q2nd/e | Q3rd/e | Q4th/e | |||
| - | Free H2O and O2 | −0.623 | −0.623 | 1.246 | 0.025 | −0.025 | 0.000 | - | - | - | - |
| - | Bare surface | - | - | - | - | - | - | 0.397 | 0.542 | 0.201 | −0.346 |
| B-P-v | BH-S-H4O10 | −0.600 | −0.624 | 1.279 | 1.326 | 1.258 | 2.640 | 2.933 | 0.419 | 0.202 | −0.328 |
| B-P-p | BB-S-H4O5 | −0.636 | −0.627 | 1.312 | 1.117 | 1.301 | 2.467 | 2.901 | 0.543 | 0.225 | −0.334 |
| H-V | HH-P-H1O9 | −0.616 | −0.615 | 1.267 | 1.282 | 1.296 | 2.613 | 2.857 | 0.298 | 0.245 | −0.299 |
| H-P-v | BH-S-H2O8 | −0.553 | −0.573 | 1.314 | 1.304 | 1.277 | 2.769 | 2.965 | 0.273 | 0.240 | −0.317 |
| H-P-p | HB-S-H2O8 | −0.598 | −0.564 | 1.318 | 1.249 | 1.291 | 2.697 | 3.031 | 0.431 | 0.218 | −0.314 |
| T-P-p | HB-S-H2O7 | −0.581 | −0.669 | 1.355 | 1.274 | 1.273 | 2.652 | 2.982 | 0.403 | 0.223 | −0.296 |
Table 3.
Net charge distribution of co-adsorption stable configuration obtained when O2 is preferentially adsorbed.
Table 3.
Net charge distribution of co-adsorption stable configuration obtained when O2 is preferentially adsorbed.
| Initial Configuration | Stable Configuration | O2 | H2O | Qtotal/e | Layers | ||||||
|---|---|---|---|---|---|---|---|---|---|---|---|
| QO1/e | QO2/e | QO3/e | QH1/e | QH2/e | Q1st/e | Q2nd/e | Q3rd/e | Q4th/e | |||
| - | Free H2O and O2 | 0.025 | −0.025 | 1.246 | −0.623 | −0.623 | 0.000 | - | - | - | - |
| - | Bare surface | - | - | - | - | - | - | -0.397 | 0.542 | 0.201 | −0.346 |
| H-D-v | B-S-H2O4 | 1.119 | 1.105 | 1.283 | −0.627 | −0.626 | 2.254 | −2.606 | 0.518 | 0.209 | −0.375 |
| B-U-v | T-S-H1O5 | 1.101 | 1.107 | 1.282 | −0.631 | −0.628 | 2.231 | −2.598 | 0.483 | 0.224 | −0.340 |
| H-U-v | H-V-H0O4 | 1.092 | 1.105 | 1.214 | −0.610 | −0.570 | 2.231 | −2.533 | 0.513 | 0.199 | −0.411 |
| B-D-v | B-V-H1O6 | 1.123 | 1.095 | 1.323 | −0.652 | −0.642 | 2.247 | −2.653 | 0.550 | 0.153 | −0.297 |
| H-D-p | T-P-H2O5 | 1.075 | 1.112 | 1.288 | −0.635 | −0.635 | 2.205 | −2.570 | 0.557 | 0.176 | −0.367 |
| T-D-p | B-V-H0O5 | 1.091 | 1.091 | 1.341 | −0.643 | −0.634 | 2.246 | −2.678 | 0.665 | 0.073 | −0.307 |
Table 4.
Changes in the surface work function of all stable adsorption configurations after optimization of co-adsorption of O2 and H2O on the δ-Pu (100) surface.
Table 4.
Changes in the surface work function of all stable adsorption configurations after optimization of co-adsorption of O2 and H2O on the δ-Pu (100) surface.
| Preferential Adsorption Molecule | Stable Configuration | Evacuum/eV | EFermi/eV | Ф/eV | ΔФ/eV |
|---|---|---|---|---|---|
| - | bare surface | 6.296 | 3.283 | 3.013 | - |
| H2O | BH-S-H4O10 | 6.469 | 3.515 | 2.954 | −0.059 |
| BB-S-H4O5 | 6.707 | 3.362 | 3.345 | 0.332 | |
| HH-P-H1O9 | 6.505 | 3.514 | 2.991 | −0.022 | |
| BH-S-H2O8 | 6.625 | 3.660 | 2.965 | −0.048 | |
| HB-S-H2O8 | 6.575 | 3.617 | 2.958 | −0.055 | |
| HB-S-H2O7 | 6.479 | 3.485 | 2.994 | −0.019 | |
| O2 | B-S-H2O4 | 7.389 | 3.123 | 4.266 | 1.253 |
| T-S-H1O5 | 6.887 | 3.297 | 3.590 | 0.577 | |
| H-V-H0O4 | 8.583 | 2.806 | 5.777 | 2.764 | |
| B-V-H1O6 | 6.420 | 3.484 | 2.936 | −0.077 | |
| T-P-H2O5 | 7.205 | 3.193 | 4.012 | 0.999 | |
| B-V-H0O5 | 6.433 | 3.496 | 2.937 | −0.076 |
Publisher’s Note: MDPI stays neutral with regard to jurisdictional claims in published maps and institutional affiliations. |
© 2021 by the authors. Licensee MDPI, Basel, Switzerland. This article is an open access article distributed under the terms and conditions of the Creative Commons Attribution (CC BY) license (https://creativecommons.org/licenses/by/4.0/).
Share and Cite
MDPI and ACS Style
Wang, G.; Zhao, Z.; Zhai, P.; Chen, X.; Li, Y. First-Principle Study of Co-Adsorption Behavior of H2O and O2 on δ-Pu (100) Surface. Coatings 2021, 11, 1098. https://doi.org/10.3390/coatings11091098
AMA Style
Wang G, Zhao Z, Zhai P, Chen X, Li Y. First-Principle Study of Co-Adsorption Behavior of H2O and O2 on δ-Pu (100) Surface. Coatings. 2021; 11(9):1098. https://doi.org/10.3390/coatings11091098
Chicago/Turabian StyleWang, Guoliang, Zhaoyang Zhao, Pengfei Zhai, Xudan Chen, and Yefei Li. 2021. "First-Principle Study of Co-Adsorption Behavior of H2O and O2 on δ-Pu (100) Surface" Coatings 11, no. 9: 1098. https://doi.org/10.3390/coatings11091098
Note that from the first issue of 2016, this journal uses article numbers instead of page numbers. See further details here.