Article

Potential Utilization of Diluted Seawater for the Cultivation of Some Summer Vegetable Crops: Physiological and Nutritional Implications

1
Department of Environmental Sciences, Vehari Campus, COMSATS University Islamabad, Vehari 61100, Pakistan
2
College of Life Sciences, Yan’an University, Yan’an 716000, China
3
Department of Agronomy, Muhammad Nawaz Shareef University of Agriculture, Multan 60000, Pakistan
4
Institute of Crop Science (340h), University of Hohenheim, 70599 Stuttgart, Germany
5
Department of Agronomy, College of Agriculture, University of Sargodha, Sargodha 40100, Pakistan
6
Department of Agronomy, Bahauddin Zakariya University, Multan 60000, Pakistan
7
Department of Agronomy, University of Poonch, Rawalakot 12350, Pakistan
8
College of Agriculture, Fujian Agriculture and Forestry University, Fuzhou 350002, China
9
Seed Science and Technology, University of Agriculture, Faislalabad 38000, Pakistan
10
Department of Agronomy, University of Agriculture, Faislalabad 38000, Pakistan
11
Department of Agriculture, Food and Environment (Di3A), University of Catania, 95123 Catania, Italy
12
Institute of Biological Sciences, Campus Talca, Universidad de Talca, Talca 3465548, Chile
13
Department of Biology, College of Science, Taif University, P.O. Box 11099, Taif 21944, Saudi Arabia
*
Authors to whom correspondence should be addressed.
Agronomy 2021, 11(9), 1826; https://doi.org/10.3390/agronomy11091826
Submission received: 5 August 2021 / Revised: 9 September 2021 / Accepted: 9 September 2021 / Published: 12 September 2021

Abstract

:
Freshwater alternatives to irrigate crops are in dire need of time because of changing climate and scarcity of freshwater. Therefore, seawater can be the best feasible option as it is abundantly available on Earth. Sole application of seawater for agricultural crops is impossible, but the blend with freshwater may not be aggravating the salinization problems in soils. The present investigation was conducted to evaluate the possibility of growing the short period summer vegetables i.e., eggplants, tomato, and pepper with fresh and seawater blends viz. 5%, 10% and 20%, termed as A, B and C treatments, respectively. During the experiment, we considered: (i) crop growth, biomass yield, water consumption, water use efficiency (WUE) and water productivity (WP); (ii) photosynthetic pigments and gas exchange parameters; (iii) concentration of mineral contents and quality traits; (iv) lipid peroxidation, proline contents and ascorbic acid. Tomato productivity was markedly decreased by application of B and C treatments, whereas the growth of eggplant and pepper were not much influenced at the same concentrations. Water consumption dropped, whereas WUE significantly increased in all tested crops upon increasing seawater concentrations. Leaf Na+ concentration and other mineral elements increased. These results assumed that certain concentrations of seawater–freshwater blends revealed that there were no significant effects on the quality characteristics, mineral elements concentration and productivity of eggplant and pepper plants; however, tomato plants indicated sensitivity at the three seawater concentrations (A, B and C SFW treatments). Moreover, low concentrations of salinity stress (5% and 10% SFW) seemed to be necessary to attain better crop nutrition and organoleptic values. Accordingly, the results of present will be helpful to coastline farmers in cultivating vegetables and produce nutritive food for their family.

1. Introduction

By increasing residential houses, due to the growing population in the developing countries, the human population pressure of water consumption on global freshwater resources will noticeably escalate. Almost half the human population on the globe do not have access to potable water [1] and water scarcity for agricultural crops may be a critical issue in the twenty-first century [2], as it is currently using 70% of the total available freshwater [3,4]. Furthermore, there is growing poverty and socio-economic issues in the developing countries where freshwater is crucial for food production to meet the quantitative and qualitative needs of the growing population [5]. Therefore, it seems necessary to increase food production without a significant increase of freshwater availability and utilization. Most vegetables are sensitive to a saline environment, and yield decreases are noted with moderate to high levels of salt stress in the plant rooting zone [6]. In order to minimize the reduction in crop yield, proper managing approaches are required to maintain the salt ions in the plant rooting zone below the critical level [7]. Furthermore, in saline conditions, the quality and quantity of crops are unstable and can be maintained by minimizing the movement of salts into the plant growing media.
Malnutrition is one of the main problems of two-thirds of the population of the world, resulting in a shortage of one or more essential mineral elements in daily food [8,9]. Quality of food can be produced in the prevailing resources through proper management [10]. Moreover, the concentration of these essential nutrients, i.e., vitamins and phytochemicals (polyphenol, carotenoids, phenolic acids, flavonoids, ascorbic acids, fibers, stilbenes/lignans) can be maintained in the food [11]. Hence, agricultural products are the basic source of nutrients for human beings when introducing any new strategy for optimizing, improving, or sustaining crop production.
In general, the quantity and quality of vegetables are influenced by environmental stresses such as salinity and drought [12]. Salt sensitive plants under a salinity-stressed environment often tend to reduce water consumption, and consequently, retard the nutrient absorption systems [13,14]. Most of the conventional crops are not tolerant to elevated salinity stress, despite this, several are growing in up to 1–30% seawater concentrations [15]. Seawater may be the greatest alternative water source for irrigation as it is available on a large scale [16] and also a rich source of most of the nutrients [17] that are equally beneficial for plants and human. Thus, an integrated approach in the form of blending seawater with fresh water will be imperative for the sustainable advancement of the agricultural sector [15]. Seawater application to growing crops has long been under investigation, but its pure application to agricultural crops is impossible and may be needed to check its feasibility in a closed environment (hydroponic crop), as it will not aggravate the salinization problem in the crop root zone, which is a major threat to its application to crops [1]. Thus, seawater use can give us two benefits at the same time: the decreasing dependence of the agriculture sector on freshwater and growing crops utilizing the rich source of nutrients.
The earlier findings assumed that the application of seawater to crop plants up to a certain concentration does not affect crop quality and productivity [3,14,18,19,20]. Moreover, the maximum threshold level of seawater may change according to the nature of growing plant species. The chloride concentration in the seawater did not influence the uptake of nitrogen in lettuce and potato crops [2]. Moreover, the crop performance and higher N uptake significantly reduced the uptake of chloride concentration [1]. In addition, past studies have indicated that the concentration of secondary metabolites and the organoleptic value of vegetables are better in a saline environment (seawater or NaCl) as seen in broccoli [21], onion [22], tomato [23], and lettuce [3,20]. Those that are organoleptic with higher nutritional values are used in the prevention of human disease [24]. Thus, the achievable growth and development of other vegetables should be managed by adding a certain level of salt concentration.
All these results regarding the use of seawater on vegetables recommend that the use of the diluted seawater may improve the bio-fortification of horticultural crops and enhance the nutrients status of the food [2]. Although the previous literature offers the effects of a saline environment on over 130 crop species, information about several other crops with the use of seawater are missing [25], especially focusing on the nutritional and quality aspects.
In the present study, an experiment was planned to examine the effects of different seawater treatments (seawater and freshwater blend) on the three most consumable summer horticultural crops: eggplant (Solanum melongena L. CV. PP long), pepper (Capsicum annuum L. CV. NARC-4) and tomato (Solanum lycopersicum L. CV. Rio grandi). The present study explored the effects of (i) growing of eggplant, tomato and pepper using seawater and freshwater blend, and (ii) seawater in the growing media on crop productivity, green pigments, gas exchange parameters, mineral elements, quality, MDA, ASA and phenols.

2. Materials and Methods

2.1. Site Description

The study was conducted at the Department of Environmental Sciences, COMSATS University Islamabad, Vehari Campus, Vehari Punjab, Pakistan (30.0318° N, 72.3145° E) during the autumn season (2019) to study the effect of different Indian seawater concentrations on the three commonly used summer vegetables. The plant analyses were performed at the postgraduate laboratory of the department.

2.2. Plant Material, Experimental Design and Growth Conditions

The three most common commercial subtropical vegetables were selected for the present study; eggplant (Solanum melongena L. CV. PP long), pepper (Capsicum annuum L. CV. NARC-4) and tomato (Solanum lycopersicum L. CV. Rio grandi). The consumption of these crops is increased in Pakistan during the summer season. The experiment was performed in half-strength hydroponic culture as explained by Hoagland and Arnon [26]. The crop cycle length (sowing and harvesting) was managed as was routinely performed in soil cultivation. All the chemicals for hoagland solution were taken from Sigma-Aldrich, St. Louis, MO, USA distributer, Punjab, Pakistan.
The nursery of each vegetable was sown on 1 February 2019 at the experimental site of Department of Environmental Sciences, COMSATS University Islamabad, Vehari Campus, Vehari, Punjab, Pakistan and transplanted on 10 March 2019. The crop nursery for each vegetable (40-day-old seedlings) were transplanted into hydroponic culture on the same day at morning time. For acclimatization of newly transplanted plants, the plants were grown for 10 days after the transplantation in the nutrient culture without seawater treatments. If any plant was dead, then it was replaced from the extra plant stock. During the experiment, plants were grown in normal humidity (average 40%–50%), natural light intensity (280 watt/m; without artificial light) and temperature (30 °C/18 °C day/night). The experimental setup consisted of 26 plastic tubs (V. 5 L each) having 4 plants in each and total number of plants were 16 of each vegetable in each replication (total 48 plants per replication). All the hydroponic units were continuously aerated with the help of small aquarium pumps that were purchased from the local market of Burewala, Punjab, Pakistan.
The seawater applied to the experimental plants was collected from the Indian Ocean (approximately 5 Km away from Port Bin Qasim Karachi, Pakistan) 10 days before the initiation of trial, and stored in a sterile tank at ≈ 35–40 °C. Chemical characteristics of the used seawater are presented in Table 1. Na+ and K+ concentrations were measured with the help of flame photometer (Perkin Elmer; Singapore). The pH and EC were measured by using a portable pH meter (Hanna Instruments, China). NO2, NO3, phosphate and silicate were determined with a spectrophotometer (Perkin Elmer; Singapore). Four different seawater treatments were applied to the plants, i.e., CT (control; distilled water along with nutrient solution); A: (5% seawater + nutrient solution); B: (10% seawater + nutrient solution); C: (20% seawater + nutrient solution). Moreover, the pH and EC of the growing media was measured on a daily basis using the portable pH meter and maintained the pH 6.0 ± 0.05 during the entire period of the experiment. The hydroponic media was replaced after every two weeks, such that the level of nutrients was maintained during the whole duration of experiment. The physicochemical characteristics of the hydroponic media (nutrients solution+ seawater concentrations) are shown in Table 2.

2.3. Plant Growth, Biomass, Water Use Efficiency and Water Potential Analysis

Growth characteristics of each crop was measured weekly by weighing the entire pot including the plant by subtracting the pot weight and nutrient media, thus obtaining the entire plant weight (g). At the harvesting time, fresh leaf samples of each crop were collected from all four replicates per treatment, frozen into the liquid nitrogen at the greenhouse, and stored into freezer at the laboratory for further analysis i.e., pigment analysis, antioxidant activities and enzymatic studies. Subsequently, shoot fresh weight of all crop plants were taken individually by cutting the root portion from the main plant body. The entire plant was placed into a warm air oven at 70 ± 2 °C (Wise Ven, Wisd Laboratory Instruments, Korea) until constant weight was achieved, and thus the whole plant dry mass was recorded.
Crop evapotranspiration (ET) was determined by weighing the solution volume of each treatment (weekly basis). We have assumed zero water loss apart from the plant body (plant evapotranspiration) as the experiment was a closed system with a thermopore sheet from the corner of pots (pots from corner side were tightly packed with thermopore sheet). The WU was calculated by using the following equation: WUE = whole plant dry biomass yield (g)/ET (L). WP was calculated by the following equation: WP = fresh marketable biomass (g)/ET(L). The marketable yield (g/plant) was noted by weighing the fruits yield of each vegetable at harvesting.

2.4. Determination of Gas-Exchange Parameters

Plant leaf gas exchange parameters, i.e., photosynthetic rate (Pn), transpiration rate (E) and internal rate CO2 (Ci), were determined by using IRGA (infrared gas analyzer). These measurements were taken from each plant of each treatment in each crop. For this purpose, the second youngest lush green leave (upper surface of leave) was taken and was placed on the sensor for stable readings. The gas exchange parameters were taken when each vegetable completed its vegetative stage. All the readings were taken on a clear sunny day with ambient humidity and temperature.
Photosynthetic pigments, i.e., chlorophyll a (chla), chlorophyll b (chlb), carotenoid (car) contents and total free porphyrins, were measured from each treatment of all crops. Total porphyrin content was the sum of protophyrin, Mg- protophyrin and proto-chlorophyllide. The plant leaf extract (homogenized with 90% acetone (v/v)) was centrifuged for 5 min and absorbance of the extract was recorded at 663, 648 and 470 nm, while case of total porphyrins was determined at 575, 590 and 690 nm using a spectrophotometer (Perkin Elmer Lambda 25, Singapore). Total pigment concentration was determined by following the methods of Lichtenthaler [27] and Chi-Ming Yang [28] explained below:
  • Chlorophyll a (mg/g FW) = (11.75 × A663 − 2.35 × A645) × 50/500;
  • Chlorophyll b (mg/g FW) = (18.61 × A645 − 3.96 × A663) × 50/500;
  • Carotenoid (mg/g FW) = ((1000 × A470) − (2.27 × Chl a) − (81.4 × Chl b)/227) × 50/500.

2.5. Determination of Fruit Quality Parameters

Titratable acidity was measured by following the titrimetric method and was expressed in term of citric acid (%). Total sugar contents in the fruits were measured using the Luff-Schoorl method [29]. The plant protein contents were determined by measuring N concentration and protein was found by multiplying N with 6.25 factor [30]. For the analysis of vitamin C, the titration method was used [31]. Nitrate was determined by measuring the wavelength of plant extract at 410 nm using the spectrophotometer [32]. Total oxalate was measured by following the method of Baker [33].

2.6. Determination of Mineral Elements, ASA and MDA Contents

The concentrations of Na+, K+ and Ca+2 were determined by digesting the plant leaf material (0.1 g per treatment of each vegetable) in the presence of HNO3 (5 mL; 67%) and deionized water (5 mL). After mineralization of the sample, the volume of the extract was increased up to 25 mL by adding more deionized water. The concentration of Na+, K+ and Ca+2 was measured by running the extract on flame photometer (Perkin Elmer Lambda 25, Singapore). The standards were run before the start of Na+, K+ and Ca+2 determination. The concentrations of Fe, Mg+2, Zn+2 and Cu+2 were measured by following the method of Pignatelli et al. [34].
Ascorbate peroxidase activity (ASA) was calculated by using the method by Amako et al. [35]. The proline content analysis was performed from each vegetable leaf. The lipid peroxidation was recorded in term of malondialdehyde (MDA) contents, and readings were taken at 532 and 600 nm. The MDA concentrations were calculated by following the equation developed by Heath and Packer [36]:
MDA (µmol g−1 FW) = ((A532–A600)/155,000) × 106.

2.7. Statistical Analysis

Four replicates of each treatment were used for all vegetables. The completely randomized design (CRD) was used to design the experiment. The means and standard errors (shown in graphs) were calculated using Excel (Microsoft Office 2007). Analysis of variance was performed using Minitab’s ANOVA and General Linear Model GLM (version 15). The graphs are constructed by using the Origin Pro software (V. 2017).

3. Results

3.1. Plant Growth, Biomass, Water Use Efficiency (WUE) and Water Potential (WP) Analysis

Well plant growth is responsible for the fresh and marketable yield of any crop. Data presented in the Figure 1 (Figure 1A,B) showed that the 5% seawater treatments did not significantly affect the growth of eggplant and pepper from week 1 to crop harvest (p < 0.05) as compared to control plants. Furthermore, in the case of eggplant, 10% SFW treatments reduced the crop growth by 181%; conversely, the 10% seawater treatments did not statistically affect the growth of pepper plant, but the growth decreased by 146% of pepper plants at 20% SFW treatments. In tomato plant, poor crop growth was seen in all three SFW treatments (SFW; 5, 10 and 20 %).
Pepper plant biomass showed the least significant difference among the three seawater applied treatments at the start and also at the end of the entire crop cycle (Figure 1A). In addition, no statistical difference was noted between the CT and other three seawater treatments, i.e., 5%, 10% and 20% SFW (Table 3). Similarly, A treatments (5% SFW) did not affect the growth and biomass of the eggplant, while B treatments (10% SFW) significantly reduced the growth and biomass in week 2 and week 4 as compared to control, and it was not significantly different from C treatments (20% SFW) at the time of harvesting (Figure 1A). The tomato growth and biomass were significantly affected by all three seawater treatments, i.e., 5%, 10% and 20% SWF (Figure 1A, Table 3).

3.2. Gas Exchange Parameters

Photosynthetic rate (Pn) of all three vegetables was significantly decreased after one week of B (10% SFW) and C seawater treatments (20% SFW), but the more prominent effect was assessed in the tomato crop (Figure 2). In addition, a significant difference in Pn between control and treated plants was recorded after one week in pepper and tomato plants but was not found significant in eggplant. However, the transpiration rate was also affected by 20% seawater treatments (C treatments) after one week of application of treatments (Figure 3). More significant variation in the internal CO2 level (Ci) was found at B (10% SFW) and C (20% SFW) treatments in tomato plants but a nonsignificant difference was found in B and C treatments of pepper plants (Figure 4). Overall, the eggplant was observed to be more stable toward the Pn, gas exchange and Ci at B (10% SFW) and C (20% SFW) treatments than other two vegetables. Overall, according to the pigment concentration (chl-a, chl-b, car), nominal difference was seen in the leaves of pepper plants at B and C treatments while non-significant difference was recorded in eggplant at harvesting time. Results in Table 4 showed that the significant difference was noted in pigment concentration at B (10% SFW) and C (20% SFW) treatments in tomato plants while nonsignificant difference was noted in eggplant and pepper plants at the same SFW concentrations.

3.3. Fruit Yield and Fruit Quality Parameters

The quality parameters are important for the consumer family. In the case of eggplant, maximum fruit yield was recorded in the CT treatments, which is statistically similar with those of A (5% SFW) treatments (Table 5). Statistically, minimum fruit yield was noted in the maximum seawater treatments (20% SFW). In eggplant, fruit yield respectively decreased 29% and 48% in B (10% SFW) and C (20% SFW) treatments while in pepper plants, it respectively decreased 20% and 31% in B (10% SFW) and C (20% SFW) treatments. The tomato plants showed a significant reduction in fruit yield in all three (A (by 20%), B (by 47%), C (by 70%)) SFW treatments compared to control. Total sugar content, protein content and total oxalate were decreased with an increase in seawater concentration, while certain quality parameters, i.e., titratable acidity and protein content, were not statistically affected by different seawater treatments (Table 5).
In tomato plants, fruit yield and other quality attributes were significantly affected by all three seawater treatments. Maximum fruit yield, protein contents and NO3-N were recorded in the CT treatments while the minimum was noted in the C (20% SFW) treatments, whereas the protein content did not affect A (5% SFW) and B (5% SFW) treatments. Moreover, a higher concentration of total oxalate and titratable acidity was observed in the C treatment (20% SFW), whereas vitamin C was not as affected with the increase of seawater concentration (Table 6).
In pepper plants, the increased seawater concentration (B (10% SFW) and C (20% SFW) treatments) lead to a reduction in fruit yield, total sugar, vitamin-C and NO3-N and instead, which caused an increase in the concentration of titratable acidity and total oxalate (Table 7). The total protein contents increased in response to C treatments (20% SFW).

3.4. Mineral Elements, ASA and MDA Contents

The data presented in Table 8, Table 9 and Table 10 show the mineral concentration in three studied vegetables at harvesting. In the leaves of eggplant, different seawater treatments increased the mineral concentrations of Na+, Cl−1, K+, F3+ and Mg2+ but did not significantly affect the concentrations of Ca2+, Cu and Zn2+ (Table 8). In tomato plants, the accumulation of minerals, i.e., Na+, Cl−1, K+, Cu and Mg2+, increased in the seawater-treated plant but did not affect the concentration of other minerals, i.e., Ca2+, Zn2+ and Fe+3 (Table 9). Similarly, in pepper plants, less variation in the mineral concentration was observed in the treated plants (5, 10, 20% SFW), and certain parameters were not affected significantly (Table 10).
In eggplant, MDA, PC and ASA were increased with an increase of seawater concentration and the highest was noted at 20% of seawater treatment, but the nonsignificant difference was noted between the control and A (5% SFW) treatments (Table 11). Furthermore, statistically, MDA was not affected by all three seawater treatments. Maximum changes in the values of MDA, PC and ASA were recorded in tomato plants with significantly maximum values in C (20% SFW) treatments and minimum values in CT treatments. In addition, the effect on the pepper plant with respect to MDA, PC and ASA was in between the other two vegetables.

4. Discussion

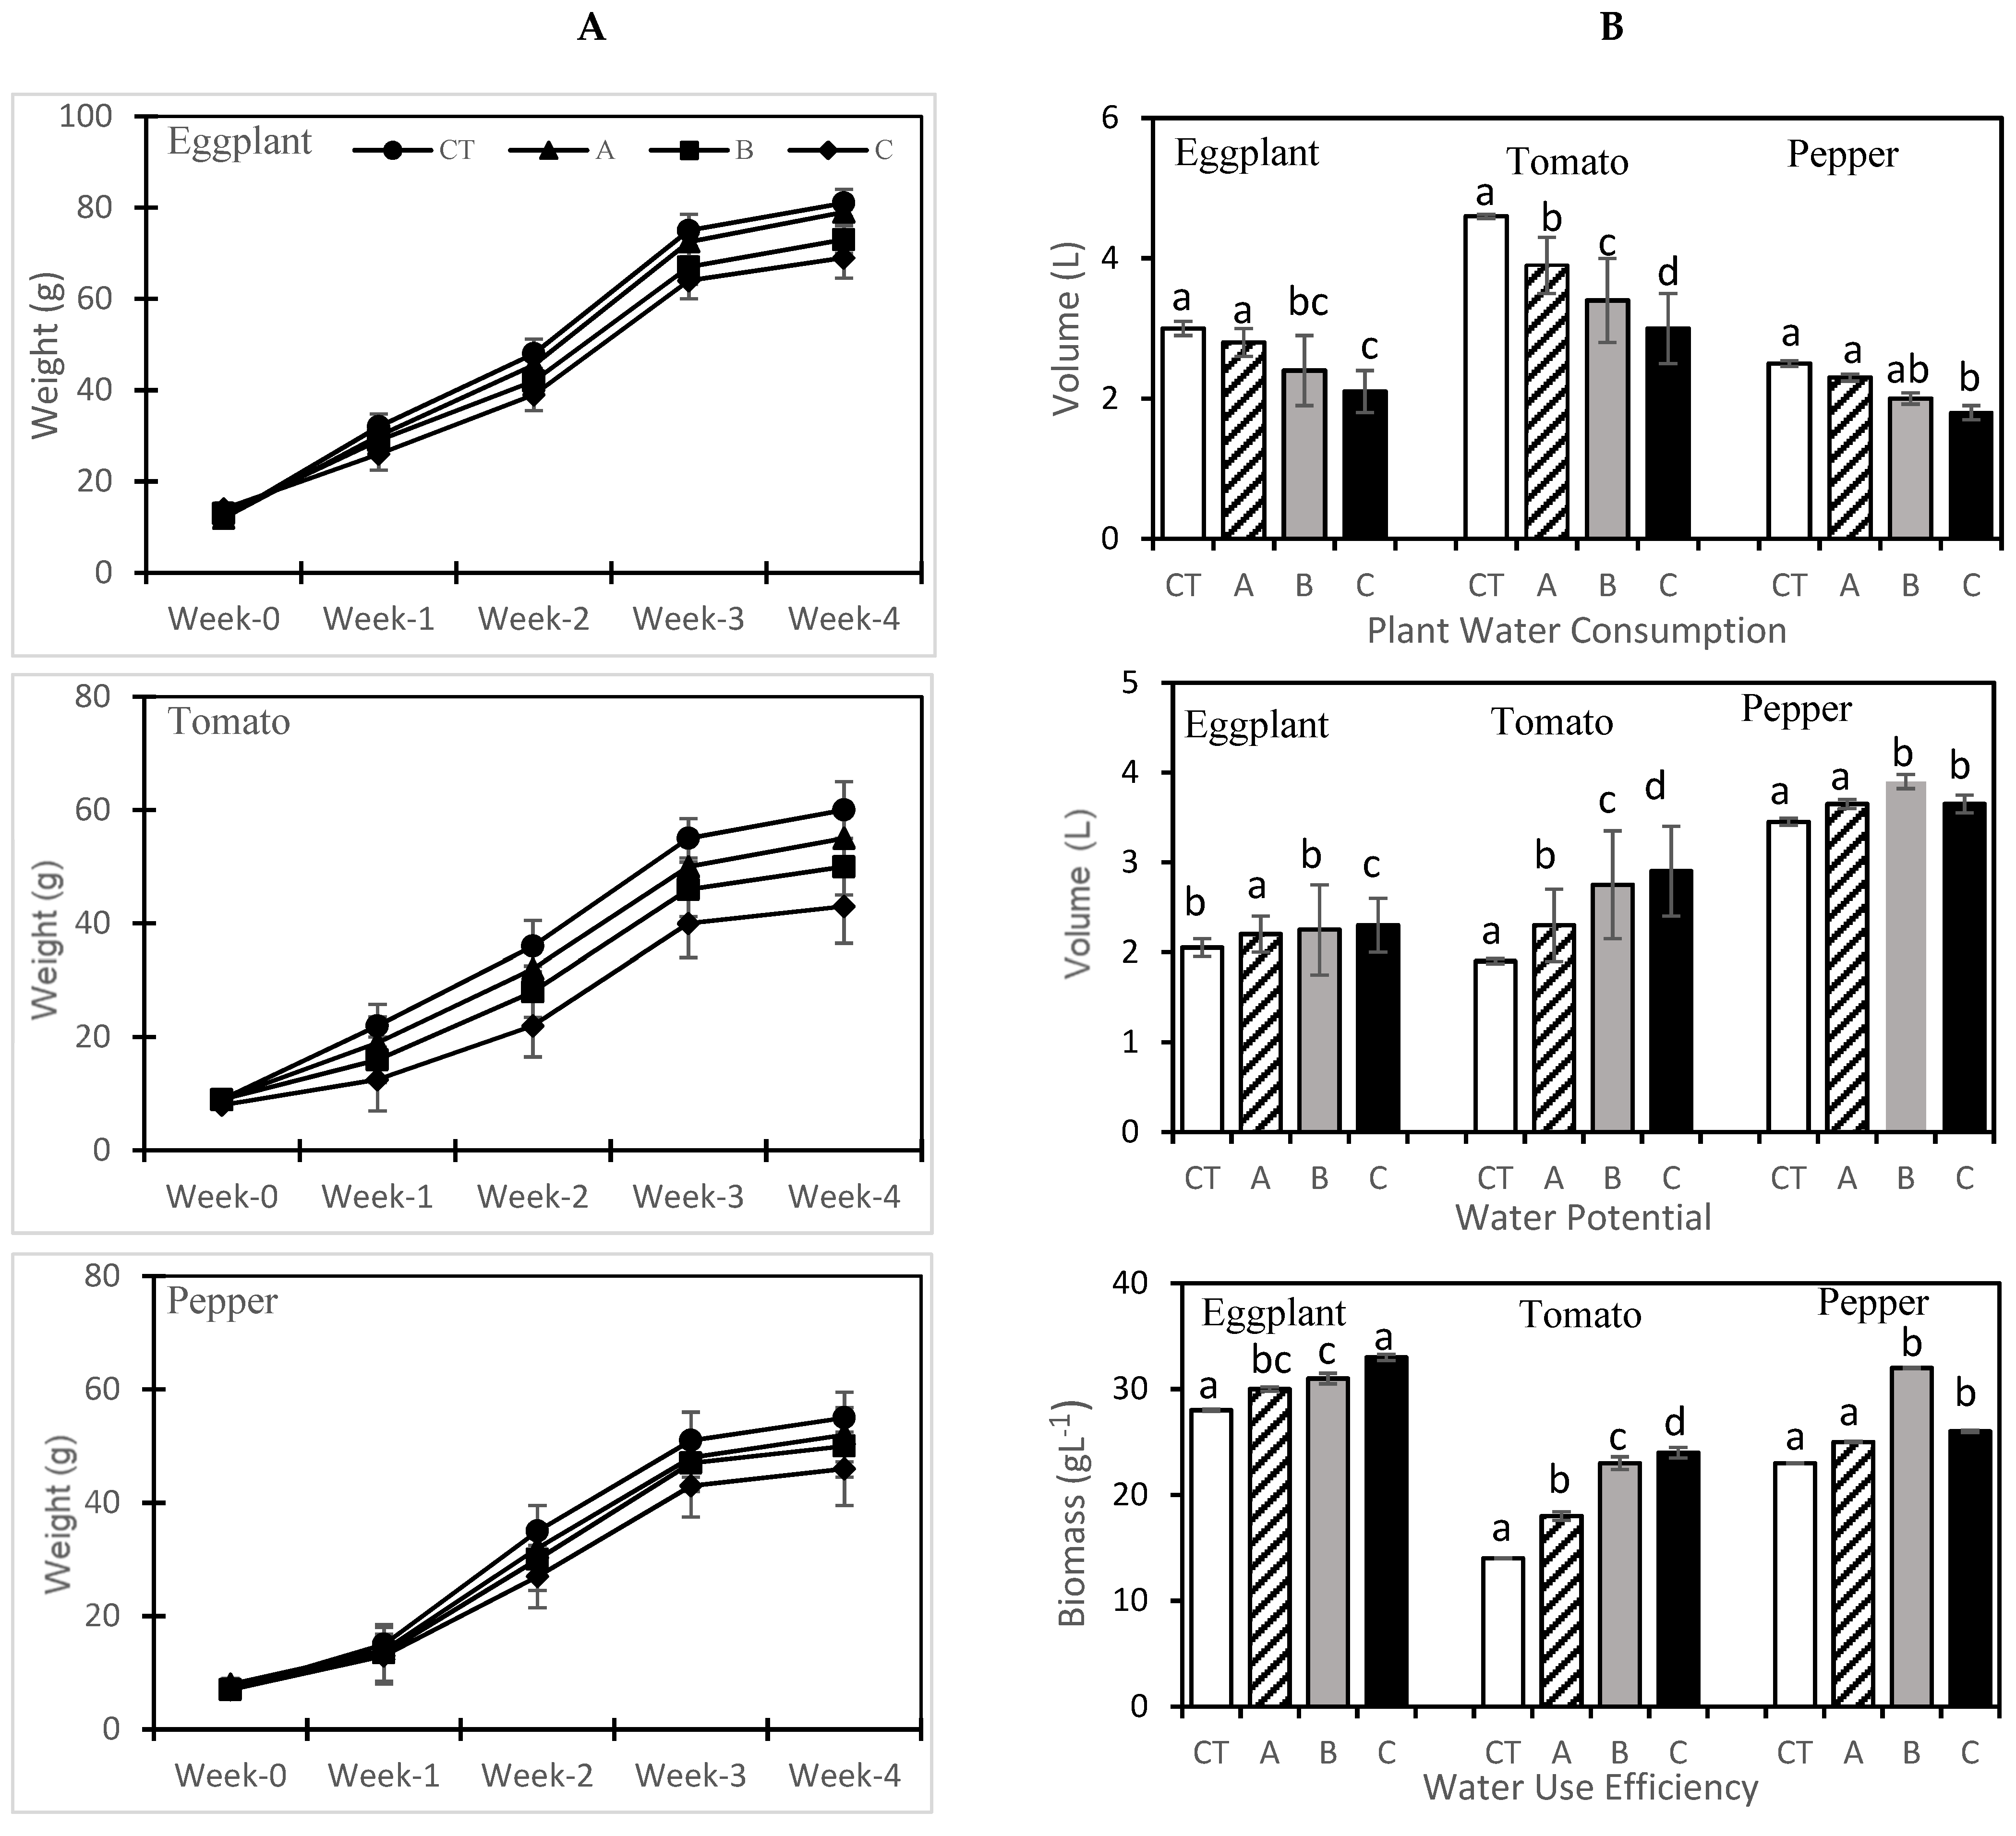
The present research findings indicate that all three vegetables reduced their biomass yield at C (20% SFW) treatment but showed a nonsignificant difference at control and A (5% SFW) treatments when measured at the time of harvesting. These results are in agreement with those of Atzori, Guidi Nissim, Caparrotta, Masi, Azzarello, Pandolfi, Vignolini, Gonnelli and Mancuso [3] and Mahjoor et al. [37], who all recorded similar results with no statistical difference between CT and low seawater and freshwater blend treatments. The excessive concentration of sodium chloride in seawater may be the reason for stress on vegetables. During the study, it was seen that the plants, i.e., eggplant and pepper, managed its growth in the presence of higher seawater concentrations by reducing the freshwater consumption compared to control, while the tomato plants were severely disturbed by higher seawater treatment (C (20% SFW) treatment). The stressed plants were unable to absorb and translocate the water properly. Despite this, WUE and WP were increased in all three vegetables (Figure 2). A review of the literature [38,39,40] presented that at higher salt concentrations, WUE is decreased. In contrast to earlier studies, our results showed the increase of both WUE and WP in stress conditions with a significant decrease of water consumption for all three vegetables. It is observed in the literature that sensitive crops decreased water uptake to avoid further salt stress, while the tolerant crops used the water at the constant rate, including at higher levels of salinity [2,3]. That was also noted in the case of our study results.
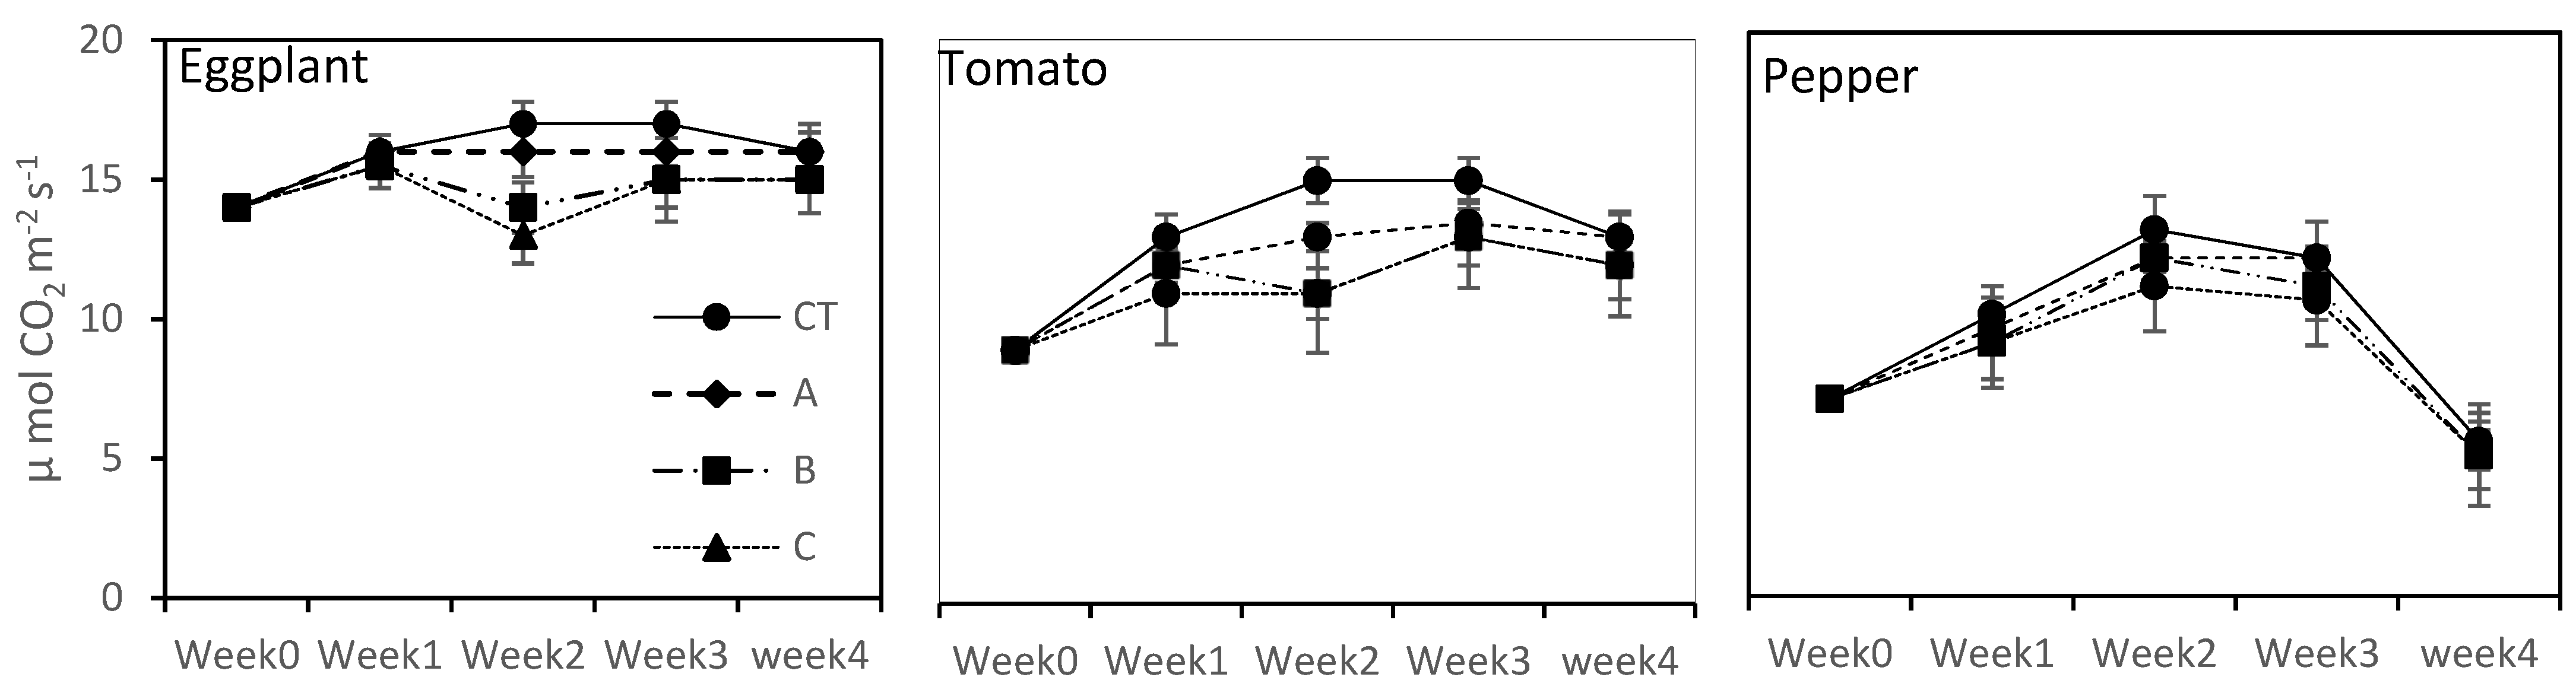
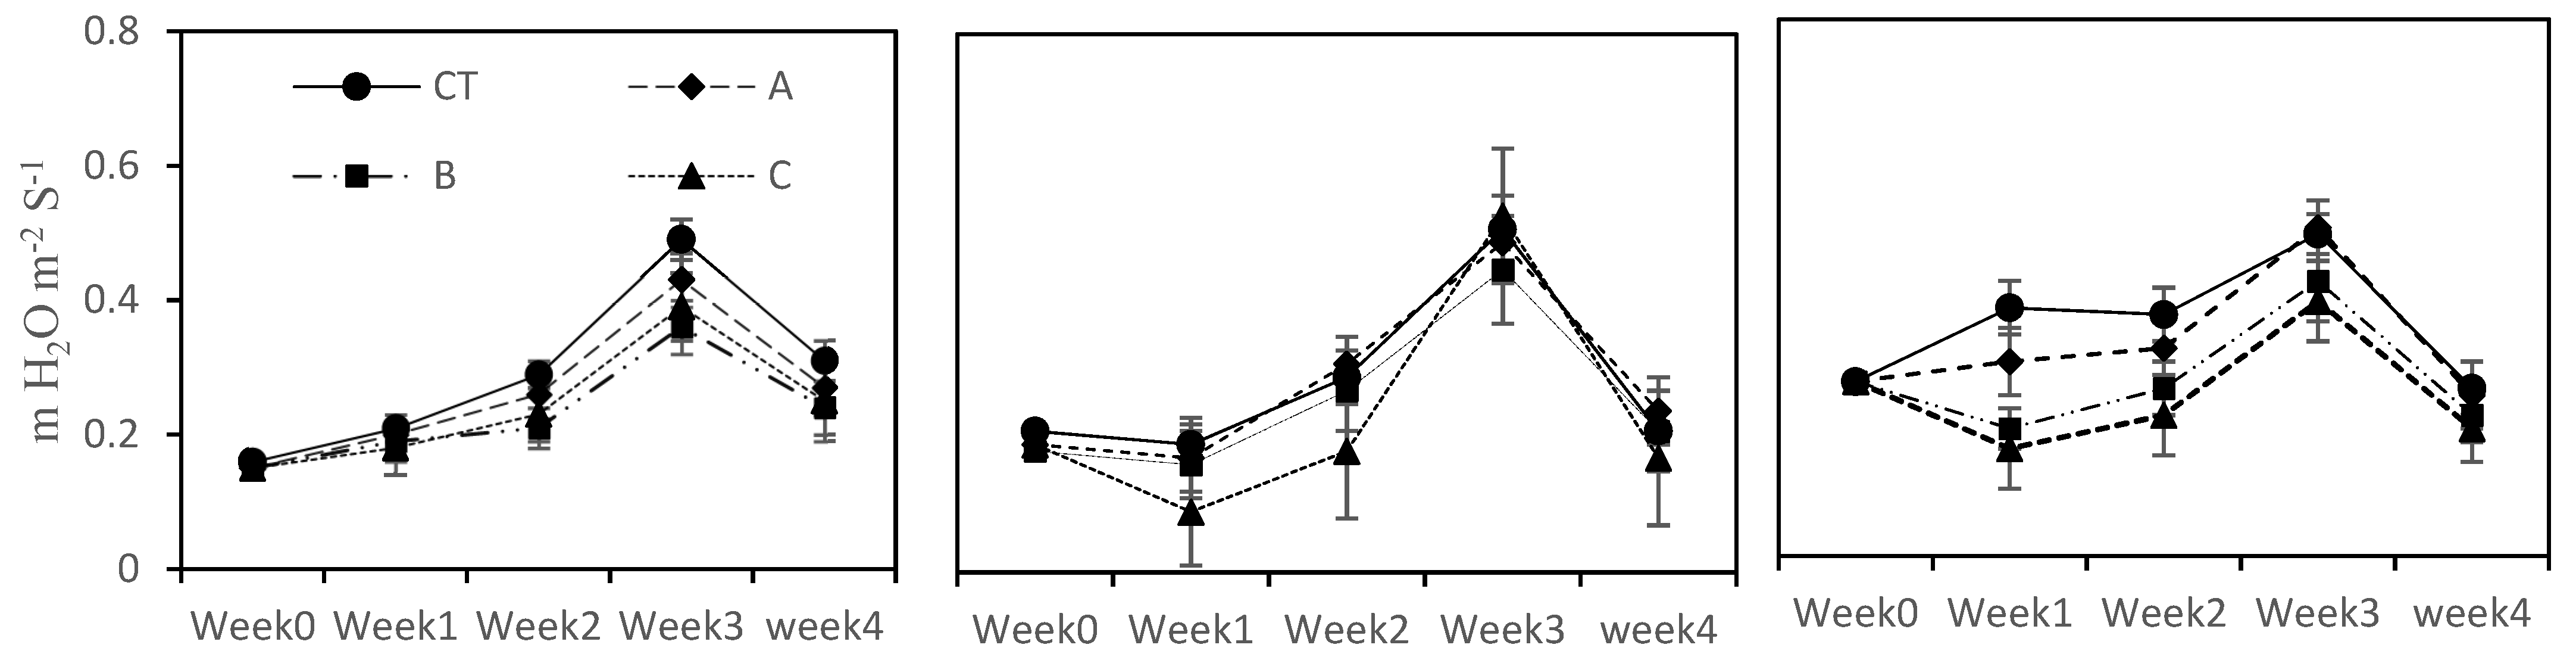
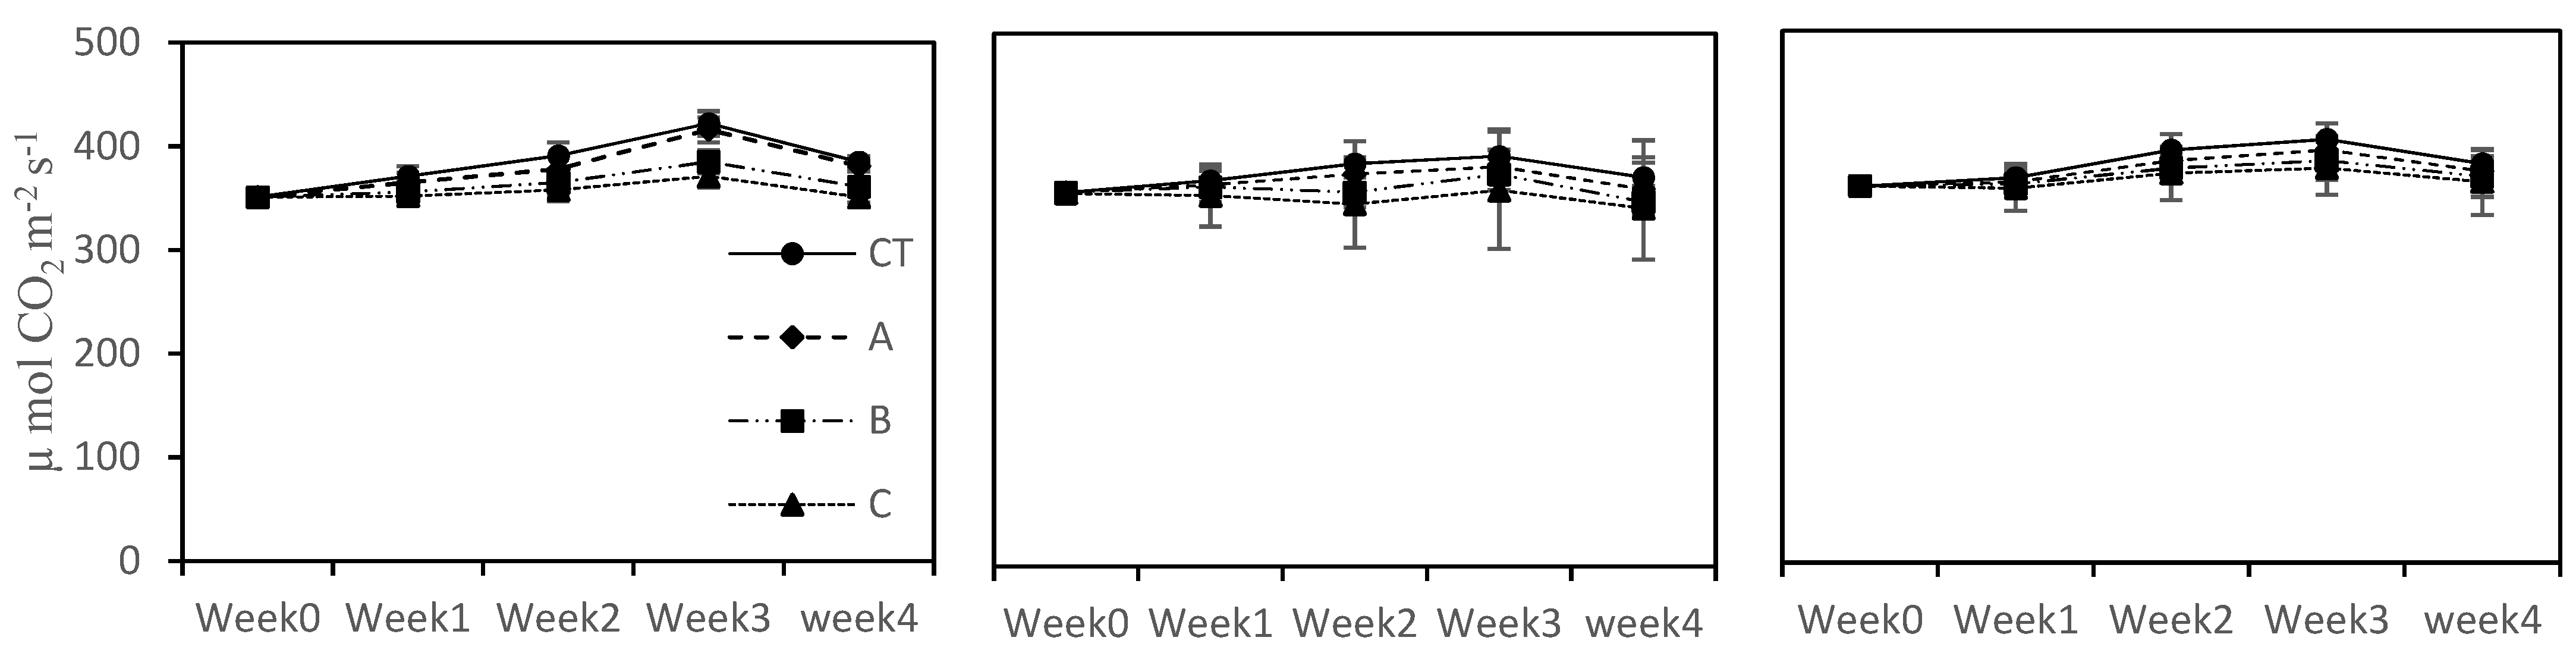
The photosynthetic rate (Pn) was not negatively affected in the long term by higher concentrations of seawater in the cases of eggplant and pepper, showing a somewhat photosynthetic machinery adaptation at 15% and 20% seawater treatments as compared to tomato plants. Although all the vegetables showed poor growth under a saline environment as compared to CT, this factor could not restrict the plant leaf gas exchange and stomatal activities. These results are in line with those of Wilson et al. [41], who noted that restricted plant growth did not hinder plant photosynthesis activities under different salinity conditions. Similarly, at higher salinity levels (C (20% SFW) treatment), the leaf pigment concentrations were not affected as compared to CT and at lower seawater concentrations (A; 5% SFW) and B; 10% SFW treatments). Our results are harmonious with those noted by Santos [42]. The results of the current study suggest that at the three examined seawater blends, negligible reduction in the leaf pigments concentration was noted, which are not strong enough to decrease or stop the photosynthesis apparatus. Our findings are realized and concur to imply that the tested seawater concentrations can be used as growth media to grow these three tested crops.
The data showed that at an increasing order of seawater concentrations reduced the fruit quantity and quality of tomato, eggplant and pepper. The fruit yield of CT was comparable to a treatment (5% SFW) in the cases of eggplant and pepper, but fruit yield was decreased at 5% SFW treatments in the case of tomato, which showed sensitivity toward the increasing salinity environment. The results are consistent with those of Rameshwaran, Tepe, Yazar and Ragab [19] and Shahbaz, et al. [43]. This may be attributable to less water consumption under saline conditions and consequently less water and nutrient movement toward the fruit portion. The low concentration of SFW did not decrease the growth and biomass of the plants. In addition, the mineral contents present in the seawater may trigger the growth of plants [1]. Our study results showed a strong relationship between plant water consumption and plant yield. This indicates that eggplant and pepper can easily adjust their metabolism between growth and salt stress to such an extent where their growth may not hamper [3].
Titratable acidity (TA) was not influenced significantly in response to increasing seawater concentrations in eggplant but saw a significant change in tomato and pepper plants. These results are supported by Fernández-Garcí, et al. [44], who recorded that treatments with the saline environment did not change TA in the fruits. This may be due to better acclimatization of eggplant in saline conditions with the passage of time. The increase in TA concentration resulted in considerable changes in fruit flavor [45]. The reaction of all three vegetables toward total sugar, vitamin-C and NO3-N was observed to be significant to increasing seawater, and their concentration was decreased at higher seawater concentrations (C (20% SFW) treatment). Generally, sugar contents are increased with the increase of salinity, but in our study, it decreased at higher levels of salinity (Table 5). The possible reason for low sugar content may be due to less formation of hydrocarbon-synthesizing enzymes, which is responsible for the formation of sugar contents in plants. Similar results were noted by Navarro, et al. [46] and stated that it could be due to an increase of ionic strength in the growing media, resulting a in the cost of higher fruit respiration [47]. Vitamin C, or ascorbic acid, has the ability to lower salt stress in plants [48,49].
The depressing effect of increased seawater treatments was seen in the form of lower NO3- concentration in the tissues of all three vegetables, but a more promising effect was recorded at 20% SFW [50]. The statistically nondifference was noted between CT and A (5% SFW) treatments. The lower nitrate level in the plant tissues indicated that nutrient-induced salinity may create a hurdle toward intake, absorption and translocation in the plant body and it may be related to less water uptake by plants [51]. Total oxalate is a major component of plant fruit palatability, and its higher concentrations may produce a bitter taste. Data presented in Table 5, Table 6 and Table 7 indicate that at higher seawater concentrations (20% SFW), the oxalate level was increased in the fruits of all three vegetables [52,53]. Furthermore, no significant difference was seen among CT, A (5% SFW) and B (10% SFW) in the eggplant and pepper fruits, but significant variation was found between CT/A and B treatments in the fruits of the tomato plants. These results are consistent with those of Turhan, et al. [14], who observed that total oxalate increased in the plants at higher seawater levels but did not significantly change at lower levels of seawater (2.5% and 5% seawater and freshwater blend). However, Carvalho, et al. [54] noted the opposite results in purslane and stated that a sharp decrease in total oxalate concentration was observed over an increase in a saline environment in the purslane plants. Further, the transcriptional regulatory mechanism and modern biotechnological behind the overall improvement of physiological and nutritional attributes is also important in sustainability perspectives [55,56,57].
Phenolic contents (PC) in all three vegetables indicated the positive correlation between salinity stress levels and sensitivity of plants. The superior level of PC in the case of our experiment may be due to osmotic and ionic stress on the plant metabolic system [4]. In certain plants, such a stress increases or decreases the cell supporting the secondary metabolites, i.e., polyphenols [5]. This results in disintegration of cell components or cytosol or serious damage to the cell membrane [6]. Thus, the low and middle level of SFW did not considerably change in the concentrations of PC, MDA and ASA in eggplant and pepper plants as compared to tomato plants, therefore showing their possible cultivation at the tested low SFW concentrations. Additionally, the appropriate water and soil amendments such as leaching, organic matters, gypsum and lime may reduce the accumulation of salts and hereafter reduce the damaging impact of seawater on the crops.

5. Conclusions

In conclusion, our results exhibit that the more consistent adaptation was seen in the cases of eggplant, then pepper plants, and lastly, tomato plants. Therefore, our study results indicate that certain concentrations of seawater–freshwater blends showed no significant effects on the quality, mineral elements concentration and productivity of eggplants and pepper, although tomato plants presented more sensitivity at the two seawater concentrations (10 and 20% SFW). Additionally, low concentrations of salinity stress (5% and 10% SFW) seemed to be helpful to attain healthier crop nutrition and organoleptic values. The pigment connotations and the leaf gas exchange system seemed to not be influenced by all three seawater treatments. Supplementary examinations are required on the plant physiological and genetic mechanisms at moderate salinity tolerance and Na+ toxicity. Accordingly, our findings will be valuable for the plant breeders in developing such vegetable cultivars that can tolerate lower seawater concentrations. Additionally, the study results will also help the coastline farmers in growing and supplying good nutritive vegetables for their consumption.

Author Contributions

Conceptualization, H.M.R.J. and X.W.; methodology, H.M.R.J.; software, M.A.; validation, T.J., R.S. and F.B.; formal analysis, F.N.; investigation, H.M.R.J.; resources, X.W. and H.M.R.J.; data curation, S.A.; writing—original draft preparation, H.M.R.J.; writing—review and editing, T.J., R.S., M.A., F.N., R.Q., A.u.R., M.S., M.M., F.B., S.A., I.A.I. and X.W.; visualization, T.J.; supervision, H.M.R.J.; project administration, H.M.R.J.; funding acquisition, I.A.I. and X.W. All authors have read and agreed to the published version of the manuscript.

Funding

The research activities are financially supported by the CRGP project (ISB/15/740), funded by the ORIC, COMSATS University Islamabad, Pakistan. The Taif University Researchers Supporting Project number (TURSP-2020/120), Taif University, Taif, Saudi Arabia, funded current work.

Institutional Review Board Statement

Not applicable.

Informed Consent Statement

Not applicable.

Data Availability Statement

Not applicable.

Acknowledgments

The authors extend their appreciation to Taif University for funding current work by Taif University Researchers supporting project number (TURSP-2020/120), Taif University, Taif, Saudi Arabia and COMSATS University Islamabad, Pakistan. The authors thank Ayman ELSABAGH, for his constructive criticism and efforts for the manuscript.

Conflicts of Interest

The authors declare no conflict of interest.

References

  1. Gleick, P.H. The World’s Water 2002–2003: The Biennial Report on Freshwater Resources; Island Press: Washington, DC, USA, 2002. [Google Scholar]
  2. Postel, S. Pillar of Sand: Can the Irrigation Miracle Last? World Watch: Washington, DC, USA, 1999. [Google Scholar]
  3. Atzori, G.; Guidi Nissim, W.; Caparrotta, S.; Masi, E.; Azzarello, E.; Pandolfi, C.; Vignolini, P.; Gonnelli, C.; Mancuso, S. Potential and constraints of different seawater and freshwater blends as growing media for three vegetable crops. Agric. Water Manag. 2016, 176, 255–262. [Google Scholar] [CrossRef]
  4. FAO. The State of the World’s Land and Water Resources for Food and Agriculture (SOLAW)—Managing Systems at Risk; The Food and Agriculture Organization of the United Nations, Rome and Earthscan: London, UK, 2011. [Google Scholar]
  5. FAO. World Agriculture: Towards 2015/2030. Summary Report, 2002, Produced by the Economic and Scocial Development Department; FAO: Rome, Italy, 2002. [Google Scholar]
  6. Magán, J.J.; Gallardo, M.; Thompson, R.B.; Lorenzo, P. Effects of salinity on fruit yield and quality of tomato grown in soil-less culture in greenhouses in Mediterranean climatic conditions. Agric. Water Manag. 2008, 95, 1041–1055. [Google Scholar] [CrossRef]
  7. Magán, J.; Casas, E.; Gallardo, M.; Thompson, R.; Lorenzo, P. Uptake concentrations of a tomato crop in different salinity conditions. In Proceedings of the International Symposium on Soilless Culture and Hydroponics 697, Leuven, Belgium, 14 November 2004; pp. 365–369. [Google Scholar]
  8. White, P.J.; Broadley, M.R. Biofortification of crops with seven mineral elements often lacking in human diets–iron, zinc, copper, calcium, magnesium, selenium and iodine. New Phytol. 2009, 182, 49–84. [Google Scholar] [CrossRef] [PubMed]
  9. Welch, R.M.; Graham, R.D. Breeding for micronutrients in staple food crops from a human nutrition perspective. J. Exp. Bot. 2004, 55, 353–364. [Google Scholar] [CrossRef] [Green Version]
  10. Frossard, E.; Bucher, M.; Mächler, F.; Mozafar, A.; Hurrell, R. Potential for increasing the content and bioavailability of Fe, Zn and Ca in plants for human nutrition. J. Sci. Food Agric. 2000, 80, 861–879. [Google Scholar] [CrossRef]
  11. Szeto, Y.; Kwok, T.C.; Benzie, I.F. Effects of a long-term vegetarian diet on biomarkers of antioxidant status and cardiovascular disease risk. Nutrition 2004, 20, 863–866. [Google Scholar] [CrossRef]
  12. Gardiner, D. Crop production in saline environments: Global and integrative perspectives. HortScience 2003, 38, 1457. [Google Scholar] [CrossRef]
  13. Singhal, R.K.; Saha, D.; Skalicky, M.; Mishra, U.N.; Chauhan, J.; Behera, L.P.; Lenka, D.; Chand, S.; Kumar, V.; Dey, P.; et al. Crucial cell signaling compounds cross-talk and integrative multi-omics techniques for salinity stress tolerance in plants. Front. Plant Sci. 2021, 12, 1227. [Google Scholar] [CrossRef]
  14. Javeed, H.M.R.; Ali, M.; Skalicky, M.; Nawaz, F.; Qamar, R.; Rehman, A.u.; Faheem, M.; Mubeen, M.; Iqbal, M.M.; Rahman, M.H.u.; et al. Lipoic Acid Combined with Melatonin Mitigates Oxidative Stress and Promotes Root Formation and Growth in Salt-Stressed Canola Seedlings (Brassica napus L.). Molecules 2021, 26, 3147. [Google Scholar] [CrossRef]
  15. Koyro, H.-W.; Khan, M.A.; Lieth, H. Halophytic crops: A resource for the future to reduce the water crisis? Emir. J. Food Agric. 2011, 23, 1. [Google Scholar] [CrossRef] [Green Version]
  16. Yermiyahu, U.; Tal, A.; Ben-Gal, A.; Bar-Tal, A.; Tarchitzky, J.; Lahav, O. Rethinking Desalinated Water Quality and Agriculture. Science 2007, 318, 920–921. [Google Scholar] [CrossRef]
  17. Eyster, C. Seawater as a source of plant nutrients. Nature 1968, 220, 260. [Google Scholar] [CrossRef]
  18. Sgherri, C.; Kadlecová, Z.; Pardossi, A.; Navari-Izzo, F.; Izzo, R. Irrigation with diluted seawater improves the nutritional value of cherry tomatoes. J. Agric. Food Chem. 2008, 56, 3391–3397. [Google Scholar] [CrossRef] [PubMed]
  19. Rameshwaran, P.; Tepe, A.; Yazar, A.; Ragab, R. Effects of drip-irrigation regimes with saline water on pepper productivity and soil salinity under greenhouse conditions. Sci. Hortic. 2016, 199, 114–123. [Google Scholar] [CrossRef] [Green Version]
  20. Sakamoto, K.; Kogi, M.; Yanagisawa, T. Effects of salinity and nutrients in seawater on hydroponic culture of red leaf lettuce. Environ. Control Biol. 2014, 52, 189–195. [Google Scholar] [CrossRef] [Green Version]
  21. López-Berenguer, C.; Martínez-Ballesta, M.a.d.C.; Moreno, D.A.; Carvajal, M.; García-Viguera, C. Growing hardier crops for better health: Salinity tolerance and the nutritional value of broccoli. J. Agric. Food Chem. 2009, 57, 572–578. [Google Scholar] [CrossRef]
  22. Akamatsu, T. Onions grown with seawater-what is best seasoning with salt for growing onions? Cur. Agric. 2007, 8, 11–17. [Google Scholar]
  23. Kitano, M.; Hidaka, K.; Zushi, K.; Araki, T. Production of value-added vegetables by applying environmental stresses to roots in soil-less culture. J. Sci. High Technol. Agric. 2008, 20, 210–218. [Google Scholar] [CrossRef] [Green Version]
  24. Pascale, S.D.; Maggio, A.; Fogliano, V.; Ambrosino, P.; Ritieni, A. Irrigation with saline water improves carotenoids content and antioxidant activity of tomato. J. Hortic. Sci. Biotechnol. 2001, 76, 447–453. [Google Scholar] [CrossRef]
  25. Shannon, M.; Grieve, C. Tolerance of vegetable crops to salinity. Sci. Hortic. 1998, 78, 5–38. [Google Scholar] [CrossRef]
  26. Hoagland, D.R.; Arnon, D.I. The water-culture method for growing plants without soil. In Circular. California Agricultural Experiment Station; CABI: Wallingford, UK, 1950; pp. 1–32. [Google Scholar]
  27. Lichtenthaler, H.K. [34] Chlorophylls and carotenoids: Pigments of photosynthetic biomembranes. Methods Enzymol. 1987, 148, 350–382. [Google Scholar]
  28. Yang, C.M.; Chang, K.W.; Yin, M.H.; Huang, H.M. Methods for the Determination of the Chlorophylls and their Derivatives. Taiwania 1998, 43, 116–122. [Google Scholar]
  29. Gormley, T.R.; Maher, M. Tomato fruit quality-an interdisciplinary approach. Prof. Hortic. 1990, 4, 107–112. [Google Scholar]
  30. AOAC. Official Methods of Analyses. Association of Official Analytical Chemists, 15th ed.; AOAC: Washington, DC, USA, 1990. [Google Scholar]
  31. AOAC. Official Methods of Analysis; AOAC: Washington, DC, USA, 1980. [Google Scholar]
  32. Fresenius, W.; Quentin, K.E.; Schneider, W. Water Fnalysis. A Practical Guide to Physico-Chemical, Chemical and Microbiological Water Examination and Quality Assurance; Springer: Berlin/Heidelberg, Germany, 1988. [Google Scholar]
  33. Baker, C. The determination of oxalates in fresh plant material. Analyst 1952, 77, 340–344. [Google Scholar] [CrossRef]
  34. Pignatelli, I.E.M.; Mosser-Ruck, R.; Barres, O.; Kolb, U.; Michau, N. A multi-technique, micrometer- to atomic-scale description of a synthetic analogue of chukanovite, Fe2(CO3)(OH)2. Eur. J. Mineral. 2014, 26, 221–229. [Google Scholar] [CrossRef]
  35. Amako, K.; Chen, G.-X.; Asada, K. Separate assays specific for ascorbate peroxidase and guaiacol peroxidase and for the chloroplastic and cytosolic isozymes of ascorbate peroxidase in plants. Plant Cell Physiol. 1994, 35, 497–504. [Google Scholar]
  36. Heath, R.L.; Packer, L. Photoperoxidation in isolated chloroplasts: I. Kinetics and stoichiometry of fatty acid peroxidation. Arch. Biochem. Biophys. 1968, 125, 189–198. [Google Scholar] [CrossRef]
  37. Mahjoor, F.; Ghaemi, A.A.; Golabi, M.H. Interaction effects of water salinity and hydroponic growth medium on eggplant yield, water-use efficiency, and evapotranspiration. Int. Soil Water Conserv. Res. 2016, 4, 99–107. [Google Scholar] [CrossRef] [Green Version]
  38. Katerji, N.; Van Hoorn, J.; Hamdy, A.; Mastrorilli, M. Salinity effect on crop development and yield, analysis of salt tolerance according to several classification methods. Agric. Water Manag. 2003, 62, 37–66. [Google Scholar] [CrossRef]
  39. Katerji, N.; Van Hoorn, J.; Hamdy, A.; Mastrorilli, M. Comparison of corn yield response to plant water stress caused by salinity and by drought. Agric. Water Manag. 2004, 65, 95–101. [Google Scholar] [CrossRef]
  40. Khataar, M.; Mohhamadi, M.H.; Shabani, F. Soil salinity and matric potential interaction on water use, water use efficiency and yield response factor of bean and wheat. Sci. Rep. 2018, 8, 2679. [Google Scholar] [CrossRef]
  41. Wilson, C.; Liu, X.; Lesch, S.M.; Suarez, D.L. Growth response of major USA cowpea cultivars: II. Effect of salinity on leaf gas exchange. Plant Sci. 2006, 170, 1095–1101. [Google Scholar] [CrossRef]
  42. Santos, C.V. Regulation of chlorophyll biosynthesis and degradation by salt stress in sunflower leaves. Sci. Hortic. 2004, 103, 93–99. [Google Scholar] [CrossRef]
  43. Shahbaz, M.; Mushtaq, Z.; Andaz, F.; Masood, A. Does proline application ameliorate adverse effects of salt stress on growth, ions and photosynthetic ability of eggplant (Solanum melongena L.)? Sci. Hortic. 2013, 164, 507–511. [Google Scholar] [CrossRef]
  44. Fernández-Garcí, N.; Martínez, V.; Cerdá, A.; Carvajal, M. Fruit quality of grafted tomato plants grown under saline conditions. J. Hortic. Sci. Biotechnol. 2004, 79, 995–1001. [Google Scholar] [CrossRef]
  45. Stevens, M.; Rick, C.; Atherton, J.; Rudich, J. The Tomato Crop. A Scientific Basis for Improvement; Springer Science & Business Media: Berlin/Heidelberg, Germany, 1986. [Google Scholar]
  46. Navarro, J.M.; Garrido, C.; Carvajal, M.; Martinez, V. Yield and fruit quality of pepper plants under sulphate and chloride salinity. J. Hortic. Sci. Biotechnol. 2002, 77, 52–57. [Google Scholar] [CrossRef]
  47. Navarro, J.M.; Flores, P.; Garrido, C.; Martinez, V. Changes in the contents of antioxidant compounds in pepper fruits at different ripening stages, as affected by salinity. Food Chem. 2006, 96, 66–73. [Google Scholar] [CrossRef]
  48. Khan, H.; Pervez, M.; Ayub, C.; Ziaf, K.; Balal, R.; Shahid, M.; Akhtar, N. Hormonal priming alleviates salt stress in hot pepper (Capsicum annuum L.). Soil Environ. 2009, 28, 130–135. [Google Scholar]
  49. Qiu, R.; Jing, Y.; Liu, C.; Yang, Z.; Wang, Z. Response of Hot Pepper Yield, Fruit Quality, and Fruit Ion Content to Irrigation Water Salinity and Leaching Fractions. HortScience 2017, 52, 979–985. [Google Scholar] [CrossRef] [Green Version]
  50. Grattan, S.; Grieve, C. Salinity–mineral nutrient relations in horticultural crops. Sci. Hortic. 1998, 78, 127–157. [Google Scholar] [CrossRef]
  51. Lea-Cox, J.D.; Syvertsen, J.P. Salinity Reduces Water Use and Nitrate-N-use Efficiency of Citrus. Ann. Bot. 1993, 72, 47–54. [Google Scholar] [CrossRef]
  52. Masters, D.; Norman, H.; Barrett-Lennard, E. Agricultural systems for saline soil: The potential role of livestock. Asian-Australas. J. Anim. Sci. 2005, 18, 296–300. [Google Scholar]
  53. Turhan, A.; Kuscu, H.; Ozmen, N.; Sitki, S.M.; Osman, D.A. Effect of different concentrations of diluted seawater on yield and quality of lettuce. Chil. J. Agric. Res. 2014, 74, 111–116. [Google Scholar] [CrossRef] [Green Version]
  54. Cheng, Y.; Li, P.; Xu, G.; Wang, X.; Li, Z.; Cheng, S.; Huang, M. Effects of dynamic factors of erosion on soil nitrogen and phosphorus loss under freeze-thaw conditions. Geoderma 2021, 390, 114972. [Google Scholar] [CrossRef]
  55. Javed, T.; Shabbir, R.; Ali, A.; Afzal, I.; Zaheer, U.; Gao, S.J. Transcription factors in plant stress responses: Challenges and potential for sugarcane improvement. Plants 2020, 9, 491. [Google Scholar] [CrossRef] [PubMed]
  56. Shabbir, R.; Javed, T.; Afzal, I.; Sabagh, A.E.; Ali, A.; Vicente, O.; Chen, P. Modern biotechnologies: Innovative and sustainable approaches for the improvement of sugarcane tolerance to environmental stresses. Agronomy 2021, 11, 1042. [Google Scholar] [CrossRef]
  57. Wang, X.; Fan, J.; Xing, Y.; Xu, G.; Wang, H.; Deng, J.; Wang, Y.; Zhang, F.; Li, P.; Li, Z. The effects of mulch and nitrogen fertilizer on the soil environment of crop plants. Adv. Agron. 2019, 153, 121–173. [Google Scholar]
Figure 1. Effects of sea- and freshwater blends on eggplant, tomato and pepper biomass yield (g; (A)) and effect of sea- and freshwater blends on plant water consumption (L), water potential (g L−1) and water use efficiency (g L−1) of eggplant, tomato and pepper (B). Values are the means of four replications per treatment ± SEM. Different letters show the significant difference from each other. Treatment abbreviations are provided in; values are the means of four replications per treatment ± SEM. CT: (control; tap water and nutrient solution); A: (5% seawater + nutrient solution); B: (10% seawater + nutrient solution); C: (20% seawater + nutrient solution).
Agronomy 11 01826 g001
Figure 2. Effect of sea- and freshwater blends on photosynthetic rate (Pn) in eggplant, tomato and pepper plants and values are the means of four replications per treatment ± SEM. The treatment abbreviations are provided in Figure 1A.
Agronomy 11 01826 g002
Figure 3. Effect of sea- and freshwater blends on stomatic conductance in eggplant, tomato and pepper plants and values are the means of four replications per treatment ± SEM. The treatment abbreviations are provided in Figure 1A.
Agronomy 11 01826 g003
Figure 4. Effect of sea- and freshwater blends on internal CO2 (Ci) in eggplant, tomato and pepper plants and values are the means of four replications per treatment ± SEM. The treatment abbreviations are provided in Figure 1A.
Agronomy 11 01826 g004
Table 1. Chemical and physical characteristics of seawater.
Na+ mg L−1Cl mg L−1K+ mg L−1Mg mg L−1SO3− mg L−1NO2− μg L−1SiO32− μg L−1PO4 μg L−1NO3− μg L−1Specific GravitypHEC dS m−1
10,11518,745419150129350.0130.0590.0040.4091.0217.551
Table 2. Physicochemical characteristics of growing media; average chemical concentration in three growing media.
Na+ mg L−1Cl mg L−1K+ mg L−1Mg mg L−1SO3− mg L−1NO2− μg L−1SiO32− μg L−1PO4 μg L−1NO3− μg L−1Specific GravitypHEC dS m−1
CT0050.851.0116.584.859.010.04816.50.41
A4359783182.7305.50.0032.527.5218.531.0026.842.91
B948187965152.6322.90.0032.987.9515.921.0026.895.96
C1832329876171.5285.80.0042.657.8714.011.0036.968.14
CT: (control; distilled water and nutrient solution); A: (5% seawater + nutrient solution); B: (10% seawater + nutrient solution); C: (20% seawater + nutrient solution).
Table 3. Effect of different sea- and freshwater blends on shoot fresh weight and dry weight of eggplant, tomato and pepper.
EggplantTomatoPepper
Shoot Fresh Weight (g)Shoot Dry Weight(g)Shoot Fresh Weight (g)Shoot Dry Weight(g)Shoot Fresh Weight (g)Shoot Dry Weight (g)
CT134.56 ± 5.46a12.48 ± 0.78a91.58 ± 2.45a8.82 ± 1.22a78.56 ± 0.69a5.69 ± 0.88a
A118.35 ± 4.89a11.45 ± 0.98a78.59 ± 1.45b7.92 ± 1.02a65.25 ± 1.21a4.98 ± 0.17a
B91.78 ± 4.02b8.45 ± 1.2b61.25 ± 0.98c7.26 ± 0.68ab52.69 ± 0.94ab3.34 ± 0.22ab
C80.89 ± 5.48b7.92 ± 1.12b49.21 ± 1.25c5.58 ± 1.03b48.59 ± 1.08b3.12 ± 0.22b
The treatment abbreviations are given in Table 2. The values after ± are the SE and different letters show the significant difference at 5% probability level.
Table 4. Effect of sea- and freshwater blends on pigment concentration in the leaves of eggplant, tomato and pepper.
Eggplant (µg mg−1 FW)Tomato (µg mg−1 FW)Pepper (µg mg−1 FW)
ChlaChlbCarTFPhpChla ChlbCarTFPhpChla ChlbCarTFPhp
CT256.48 ± 12.57a78.24 ± 6.12a33.58±1.85a1.82 ± 0.23a448.56 ± 16.48a85.96 ± 12.54a41.58 ± 5.78a1.65 ± 0.21a305.48 ± 8.74a91.48 ± 3.09a36.74 ± 6.15a1.46 ± 0.14a
A264.12 ± 8.95a81.49 ± 5.18a36.25±1.02a1.9 ± 0.12a421.23 ± 21.41b78.56 ± 11.45ab35.68 ± 5.48a1.41 ± 0.28a281.48 ± 12.45a84.12 ± 6.59a34.98 ± 2.51a1.32 ± 0.11a
B251.87 ± 13.45a74.89 ± 3.02a29.98 ± 1.48a1.41 ± 0.31a385.47 ± 18.98c71.98 ± 6.45b33.98 ± 3.25a1.12 ± 0.13b265.65 ± 9.89a78.26 ± 2.36ab31.81 ± 3.15b1.11 ± 0.08ab
C238.08 ± 15.48a62.26 ± 4.58a24.88 ± 2.15a1.23 ± 0.25a341.58 ± 35.68d61.23 ± 4.58c22.56 ± 6.58b1.01 ± 0.09b231.05 ± 5.06b68.86 ± 5.18b24.63 ± 1.05c0.96 ± 0.05b
Chla: chlorophyll a; Chlb: chlorophyll b; Car: carotenoid; TFPhp: total porphyrins; FW: fresh weight. The treatment abbreviations are provided in Table 2. The values with ± are the SE, and different letters show the significant difference at 5% probability level.
Table 5. Effects of sea- and freshwater blends on quality attributes of eggplant.
Fruit YieldTitratable AcidityTotal SugarProteinVitamin CNO3-NTotal Oxalate
g Plant−1% FWmg 100 g FW−1
CT4.25 ± 0.23a0.061 ± 0.003a2.36 ± 0.7b1.41 ± 0.58a14.78 ± 1.58b81.45 ± 11.45a14.78 ± 1.45b
A3.71 ± 0.19a0.059 ± 0.001a2.51 ± 0.85a1.55 ± 0.68a15.79 ± 1.05ab72.88 ± 9.58a15.11 ± 1.69b
B3.02 ± 0.05b0.062 ± 0.004a2.59 ± 1.25a1.48 ± 0.98a16.09 ± 0.98a46.02 ± 12.59b18.05 ± 2.05b
C2.23 ± 0.11c0.064+0.003a1.95 ± 0.92c1.31 ± 0.66a14.09 ± 1.79c28.69 ± 14.09c23.23 ± 3.11a
The treatment abbreviations are provided in Table 2. The values after ± are the SE, and different letters show the significant difference at 5% probability level.
Table 6. Effects of sea- and freshwater blends on quality attributes of tomato plants.
Fruit YieldTitratable AcidityTotal SugarProteinVitamin CNO3-NTotal Oxalate
g Plant−1% FWmg 100 g FW−1
CT3.78 ± 0.18a0.064 ± 0.001c2.81 ± 0.95b1.36 ± 0.25a15.98 ± 2.12b71.59 ± 1.43a15.86 ± 1.87c
A3.02 ± 0.78b0.064 ± 0.002c3.01 ± 0.89a1.44 ± 0.78a16.35 ± 1.26ab58.96 ± 4.21b17.04 ± 2.56c
B2.41 ± 0.26c0.066 ± 0.003bc3.22 ± 1.02a1.33 ± 0.91a16.41+1.87a44.91 ± 6.74c19.02 ± 1.66b
C1.90 ± 0.47d0.069 ± 0.005a2.52 ± 0.64c1.14 ± 0.55b15.22 ± 0.98c24.39 ± 3.08d26.48 ± 4.41a
The treatment abbreviations are provided in Table 2. The values with ± are the SE, and different letters show the significant difference at 5% probability level.
Table 7. Effects of sea- and freshwater blends on quality attributes of pepper plants.
Fruit YieldTitratable AcidityTotal SugarProteinVitamin CNO3-NTotal Oxalate
g Plant−1%mg 100 g FW−1
CT2.05 ± 0.12a0.061 ± 0.001c2.11 ± 1.78b1.38 ± 0.66a17.26 ± 1.02b74.12 ± 8.41a15.01 ± 3.65b
A1.82 ± 0.19a0.061 ± 0.001c2.31 ± 1.05ab1.46 ± 0.71a17.68 ± 2.45a61.48 ± 5.26a16.48 ± 2.86b
B1.65 ± 0.21b0.063 ± 0.002b2.39 ± 0.98a1.41 ± 0.91a17.55+0.75ab49.49 ± 3.59bc17.31 ± 1.55b
C1.41 ± 0.1c0.065 ± 0.001a1.72 ± 0.62c1.29 ± 0.46b16.81 ± 1.56c32.61 ± 6.95c21.03 ± 4.51a
The treatment abbreviations are provided in Table 2. The values after ± are the SE, and different letters show the significant difference at 5% probability level.
Table 8. Effects of sea- and freshwater blends on mineral accumulation in the leaves of eggplant.
Na mg g−1Cl mg g−1K mg g−1Ca mg g−1Cu μg g−1Fe μg g−1Mg μg g−1Zn μg g−1
CT9.78 ± 0.87c6.45 ± 0.25c29.68 ± 0.32b5.66 ± 0.01a4.82 ± 0.96b98.25 ± 5.45b6248.69 ± 167.39b58.49 ± 2.09a
A25.44 ± 1.05b48.15 ± 5.02b31.56 ± 0.96ab7.58 ± 0.08a9.58 ± 0.86b105.68 ± 14.10b6744.02 ± 269.87ab47.12 ± 4.25a
B34.45 ± 0.87ab61.29 ± 3.69b39.01 ± 1.48ab7.91 ± 0.21a9.87 ± 0.95ab116.21 ± 12.51ab6801.25 ± 201.48ab51.61 ± 9.11a
C47.21 ± 3.87a84.65 ± 4.55a51.69 ± 4.89a7.96 ± 0.41a10.01 ± 1.10a138.14 ± 7.81a7459.49 ± 259.36a49.33 ± 5.62a
The treatment abbreviations are provided in Table 2. The values after ± are the SE, and different letters show the significant difference at 5% probability level.
Table 9. Effects of sea- and freshwater blends on mineral accumulation in the leaves of tomato plant.
Na mg g−1Cl mg g−1K mg g−1Ca mg g−1Cu μg g−1Fe μg g−1Mg μg g−1Zn μg g−1
CT11.89 ± 0.91c8.59 ± 0.47c39.68 ± 0.98b6.66 ± 0.19b5.21 ± 0.64b71.63 ± 3.65a9847 ± 119.25b71.45 ± 2.45a
A33.56 ± 2.56b62.89 ± 2.15b46.89 ± 1.98b9.36 ± 0.95a5.01 ± 1.18b79.98 ± 4.15a1185 ± 901.36b48.69 ± 9.34a
B44.98 ± 3.89a78.78 ± 0.65b58.12 ± 3.65ab10.25 ± 1.02a9.86 ± 2.12a86.74 ± 2.02a1302 ± 708.45ab64.02 ± 12.48a
C56.15 ± 5.21a123.47 ± 7.48a71.51 ± 7.42a11.03 ± 0.91a13.94 ± 0.89a81.36 ± 1.61a1351 ± 355.48a51.64 ± 3.59a
The treatment abbreviations are provided in Table 2. The values after ± are the SE, and different letters show the significant difference at 5% probability level.
Table 10. Effects of sea- and freshwater blends on mineral accumulation in leaves of pepper plant.
Na mg g−1Cl mg g−1K mg g−1Ca mg g−1Cu μg g−1Fe μg g−1Mg μg g−1Zn μg g−1
CT10.01 ± 0.21b6.98 ± 0.09c38.69 ± 2.45a3.41 ± 0.08b5.68 ± 0.12a85.14 ± 1.59a6823.15 ± 182.56a66.47 ± 6.12a
A28.24 ± 2.15ab52.36 ± 2.54b45.23 ± 3.98a6.01 ± 0.11a4.58 ± 1.18a71.69 ± 6.51a5569.59 ± 295.84a41.59 ± 4.51a
B36.11 ± 5.66ab69.72 ± 4.96b44.88 ± 1.02a6.87 ± 0.65a4.78 ± 0.60a54.09 ± 11.36ab5874.25 ± 225.14a32.15 ± 4.01a
C48.06 ± 4.87a101.01 ± 7.99a37.98 ± 2.55a7.26 ± 1.31a7.96 ± 1.15a48.59 ± 7.89b6048.69 ± 365.48a38.26 ± 7.06a
The treatment abbreviations are provided in Table 2. The values after ± are the SE, and different letters show the significant difference at 5% probability level.
Table 11. Effects of sea- and freshwater blends on MDA, PC and ASA contents in the leaves of the studied vegetables.
EggplantTomatoPepper
MDAPCASAMDAPCASAMDAPCASA
nmol g−1 FWnmol g−1 FWnmol−1 g FW
CT4.55 ± 1.02c5.19 ± 1.32b2.4 ± 0.88c4.98 ± 0.65c5.14 ± 0.68c2.82 ± 1.23d4.36 ± 0.89c5.17 ± 1.01b2.61 ± 0.92c
A 4.92 ± 0.98bc5.21 ± 1.02b2.52 ± 1.2c5.12 ± 2.01c5.29 ± 1.25c2.99 ± 1.42c4.76 ± 1.25bc5.21 ± 0.69ab2.83 ± 1.35bc
B 5.22 ± 1.21bc5.29 ± 0.92b2.91 ± 1.35b5.62 ± 2.35b5.41 ± 1.06b3.15 ± 1.11bc5.01 ± 1.88bc5.28 ± 1.11ab3.01 ± 1.02bc
C 5.78 ± 2.14a5.44 ± 0.25a3.11 ± 1.41a6.84 ± 2.02a5.91 ± 1.89a3.31 ± 1.78a5.91 ± 2.21a5.39 ± 1.58a3.18 ± 0.89a
MDA: malondialdehyde contents; PC: proline contents; ASA: ascorbate peroxidase; FW: fresh weight. The treatment abbreviations are provided in Table 2. The values after ± are the SE, and different letters show the significant difference at 5% probability level.
Publisher’s Note: MDPI stays neutral with regard to jurisdictional claims in published maps and institutional affiliations.

