Neuronal calmodulin levels are controlled by CAMTA transcription factors
- Cell Biology Division, Medical Research Council Laboratory of Molecular Biology, United Kingdom
- Institute of Science and Technology Austria (IST Austria), Austria
Abstract
The ubiquitous Ca2+ sensor calmodulin (CaM) binds and regulates many proteins, including ion channels, CaM kinases, and calcineurin, according to Ca2+-CaM levels. What regulates neuronal CaM levels, is, however, unclear. CaM-binding transcription activators (CAMTAs) are ancient proteins expressed broadly in nervous systems and whose loss confers pleiotropic behavioral defects in flies, mice, and humans. Using Caenorhabditis elegans and Drosophila, we show that CAMTAs control neuronal CaM levels. The behavioral and neuronal Ca2+ signaling defects in mutants lacking camt-1, the sole C. elegans CAMTA, can be rescued by supplementing neuronal CaM. CAMT-1 binds multiple sites in the CaM promoter and deleting these sites phenocopies camt-1. Our data suggest CAMTAs mediate a conserved and general mechanism that controls neuronal CaM levels, thereby regulating Ca2+ signaling, physiology, and behavior.
Introduction
Calmodulin-binding transcription activators (CAMTAs) are a highly conserved family of CaM-binding transcription activators (Finkler et al., 2007). In plants, CAMTAs mediate transcriptional changes in response to Ca2+ signals evoked by biotic and abiotic stress (Yang and Poovaiah, 2002; Du et al., 2009; Doherty et al., 2009; Pandey et al., 2013; Shkolnik et al., 2019). Mammals encode two CAMTA proteins, CAMTA1 and CAMTA2, respectively enriched in the brain and heart (Song et al., 2006). Loss of CAMTA1 in the mouse nervous system leads to defects in hippocampal-dependent memory formation, degeneration of cerebellar Purkinje cells and ataxia (Long et al., 2014; Bas-Orth et al., 2016). Humans heterozygous for lesions in the CAMTA1 gene exhibit a range of neurological phenotypes, including intellectual disability, cerebellar ataxia, and reduced memory performance (Huentelman et al., 2007; Thevenon et al., 2012; Shinawi et al., 2015). Mechanistically, however, little is known about the origin of these neuro-behavioral phenotypes.
CaM is a ubiquitously expressed Ca2+ binding protein that plays a key role in transducing responses to Ca2+ changes (Faas et al., 2011; Baimbridge et al., 1992). Ca2+-CaM modifies a host of neuronal functions, including signal transduction, ion currents, vesicle fusion, learning and memory, metabolism, and apoptosis (Hoeflich and Ikura, 2002; Berchtold and Villalobo, 2014), by regulating dozens of binding targets including the CaM kinases, calcineurin, and diverse ion channels (Wayman et al., 2008; Saimi and Kung, 2002). CaM levels are thought to be limiting compared to the combined concentration of Ca2+-CaM binding proteins (Sanabria et al., 2008), and relatively small changes in CaM levels are predicted to impact Ca2+-CaM regulation of downstream targets (Pepke et al., 2010). What mechanisms regulate neuronal CaM levels is, however, unclear. We identify CAMTA as a key regulator of CaM expression in multiple neuron types, and in both Caenorhabditis elegans and Drosophila, and suggest that it is a general and conserved regulator of Ca2+/CaM signaling in nervous systems.
Results
CAMT-1 functions in neurons to regulate multiple behaviors
Most natural isolates of C. elegans feed in groups. By contrast, the standard C. elegans lab strain, N2, feeds alone, due to a gain-of-function mutation in a neuropeptide receptor called NPR-1 (de Bono and Bargmann, 1998). Using npr-1(ad609) null mutants of the N2 strain (denoted as npr-1 throughout this manuscript), which aggregate strongly (Figure 1—figure supplement 1A), we performed a forward genetic screen for genes required for aggregation (Chen et al., 2017). The screen identified multiple aggregation-defective strains with mutations in camt-1, the sole C. elegans CAMTA (Figure 1—figure supplement 1A).
Aggregation is closely linked to escape from normoxia (21% O2) (Busch et al., 2012; Rogers et al., 2006; Gray et al., 2005). Normoxia elicits rapid movement in npr-1 animals, which is rapidly suppressed when O2 levels drop (Figure 1A). Since aggregating animals create a local low O2 environment, due to aerobic respiration, an animal encountering a group from normoxia switches from fast to slow movement, thereby staying in the group. camt-1 mutants showed defective responses to O2 stimuli. Compared to npr-1 controls, animals from a mutant strain isolated in the screen, camt-1(db973); npr-1, which harbors a premature stop codon in CAMT-1 (Q222*), were hyperactive in 7% O2, and showed reduced arousal when switched from 7% to 21% O2 (Figure 1A–B). A deletion (The C. elegans Deletion Mutant Consortium, 2012) that removed 451 residues of CAMT-1, camt-1(ok515), conferred similar defects (Figure 1A–B). A fosmid transgene containing a wild-type (WT) copy of the camt-1 genomic locus rescued camt-1 mutant phenotypes, restoring fast movement at 21% O2, and slow movement at 7% O2 (Figure 1C). These results indicate that CAMT-1 is required for C. elegans to respond appropriately to different O2 levels.
Figure 1 with 2 supplements see all
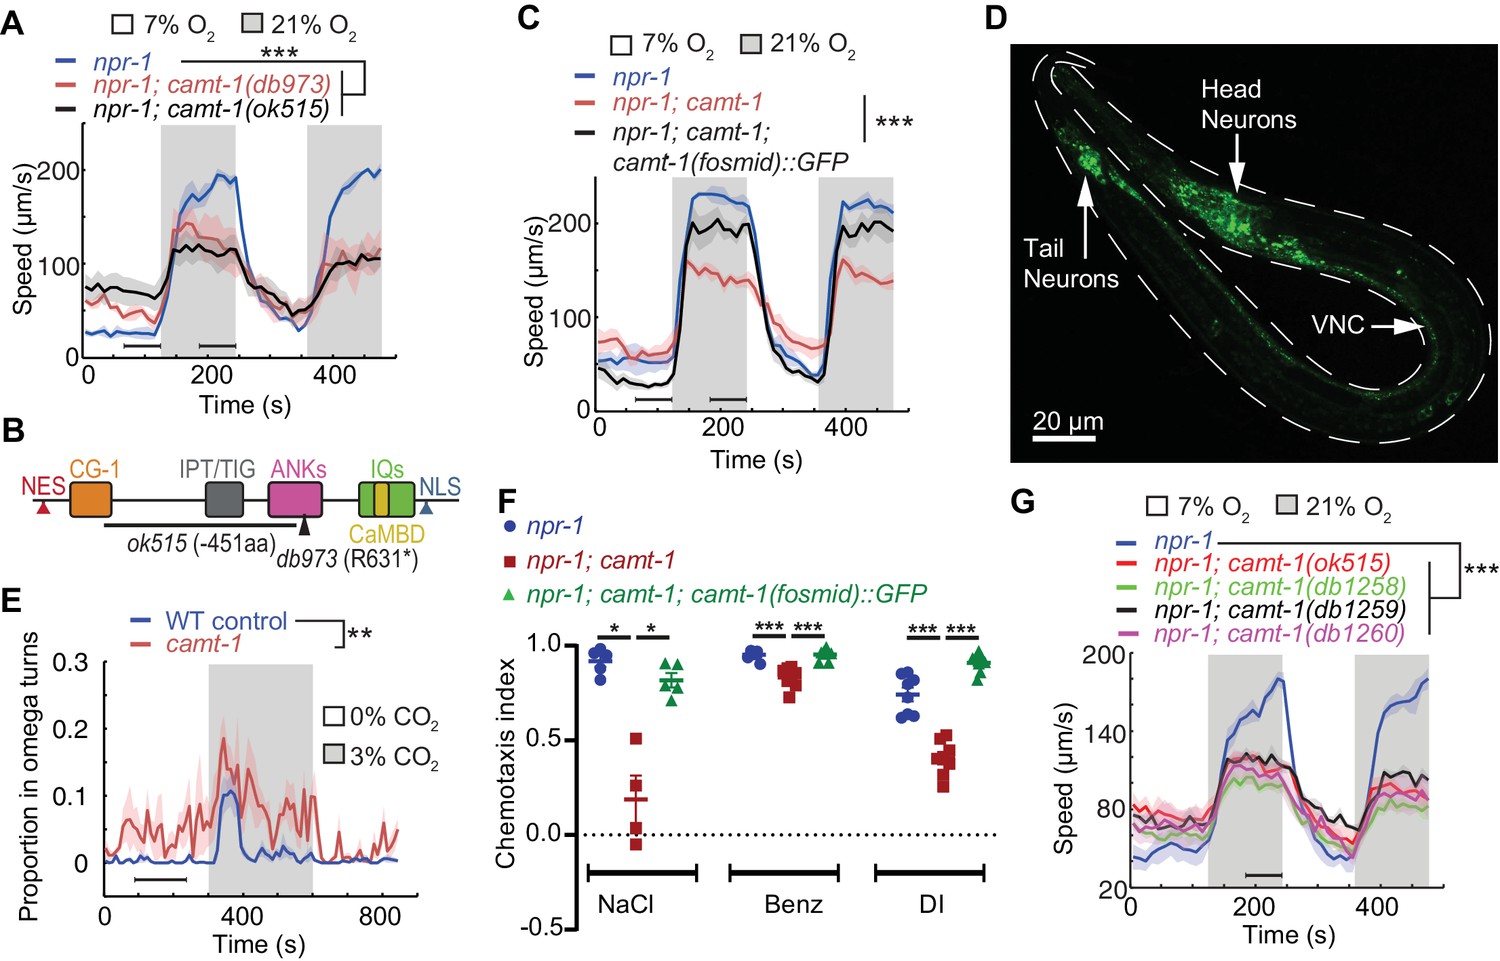
camt-1 mutants exhibit pleiotropic behavioral defects.
(A) camt-1(db973) and camt-1(ok515) mutants (see also (B)) exhibit altered locomotory responses to 21% O2 and hyperactive movement at 7% O2. (B) The domain organization of CAMT-1, highlighting camt-1 loss of function mutations used in this study. (C) A WT copy of the camt-1 genomic locus rescues the O2-response defects of camt-1(db973) mutants. (D) CAMT-1a::GFP driven from its endogenous regulatory sequences in a recombineered fosmid is expressed widely in the nervous system. (E) camt-1(db973) mutants exhibit an increased turning frequency both in the presence and absence of a CO2 stimulus. Assays were performed in 7% O2. (F) camt-1(ok515) mutants show defects in chemotaxis to NaCl, benzaldehyde (Benz), and diacetyl (DI), which can be rescued by expressing a WT copy of CAMT-1. Colored bars indicate the mean and error bars indicate the SEM. (G) The O2-response defects of mutants harboring amino acid substitutions in the CG-1 DNA-binding domain (db1258, db1259, and db1260 alleles; see also Figure 1—figure supplement 1B), are comparable to those of a camt-1(ok515) deletion mutant. (B, C, E, G) Lines indicate average speed and shaded regions SEM, black horizontal bars indicate time points used for statistical tests. (B, C, E–G) Mann-Whitney U-test, ns: p≥0.05, *: p<0.05, **: p<0.01, ***: p<0.001. Number of animals: n≥22 (A), n>41 (C), n≥23 (E), n≥4 assays for each genotype (F), n≥56 (G). ANK, ankyrin domain; CaMBD, calmodulin-binding domain; CG-1, DNA-binding domain; IPT/TIG, Ig-like, plexins, transcription factors or transcription factor immunoglobulin; IQ, calmodulin-binding motif; NES, nuclear export signal; NLS, nuclear localization signal; VNC, ventral nerve cord; WT, wild-type.
CAMT-1 has the characteristic domain architecture of CAMTAs (Finkler et al., 2007): a DNA-binding domain (CG-1), an immunoglobulin-like fold (IPT/TIG) similar to those found in non-specific DNA-binding/dimerization domains of other transcription factors, ankyrin repeats (ANKs), a putative Ca2+-dependent CaM-binding domain (CaMBD) and multiple IQ motifs that are thought to bind CaM in a Ca2+-independent manner (Figure 1B, Figure 1—figure supplement 1B–C; Bouché et al., 2002; Choi et al., 2005). CAMT-1 also has predicted nuclear localization and nuclear export signals (NLS/NES, Figure 1B).
In mice, humans, and flies, CAMTA transcription factors are expressed in many brain regions (Huentelman et al., 2007; Bas-Orth et al., 2016; Sato et al., 2019; Long et al., 2014). We generated a fosmid-based reporter to map the expression pattern of the longest isoform of C. elegans CAMTA, CAMT-1a. This fluorescent reporter was functional, as it rescued the behavioral defects of camt-1 mutants (Figure 1C), and revealed that CAMT-1 was expressed broadly and specifically in the nervous system (Figure 1D). We observed CAMT-1 expression in sensory neurons with exposed ciliated endings, motor neurons of the ventral cord, the URX O2-sensing neuron, and URX’s post-synaptic partner, the RMG hub interneurons (Figure 1—figure supplement 2). camt-1’s broad expression prompted us to ask if camt-1 mutants display pleiotropic behavioral phenotypes. We asked whether CAMT-1 is required for other aversive behaviors, such as avoidance of CO2, or for chemoattraction to odors and salts. In response to a rise in CO2, WT control (N2) worms transiently perform omega turns, Ω-shaped body bends that re-orient the animal away from the stimulus (Bretscher et al., 2008). camt-1 mutants exhibited abnormally high levels of Ω-turns without a CO2 stimulus and a prolonged increase in Ω-turns in response to a rise in CO2 (Figure 1E). C. elegans avoids CO2 but is attracted toward salt and a range of volatile compounds (Ward, 1973; Bargmann et al., 1993). Chemotaxis toward NaCl and odorant attractants such as benzaldehyde and diacetyl was reduced in camt-1 mutants, and these defects were rescued by a fosmid transgene containing WT CAMT-1 (Figure 1F). Taken together, these data show that CAMT-1 function is important for multiple C. elegans behaviors.
Many deleterious human alleles of CAMTA1 alter the CG-1 DNA-binding domain (Thevenon et al., 2012). To assess the importance of the putative DNA-binding domain of CAMT-1, we used CRISPR-Cas9 to engineer mutations in conserved residues of the CG-1 domain (Figure 1—figure supplement 1B). These mutants showed defects in aggregation and in their response to O2, recapitulating phenotypes of the camt-1 deletion mutants described above (Figure 1G, Figure 1—figure supplement 1B). These results suggest that CAMT-1 binding to DNA is essential for its function, at least for O2 escape behavior.
We targeted CAMT-1 cDNA expression to different subsets of neurons in the neuronal circuit regulating the response to O2, to find out where CAMT-1 is required to promote aerotaxis. O2 is sensed mainly by the sensory neurons URX, AQR, and PQR, and tonic signaling from URX to RMG drives high locomotory activity at 21% O2 (Busch et al., 2012; Zimmer et al., 2009). Selectively expressing CAMT-1 to the RMG hub interneurons, but not O2 sensing neurons, rescued the fast movement at 21% O2 of camt-1 mutants (Figure 1—figure supplement 1D–E). The defective response of camt-1 mutants to 7% O2 was not rescued by expressing CAMT-1 in RMG, or by simultaneous expression in RMG and O2-sensing neurons (Figure 1—figure supplement 1D–E). These data are consistent with a model in which CAMT-1 acts in multiple neurons. As expected, pan-neuronal expression rescued camt-1 mutant phenotypes, and expression of the isoform a alone (CAMT-1a) was sufficient for rescue (Figure 2A).
Figure 2
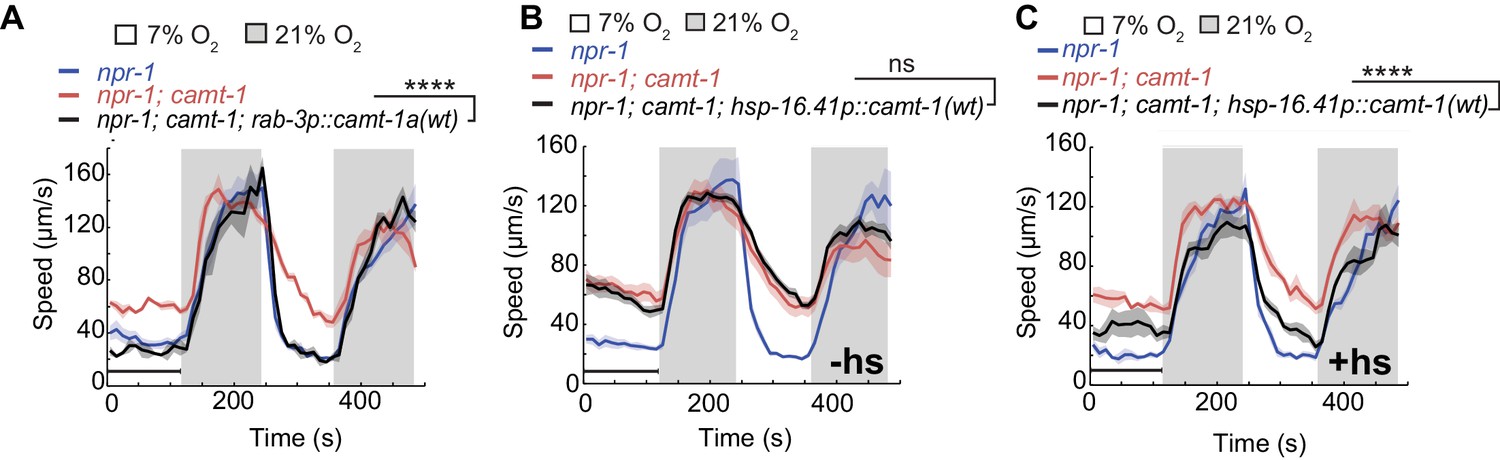
CAMT-1 acts in neurons and is not required developmentally to regulate the oxygen response.
(A) Pan-neuronal expression using the rab-3 promoter of the longest CAMT-1 isoform, CAMT-1a, in camt-1(db973) mutants, rescues O2 response defects. (B, C) Transgenic expression of CAMT-1 from the hsp-16.41 heat-shock promoter does not rescue the hyperactive locomotion of camt-1(ok515) mutants at 7% O2 without heat-shock (B). Heat-shock-induced expression of CAMT-1 in L4 animals rescues this phenotype in camt-1(ok515) mutants, although partially (C). Lines indicate average speed and shaded regions SEM. Black horizontal bars indicate time points used for statistical tests. Mann-Whitney U-test, ns: p≥0.05, ***: p<0.001. Number of animals: n≥39 (A), n≥158 (B), n≥56 (C). hs, heat-shock.
CAMTA transcription factors bind and can be regulated by CaM (Yang and Poovaiah, 2002; Du et al., 2009; Doherty et al., 2009; Pandey et al., 2013; Shkolnik et al., 2019). Ca2+-CaM dependent changes in gene expression are known to be important for both the development and function of the nervous system (West et al., 2002; Chin and Means, 2000). To test whether CAMT-1 activity is essential during development, we expressed CAMT-1 cDNA from a heat-shock-inducible promoter. Without heat-shock, this transgene did not rescue the hyperactivity phenotype of camt-1 mutants (Figure 2B). By contrast, inducing CAMT-1 expression in the last larval stage/young adults rescued the aggregation (data not shown) and speed response defects, albeit not completely (Figure 2C), suggesting that CAMT-1 can function in adults post-developmentally to regulate behavioral responses to ambient O2.
CAMT-1 dampens Ca2+ responses in sensory neurons
To test whether disrupting camt-1 altered physiological responses to sensory cues we used Yellow Cameleon (YC) Ca2+ sensors to record stimulus-evoked Ca2+ changes in the URX O2-sensor, and in the BAG and AFD neurons, which respond to CO2. BAG drives omega turns when CO2 levels rise (Bretscher et al., 2011; Hallem and Sternberg, 2008). Expressing YC sensors in these neurons did not alter the response of animals to O2 or CO2 (Figure 3—figure supplement 1A–C). We found that baseline Ca2+ and stimulus-evoked Ca2+ responses in URX, BAG, and AFD neurons were significantly elevated in camt-1 mutants across all the O2/CO2 conditions we tested (Figure 3A–B, Figure 3—figure supplement 1D). These data suggest that CAMT-1 activity somehow dampens the Ca2+ responses of these sensory neurons. We obtained similar results for Ca2+ measurements in BAG using a Ca2+ reporter, TN-XL (Bazopoulou et al., 2017; Mank et al., 2006), which uses chicken troponin C instead of CaM to bind Ca2+ (Figure 3—figure supplement 1E–F). We observed the converse phenotype, reduced Ca2+ baselines and responses, when we overexpressed CAMT-1 cDNA specifically in O2 sensors or in BAG neurons of control animals (Figure 3C–D). Overexpressing CAMT-1 slightly reduced expression from the gcy-37 promoter we used to express YC in O2 sensors, as measured using a gcy-37p::gfp reporter (Figure 3—figure supplement 1G). Although we cannot completely exclude that this contributes to the reduced baseline YFP/CFP ratio, we note that cameleon is a ratiometric sensor. Taken together, our results suggest that camt-1 regulates the excitability of sensory neurons.
Figure 3 with 1 supplement see all
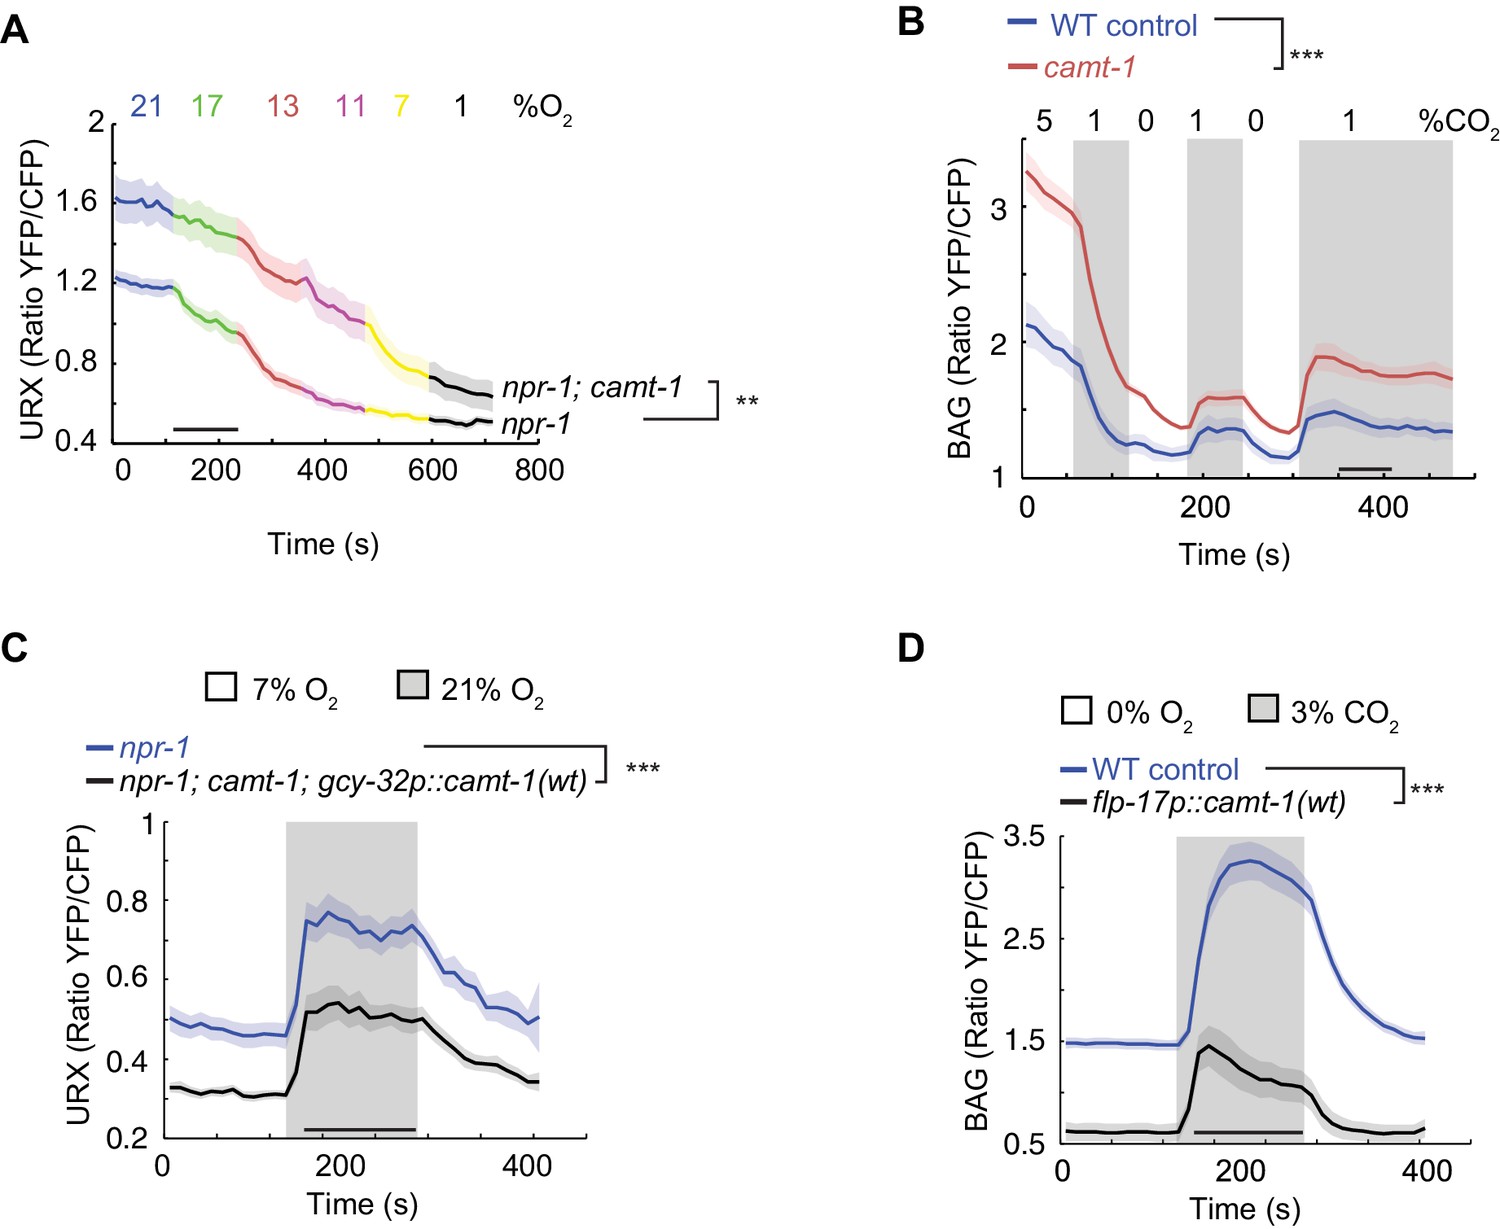
camt-1 mutants show altered Ca2+ traces in sensory neurons.
(A, B) The URX O2-sensing neurons (A) and the BAG CO2 sensors (B) show higher Ca2+ baselines and Ca2+ responses across a range of stimulus intensities in camt-1(db973) mutants. (C–D) Overexpressing wild-type camt-1 cDNA in O2-sensing (using gcy-32p, C) or BAG neurons (using flp-17p, D) strongly reduces Ca2+ levels in these neurons. n≥15 (A), n≥18 (B), n≥17 (C), and n≥20 animals (D). Strains express a Yellow Cameleon sensor in O2-sensing neurons (A, C), or in BAG (B, D) (see Materials and methods). Average YFP/CFP ratios (line) and SEM (shaded regions) are plotted. **: p<0.01, ***: p<0.001, Mann-Whitney U-test.
Calmodulin is one of only two genes whose expression is regulated by CAMT-1 across all neuronal types profiled
To identify downstream targets of CAMT-1, we compared the transcriptional profiles of multiple neural types in camt-1; npr-1 and npr-1 control animals (Kaletsky et al., 2018). We separately profiled the O2-sensors URX/AQR/PQR, the RMG interneurons, the AFD thermosensors, and the BAG O2/CO2 sensors. We collected the neurons using FACS from strains in which they were labeled with GFP, and performed 4–10 biological replicates for robust statistical power. Analysis of the data revealed altered expression of many genes, with most changes being neural-type specific (Figure 4A, Supplementary files 1 and 2). A striking exception was cmd-1 (calmodulin-1), encoding C. elegans CaM. cmd-1 was one of only two genes whose expression was reduced in all four neural profiles relative to WT controls. The other gene, Y41C4A.17, has no known homolog in mammals.
Figure 4 with 1 supplement see all

The pleiotropic phenotypes of camt-1 reflect a role in regulating the expression of calmodulin.
(A) Venn diagram showing numbers of genes differentially regulated by CAMT-1 in neuron types we profiled (URX/AQR/PQR, BAG, AFD, and RMG). Two genes, cmd-1 (calmodulin-1) and Y41C4A.17, show consistently altered expression in all neural types profiled. (B) Left: Venn diagram comparing the number of genes differentially regulated by CAMT-1 in URX/AQR/PQR neurons in npr-1 versus npr-1; gcy-35; gcy-36 genetic backgrounds. Right: The most highly expressed genes (read count>1000 FPKM) among the 33 loci regulated by CAMT-1 across all genotypes tested. (C) cmd-1 transcript read counts and FC (top) for URX/AQR/PQR, BAG, AFD, and RMG neurons in camt-1 mutants compared to controls. Each dot or square represents a separate RNA Seq experiment. (D, E) Supplementing CMD-1 expression in neurons using a rab-3p::cmd-1(wt) transgene rescues the O2-response (C) and chemotaxis (D) phenotypes of camt-1 mutants. (F, G) Supplementing CMD-1 expression in neurons also rescues the camt-1 Ca2+-response phenotypes of URX neurons to O2 (F) and of BAG neurons to CO2 (G). Responses to CO2 were assayed in 7% O2. ns: p≥0.05, *: p<0.05, **: p<0.01, ***: p<0.001, ****: p<0.0001, Mann-Whitney U-test (C–H). n≥4 replicates for all cell types (A, B, C), n≥103 (D), n=8 assays for each condition (E), n=32 for each genotype (F), n≥58 animals (G). camt-1 denotes camt-1(ok515). (D, F, G) Lines represent average speed and shaded regions the SEM, black horizontal bars indicate time points used for statistical tests. (C, E) Colored bars indicate the mean and error bars indicate the SEM. FC: fold change.
Most camt-1-dependent gene expression changes in O2 sensing neurons are associated with altered neural activity
Altered Ca2+ signaling can drive changes in neuronal gene expression (Yap and Greenberg, 2018). This prompted us to investigate if the altered Ca2+ signaling we observed in camt-1 mutants contributed to the altered gene expression. To address this, we focused on the URX/AQR/PQR O2 sensors, which showed the altered expression of 2370 genes in camt-1 mutants. Our profiling experiments were carried out in normoxia, when these neurons exhibit tonic high Ca2+ levels due to sustained cGMP signaling mediated by a heterodimeric soluble guanylate cyclase composed of GCY-35 and GCY-36 subunits, which binds and is activated by O2 (Zimmer et al., 2009; Couto et al., 2013). Disrupting GCY-35 or GCY-36 abolishes the O2 response and causes these neurons to have a constitutive low baseline Ca2+ (Zimmer et al., 2009). We therefore compared the number of genes differentially regulated in URX/AQR/PQR neurons that we isolated and sorted from gcy-35; gcy-36; npr-1 and gcy-35; gcy-36; npr-1; camt-1 mutant animals. We only observed 108 differentially regulated genes between these genotypes, a dramatic decrease from the 2370 genes we observed when we compared the same neurons between npr-1 and npr-1; camt-1. Out of the 108 genes, 33 genes are common across the two sets of comparisons (Figure 4B). Sorting these 33 genes in decreasing order of expression (Table in Figure 4B), we found that they included cmd-1 and Y41C4A.17, the two genes regulated by camt-1 in all neuronal types we profiled. These results support the hypothesis that most of the genes expression changes we observe in O2 sensing neurons in camt-1 mutants are due to altered Ca2+ signaling rather than direct control by CAMT-1, but that cmd-1, encoding CaM, is an exception.
CAMT-1 phenotypes reflect reduced expression of calmodulin
CaM regulates many functions in the nervous system, including excitability (Wayman et al., 2008; Zalcman et al., 2018). The levels of CaM mRNA in camt-1 mutants was 2.5- to 4-fold lower than in controls, depending on neural type (Figure 4C). We speculated that most camt-1 phenotypes could be due to reduced CMD-1/CaM expression. Straightforward comparison of camt-1 and cmd-1 loss of function phenotypes was not possible, since disrupting cmd-1 confers lethality (Karabinos et al., 2003; Au et al., 2019). We therefore, asked if supplementing CMD-1/CaM expression in camt-1 mutants, using a pan-neuronal promoter (rab-3p), could rescue camt-1 phenotypes. We made four transgenic lines that expressed CMD-1 to different levels (Figure 4—figure supplement 1A). To monitor expression, we placed sequences encoding mCherry in an operon with cmd-1 (noted as cmd-1::SL2::mCherry, see Materials and methods). The rab-3p::cmd-1::SL2::mCherry transgene expressing the lowest levels of fluorescence (line A, Figure 4—figure supplement 1A) strongly rescued the abnormal O2-escape response of camt-1 mutants (Figure 4D). Further increasing CMD-1 expression levels restored quiescence behavior in animals kept at 7% O2 but progressively reduced the speed attained at 21% O2 (Figure 4—figure supplement 1B).
Supplementing CMD-1 in the nervous system using the lowest expressing rab-3p::cmd-1::SL2::mCherry line also restored normal chemotaxis toward salt, benzaldehyde, and diacetyl in camt-1 mutants (Figure 4E), and rescued the hyperexcitability defects in URX and BAG neurons of camt-1 mutants (Figure 4F–G). By contrast, deleting the entire coding region of Y41C4A.17 did not affect aggregation of npr-1 animals (data not shown). Our data suggest that reduced CMD-1 expression accounts for camt-1 Ca2+ signaling and behavioral defects (see also below).
CAMTA promotes CaM expression in Drosophila melanogaster
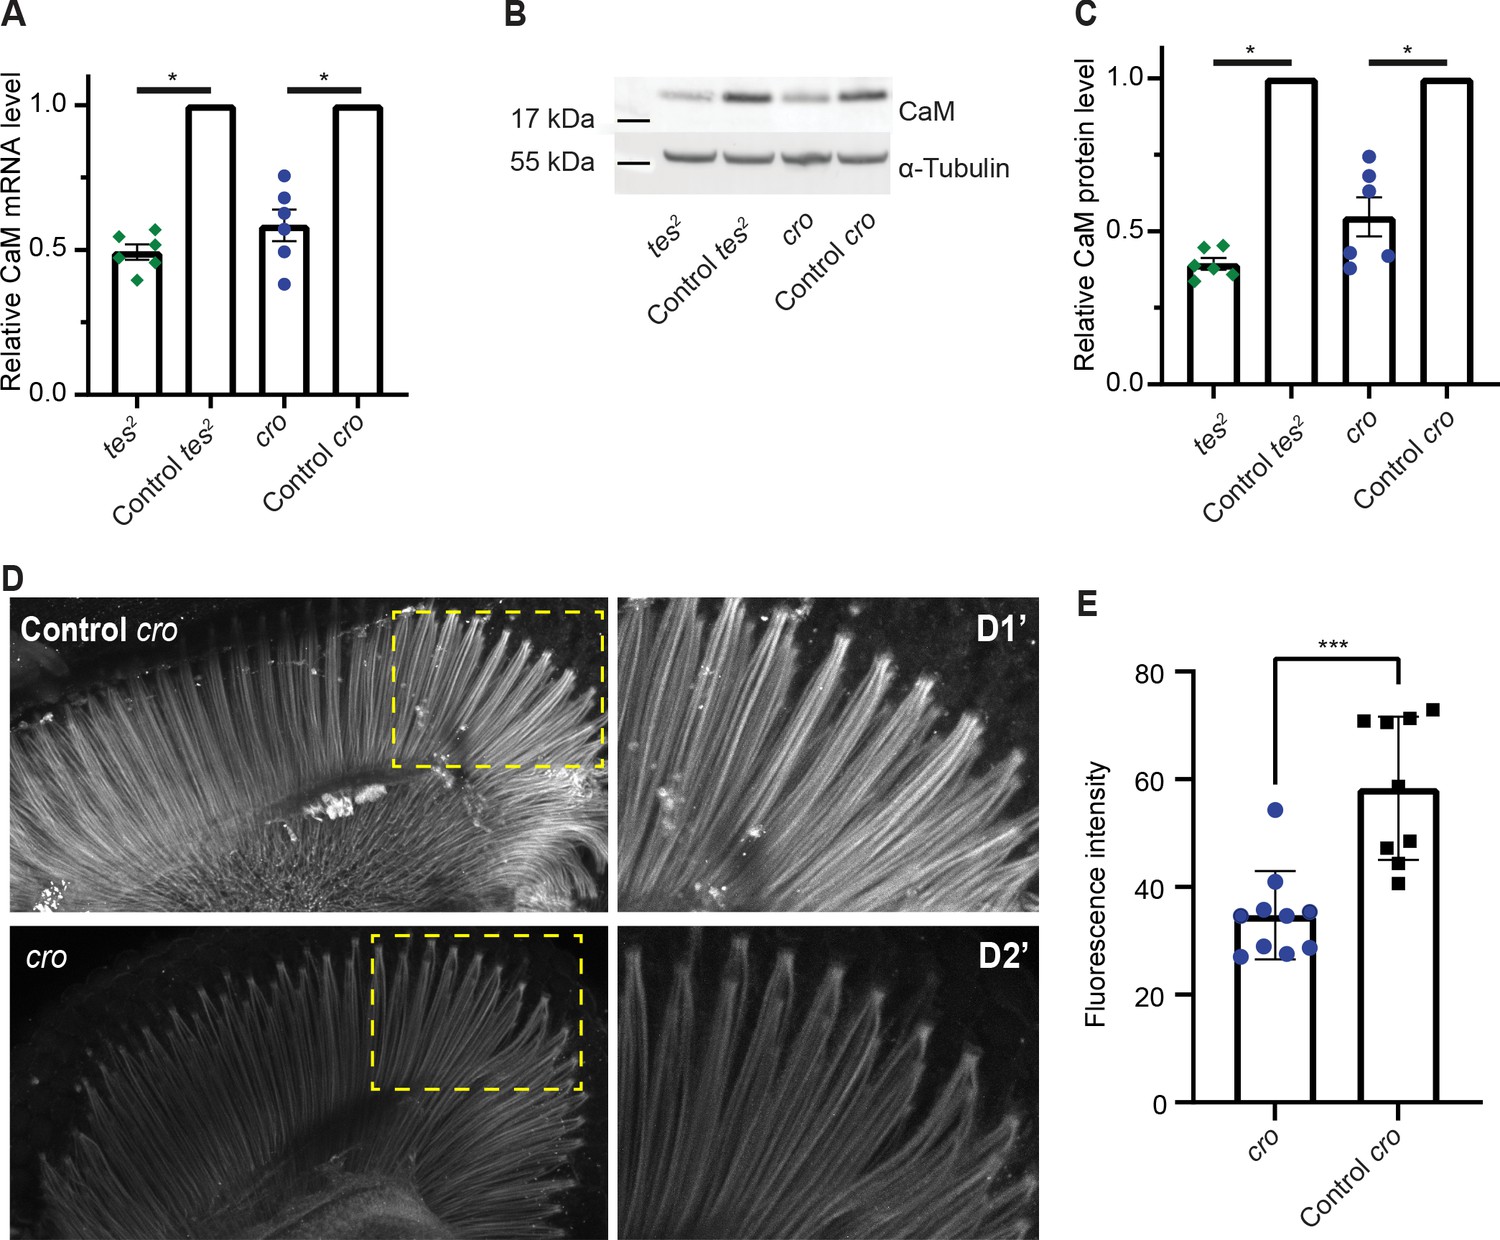
Fly mutants of CAMTA show slow termination of photoresponses compared to WT controls (Han et al., 2006), and also exhibit defects in male courtship song (Sato et al., 2019). An allele of the Drosophila CaM gene that deletes part of the promoter and reduces CaM expression also shows slow termination of photoresponses (Scott et al., 1997). This phenotypic similarity, and our findings in C. elegans, prompted us to ask if CAMTA promotes CaM expression in flies too. We obtained two characterized alleles of Drosophila CAMTA (dCAMTA), tes2 and cro, which respectively contain an L1420Stop mutation and a transposon insertion (Han et al., 2006; Sato et al., 2019). tes2 mutants showed a modest decrease in dCAMTA mRNA level, suggesting that the premature stop late in the protein does not induce mRNA degradation (Figure 5—figure supplement 1). The level of dCAMTA mRNA was strongly reduced in cro mutants as reported previously (Sato et al., 2019; Figure 5—figure supplement 1). We assessed the levels of CaM mRNA and CaM in the heads of dCamta mutant flies using quantitative RT-PCR and Western blots. Each method reported significant decreases in CaM expression compared to controls in both tes2 and cro mutant flies (Figure 5A–C). Moreover, immunostaining dissected retinas from cro mutants showed reduced CaM expression in rhabdomeres (Figure 5D–E). These results suggest that the transcriptional upregulation of neuronal CaM by CAMTA is conserved from worms to flies.
Figure 5 with 1 supplement see all
CAMTA regulates CaM expression in Drosophila.
(A) The Drosophila CAMTA mutants tes2 and cro show decreased CaM mRNA levels compared to control flies. mRNA levels in fly heads were measured by quantitative PCR. CAMTA mRNA levels were first normalized to RpL32 (rp49), the qPCR internal control, and then to the value of control flies. (B, C) tes2 and cro mutants show a decrease in CaM protein levels compared to control flies. Protein levels were determined using Western blot of proteins extracted from fly heads. (B) shows a representative picture and (C) shows quantification. CAMTA protein levels were first normalized to alpha-tubulin levels, then to the value of the control flies. (D, E) Immunostaining of fly retinae using CaM antibodies shows reduction of staining of rhabdomeres in cro mutants (see also Figure 5—figure supplement 1B). (D) shows representative pictures of control and cro retinae, respectively, with D1′ and D2′ are blow-ups of yellow rectangle in the left pictures. (E) shows quantification of CaM intensity. (A, C) *: p<0.05, one sample Wilcoxon test to control value of 1, n=6 for each genotype, colored bars indicate the mean and error bars indicate the SEM. (E) ***: p<0.001, Mann-Whitney U-test. w1118; cn1 and w1118; sb are control flies for tes2 (w1118; cn1; tes2) and cro (w1118; cro; sb) mutants, respectively. CaM, calmodulin; CAMTA, CaM-binding transcription activator.
CAMT-1 directly regulates CMD-1/CaM transcription through multiple binding sites at the cmd-1/CaM promoter
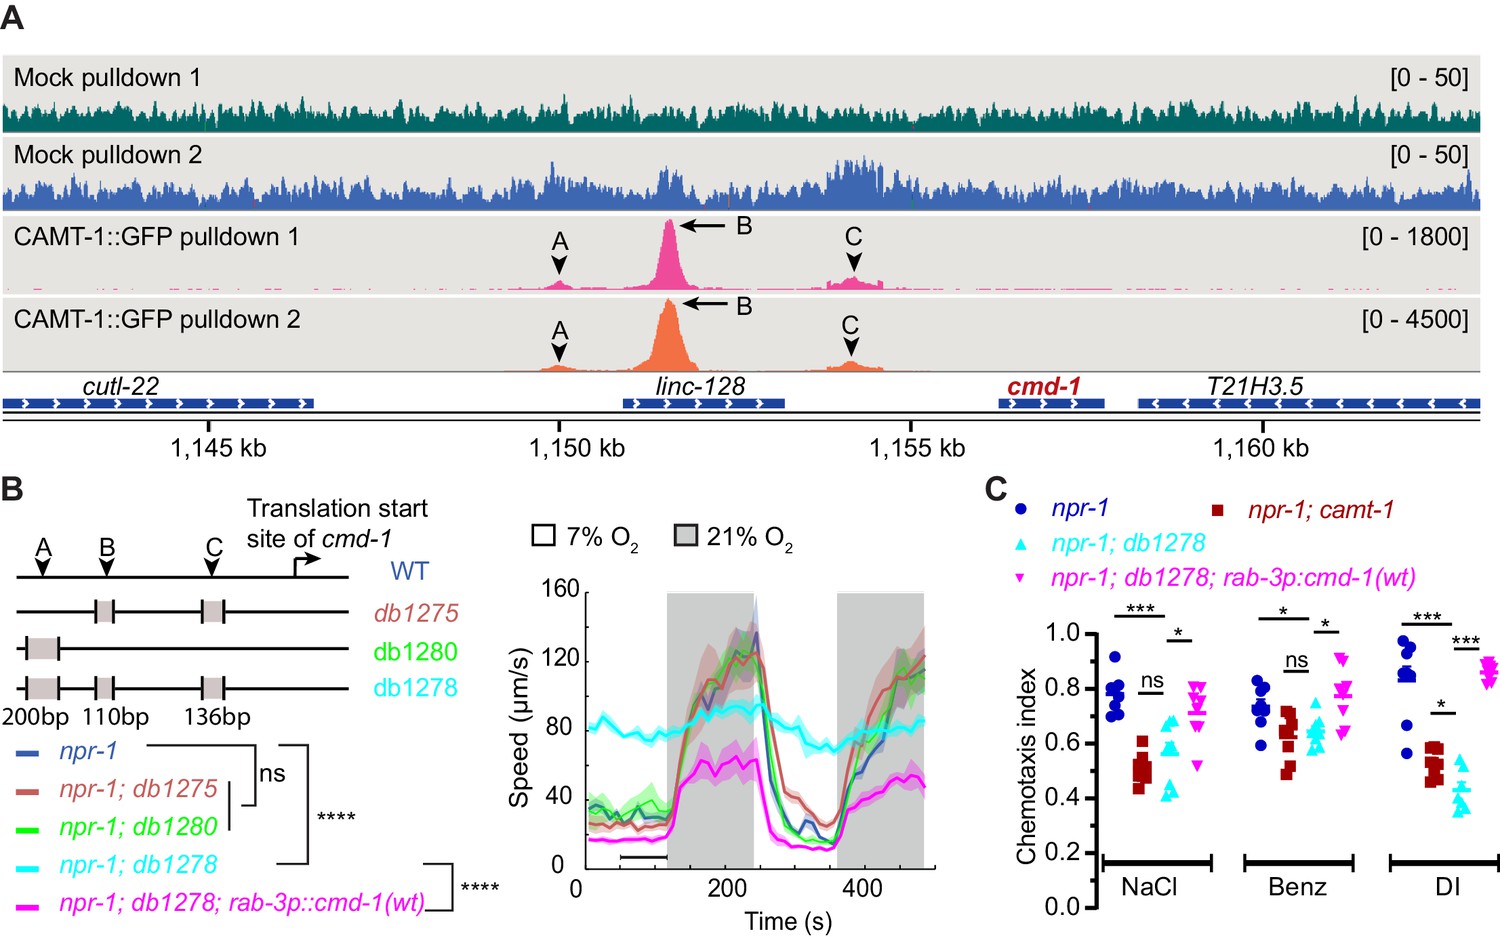
To test whether CAMT-1 directly regulates C. elegans CaM expression by binding the cmd-1 promoter, we performed chromatin immunoprecipitation sequencing (ChIP-seq) using a CRISPR-knock-in CAMT-1a::GFP strain. Our analysis revealed about 200 loci that were significantly enriched in CAMT-1a::GFP pulldowns compared to input, and to a mock pulldown (Supplementary file 3). At the top of the list was cmd-1: we observed three peaks at ~6.3 kb, 4.8 kb, and 2.2 kb upstream of the CMD-1 translation start site in the CAMT-1a::GFP pulldown experiments (Figure 6A, Figure 6—figure supplement 1A). We called these peaks A, B, and C, respectively. Thus, CAMT-1 is recruited to multiple sites upstream of cmd-1. A CAMT-1 binding peak was also found in the promoter region of Y41C4A.17, the only other gene whose expression was reduced in all the neurons profiled from camt-1 mutants (Figure 6—figure supplement 1B).
Figure 6 with 1 supplement see all
CAMT-1 directly activates calmodulin expression by binding multiple sites in the cmd-1 promoter.
(A) Coverage plots of chromatin pulldown samples showing enrichment at cmd-1 promoter in CAMT-1::GFP pulldown (peaks A, B, and C; arrows: major peaks, arrow heads: minor peaks) compared to a mock pulldown or input (see also Figure 6—figure supplement 1A). Bracketed numbers on the right indicate the scale (normalized read counts). (B) Left: CRISPR-generated strains deleted for one or more of the CAMT-1 ChIP-seq peaks A, B, and C shown in (A); deletions are not drawn to scale. Right: O2-evoked speed responses of the promoter deletion strains shown at left. The db1278 allele in which all three CAMT-1 peaks are deleted confers a strong phenotype that can be rescued by supplementing CMD-1 expression in the nervous system. The db1275 and db1280 alleles, which delete only one or two sites have no obvious phenotype. (C) The db1278 allele confers chemotaxis defects to NaCl, benzaldehyde, and diacetyl, similarly to camt-1(ok515) mutants, that can be rescued by supplementing CMD-1 expression in the nervous system. ns: p≥0.05, *: p<0.05, ***: p<0.001, ****: p<0.0001, Mann-Whitney U-test. n=2 (A), n≥49 (B), n=8 assays for each condition (C). (B) Lines represent average speed and shaded regions the SEM, black horizontal bars indicate time points used for statistical tests. (C) Colored bars indicate the mean and error bars indicate the SEM. ChIP-seq, chromatin immunoprecipitation sequencing.
To test whether the CAMT-1 ChIP-seq peaks in the cmd-1 promoter region regulated CMD-1 transcription, we generated CRISPR strains that deleted one or more of these peaks. A strain harboring 110 bp and 136 bp deletions at peaks B and C, respectively (Figure 6A–B, db1275), and a strain harboring a 200 bp deletion at peak A (Figure 6A–B, db1280) exhibited aggregation and O2 escape responses similar to npr-1 mutant controls (Figure 6B). However, a strain harboring all three deletions (Figure 6A–B, db1278) exhibited strong aggregation defects (Figure 1—figure supplement 1A) and defects in the locomotory responses to O2 that mirrored those of camt-1 loss-of-function mutants (Figure 6B, Figure 1A). Notably, the hyperactivity at 7% O2 of db1278 mutants could be rescued by expressing additional CMD-1 in the nervous system. Like camt-1(ok515) mutants, cmd-1(db1278) mutants also showed chemotaxis defects toward salt, benzaldehyde, and diacetyl that could be rescued by supplementing neuronal expression of CMD-1 (compare Figures 4D and 6C). These results suggest that CAMT-1 binds multiple sites in the CMD-1 promoter and acts redundantly at these sites to promote neuronal CaM expression.
Calmodulin can inhibit its own expression via CAMT-1
CaM is a key regulator of neural function. We speculated that CMD-1/CaM might homeostatically regulate its own expression via a negative feedback loop. To investigate this hypothesis, we built a transcriptional reporter for cmd-1 by fusing the 8.9 kb DNA fragment immediately upstream of the CMD-1 translational start site to sequences encoding GFP. This reporter showed strong fluorescence expression in neurons and muscle, including pharyngeal muscle (Figure 7—figure supplement 1A). We next introduced this reporter (cmd-1p::gfp) into a C. elegans line that overexpressed CMD-1/CaM in neurons, using the rab-3 promoter (rab-3p::cmd-1), and measured neuronal GFP fluorescence in single (cmd-1p::gfp) and double (cmd-1p::gfp+rab-3p::cmd-1) transgenic animals. We normalized expression using pharyngeal GFP levels. Animals expressing rab-3p::cmd-1 reduced neuronal expression of GFP from the cmd-1p::gfp reporter. These data suggest that the high levels of CMD-1 can repress expression from the cmd-1 promoter (Figure 7—figure supplement 1B). To examine if this repression is achieved via CaM binding to CAMT-1, we introduced into the double transgenic background a camt-1 allele that disrupts the 4 IQ domains, noted as camt-1(4IQ*) (Figure 1—figure supplement 1B). In this allele, codons encoding the conserved isoleucine residues in the four putative IQ domains of CAMT-1 were mutated to codons that encode asparagines. The camt-1(4IQ*) allele did not disrupt the O2-avoidance behaviors of npr-1 mutant animals (Figure 7—figure supplement 1C), suggesting that CaM binding to CAMT-1 via the IQ motifs is not essential for O2 escape behavior. By contrast, we found that camt-1(4IQ*) animals expressing cmd-1p::gfp and rab-3p::cmd-1 showed neuronal GFP levels similar to those found in control animals lacking the rab-3p::cmd-1 transgene (Figure 7—figure supplement 1B). These data suggest that CMD-1/CaM can negatively regulate its own expression by binding the IQ domains of CAMT-1. Thus, CAMT-1 may not only activate cmd-1 expression, but also repress it when available CMD-1/CaM levels are high (Figure 7).
Figure 7 with 1 supplement see all

Model of how CAMT-1 may positively and negatively regulate levels of CaM in neurons.
The binding of four apo-CaM to CAMTA is hypothetical, and is based on published data obtained from plant and Drosophila CAMTAs. CaMBP: Other CaM-binding proteins. Further analysis is required to confirm if the negative feedback loop occurs at physiological CaM concentrations. CaM, calmodulin; CAMTA, CaM-binding transcription activator.
Discussion
We find that neuronal levels of CaM, a key mediator of Ca2+ signaling, are controlled by the CaM-binding transcriptional activator CAMTA in both C. elegans and Drosophila. Reduced CaM levels appear to explain the pleiotropic phenotypes of C. elegans camt-1 mutants. First, camt-1 phenotypes can be rescued by supplementing neurons with CaM. Second, deleting CAMT-1 binding sites in the CaM promotor phenocopies camt-1.
Profiling four different C. elegans neurons from camt-1 mutants and WT controls using FAC sorting and RNA Seq shows that CAMT-1 stimulates CaM expression in each of the four neurons. These results, together with the observation that CAMT-1 is expressed in most or all C. elegans neurons, suggest that CAMT-1 is part of a general mechanism that regulates CaM levels throughout the nervous system.
The RNA Seq experiments reveal a 2.5×–4× reduction in CaM mRNA levels in camt-1 mutants, depending on neuron type. These relatively small decreases in CaM mRNA are, however, associated with striking alterations in the stimulus-evoked Ca2+ responses of each neuron. These findings suggest neural function is sensitive to quite small changes in CaM transcription. CaM levels may therefore provide a sensitive point of regulation of neural physiology. The increase in neuronal Ca2+ levels we observe in the sensory neurons of camt-1 mutants could simply reflect a decrease in Ca2+ buffering by CaM. An alternative explanation for the Ca2+ imaging phenotypes is that reducing CaM levels disrupts the regulation of Ca2+/CaM’s myriad binding partners. Previous work has identified multiple Ca2+-CaM feedback loops regulating C. elegans sensory responses, mediated for example by calcineurin/TAX-6 (Kuhara et al., 2002), CaM kinase I/CMK-1 (Satterlee et al., 2004), and PDE1/PDE-1 (Couto et al., 2013). In addition, work in vertebrates (Saimi and Kung, 2002) has shown that CaM regulates the activity of cyclic nucleotide-gated ion channels and the L-type–Ca2+ channel, which contribute to the Ca2+ responses of these C. elegans sensory neurons. Further experiments are required to understand in mechanistic terms how altered CaM levels alter Ca2+ signaling in camt-1 mutants.
Profiling of O2 sensors revealed that many genes showed altered expression in camt-1 mutants compared to controls. Our analysis of mutants that abolish O2-evoked Ca2+ responses in these neurons shows that most of these expression changes are linked to increased Ca2+ levels in camt-1 mutants, rather than loss of CAMT-1 per se. This is consistent with the known role of Ca2+ in regulating neuronal transcription (Yap and Greenberg, 2018). Our ChIP-seq studies identified CMD-1 as one of the major direct targets of CAMT-1. While binding motif analysis of the ChIP-seq data using prediction tool MEME did not find hits that coincide with CAMT-1 binding sites at the cmd-1 promoter(data not shown), we note that there are four mouse CAMTA1 binding motifs (Long et al., 2014; Long et al., 2009) overlapping with the CAMT-1 binding peaks of the cmd-1 promoter.
CAMTA regulates CaM expression not only in C. elegans but also in Drosophila. Mutations in the sole Drosophila CAMTA, dCAMTA, cause an approximately two fold reduction in CaM mRNA and protein in the Drosophila head. These results suggest that the regulation of CaM expression by CAMTA proteins is conserved across phylogeny. Conservation may extend beyond metazoa, as in Arabidopsis, CAMTA3/AtSR1 binds in vitro to the promoter of CaM2, although whether this regulates CaM2 expression in vivo is unknown (Yang and Poovaiah, 2002).
Like CAMT-1, dCAMTA is expressed broadly in the nervous system (Sato et al., 2019). Previous work found that dCAMTA mutants have defective termination of photoresponses (Han et al., 2006). A separate study showed that a promoter mutation in the fly CaM gene that reduces CaM expression also disrupts photoresponse termination in Drosophila photoreceptors (Scott et al., 1997). Since dCAMTA mutants show reduced levels of CaM in photoreceptors (although not to the same extent as the promoter mutation), part of the photoresponse termination defect in these animals may reflect reduced levels of CaM. More generally, it would be interesting to ask if supplementing neuronal CaM levels can rescue the dCAMTA behavioral phenotypes.
Mammals encode two CAMTA genes, CAMTA1 and CAMTA2. CAMTA1 is expressed broadly in both the mouse and human nervous systems. Homozygous mice and heterozygous human patients bearing mutations in CAMTA1 exhibit pleiotropic behavioral phenotypes, including memory defects and neurodegeneration (Han et al., 2006; Sato et al., 2019; Long et al., 2014; Bas-Orth et al., 2016; Thevenon et al., 2012; Huentelman et al., 2007). Our work raises the possibility that these defects are functionally associated with a reduction in CaM expression (Zalcman et al., 2018; Wayman et al., 2008). CAMTA2 is expressed in cardiomyocytes, and is implicated in promoting cardiac growth: overexpressing CAMTA2 in the mouse heart leads to cardiac hypertrophy (Song et al., 2006). Selectively overexpressing CaM in the mouse heart also induces cardiac hypertrophy, by a calcineurin-dependent mechanism (Obata et al., 2005). It would be interesting to ask if the cardiac hypertrophy in CAMTA2 overexpressing mice reflects increased CaM levels.
While CAMTAs were initially characterized as transcriptional activators, they have also been shown to mediate transcriptional repression (Du et al., 2009; Kim et al., 2017; Sun et al., 2020). Our data suggest CAMT-1 not only promotes CaM expression in C. elegans neurons, but can also inhibit it when available CaM levels are high, by a feedback loop in which CaM regulates its own transcription by binding to IQ domains of CAMT-1. These data suggest CAMT-1 can play a homeostatic role in regulating CaM levels (Figure 7). Mutant analyses in plants and flies have already suggested that CaM binding regulates CAMTA activity (Du et al., 2009; Nie et al., 2012; Kim et al., 2017; Choi et al., 2005). Our data suggest that binding to CaM converts CAMT-1 from an activator to a repressor. However, more data are required to establish if this feedback is relevant under physiological conditions. The absence of an obvious behavioral phenotype in mutant animals in which CAMT-1’s four IQ motifs have been disrupted suggests that native CaM levels may simply not be high enough in the circuits we have studied to evoke negative feedback regulation of CaM expression.
In summary, our data suggest that we have discovered a general and conserved mechanism by which neurons control levels of CaM using CAMTA, a transcription factor that is expressed broadly in the nervous system across Metazoa. Toggling CAMT-1, the C. elegans CAMTA, up and down, can change neural excitability, circuit function, and behavior. We speculate that the activity of CAMTA transcription factors is regulated in response to upstream signals, and provides a mechanism to alter CaM levels and thereby modulate neural excitability and behavior.
Materials and methods
No statistical methods were used to predetermine sample sizes. The sample size and replicate number were similar to or greater than that used in previously published papers (behavior assays, Ca2+ imaging) or in the scientific literature (RNA-seq, ChIP-seq, Western blot, and qPCR). The experiments were not randomized. This work used only biological replicates (biologically distinct samples that capture random biological variation) but not technical replicates (repeated measurements from the same sample).
Strains
C. elegans strains used are listed in Supplementary file 4. Strains were maintained at room temperature (RT) (22°C), on nematode growth medium (NGM) with E. coli OP50 unless otherwise specified. RB746 camt-1(ok515) and OH10689 otIs355[rab-3p::2xNLS::TagRFP] were obtained from the Caenorhabditis Genetic Center (P40 OD010440).
Molecular biology
Request a detailed protocolWe obtained a clone containing the camt-1 locus from the C. elegans fosmid library (Source BioScience). To insert GFP immediately prior to the termination codon of camt-1 we followed established protocols (Tursun et al., 2009). The primers used to amplify the recombineering cassette from pBALU1 were: ATCATCCATGGGACCAATTGAAACCGCCGTATGGTTGCGGAACACTTGCAATGAGTAAAGGAGAAGAACTTTTCAC and aaaccaataaaaaaaatcggcatcttctaaaagtgacaccggggcaaTTATTTGTATAGTTCATCCATGCCATG. To generate transgenic lines, we injected a mix of 50 ng/µl fosmid DNA and 50 ng/µl co-injection marker (unc-122p::dsRED).
C. elegans expression constructs were generated using MultiSite Gateway Recombination (Invitrogen) or FastCloning (Li et al., 2011). We amplified cDNA corresponding to camt-1 (T05C1.4b) using primers ggggACAAGTTTGTACAAAAAAGCAGGCTtttcagaaaaATGAATAATTCAGTCACTCGTCTTCTTTTCAAACGACTGCTGAC and ggggACCACTTTGTACAAGAAAGCTGGGTATTATGCAAGTGTTCCGCAACCATACGGCG. We were unable to amplify camt-1 cDNA corresponding to the longer T05C1.4a splice variant so we generated it by site-directed mutagenesis of T05C1.4b cDNA. To convert T05C1.4b cDNA to T05C1.4a we used the Q5 Site-Directed Mutagenesis Kit (NEB) and primers gtcatactcaacatctaATTGCGGAAAATGCATGC and catcatcaatatttacaTTATTACGATTTTGTCGCATAAAATTC.
Genome editing
Request a detailed protocolStrains PHX994 and PHX1919 were generated by SunyBiotech at our request (Fujian, China). We generated point mutations in the endogenous camt-1 locus using published CRISPR protocols (Dokshin et al., 2018). Cas9 endonuclease, crRNA, and tracrRNA were obtained from IDT (Iowa).
Behavioral assays
Request a detailed protocolO2- and CO2-response assays were performed as described previously (Flynn et al., 2020), using young adults raised at RT. 15–30 young adults were assayed in a microfluidic PDMS chamber on an NGM plate seeded with 20–50 µl OP50. The indicated O2/CO2 mixtures (in nitrogen) were bubbled through H2O and pumped into the PDMS chamber using a PHD 2000 Infusion Syringe Pump (Harvard Apparatus). Videos were recorded at two fps using FlyCapture software (FLIR Systems), and a Point Gray Grasshopper camera mounted on a Leica MZ6 microscope. Custom MATLAB software (Zentracker: https://github.com/wormtracker/zentracker, Laurent et al., 2015) was used to measure speed and omega turns.
Chemotaxis assays were performed as previously described (Bargmann et al., 1993) with minor modifications. 9 cm assay plates were made with 2% Bacto Agar, 1 mM CaCl2, 1 mM MgSO4, and 25 mM K2HPO4 pH 6. Test and control circles of 3 cm diameter were marked on opposite sides of the assay plate, equidistant from a starting point where >50 animals were placed to begin the assay. For olfactory assays, 1 μl odorant (Benzaldehyde 1/400 or Diacetyl 1/1000 dilution in ethanol) or 1 μl ethanol, and 1 μl 1M NaN3, were added to each circle. For gustatory assays, an agar plug containing 100 mM NaCl was added the night before to the assay plates and removed prior to assay. Assays were allowed to proceed for 30–60 min, after which point plates were moved to 4°C, to be counted later. The chemotaxis index was calculated as (number of animals in test circle−number of animals in control circle)/total number of animals that have left the starting area.
Heat-shock
Request a detailed protocolAnimals were raised at 20°C to reduce leaky expression from the hsp-16.41 heat-shock promoter. To induce heat-shock, parafilm-wrapped plates were submerged in a 34°C water bath for 30 min, and then recovered at 20°C for 10 hr.
Ca2+ imaging
Request a detailed protocolNeural imaging was performed as previously described (Flynn et al., 2020), with a 2× AZ-Plan Fluor objective (Nikon) on a Nikon AZ100 microscope fitted with ORCA-Flash4.0 digital cameras (Hamamatsu). Excitation light was provided from an Intensilight C-HGFI (Nikon), through a 438/24 nm filter and an FF458DiO2 dichroic (Semrock). Emission light was split using a TwinCam dual-camera adapter (Cairn Research) bearing a filter cube containing a DC/T510LPXRXTUf2 dichroic and CFP (483/32 nm) and YFP (542/27) filters. We acquired movies using NIS-Elements (Nikon), with 100 ms or 500 ms exposure time. YFP/CFP ratios in URX were reported by YC2.60 driven from the gcy-37 promoter, in BAG by YC3.60 and TN-XL driven from the flp-17 promoter, in AFD by YC3.60 driven from the gcy-8 promoter.
Single-neuron-type cell sorting and RNA sequencing
Request a detailed protocolWe used C. elegans lines in which neuronal types were labelled by expressing GFP under specific promoters: oxygen sensing neurons (gcy-37p), BAG (flp-17p), RMG (combination of ncs-1p::CRE and flp-21::loxP::STOP::loxP::GFP; Macosko et al., 2009), and AFD (gcy-8p). These markers were crossed into either npr-1(ad609) or npr-1(ad609); camt-1(ok515) backgrounds. C. elegans cells were dissociated and GFP-labelled neurons were sorted as described previously (Kaletsky et al., 2018). Briefly, C. elegans with GFP-labelled neurons were synchronized using the standard bleaching protocol 3 days before the cell sorting and the eggs were placed on 90 mm rich NGM plates (7.5 g peptone/liter) seeded with OP50. For each sample, we used >50,000 worms. Worms were washed three times with M9, prewashed, and then incubated for 6.5 min with 750 μl lysis buffer (0.25% SDS, 200 mM DTT, 20 mM HEPES pH 8.0, and 3% sucrose). The worms were then rapidly washed five times with M9. We dissociated the cells by adding 500 μl of Pronase (Roche) 20 mg/ml and by either pipetting up-and-down or stirring continuously for 12 min using a small magnetic stirrer. The pronase was inactivated by adding 500 μl of phosphate-buffered saline (PBS)+2% fetal bovine serum (FBO) (Gibco). The solutions were passed through a 5 μm pore size syringe filter (Millipore), and filtered cells were further diluted in PBS+2% FBS for sorting using a Sony Biotechnology Synergy High Speed Cell Sorter. Gates for detection were determined using cells prepared in parallel from non-fluorescent animals using the same protocol. An average of 3000 cells was collected for each library, and sorted directly into lysis buffer containing RNAse inhibitor (NEB E6420). cDNA libraries were made from RNA using NEB’s Next Single Cell/Low Input RNA Library Prep Kit for Illumina (NEB E6420). Libraries were sequenced on an Illumina HiSeq 4000 with single-end reads of 50 bases.
Confocal microscopy and image analysis
Request a detailed protocolYoung adult worms were mounted for microscopy on a 2% agar pad in 1 M sodium azide. Image analysis and fluorescence quantification were carried out using Fiji (ImageJ, Wayne Rasband, NIH). The expression pattern of CAMT-1(fosmid)-GFP was imaged as previously described (Flynn et al., 2020) on an Inverted Leica SP8 confocal microscope using a 63×/1.20 N.A. water-immersion objective. Lines expressing a cmd-1 transcriptional reporter (cmd-1p::gfp) and a red neuronal marker (either rab-3p::mCherry or rab-3p::cmd-1::SL2::mCherry) were imaged on an LSM800 inverted microscope (Zeiss) using a 63x/1.40 N.A. oil-immersion objective. The region between the two pharyngeal bulbs (Figure 7—figure supplement 1A) was imaged using stacks with a step size of 0.3 µm. A 3 µm section (10 images) around the middle of the pharynx was projected using the maximum projection method. Neurons were identified by thresholding the intensity of the red marker (mCherry). The neuronal regions overlapping with the pharynx or body wall muscles were excluded. The relative fluorescence in (Figure 7—figure supplement 1B) was defined as the GFP level in neurons minus background fluorescence divided by the level of fluorescence in the pharynx (metacorpus+isthmus+terminal bulb) minus background fluorescence.
Images of fly retinae were acquired using a Zeiss LSM800 microscope with a 20× objective. Only retinae oriented so that the long axis of the rhabdomeres was visible were selected for quantitative analysis. A representative region of the image, as shown in Figure 5D1’ and D2’, was thresholded to segment the rhabdomeres, and the mean fluorescence intensity was measured, corrected to the background fluorescence, and plotted.
Chromatin immunoprecipitation sequencing
Request a detailed protocolThe ChIP-seq protocol used is described in Wormbook (http://www.wormbook.org/chapters/www_chromatinanalysis/chromatinanalysis.html). Briefly, mixed-stage worms were grown in liquid culture, harvested, washed three times in PBS, and resuspended in PBS+Protease Inhibitor (PI, Sigma-Aldrich). Worm ‘popcorn’ was prepared by dripping worm solution into liquid nitrogen, and then hand ground to a fine powder. For each ChIP replicate we used 2.5 g of packed worms. Crosslinking was carried out by incubating samples in 1.5 mM EGS in PBS for 10 min, then adding 1.1% formaldehyde and incubating for a further 10 min. The reaction was quenched using 0.125 M glycine. The pellet was washed once in PBS+PMSF 1 mM and once in FA buffer (50 mM HEPES/KOH pH 7.5, 1 mM EDTA, 1% Triton X-100, 0.1% sodium deoxycholate, and 150 mM NaCl)+PI. The pellet was resuspended in 4 ml of FA buffer+PI+0.1% sarkosyl and sonicated using a Diagenode Bioruptor Plus with 40 cycles, 30 s on, 30 s off. The sample was then spun in a tabletop microcentrifuge at top speed (15,000 rpm) for 15 min. The supernatant was incubated with 1 μl of anti-GFP antibody from Abcam (Abcam Cat# ab290, RRID:AB_303395) overnight at 4°C. 60 μl of Protein A conjugated Dynabeads was added and the resulting solution incubated for 3 hr at 4°C. Pulldown, washing, and de-crosslinking steps were as described in http://www.wormbook.org/chapters/www_chromatinanalysis/chromatinanalysis.html. For preparing ChIP libraries, we used NEBNext Ultra II DNA Library Prep Kit for Illumina with half of the pulldown and 30 ng of input. DNA libraries were then sequenced on an Illumina HiSeq 4000 platform with single read of 50 bases.
RNA-seq and ChIP-seq data analyses
Request a detailed protocolRNA-seq data were mapped using PRAGUI—a Python 3-based pipeline for RNA-seq data analysis available at https://github.com/lmb-seq/PRAGUI (RRID:SCR_021692) . PRAGUI integrates RNA-seq processing packages including Trim Galore, FastQC, STAR, DESeq2, HTSeq, Cufflinks, and MultiQC. Output from PRAGUI was analyzed using PEAT—Pragui Exploratory Analysis Tool (https://github.com/lmb-seq/PEAT; RRID:SCR_021691) to obtain the list of differentially expressed genes with a false discovery rate<0.05. The Venn diagram was drawn using the online tool http://bioinformatics.psb.ugent.be/webtools/Venn/.
ChIP-seq data were analyzed using a nucleome processing and analysis toolkit that contains an automated ChIP-seq processing pipeline using Bowtie2 mapping and MACS2 peak calling. The software is available on Github at https://github.com/tjs23/nuc_tools (Stevens, 2021). Comparisons between different ChIP-seq conditions were carried out using the DiffBind package (Stark and Brown, 2011). ChIP-seq processed data were visualized using IGV (Robinson et al., 2011; Thorvaldsdóttir et al., 2013).
Fly genetics
Request a detailed protocol(w1188), (w1118; cn1, tes2/cyo), and (w1118; cro/cyo; sb/TM3 ser) flies were generously obtained from Daria Siekhaus (IST Austria), Hong-Sheng Li (UMass), and Daisuke Yamamoto (NICT), respectively. cn1 flies were obtained from the Bloomington Drosophila Stock Center (NIH P40OD018537). These flies were crossed to obtain w1118; cn1 and w1118; sb control flies.
Quantitative PCR
Request a detailed protocolqPCR was performed using the Janus Liquid Handler (PerkinElmer) and a LightCycler 480 system (Roche). Total RNA was extracted from the heads of 20 male adults or 17 female adults using a Monarch Total RNA Miniprep Kit (NEB). Three replicates for male and three replicates for female flies were done for each genotype. RNA was reverse transcribed into cDNA using an ImProm-II Reverse Transcription System (Promega). cDNA was mixed with Luna Universal qPCR Master Mix (NEB). RpL32 (rp49) was amplified as an internal control. Primer sequences for Rpl32 and CAMTA were identical to those used in Sato et al., 2019. CaM was amplified using the primer pair 5′-TGCAGGACATGATCAACGAG-3′ (forward) and 5′-ATCGGTGTCCTTCATTTTGC-3′ (reverse). Data processing was performed using LightCycler Software (Roche).
Western blot
Request a detailed protocolProtein from the heads of ~50 female and 60 male adult flies were extracted using RIPA buffer (150 mM NaCl, 1% NP40, 0.5% sodium deoxycholate, 0.1% SDS, 50 mM Tris-HCl, pH 8.0, and PIs). Three replicates for male and three replicates for female flies were performed for each genotype. After SDS-PAGE using Bolt 4–12% Bis-Tris Plus gels (Thermo Fisher Scientific), protein was transferred to PVDF membrane (0.45-µm pore size, Thermo Fisher Scientific) using the TE 22 Mighty Small Transfer Unit (Amersham Biosciences). Membranes were blocked with casein blocking buffer (1% Hammersten casein, 20 mM Tris-HCl, and 137 mM NaCl) for 1 hr, then incubated with primary antibody overnight at 4°C, followed by secondary antibody for 1 hr at RT. Unbound antibody was washed away with TBS-T or TBS (3× for 5 min). α-tubulin was used as an internal control. The following commercially available antibodies were used: anti-CaM (Abcam Cat# ab45689, RRID:AB_725815, diluted 1/500), anti-α-tubulin (Abcam Cat# ab40742, RRID:AB_880625, diluted 1/5000), goat anti-rabbit StarBright Blue 700 (Bio-Rad Cat# 12004161, RRID:AB_2721073, diluted 1/5000), and goat anti-mouse StarBright Blue 520 (Bio-Rad, 12005867, diluted 1/5000). Blots were imaged using the Chemidoc MP Imaging System (Bio-Rad).
Immunostaining
Request a detailed protocolIsolated retinae were dissected into ice-cold PBS, then fixed for 1 hr at 4℃ in 4% paraformaldehyde in PBS. Retinae were then rinsed in PBT (PBS, 0.5% Triton X-100) and incubated in the same solution for 3 days at 4℃ to wash out eye pigments, then blocked in PBT+10% Normal Goat Serum for 15–20 min. Retinae were subsequently incubated in primary antibodies mouse anti-CaM 1:200 (Invitrogen MA3-918, RRID:AB_325501) 1:200 at 4℃ for 3 days. After several washes in PBT, retinae were incubated with secondary antibodies (1:500 goat anti-mouse: Alexa Fluor 546, A-11030, RRID:AB_2534089) for 3 days at 4°C. Retinae were again washed three times for 15 min, with DAPI 1:1000 Thermo Fisher Scientific 62248 included in the second wash, mounted in Vectashield.
Statistical tests
Request a detailed protocolStatistical tests were two-tailed and were performed using Matlab (MathWorks, MA), GraphPad Prism (GraphPad Software, CA, RRID:SCR_002798), or R (R Foundation for Statistical Computing, Vienna, Austria, RRID:SCR_001905, http://www.R-project.org/). Measurements were done from distinct samples.
Data availability
Sequencing data have been deposited in GEO under accession codes GSE164671.
-
NCBI Gene Expression OmnibusID GSE164671. Transcriptional control of CALMODULIN by CAMTA regulates neural excitablity.
References
-
CRISPR/Cas9 Methodology for the Generation of Knockout Deletions in Caenorhabditis elegansG3: Genes, Genomes, Genetics 9:135–144.https://doi.org/10.1534/g3.118.200778
-
Calcium-binding proteins in the nervous systemTrends in Neurosciences 15:303–308.https://doi.org/10.1016/0166-2236(92)90081-I
-
The many faces of calmodulin in cell proliferation, programmed cell death, autophagy, and CancerBiochimica Et Biophysica Acta (BBA) - Molecular Cell Research 1843:398–435.https://doi.org/10.1016/j.bbamcr.2013.10.021
-
A novel family of Calmodulin-binding transcription activators in multicellular organismsJournal of Biological Chemistry 277:21851–21861.https://doi.org/10.1074/jbc.M200268200
-
Tonic signaling from O2 sensors sets neural circuit activity and behavioral stateNature Neuroscience 15:581–591.https://doi.org/10.1038/nn.3061
-
Calmodulin: a prototypical calcium sensorTrends in Cell Biology 10:322–328.https://doi.org/10.1016/S0962-8924(00)01800-6
-
Isolation of a Calmodulin-binding transcription factor from rice (Oryza sativa L.)Journal of Biological Chemistry 280:40820–40831.https://doi.org/10.1074/jbc.M504616200
-
Calmodulin as a direct detector of Ca2+ signalsNature Neuroscience 14:301–304.https://doi.org/10.1038/nn.2746
-
Calmodulin-binding transcription activator 1 (CAMTA1) alleles predispose human episodic memory performanceHuman Molecular Genetics 16:1469–1477.https://doi.org/10.1093/hmg/ddm097
-
Functional analysis of the single calmodulin gene in the nematode Caenorhabditis elegans by RNA interference and 4-D microscopyEuropean Journal of Cell Biology 82:557–563.https://doi.org/10.1078/0171-9335-00347
-
A FRET-based calcium biosensor with fast signal kinetics and high fluorescence changeBiophysical Journal 90:1790–1796.https://doi.org/10.1529/biophysj.105.073536
-
Overexpression of calmodulin induces cardiac hypertrophy by a calcineurin-dependent pathwayBiochemical and Biophysical Research Communications 338:1299–1305.https://doi.org/10.1016/j.bbrc.2005.10.083
-
Calmodulin as an ion channel subunitAnnual Review of Physiology 64:289–311.https://doi.org/10.1146/annurev.physiol.64.100301.111649
-
Spatial diffusivity and availability of intracellular calmodulinBiophysical Journal 95:6002–6015.https://doi.org/10.1529/biophysj.108.138974
-
Large-Scale Screening for Targeted Knockouts in the Caenorhabditis elegans GenomeG3: Genes, Genomes, Genetics 2:1415–1425.https://doi.org/10.1534/g3.112.003830
-
Integrative genomics viewer (IGV): high-performance genomics data visualization and explorationBriefings in Bioinformatics 14:178–192.https://doi.org/10.1093/bib/bbs017
-
Regulation of transcription factors by neuronal activityNature Reviews Neuroscience 3:921–931.https://doi.org/10.1038/nrn987
-
A Calmodulin-binding/CGCG box DNA-binding protein family involved in multiple signaling pathways in plantsJournal of Biological Chemistry 277:45049–45058.https://doi.org/10.1074/jbc.M207941200
-
CaMKII isoforms in learning and memory: localization and functionFrontiers in Molecular Neuroscience 11:445.https://doi.org/10.3389/fnmol.2018.00445
Article and author information
Author details
Thanh Thi Vuong-Brender

Funding
Wellcome (209504/A/17/Z)
- Mario de Bono
European Research Council (269058 ACMO)
- Mario de Bono
H2020 Marie Skłodowska-Curie Actions (754411)
- Thanh Thi Vuong-Brender
Medical Research Council (Studentship)
- Sean Flynn
The funders had no role in study design, data collection and interpretation, or the decision to submit the work for publication.
Acknowledgements
The authors thank the MRC-LMB Flow Cytometry facility and Imaging Service for support, the Cancer Research UK Cambridge Institute Genomics Core for Next Generation Sequencing, Julie Ahringer and Alex Appert for advice and technical help for ChIP-seq experiments, Paula Freire-Pritchett, Tim Stevens, and Gurpreet Ghattaoraya for RNA-seq and ChIP-seq analyses, Nikos Chronis for the TN-XL plasmid, Hong-Sheng Li and Daisuke Yamamoto for generously sending the tes2 and cro mutants, Daria Siekhaus for hosting the fly work, Michaela Misova for technical assistance. The authors are very grateful to Salihah Ece Sönmez for teaching us how to dissect, mount and stain Drosophila retinae. This work was supported by an Advanced ERC grant (269058 ACMO) and a Wellcome Investigator Award (209504/Z/17/Z) to MdB, and an IST Plus Fellowship to TV-B (Marie Sklodowska-Curie Agreement no 754411).
Version history
- Preprint posted: September 15, 2020 (view preprint)
- Received: March 9, 2021
- Accepted: August 28, 2021
- Version of Record published: September 9, 2021 (version 1)
- Version of Record updated: September 17, 2021 (version 2)
Copyright
© 2021, Vuong-Brender et al.
This article is distributed under the terms of the Creative Commons Attribution License, which permits unrestricted use and redistribution provided that the original author and source are credited.
Metrics
-
- 1,176
- Page views
-
- 138
- Downloads
-
- 2
- Citations
Article citation count generated by polling the highest count across the following sources: Crossref, PubMed Central, Scopus.
Download links
A two-part list of links to download the article, or parts of the article, in various formats.
Downloads (link to download the article as PDF)
Open citations (links to open the citations from this article in various online reference manager services)
Cite this article (links to download the citations from this article in formats compatible with various reference manager tools)
Neuronal calmodulin levels are controlled by CAMTA transcription factors
eLife 10:e68238.
https://doi.org/10.7554/eLife.68238
Further reading
-
- Genetics and Genomics
The ‘diabetic bone paradox’ suggested that type 2 diabetes (T2D) patients would have higher areal bone mineral density (BMD) but higher fracture risk than individuals without T2D. In this study, we found that the genetically predicted T2D was associated with higher BMD and lower risk of fracture in both weighted genetic risk score (wGRS) and two-sample Mendelian randomization (MR) analyses. We also identified ten genomic loci shared between T2D and fracture, with the top signal at SNP rs4580892 in the intron of gene RSPO3. And the higher expression in adipose subcutaneous and higher protein level in plasma of RSPO3 were associated with increased risk of T2D, but decreased risk of fracture. In the prospective study, T2D was observed to be associated with higher risk of fracture, but BMI mediated 30.2% of the protective effect. However, when stratified by the T2D-related risk factors for fracture, we observed that the effect of T2D on the risk of fracture decreased when the number of T2D-related risk factors decreased, and the association became non-significant if the T2D patients carried none of the risk factors. In conclusion, the genetically determined T2D might not be associated with higher risk of fracture. And the shared genetic architecture between T2D and fracture suggested a top signal around RSPO3 gene. The observed effect size of T2D on fracture risk decreased if the T2D-related risk factors could be eliminated. Therefore, it is important to manage the complications of T2D to prevent the risk of fracture.
-
- Genetics and Genomics
The color pattern of insects is one of the most diverse adaptive evolutionary phenotypes. However, the molecular regulation of this color pattern is not fully understood. In this study, we found that the transcription factor Bm-mamo is responsible for black dilute (bd) allele mutations in the silkworm. Bm-mamo belongs to the BTB zinc finger family and is orthologous to mamo in Drosophila melanogaster. This gene has a conserved function in gamete production in Drosophila and silkworms and has evolved a pleiotropic function in the regulation of color patterns in caterpillars. Using RNAi and clustered regularly interspaced short palindromic repeats (CRISPR) technology, we showed that Bm-mamo is a repressor of dark melanin patterns in the larval epidermis. Using in vitro binding assays and gene expression profiling in wild-type and mutant larvae, we also showed that Bm-mamo likely regulates the expression of related pigment synthesis and cuticular protein genes in a coordinated manner to mediate its role in color pattern formation. This mechanism is consistent with the dual role of this transcription factor in regulating both the structure and shape of the cuticle and the pigments that are embedded within it. This study provides new insight into the regulation of color patterns as well as into the construction of more complex epidermal features in some insects.


