Article

Traditional Free-Ranging Livestock Farming as a Management Strategy for Biological and Cultural Landscape Diversity: A Case from the Southern Apennines

by
Claudia Troiano
1,
Maria Buglione
2,
Simona Petrelli
2,
Sofia Belardinelli
1,
Antonino De Natale
2,
Jens-Christian Svenning
3,4 and
Domenico Fulgione
2,*
1
Department of Humanities, University of Naples Federico II, Via Porta di Massa 1, 80133 Naples, Italy
2
Department of Biology, University of Naples Federico II, Via Cupa Nuova Cinthia 26, 80126 Naples, Italy
3
Section for Ecoinformatics & Biodiversity, Department of Biology, Aarhus University, Ny Munkegade 114, 8000 Aarhus, Denmark
4
Center for Biodiversity Dynamics in a Changing World (BIOCHANGE), Department of Biology, Aarhus University, Ny Munkegade 114, 8000 Aarhus, Denmark
*
Author to whom correspondence should be addressed.
Land 2021, 10(9), 957; https://doi.org/10.3390/land10090957
Submission received: 12 August 2021 / Revised: 2 September 2021 / Accepted: 6 September 2021 / Published: 9 September 2021
(This article belongs to the Section Landscape Ecology)

Abstract

:
Mediterranean mountain landscapes are undergoing a widespread phenomenon of abandonment. This brings, as a consequence, the loss of traditional land use practices, such as transhumant pastoralism, as well as shrub and wood encroachment, with repercussions on the biodiversity associated with semi-open, human-managed landscapes. In this study, we focus on a mountain pasture from the Southern Apennines (Italy), where free-ranging transhumant grazing is still carried out, to quantify the effects of grazing presence and exclusion on arthropod diversity, and to qualitatively characterize the plant communities of grazed and ungrazed areas. Using field sampling, remote sensing, and semi-structured interviews, we assessed the validity of traditional cattle farming as a landscape management tool. Indeed, high diversity grasslands excluded from grazing were characterized by significantly less even and more dominated arthropod communities, as well as fewer plant species and families. Moreover, in areas that have been consistently grazed over the years, we found no forest encroachment from 1955 to 2019. However, rural communities are experiencing difficulties in keeping local traditions alive, even with current agri-environmental schemes. Thus, traditional livestock grazing can be a valuable management tool to maintain high biological and cultural diversity, even if stronger cooperation and attention to local needs is necessary.

1. Introduction

The current period is characterized by dramatic losses of biodiversity [1] and strong ecological changes [2,3] with effects—direct and/or indirect—on both animal and plant species [4,5,6].
The long history of interaction between humans and their environment has generated a co-evolution of Mediterranean landscapes in the past millennia [7,8,9]. During this period, different phases have alternated, but human presence was constant [10,11].
Nowadays, many of these landscapes involve protected ecological habitats, defined by the Habitats Directive (Council Directive 92/43/EEC), as well as cultural landscapes, some of which are considered protected by UNESCO [12] and Category V of the IUCN Protected Areas [13].
These habitats are characterized by high levels of both biodiversity and cultural heritage because of the connection with the people who inhabit them [9,14,15,16], making the Mediterranean basin a Global Biodiversity Hotspot [17]. Some examples of such landscapes are the mountain pastures of the Apennines [18,19], which show a profound connection with typical local traditions like pastoralism, dating back to 6000 years BP [20,21], and transhumance, the practice of seasonal droving of livestock from the lowlands to the uplands (and vice versa), which was recently inscribed on the UNESCO Representative List of the Intangible Cultural Heritage of Humanity [22].
This gives the Apennines, with their broad extent (35% of the Italian peninsula, together with the Alps) [18], the number of small towns and rural sites it hosts, and the presence of protected areas [23], an important role for culture, economy, as well as biodiversity in Italy. Indeed, the periodical presence of different types of livestock, which have diversified grazing and trampling strategies, influences plant communities in pastures, contributing to maintaining high levels of plant diversity [24,25]. Grazing can also help maintain the balance between grasslands and forests in the landscape [26,27] and maintain active ecotones at the margin with wooded areas, through plant dispersal via animals [28,29]. This, in turn, may have an effect on animal communities closely tied to vegetation, such as arthropods [30,31], bats [32], or hares [33], which directly benefit from the effects of free-ranging livestock, as well as on predators like wolves [34].
However, the Apennine mountains have been undergoing a strong and increasing depopulation phenomenon since the end of World War II [9,23,35,36]. The gradual shift of human activities to the lowlands and the cities is followed by a decrease in livestock farming and limited use of wooded areas [37,38]. This causes landscape structure simplification in most cases [18,39,40,41] and an increase in forest cover [19] as a consequence of the absence of large herbivores in secondary grasslands, which favors the advancement of vegetational succession and shrub encroachment [24,25,42]. While it can be argued that some bird communities are favored and can adapt to rural abandonment [43,44], the disruption of the species network can have negative effects [45,46] to the detriment of landscape heterogeneity and biodiversity [36,47,48,49] established by human activities in historical times.
These profound landscape changes have also resulted in a decrease in grazing resources, which are fundamental for the supply of livestock [50], and have favored the spreading of opportunistic species that took advantage of this uniformity. One example is the demographic explosion of wild boar (Sus scrofa) [51,52], exacerbated by farmland abandonment [53], which, among other things, causes significant economic losses and health risks for livestock in the form of zoonosis [54,55], but also negatively affects plant and animal communities [56].
Furthermore, in the last decades, widespread rural depopulation has induced the loss of different human activities tied to agriculture, traditions, festivals, and pastoralism [23,57,58], as well as loss of cultural identity [59,60] and of desirability of abandoned and unmanaged landscapes, which are perceived to be “less natural” [61]. Thus, the phenomenon of rural abandonment is doubly impactful, on both the natural as well as the cultural diversity of mountainous regions.
In fact, traditional practices not only recognize local communities, providing economic support as well as a cultural identity [62], but the knowledge of these practices is also a valuable tool [63] to maintain the disturbance regimes necessary to preserve and boost biodiversity [28] and to minimize conflicts between the use of environmental resources and landscape conservation [64], particularly in mountain landscapes [65] that are dependent on human management through these activities [47,66].
Here, we focused on an area of the Southern Apennines, where traditional free ranging livestock farming and transhumance are still carried out, to test the effectiveness of both cattle grazing and the cultural aspects involved with it as a management tool to maintain ecosystem biodiversity, while simultaneously including local communities in conservation efforts. In addition, we looked at how effectively grazing can keep the margin of the woodland from encroaching on the grassland.
Finally, to complete the picture of both biological and cultural diversity, we enriched field data with valuable information from informal interviews with the shepherds who live and work in the area, often going back generations. This to infer on how the landscape and the traditional herding activity might have changed in the past decades, as well as the difficulties they encounter in a 21st century socio-economic context.

2. Materials and Methods
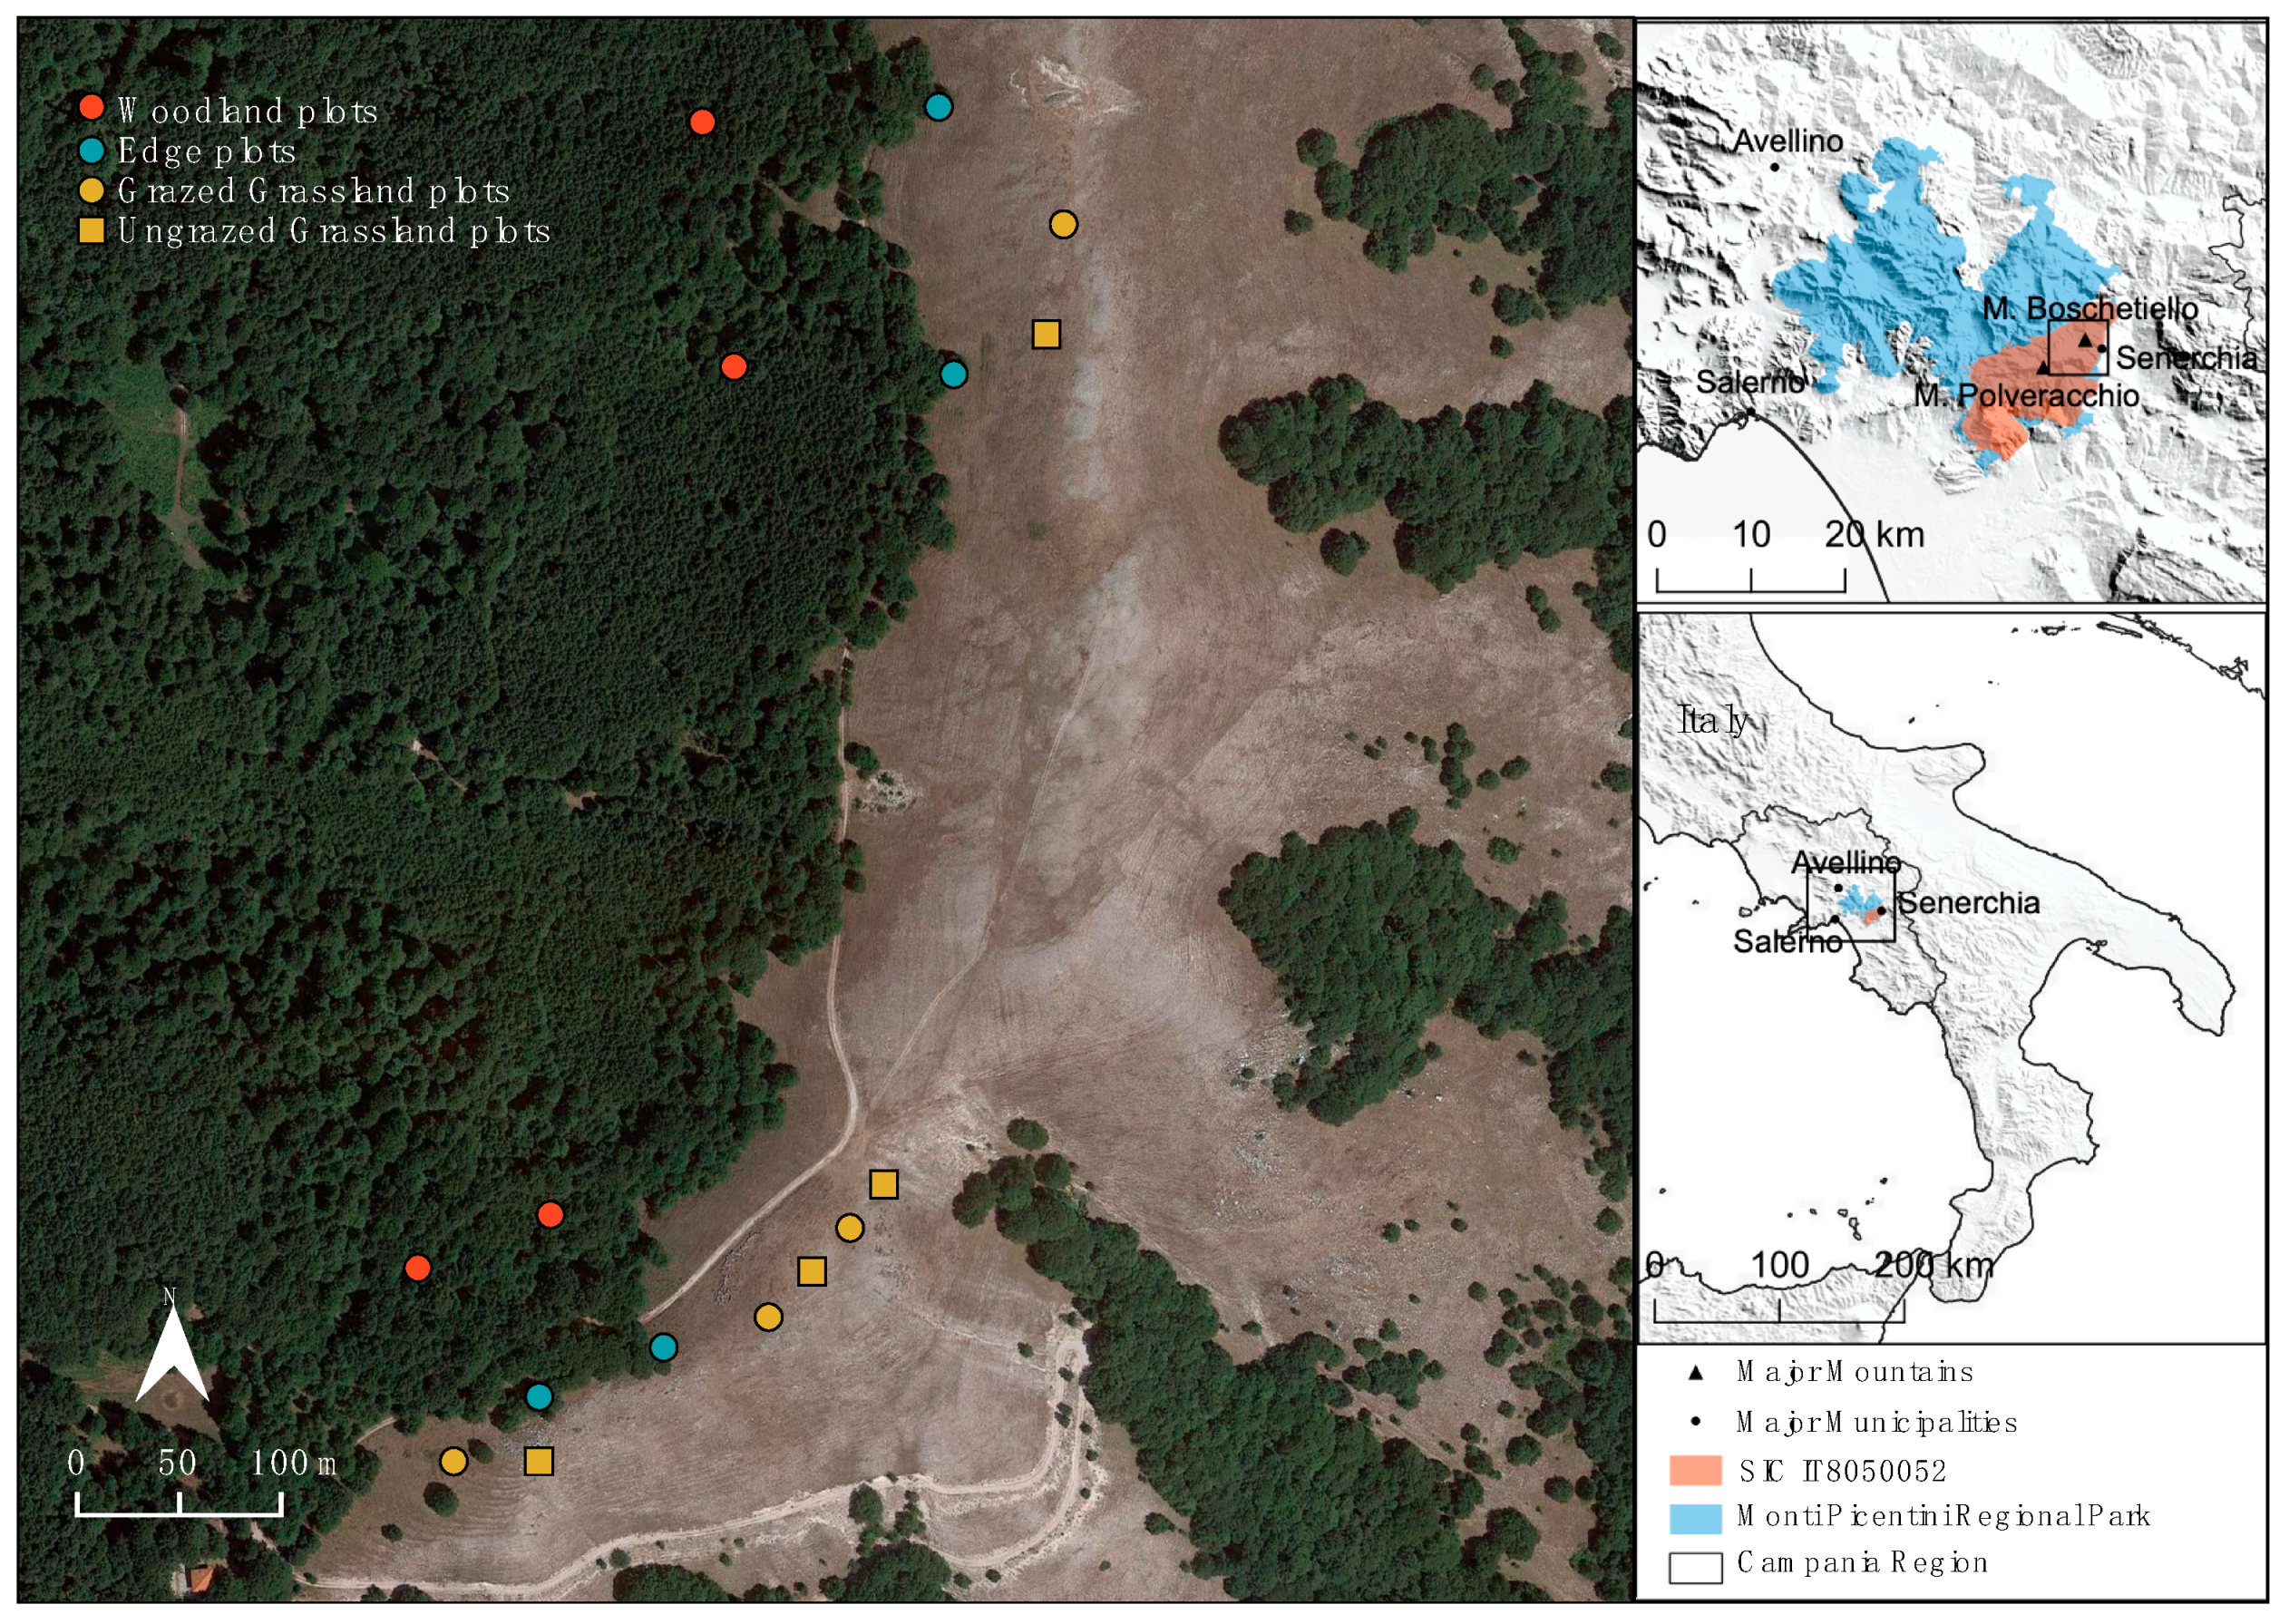
2.1. Study Area

The study area is a mountain pasture on Mount Boschetiello (40°45′ N, 15°11′ E) in the Southern Apennines (Italy), at 1450 m above sea level (m a.s.l.) (Figure 1). It is part of the Monti Picentini Regional Park and of a Natura 2000 site (SIC IT8050052), encompassing habitats of importance as defined by the Habitats Directive (Council Directive 92/43/EEC), such as habitat 6210 (semi-natural dry grasslands and scrubland facies on calcareous substrates-Festuco-Brometalia) and 9210 (Apennine beech forests with Taxus and Ilex).
We selected a semi-natural grassland area characterized by species-rich habitats with a long-standing relationship with grazing [67], in which we steered the grazing activity, evaluating the differential effects it might have on the biotic richness.
The area is characterized by a beech (Fagus sylvatica) forest with limestone bedrock, interspersed with alders (Alnus cordata) as well as shrub species of the Rosaceae family (i.e., Rosa canina) and secondary origin grasslands, mainly of meadow brome, and with clearings composed mainly by Poaceae, Fabaceae, and Cyperaceae.
The climate is typically Mediterranean (annual precipitation of 420 mm), with short periods of snowfall in winter.
The area is seasonally grazed by free-ranging cattle of the Podolica breed, brought up by cattle farmers to the summer pastures in June, and down to the winter pastures in November, following the ancient practice of transhumance. Grazing density is around 0.27 livestock units/ha. Occasionally, sheep, goats, and horses also graze the pasture.
We chose this site after a general survey that revealed a diverse landscape, with both species linked to a forested habitat, such as wolf (Canis lupus italicus), wild boar (Sus scrofa), tawny owl (Strix aluco), Eurasian sparrowhawk (Accipiter nisus), common cuckoo (Cuculus canorus), black redstart (Phoenicurus ochruros), common chiffchaff (Phylloscopus collybita), Eurasian blackcap (Sylvia atricapilla), and common chaffinch (Fringilla coelebs); as well as species linked to more open areas, like the European hare (Lepus europaeus), lesser kestrel (Falco naumanni), Eurasian skylark (Alauda arvensis), black kite (Milvus migrans), kestrel (Falco tinnunculus), and buzzard (Buteo buteo).

2.2. Experimental Design

To explore the biodiversity trend along the vegetational pattern (woodland, edge, and grassland), we set up 12 plots of around 30 m2—4 in the woodland, 4 in the grassland, and 4 along the edge (Figure 1). Census efforts were performed in 2019 and 2020. The first sampling season took place in July and October 2019, with two different sampling sessions, after the cattle was brought up to the area. In 2020, two sampling sessions were carried out, in June and late July. Then, to evaluate the effects of grazing activity on grassland biodiversity, we set up four freely grazed grassland plots and, to exclude grazers, four plots fenced with beech wooden poles, 1.5 m tall and underground for 0.3 m, with a barbed wire cable tied around to delineate an area measuring 30 m2.

2.3. Arthropod Sampling

Sampling focused on ground-dwelling arthropods as they can be good indicators in studies concerning disturbing regimes in grasslands [30,31,68] and involved both sweep-netting and pitfall trapping.
To sample the arthropods, in each plot, 2 × 50 sweeps were made along the same perpendicular directions using a heavy-duty sweep net, and two pitfall traps were installed. The latter consisted of 300 mL plastic cups, filled with 40 mL of vinegar [68], deployed for 20–24 h before collection.
Samples were stored in 50 mL falcon tubes with 70% ethanol and then identified at the order level [68], based on morphological characteristics and dichotomous keys [31], using a Leica EZ4 stereomicroscope.

2.4. Floristic Characterization

We performed a qualitative floristic survey of grazed and ungrazed plots to highlight potential direct differences in the composition of the plant community. Vegetation sampling was carried out both by sight and by collecting representative specimens of all the species in the area. The samples were stored in strong plastic bags, with the help of pruning shears. Only plants with mature parts, free of insect damage, rust, or disease, were collected, retaining as much of the root system as possible and removing excess soil. Specimens were dried, mounted on standard sheets, and kept in the Herbarium for their identification at the species level, when possible.
Subsequently, to compare the two communities, we considered the following functional traits: Raunkiær life form [69], life span, pollen vector, dispersal method, and the presence/absence of animal dispersal. Traits were obtained from BiolFlor [70], The Ecological Flora of the British Isles [71], Ellenberg values for Italian Flora [72], LEDA traitbase [73], and BROT [74] databases, accessed through the R package TR8 [75]. Data for missing species were compiled based on expert opinion. Species with more than one dispersal method were classified as polychorous and were considered to be dispersed by animals, along with exclusively zoochorous species.

2.5. Data Analysis

For each plot, arthropod abundances from the sweeps and pitfall traps were pooled. We then estimated the alpha diversity of arthropod communities in the different habitat types along the vegetational gradient (woodland, edge, and grassland). In particular, we considered richness (S); both the Simpson index (1-D) [76]—representing the variance of the abundance distribution—and Shannon index (H) [77] as indices of evenness, as the Simpson index can provide good estimates even at smaller sample sizes [78]; and the Berger–Parker index (d) [79] as an index of dominance, using the Past 4.03 software [80]. To test for significant differences between woodland, edge, and grassland plots, we performed a Kruskal–Wallis test, followed by pairwise Wilcoxon tests, using the software R [81].
Furthermore, we investigated differences in beta diversity by performing a non-metric multidimensional scaling (NMDS) ordination in three dimensions, following a square root transformation of the abundances and using the Bray–Curtis dissimilarity index [82]. Statistically significant differences between the habitat types were tested with one-way PERMANOVA in Past 4.03.
To better understand differences in communities driven by grazing, and the effect on arthropod diversity, we then compared grazed and ungrazed plots in the grassland. We calculated the same alpha diversity indices as for the habitat comparison and performed an NMDS ordination in two dimensions, after square root transforming the abundances and using the Bray–Curtis dissimilarity index. Statistical significance was assessed via Wilcoxon tests in R and a one-way PERMANOVA in Past 4.03, respectively.
For the floristic data, we compared the plant species and families, producing Venn diagrams, with the Venn Diagram Tool freely available online (https://bioinformatics.psb.ugent.be/webtools/Venn/, accessed on 1 February 2021), to count items present only in grazed or ungrazed plots, as well as items in common. We then compared selected functional trait categories (life form, life span, pollen vector, dispersal, and the presence of animal dispersal) between the community exclusive to grazed plots and to ungrazed plots, by calculating the frequency of occurrence of the traits in each category.

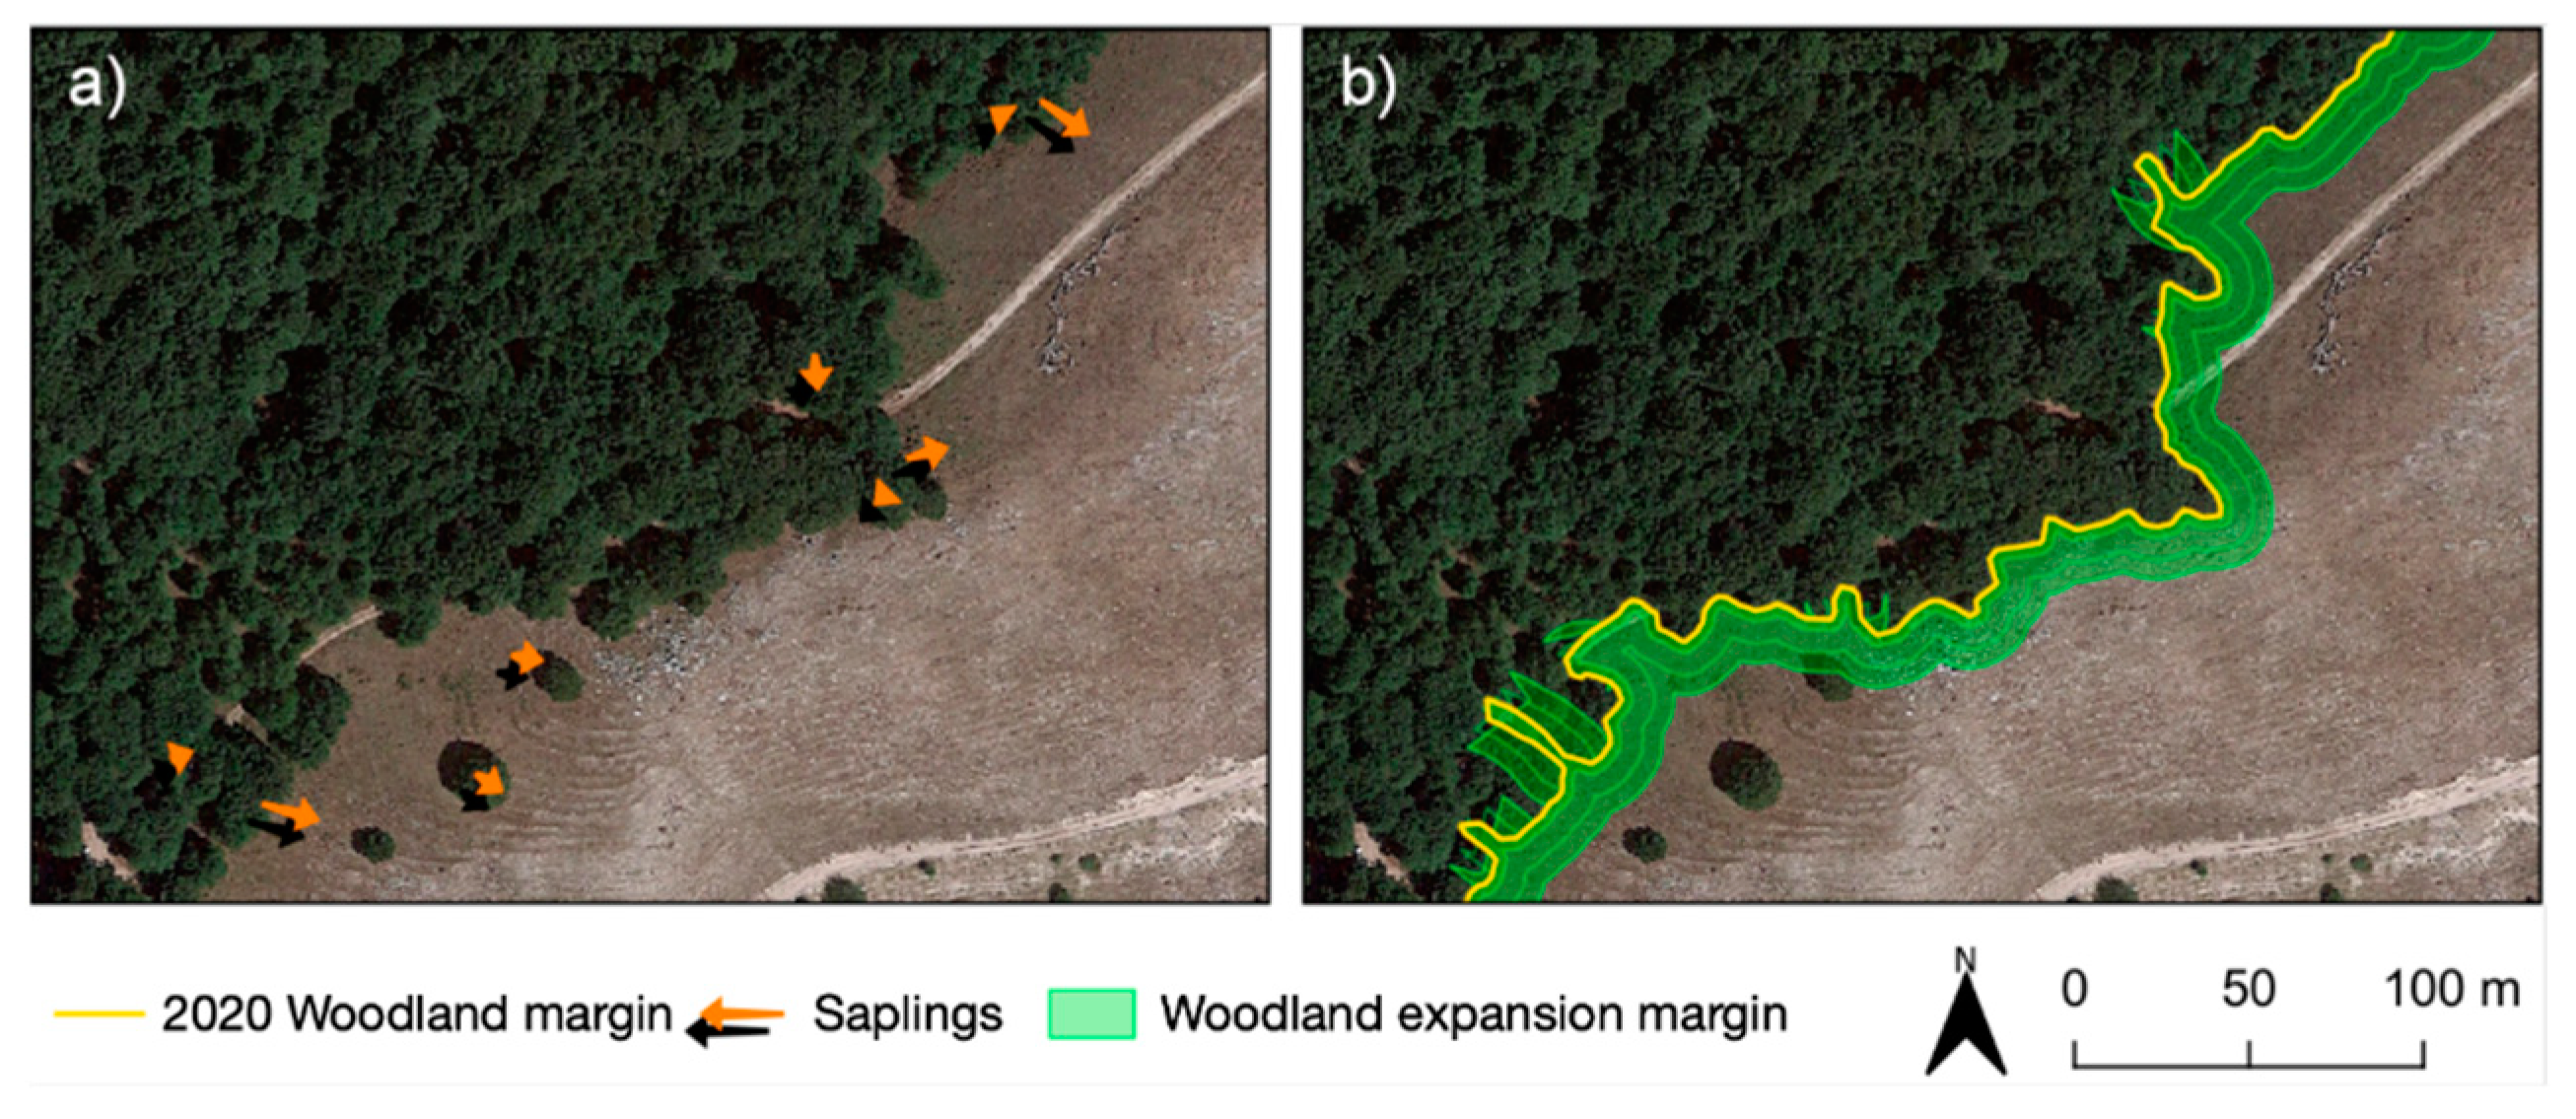
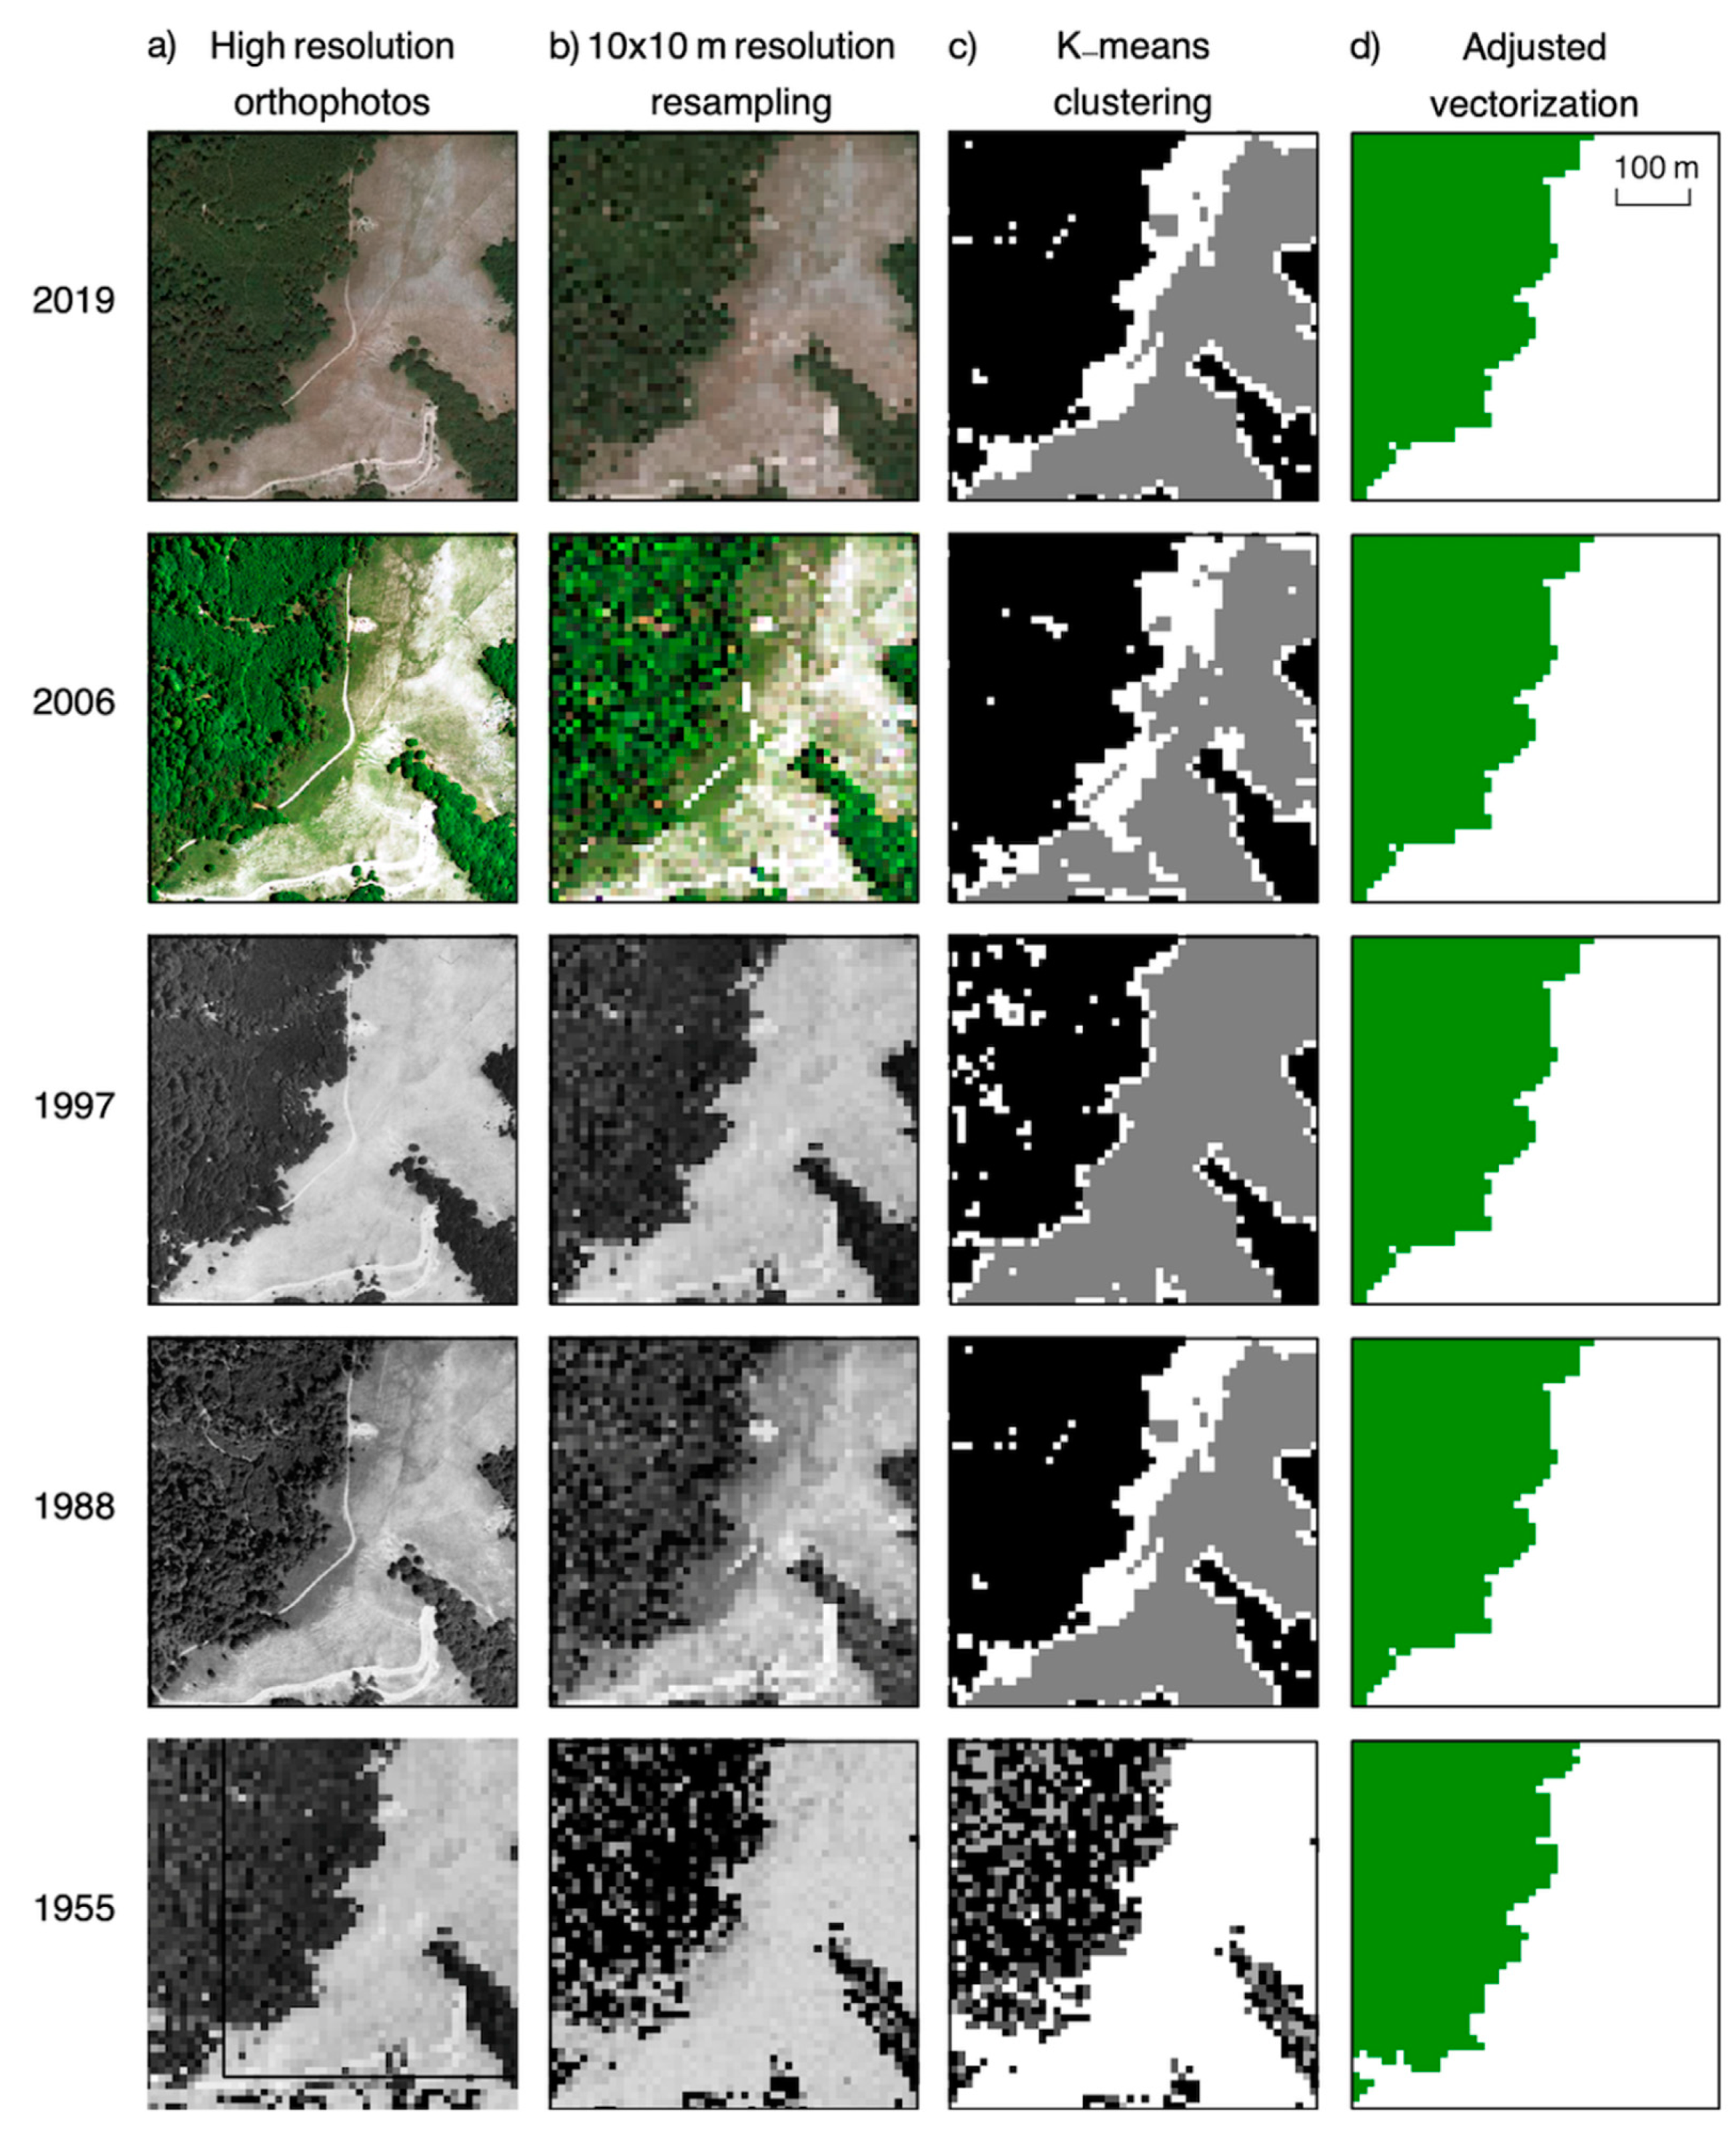
2.6. Forest Margin Expansion

To investigate the effect of livestock grazing on the expansion of the forest edge, we firstly surveyed and geolocalized the presence of tree seedlings along the expansion margin of the forest towards the grassland, measuring the distance of each seedling to the nearest adult tree of the same species. Subsequently, in a GIS environment, these distances were used to draw a “spreading buffer” defined as the average distance from the forest margin, which was manually traced in QGIS 3.10 (http://qgis.osgeo.org, accessed on 30 June 2019) using current high-resolution satellite imagery as a reference.
We then obtained high resolution orthophotos from 2019 (via Google Earth), 2006, 1997, and 1988 (downloaded from the National Geoportal—https://www.pcn.minambiente.it, accessed on 30 June 2019), as well as an aerial photograph from 1955 (purchased from the Military Geographic Institute —https://www.igmi.org, accessed on 12 September 2019—and manually georeferenced in QGIS).
Based on the mean distance of the seedlings sampled, we considered a resolution of 10 m to be enough to assess the eventual presence of new trees, and thus resampled the images to this resolution and then classified the pixels in three categories, using the K-means clustering for grids algorithm in SAGA [83], in order to trace the woodland profile and compare it across the decades.
The clusters were vectorized and manually corrected using the high-resolution orthophotos as a reference and assigned to two classes (covered and open areas), considering the beech forest as a closed forest and discarding internal patches. Wooded areas to the bottom right of the pasture were not considered as they are placed on a very steep slope and images were subject to distortion, making precise pixel assignment difficult. This problem was also encountered with the aerial image from 1955, which, after classification, was manually realigned to the other images, even though some distortion was inevitable. Finally, we calculated the area occupied by the considered wooded zone to see whether any variation was detected in time.

2.7. Interviews

Traditional practices were assessed with informal semi-structured interviews with cattle farmers, shepherds, and administrative employees who help manage the areas within the park (as well as farm livestock to some extent). Information on demographics, type of farming, and agri-environmental schemes adopted is reported in Table 1.
In total, 20 livestock farmers and 5 administrative employees were interviewed, and the interviews lasted around one hour [36]. Answers were converted to a three-point Likert scale (1 = disagree; 2 = neutral; 3 = agree) [84] for 10 statements. Cronbach’s alpha was calculated in R to measure internal consistency.

3. Results

3.1. Animal Diversity in the Pastures

The comparison of alpha diversity in the arthropod communities along the habitat gradient (Figure 2a–d) revealed significantly higher values for the Simpson and Shannon indices (p = 0.029) for grassland plots compared with woodland plots, while the Berger–Parker index depicts a completely opposite trend. None of the descriptors identified the edge as the most diverse habitat. Plots in the edge showed a greater richness, although it was not statistically significant.
The multivariate analysis on communities from three different environments (using NMDS and considering the first two dimensions) represented a good ordination of the data (Figure 2e). The plot stress value was 0.071, and it displayed a strong separation of plots belonging to the three habitat types, with a significant difference between all habitat types (p = 0.0001) as well as significant pairwise differences between the habitats (grassland vs. edge: p = 0.028, edge vs. woodland: p = 0.032, grassland vs. woodland: p = 0.027).
The grazing effect on grassland diversity was represented by a significant difference in the Simpson index and Berger–Parker index between grazed and ungrazed plots (Figure 3a–d), with grazed plots showing a significantly higher value of Simpson’s index (0.74 ± 0.02 of the grazed plots vs. 0.66 ± 0.05 of the ungrazed plots, p = 0.029) and a significantly lower Berger–Parker value (0.38 ± 0.04 of the grazed plots vs. 0.52 ± 0.07 of the ungrazed plots, p = 0.029), indicating a community structure that is richer and more equally distributed among the orders of arthropods. Values for Shannon’s index (1.53 ± 0.07 for grazed plots and 1.35 ± 0.13 for ungrazed plots) and richness (6.5 ± 1 vs. 6.0 ± 0.82 for grazed and ungrazed plots, respectively) did not show a significant difference. The NMDS in two dimensions (Figure 3e) was a good ordination (with a stress value of 0.087), and showed a slight, albeit not significant separation of grazed and ungrazed plots.

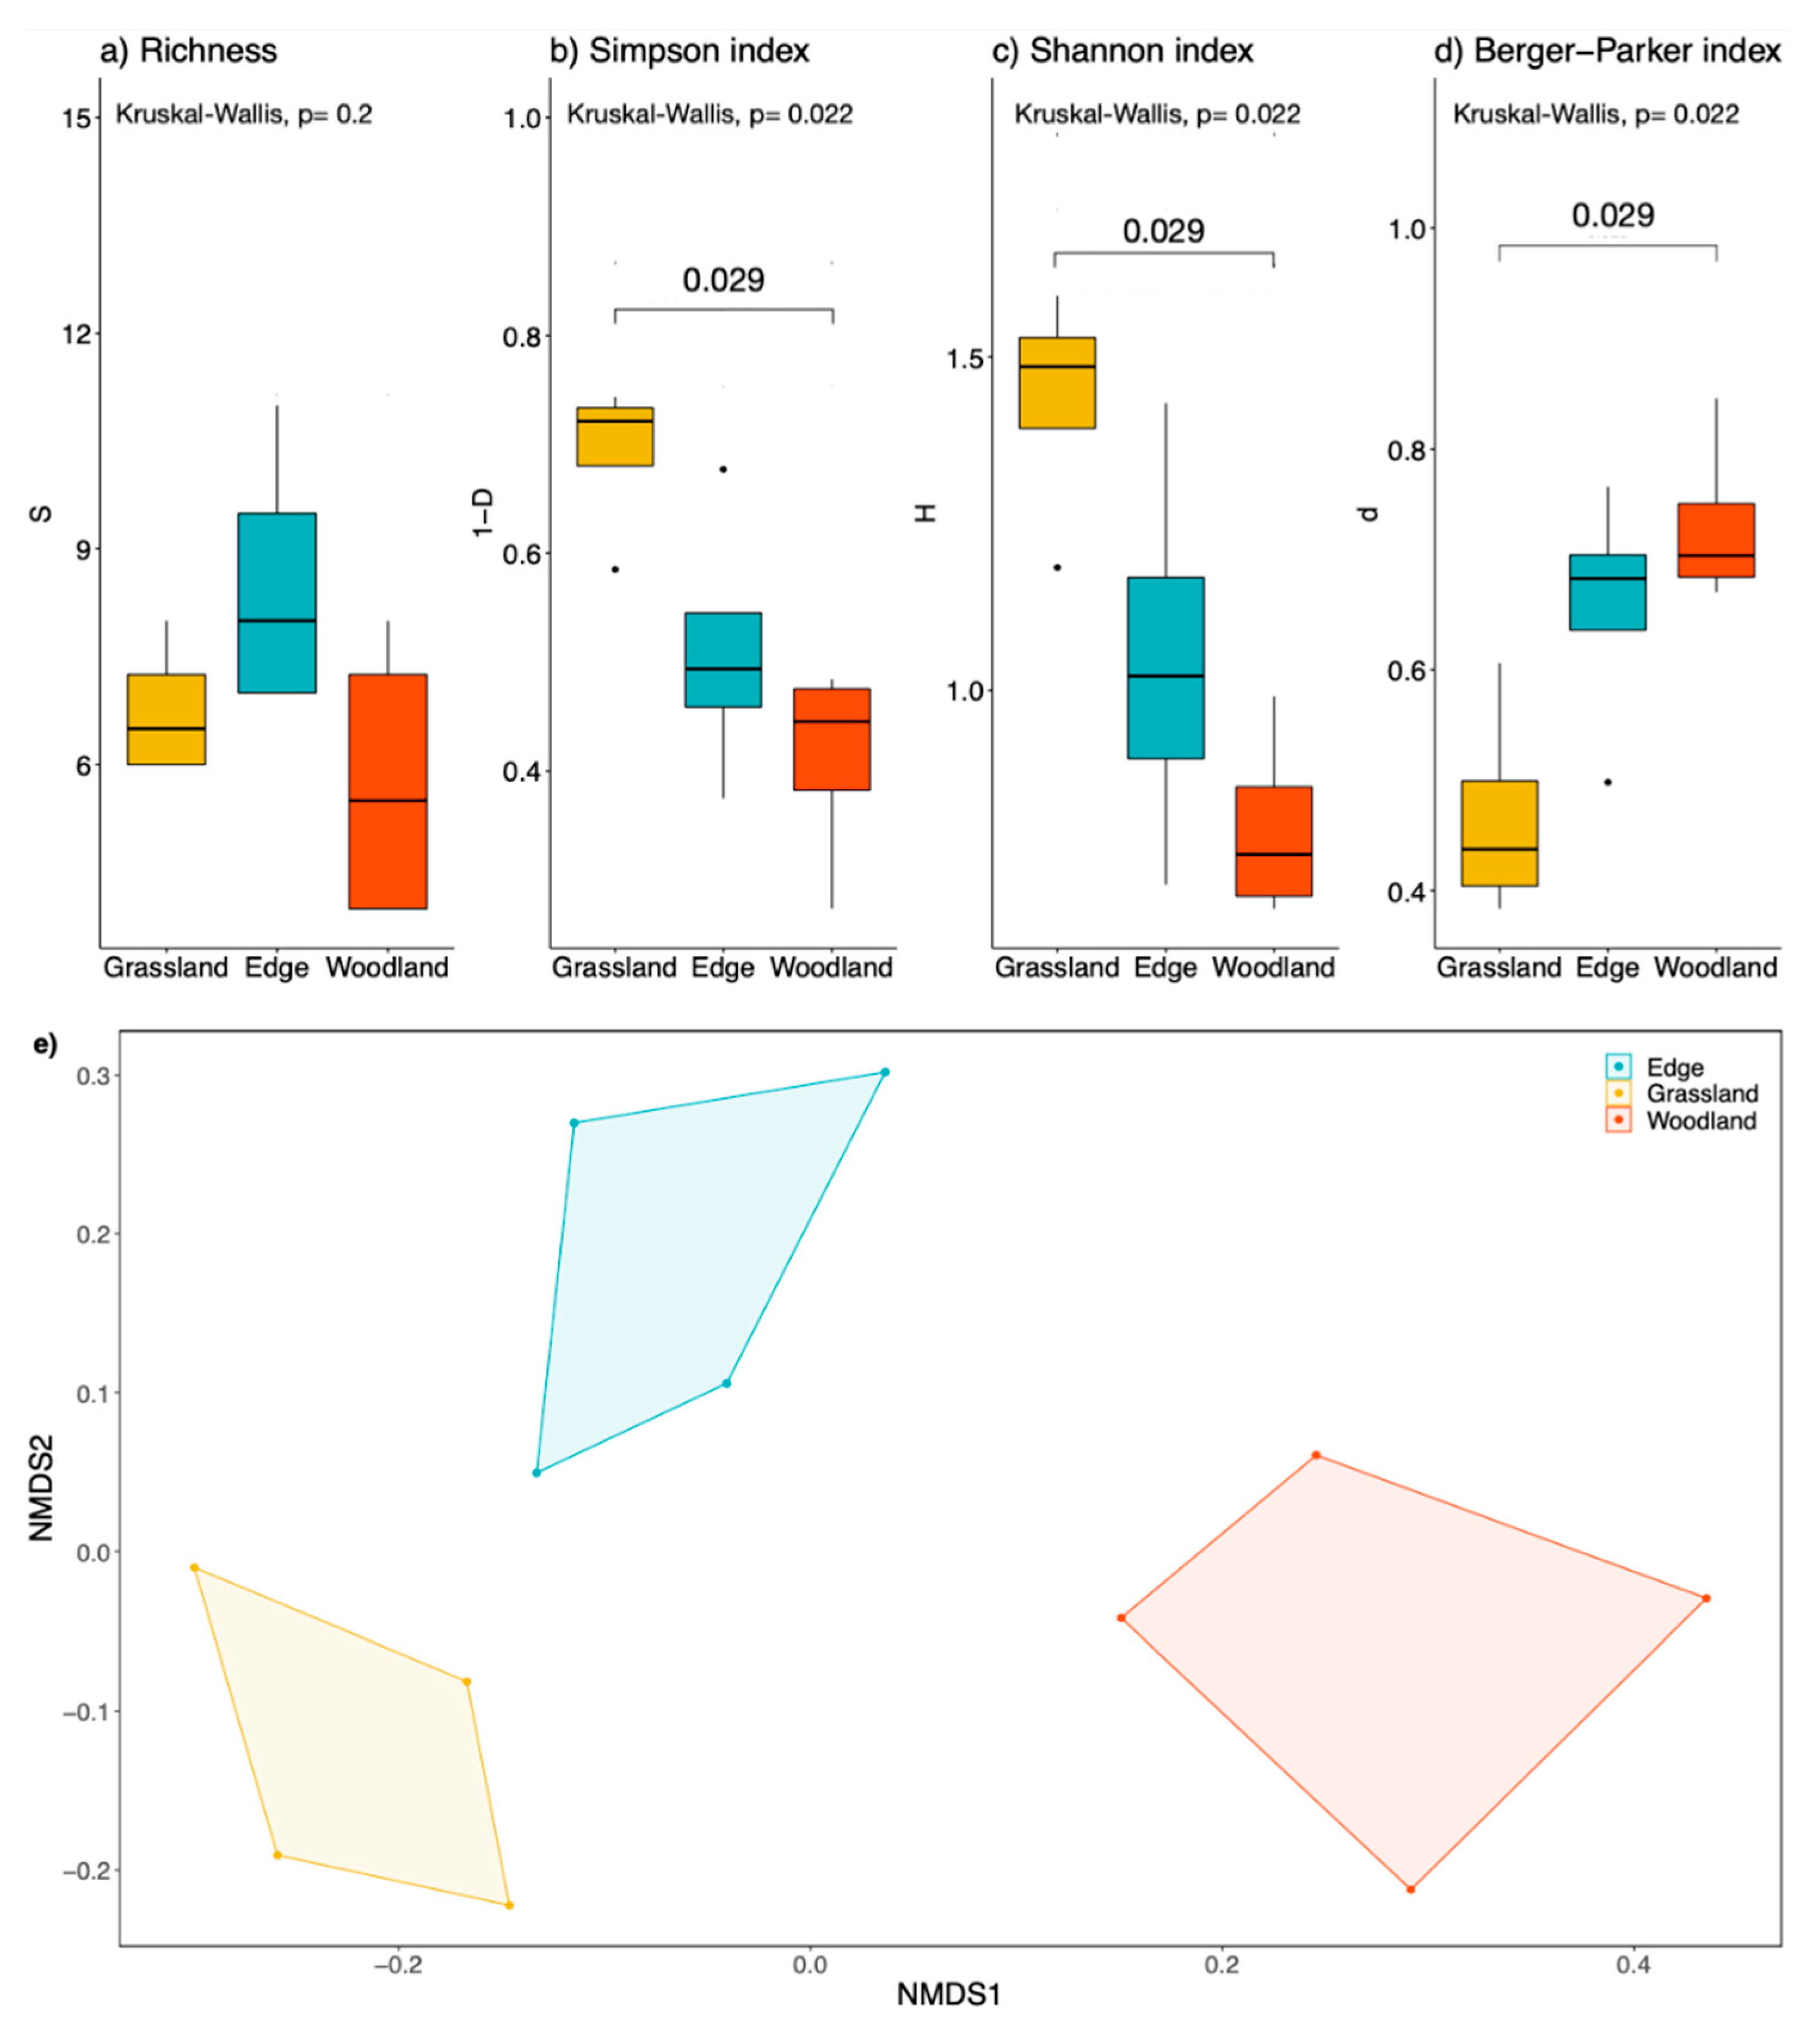
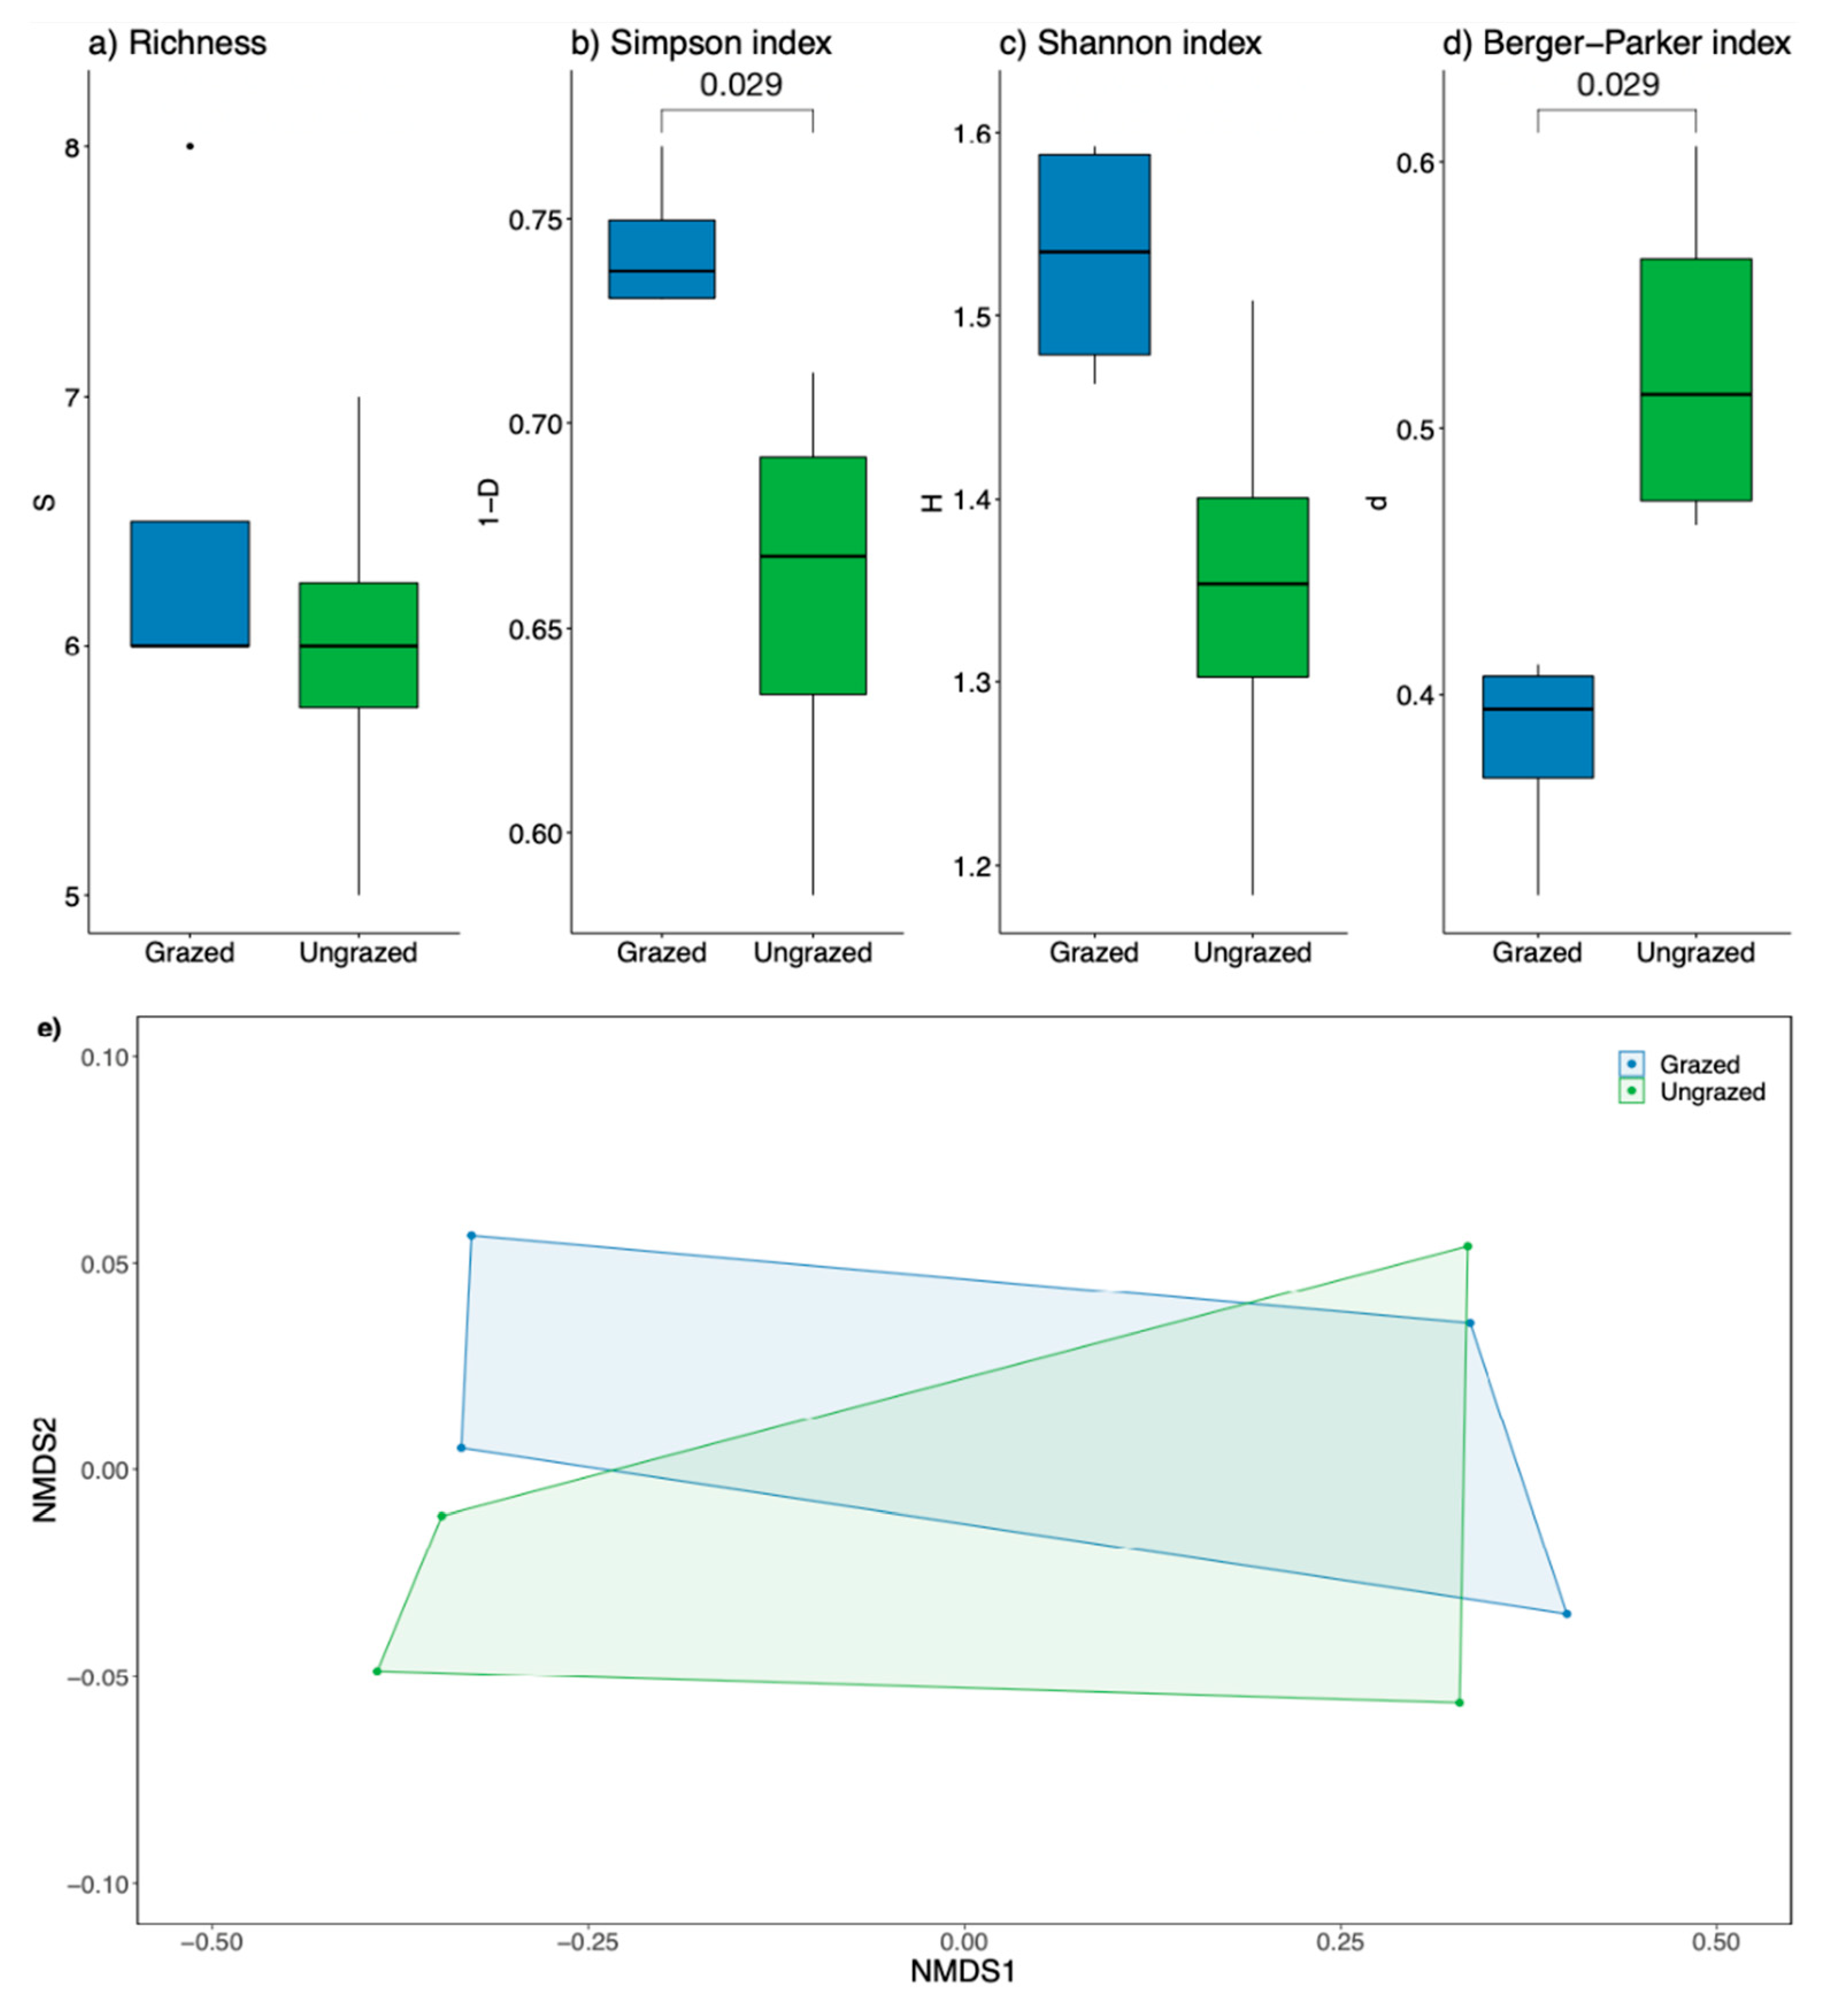
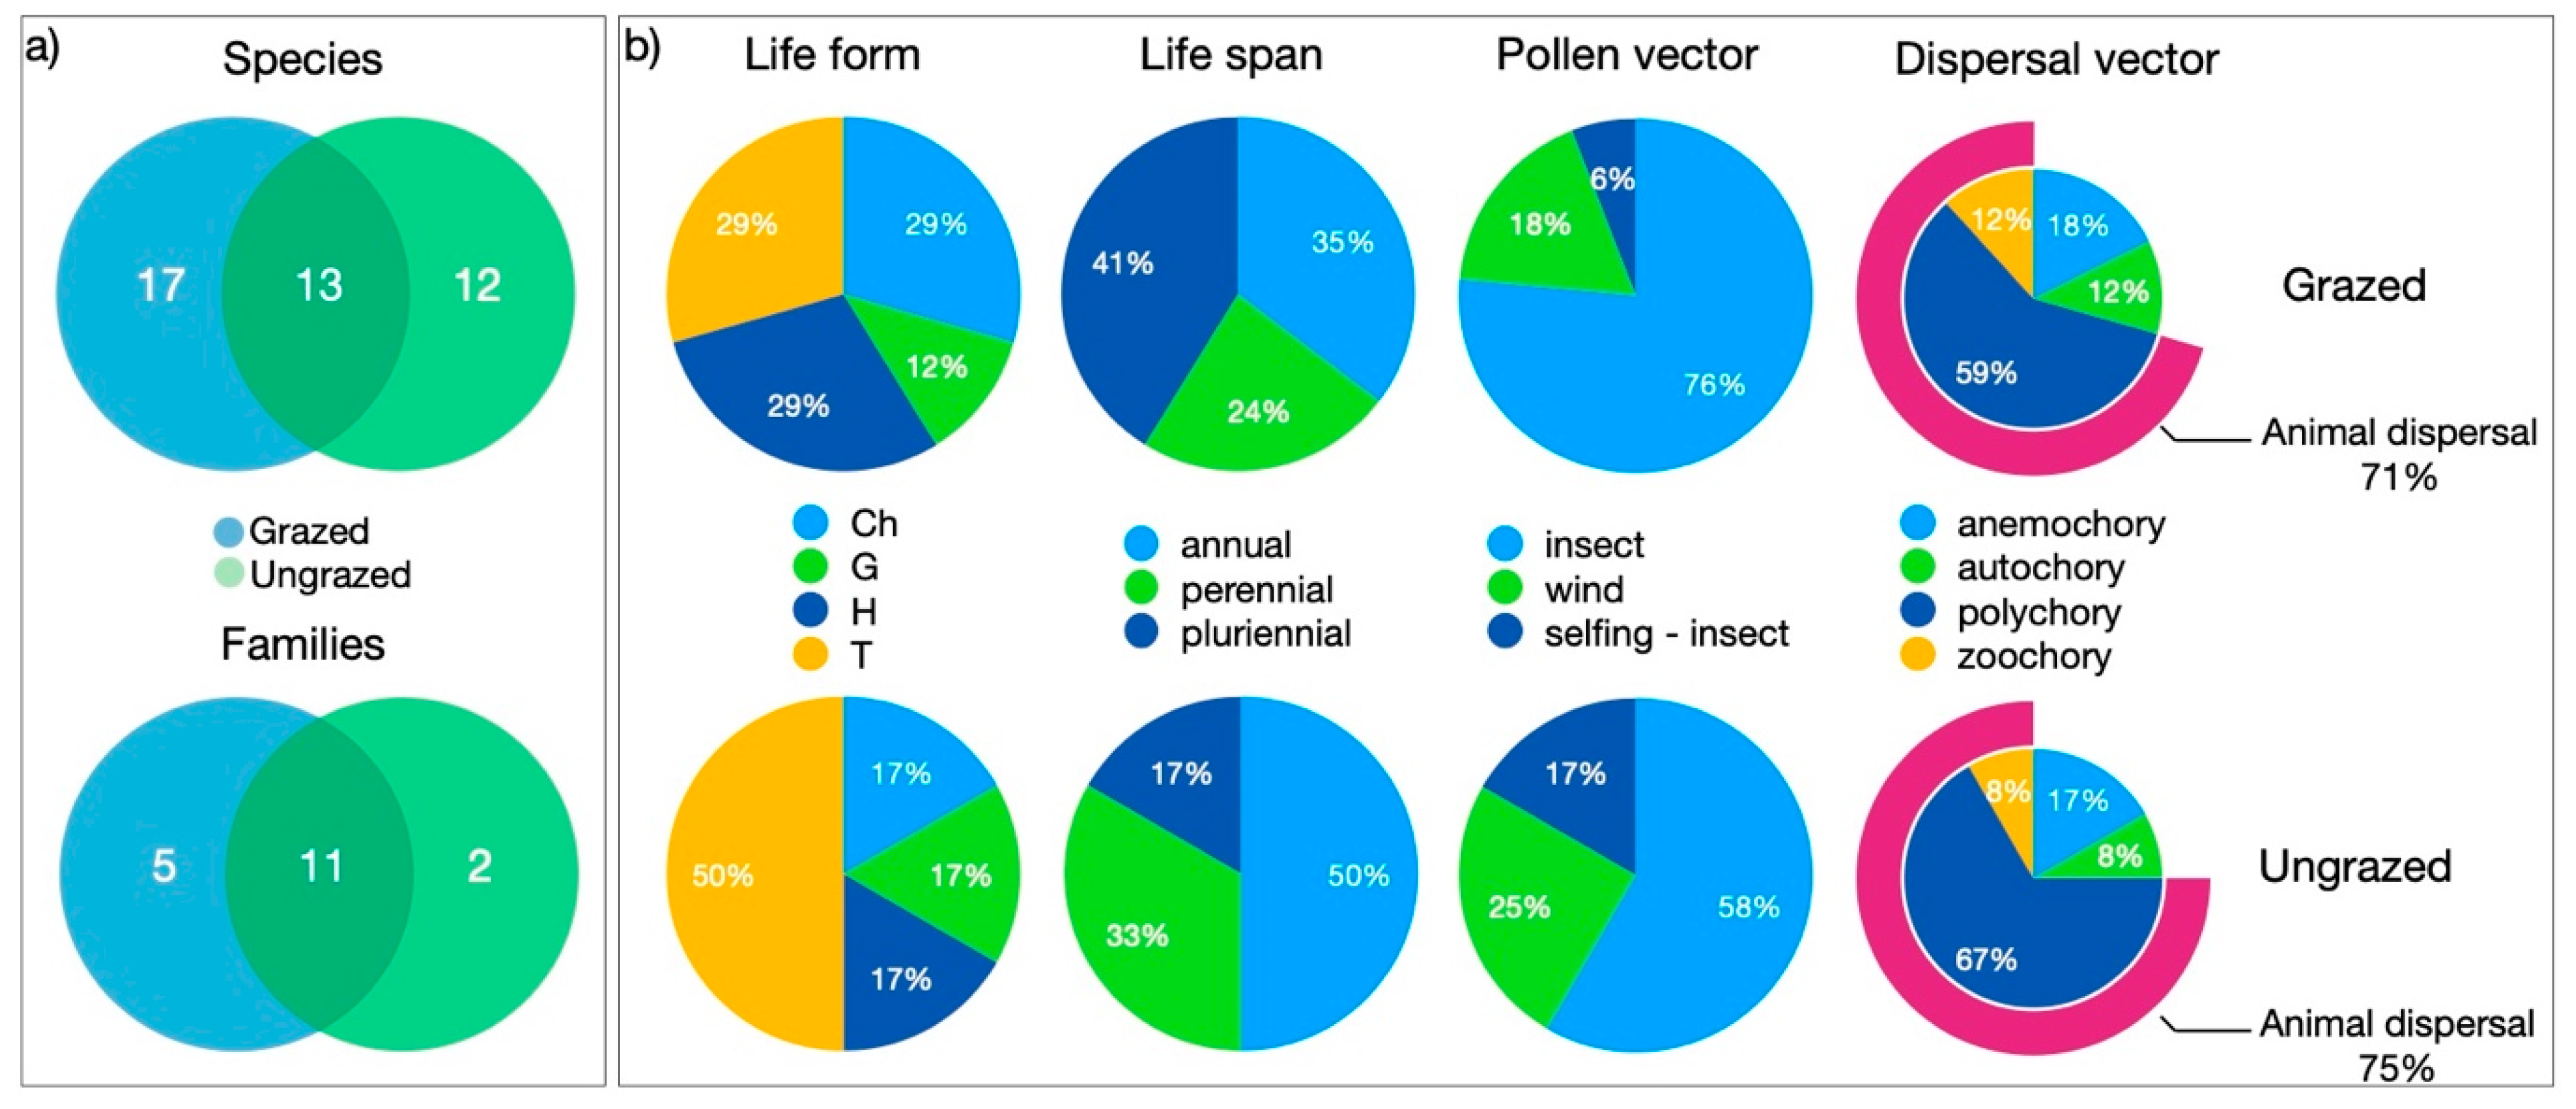
3.2. Floristic Diversity

Floristic analysis of the area showed some differences between grazed and ungrazed plots, even though the time span of the experiment was relatively short and the area was already characterized by high diversity ascribable to grazing activity (Figure 4 and Table 2). Comparing grazed and ungrazed plots, in total, 30 plant species were found in grazed plots (distributed among 16 families), and 25 in the ungrazed plots (distributed among 13 families) (Figure 4a). Of these, 17 species and 5 families were only present in grazed plots, with 12 species and 2 families exclusive to ungrazed plots.
The comparison of functional traits frequency of occurrence (Figure 4b and Table 2) showed a higher percentage of therophytes, corresponding to a higher percentage of annual species, for ungrazed plots, compared with a more even distribution for life form and life span in grazed areas, as well as an increase in hemicryptophytes and plurennial species. The percentage of insects as a pollen vector was higher for grazed plots, as was the percentage of exclusively zoochorous species. In contrast, because of the higher percentage of polychorous species in ungrazed areas, animal-dispersed species represented a higher percentage in ungrazed plots.

3.3. Forest Expansion

The dynamic of the woodland was assessed with a spatial analysis of the distance of tree propagules from the margin (Figure 5a,b) and a temporal analysis of this margin (Figure 6). The average distance of tree seedlings was 7.42 m (SD = 5.06 m).
Looking at the woodland edge in the different decades considered, no changes were observed, and the pixels delineating the woodland edge were exactly superimposable for 2019, 2006, 1997, and 1988. A slight difference could be detected when comparing the margin from 1955, as the area covered for this year was 0.002 km2 smaller compared with the other years (0.104 km2 and 0.106 km2, respectively). However, this can in part be imputable to the source, as the image from 1955 is an aerial photograph and had to be manually georeferenced. It is still worth noting the perfect juxtaposition of the beech forest margin in the past 30 years, probably because of the effect of herbivores grazing on the seedlings.

3.4. Interviews

The value of Cronbach’s alpha for the response matrix was 0.74, indicating reliable internal consistency. The responses to the statements are reported in Table 3.
In general, the interview results highlighted how pastoralism represents a tradition strongly tied to the environment and to the cultural and individual identity of the people interviewed (72% and 60% agreed with the statements, respectively).
However, 68% of interviewees recognized that both livestock farming and land management experienced changes in the past decades, and that there is a correlation between rural de-population and pastoralism decline (72% agreed with this statement). This is reflected in the necessity of hiring external help, reported by 56% of respondents, as well as in the polarized response to the validity of pastoralism as a future resource (20% agreed, 32% disagreed, and 48% were neutral).
This is probably because of the widely reported unsustainability of livestock farming as a stable income (64% disagree with this statement) and the concomitant inadequacy of agri-environmental schemes in supporting this activity, mostly due to the impact of regulations and limitations on the resulting production and commercialization (64% agreed with this statement).

4. Discussion

This study aims at the validation of traditional pastoralism as a management tool to preserve biological and cultural diversity, by investigating this practice in mountain pastures where transhumance is still carried out and cattle farmers keep this tradition alive.
Moreover, the quantification of the effects on biodiversity of grazing exclusion in grasslands consistently grazed throughout the decades shows the value of cattle in shaping the landscape. In fact, our analysis of alpha diversity of arthropod communities in plots in the different habitats characterizing the pasture revealed the grassland as the habitat represented by the highest levels of evenness and lowest levels of dominance. The values of the edge plots, habitats usually characterized by higher biodiversity [85], were intermediate, highlighting the importance of secondary grasslands as biodiversity-rich habitats. Furthermore, the woodland plots were represented by significantly lower levels of alpha diversity, with less even and more dominated arthropod communities, underscoring the importance of controlling forest encroachment on pastures.
Most importantly, the results from the comparison between grazed and ungrazed plots show how, in a short span of time, arthropod communities felt the repercussions of grazing exclusion, with ungrazed plots showing communities with significantly lower evenness values and significantly higher dominance. This is in accordance with other studies on various animal communities [30,31,32] that show the effect of generalist grazers in lowering dominance and increasing evenness. However, it is highly encouraging that this positive effect can be achieved even at lower densities of cattle farming in the Apennines, compared with the past when it was more widespread. This is probably because this particular study area has been consistently grazed over the years, and it highlights the importance of preserving the last hubs where traditional free-ranging livestock farming is still present.
The floristic analysis also shows some differences between grazed and ungrazed plots. In particular, the number of species as well as families was higher in grazed plots, not only in general, but also for species that were found exclusively in these plots. The percentage of species with insect-dispersed pollen was higher in the grazed areas, as was the percentage of exclusively zoochorous species, which is in agreement with the arthropod community analysis and with the presence of grazing. Indeed, in addition to a direct effect of livestock (grazing) on plant communities, these herbivores also induce an increase in arthropod species tied to the presence of animals as well as to the presence of plants that could be dispersed by livestock. In general, we can consider these domestic animals as elements that increase the dynamism of the system. The lack of such dynamism is reflected not only in a decrease in ungrazed communities, but also in a simplification of the pasture system.
Furthermore, grazers can also act on drivers of woodland advancement, by consuming shrubby or woody saplings. Our analyses of the woodland margin reveals that, although the presence of seedlings was recorded in the grassland side of the study area, the edge of the beech forest seems to have remained the same at least in the past 30 years, and has had very little change in the past 65 years, probably as an effect of grazers. This finding is of particular interest, as Apennine landscapes are suffering from woody encroachment in grassland areas, particularly along ecotones [42].
This study shows that mountain pastures that are consistently used throughout the years for extensive free-ranging livestock grazing at a low density (such as 0.27 livestock units/ha) are characterized by high faunistic and floristic diversity, as well as by a controlled edge and woodland situation.
Grazing by large herbivores in Mediterranean ecosystems was first carried out by non-domesticated species and then mostly by livestock after the effects of domestication, and open and semi-open vegetation can be restored using both wild and domestic animals [86,87]. Thus, traditional activities such as pastoralism can be a valuable management tool to achieve this goal, while simultaneously keeping cultural traditions alive, especially in areas comprised of protected habitats interspersed with small towns. Although, our interviews also highlighted the struggle these local communities face in order to keep up these traditional activities.
In the general climate of abandonment that rural and mountainous areas have been undergoing in the past decades, not limited to the Apennines, but well-documented especially in Eastern Europe [88,89,90], it is thus imperative to look to these traditions and to involve the people who are custodians of ecological knowledge in order to safeguard both biological and cultural diversity. Well-preserved landscapes would also have a positive effect on tourism in these areas, as it has been shown that managed grasslands are more attractive and have better visibility than abandoned landscapes [61,91].
This type of pastoralism is kept alive by the cultural traditions tied to it, more so than by some type of economic benefit, even though areas with more widespread agri-environmental schemes are less likely to be abandoned [90]. Thus, a link is created between the maintenance of high levels of biodiversity thanks to the survival of cultural diversity, through pastoralism.

5. Conclusions

In conclusion, traditional pastoral practices could be considered an indirect tool for safeguarding biological diversity, as a domino effect of mountain pastures management. This makes it a fully-fledged resource that can offer opportunities for future sustainable land use.
The fulfilment of the synergy between human activity and a positive ecological effect depends mainly on treasuring the traditional aspect, which is also what keeps local communities tied to the environment, rather than on focusing on productivity and economic interests. In fact, current support to the management of pastoral habitats is often inadequate for livestock grazing, and this could lead to further abandonment of pastoralism, owing to the unsustainability of costs and not to the lack of interest in such practice.
This obstacle needs to be resolved by improving existing support tools, in terms of both economic contributions and of streamlining bureaucratic procedures for access to funds, often too muddled for stockbreeders, especially elderly people not familiar with modern administrative practices and technology.
Other possible routes could be to help herdsmen in the eco-sustainable management of pasture through collaborative programs that involve other stakeholders, for example, researchers, professionals, students, and local authorities interested in not losing these traditions, monitoring their effect on land diversity and developing increasingly fine protocols to improve both livestock production and nature conservation, also taking into account other factors such as climate change or invasive species.

Author Contributions

Conceptualization, C.T. and D.F.; methodology, C.T., D.F., and J.-C.S.; software, C.T.; validation, C.T. and S.P.; formal analysis, C.T., D.F., and J.-C.S.; investigation, C.T., D.F., M.B., and S.P.; resources, D.F.; data curation, C.T. and A.D.N.; writing—original draft preparation, C.T., D.F., M.B., S.P., and S.B.; writing—review and editing, C.T., D.F., M.B., S.P., S.B., A.D.N., and J.-C.S.; visualization, C.T. and D.F.; supervision, D.F.; project administration, C.T. and D.F.; funding acquisition, C.T. and D.F. All authors have read and agreed to the published version of the manuscript.

Funding

This research was funded by the Ministry for Education, University, and Research of Italy, as part of the National Operational Programme on Research and Innovation (CUP E62G17000000006).

Institutional Review Board Statement

Not applicable.

Informed Consent Statement

Not applicable.

Data Availability Statement

The data presented in this study are available on request from the corresponding author.

Acknowledgments

We thank the administration of the Monti Picentini Regional Park.

Conflicts of Interest

The authors declare no conflict of interest.

References

  1. Barnosky, A.D.; Matzke, N.; Tomiya, S.; Wogan, G.O.; Swartz, B.; Quental, T.B.; Marshall, C.; McGuire, J.L.; Lindsey, E.L.; Maguire, K.C.; et al. Has the earth’s sixth mass extinction already arrived? Nature 2011, 471, 51–57. [Google Scholar] [CrossRef]
  2. Millennium Ecosystem Assessment. Ecosystems and Human Well-Being: Synthesis; Island Press: Washington, DC, USA, 2005; ISBN 978-1-59726-040-4. [Google Scholar]
  3. Bravo, D.N.; Araújo, M.B.; Lasanta, T.; Moreno, J.I.L. Climate change in mediterranean mountains during the 21st century. AMBIO A J. Hum. Environ. 2008, 37, 280–285. [Google Scholar] [CrossRef]
  4. Foley, J.A. Global consequences of land use. Science 2005, 309, 570–574. [Google Scholar] [CrossRef] [Green Version]
  5. Bellard, C.; Bertelsmeier, C.; Leadley, P.; Thuiller, W.; Courchamp, F. Impacts of climate change on the future of biodiversity: Biodiversity and climate change. Ecol. Lett. 2012, 15, 365–377. [Google Scholar] [CrossRef] [Green Version]
  6. Queiroz, C.; Beilin, R.; Folke, C.; Lindborg, R. Farmland abandonment: Threat or opportunity for biodiversity conservation? A global review. Front. Ecol. Environ. 2014, 12, 288–296. [Google Scholar] [CrossRef]
  7. Debussche, M.; Lepart, J.; Dervieux, A. Mediterranean landscape changes: Evidence from old postcards. Glob. Ecol. Biogeogr. 1999, 8, 3–15. [Google Scholar] [CrossRef]
  8. The Mediterranean Region: Biological Diversity in Space and Time, 2nd ed.; Blondel, J. (Ed.) Oxford University Press: New York, NY, USA, 2010; ISBN 978-0-19-955799-8. [Google Scholar]
  9. Agnoletti, M. Rural landscape, nature conservation and culture: Some notes on research trends and management approaches from a (southern) European perspective. Landsc. Urban Plan. 2014, 126, 66–73. [Google Scholar] [CrossRef]
  10. Di Rita, F.; Magri, D. Holocene drought, deforestation and evergreen vegetation development in the central Mediterranean: A 5500 year record from Lago Alimini Piccolo, Apulia, Southeast Italy. Holocene 2009, 19, 295–306. [Google Scholar] [CrossRef]
  11. Woodbridge, J.; Roberts, N.; Fyfe, R. Pan-Mediterranean holocene vegetation and land-cover dynamics from synthesized pollen data. J. Biogeogr. 2018, 45, 2159–2174. [Google Scholar] [CrossRef] [Green Version]
  12. UNESCO World Heritage Cultural Landscapes: A Handbook for Conservation and Management. In World Heritage Papers; UNESCO World Heritage Centre: Paris, France, 2009; Volume 26.
  13. Guidelines for Protected Area Management Categories; IUCN/UICN: Cambridge, UK, 1994; ISBN 978-2-8317-0201-8.
  14. Naveh, Z. Interactions of landscapes and cultures. Landsc. Urban Plan. 1995, 32, 43–54. [Google Scholar] [CrossRef]
  15. The Protected Landscape Approach: Linking Nature, Culture, and Community; Brown, J.; Mitchell, N.; Beresford, M. (Eds.) IUCN—The World Conservation Union: Gland, Switzerland, 2005; ISBN 978-2-8317-0797-6. [Google Scholar]
  16. Taylor, K.; Lennon, J. Cultural landscapes: A bridge between culture and nature? Int. J. Herit. Stud. 2011, 17, 537–554. [Google Scholar] [CrossRef]
  17. Mittermeier, R.A.; Turner, W.R.; Larsen, F.W.; Brooks, T.M.; Gascon, C. Global biodiversity conservation: The critical Role of hotspots. In Biodiversity Hotspots; Zachos, F.E., Habel, J.C., Eds.; Springer: Berlin/Heidelberg, Germany, 2011; pp. 3–22. ISBN 978-3-642-20991-8. [Google Scholar]
  18. Vacchiano, G.; Garbarino, M.; Lingua, E.; Motta, R. Forest dynamics and disturbance regimes in the Italian Apennines. For. Ecol. Manag. 2017, 388, 57–66. [Google Scholar] [CrossRef] [Green Version]
  19. Malandra, F.; Vitali, A.; Urbinati, C.; Garbarino, M. 70 Years of land use/land cover changes in the Apennines (Italy): A Meta-Analysis. Forests 2018, 9, 551. [Google Scholar] [CrossRef] [Green Version]
  20. Barker, G. Agriculture, pastoralism, and Mediterranean landscapes in prehistory. In The Archaeology of Mediterranean Prehistory; Blake, E., Knapp, A.B., Eds.; Blackwell Pub.: Malden, MA, USA, 2005; pp. 46–76. ISBN 978-0-631-23268-1. [Google Scholar]
  21. Brown, A.G.; Hatton, J.; Selby, K.A.; Leng, M.J.; Christie, N. Multi-proxy study of holocene environmental change and human activity in the central Apennine mountains, Italy. J. Quat. Sci. 2013, 28, 71–82. [Google Scholar] [CrossRef]
  22. Schreiber, H. 14th Session of the intergovernmental committee for the safeguarding of the intangible cultural heritage. Santander Art Cult. Law Rev. 2019, 5, 293–295. [Google Scholar]
  23. Bakudila, A.; Fassio, F.; Sallustio, L.; Marchetti, M.; Munafò, M.; Ritano, N. I Comuni e le Comunità Appenninici: Evoluzione del Territorio. Available online: http://www.slowfood.it/stati-generali-delle-comunita-dellappennino/ (accessed on 2 January 2021).
  24. Hanke, W.; Böhner, J.; Dreber, N.; Jürgens, N.; Schmiedel, U.; Wesuls, D.; Dengler, J. The impact of livestock grazing on plant diversity: An analysis across dryland ecosystems and scales in Southern Africa. Ecol. Appl. 2014, 24, 1188–1203. [Google Scholar] [CrossRef] [Green Version]
  25. Komac, B.; Domènech, M.; Fanlo, R. Effects of grazing on plant species diversity and pasture quality in subalpine grasslands in the Eastern Pyrenees (Andorra): Implications for conservation. J. Nat. Conserv. 2014, 22, 247–255. [Google Scholar] [CrossRef]
  26. Vera, F.W.M. Grazing Ecology and Forest History; Cabi: Wallingford, UK, 2000. [Google Scholar]
  27. Rotherham, I.D. Trees, Forested Landscapes and Grazing Animals: A European Perspective on Woodlands and Grazed Treescapes; Routledge: London, UK, 2013; ISBN 0-415-62611-0. [Google Scholar]
  28. Bruun, H.H.; Fritzbøger, B. The past impact of livestock husbandry on dispersal of plant seeds in the landscape of Denmark. AMBIO A J. Hum. Environ. 2002, 31, 425–431. [Google Scholar] [CrossRef] [PubMed]
  29. Wolański, P.; Bobiec, A.; Ortyl, B.; Makuch-Pietraś, I.; Czarnota, P.; Ziobro, J.; Korol, M.; Havryliuk, S.; Paderewski, J.; Kirby, K. The importance of livestock grazing at Woodland-Grassland interface in the conservation of rich oakwood plant communities in temperate Europe. Biodivers Conserv. 2021, 30, 741–760. [Google Scholar] [CrossRef]
  30. Sorino, R.; Santarcangelo, V.; Tarasco, E.; Corriero, G. Struttura di comunità degli ortotteri e integrità dei sistemi agro-pastorali del sic-zps murgia alta (Puglia, Italia). Entomologica 2008, 41, 219–231. [Google Scholar]
  31. Villanueva-López, G.; Lara-Pérez, L.A.; Oros-Ortega, I.; Ramirez-Barajas, P.J.; Casanova-Lugo, F.; Ramos-Reyes, R.; Aryal, D.R. Diversity of soil macro-arthropods correlates to the richness of plant species in traditional agroforestry systems in the humid tropics of Mexico. Agric. Ecosyst. Environ. 2019, 286, 106658. [Google Scholar] [CrossRef]
  32. Ancillotto, L.; Festa, F.; De Benedetta, F.; Cosentino, F.; Pejic, B.; Russo, D. Free-ranging livestock and a diverse landscape structure increase bat foraging in mountainous landscapes. Agrofor. Syst. 2021, 95, 407–418. [Google Scholar] [CrossRef]
  33. Buglione, M.; Petrelli, S.; de Filippo, G.; Troiano, C.; Rivieccio, E.; Notomista, T.; Maselli, V.; di Martino, L.; Carafa, M.; Gregorio, R.; et al. Contribution to the ecology of the Italian hare (Lepus Corsicanus). Sci. Rep. 2020, 10, 13071. [Google Scholar] [CrossRef]
  34. Buglione, M.; Troisi, S.R.; Petrelli, S.; van Vugt, M.; Notomista, T.; Troiano, C.; Bellomo, A.; Maselli, V.; Gregorio, R.; Fulgione, D. The first report on the ecology and distribution of the wolf population in Cilento, Vallo Di Diano and Alburni National Park. Biol. Bull. 2020, 47, 640–654. [Google Scholar] [CrossRef]
  35. Pinilla, V.; Ayuda, M.-I.; Sáez, L.-A. Rural depopulation and the migration turnaround in Mediterranean western Europe: A case study of Aragon. J. Rural. Community Dev. 2008, 3, 1–22. [Google Scholar]
  36. Rippa, D.; Maselli, V.; Soppelsa, O.; Fulgione, D. The Impact of Agro-pastoral Abandonment on the Rock Partridge Alectoris Graeca in the Apennines. Ibis 2011, 153, 721–734. [Google Scholar] [CrossRef]
  37. Métailié, J.-P.; Paegelow, M. Land abandonment and the spreading of the forest in the eastern French Pyrenees in the nineteenth to twentieth centuries. In Recent Dynamics of the Mediterranean Vegetation and Landscape; Wiley: Chichester, UK, 2004; pp. 219–236. [Google Scholar]
  38. Sokos, C.K.; Mamolos, A.P.; Kalburtji, K.L.; Birtsas, P.K. Farming and wildlife in Mediterranean agroecosystems. J. Nat. Conserv. 2013, 21, 81–92. [Google Scholar] [CrossRef]
  39. De Sillo, R.; De Sanctis, M.; Bruno, F.; Attorre, F. Vegetation and landscape of the Simbruini mountains (Central Appenines). Plant Sociol. 2012, 3–64. [Google Scholar] [CrossRef]
  40. Munafò, M.; Assennato, F.; Congedo, L.; Luti, T.; Marinosci, I.; Monti, G.; Riitano, N.; Sallustio, L.; Strollo, A.; Tomboliniand, I.; et al. Il Consumo di Suolo in Italia 2015; Ispra: Rome, Italy, 2015. [Google Scholar]
  41. Kozak, J.; Ziółkowska, E.; Vogt, P.; Dobosz, M.; Kaim, D.; Kolecka, N.; Ostafin, K. Forest-cover increase does not trigger forest-fragmentation decrease: Case study from the Polish carpathians. Sustainability 2018, 10, 1472. [Google Scholar] [CrossRef] [Green Version]
  42. Malandra, F.; Vitali, A.; Urbinati, C.; Weisberg, P.J.; Garbarino, M. Patterns and drivers of forest landscape change in the Apennines range, Italy. Reg. Environ. Chang. 2019, 19, 1973–1985. [Google Scholar] [CrossRef]
  43. Guilherme, J.L.; Miguel Pereira, H. Adaptation of bird communities to farmland abandonment in a mountain landscape. PLoS ONE 2013, 8, e73619. [Google Scholar] [CrossRef] [PubMed] [Green Version]
  44. Regos, A.; Domínguez, J.; Gil-Tena, A.; Brotons, L.; Ninyerola, M.; Pons, X. Rural abandoned landscapes and bird assemblages: Winners and losers in the rewilding of a Marginal mountain area (NW Spain). Reg. Environ. Chang. 2016, 16, 199–211. [Google Scholar] [CrossRef]
  45. Parmesan, C. Ecological and evolutionary responses to recent climate change. Annu. Rev. Ecol. Evol. Syst. 2006, 37, 637–669. [Google Scholar] [CrossRef] [Green Version]
  46. Durant, J.M.; Hjermann, D.Ø.; Ottersen, G.; Stenseth, N.C. Climate and the match or mismatch between predator requirements and resource availability. Clim. Res. 2007, 33, 271–283. [Google Scholar] [CrossRef] [Green Version]
  47. Halada, L.; Evans, D.; Romão, C.; Petersen, J.-E. Which habitats of European importance depend on agricultural practices? Biodivers Conserv. 2011, 20, 2365–2378. [Google Scholar] [CrossRef]
  48. Salvati, L.; Tombolini, I.; Perini, L.; Ferrara, A. Landscape changes and environmental quality: The evolution of land vulnerability and potential resilience to degradation in Italy. Reg. Environ. Change 2013, 13, 1223–1233. [Google Scholar] [CrossRef]
  49. Assini, S.; Filipponi, F.; Zucca, F. Land cover changes in an abandoned agricultural land in the Northern Apennine (Italy) between 1954 and 2008: Spatio-temporal dynamics. Plant Biosyst.—Int. J. Deal. All Asp. Plant Biol. 2015, 149, 807–817. [Google Scholar] [CrossRef]
  50. Lasanta, T.; González-Hidalgo, J.C.; Vicente-Serrano, S.M.; Sferi, E. Using landscape ecology to evaluate an alternative management scenario in abandoned Mediterranean mountain areas. Landsc. Urban Plan. 2006, 78, 101–114. [Google Scholar] [CrossRef]
  51. Maselli, V.; Rippa, D.; Russo, G.; Ligrone, R.; Soppelsa, O.; D’Aniello, B.; Fulgione, D. Wild boars’ social structure in the Mediterranean habitat. Ital. J. Zool. 2014, 81, 610–617. [Google Scholar] [CrossRef] [Green Version]
  52. Maselli, V.; Rippa, D.; Deluca, A.; Larson, G.; Wilkens, B.; Linderholm, A.; Masseti, M.; Fulgione, D. Southern Italian wild boar population, hotspot of genetic diversity. Hystrix Ital. J. Mammal. 2016, 27. [Google Scholar] [CrossRef]
  53. Acevedo, P.; Farfán, M.Á.; Márquez, A.L.; Delibes-Mateos, M.; Real, R.; Vargas, J.M. Past, present and future of wild ungulates in relation to changes in land use. Landsc. Ecol 2011, 26, 19–31. [Google Scholar] [CrossRef]
  54. Massei, G.; Genov, P. The environmental impact of wild boar. Galemys 2004, 16, 135–145. [Google Scholar]
  55. Barrios-Garcia, M.N.; Ballari, S.A. Impact of wild boar (Sus Scrofa) in its introduced and native range: A review. Biol. Invasions 2012, 14, 2283–2300. [Google Scholar] [CrossRef]
  56. Scandurra, A.; Magliozzi, L.; Fulgione, D.; Aria, M.; D’Aniello, B. Lepidoptera papilionoidea communities as a sentinel of biodiversity threat: The case of wild boar rooting in a mediterranean habitat. J. Insect Conserv. 2016, 20, 353–362. [Google Scholar] [CrossRef]
  57. Conti, G.; Fagarazzi, L. Avanzamento del bosco in ecosistemi montani: “sogno degli ambientalisti o incubo per la società”? Cause, aspetti ed impatti di una delle principali trasformazioni ambientali, territoriali e paesistiche del XX secolo in Italia. PLANUM: Eur. Online J. Plan. 2004, 10, 1–20. [Google Scholar]
  58. Bakudila, A. LA PASTORIZIA NELLE AREE APPENNINICHE: ANALISI Dell’Ultimo DECENNIO. Available online: https://www.slowfood.it/wp-content/uploads/2018/07/LA-PASTORIZIA-NELLE-AREE-APPENNINICHE-1.pdf (accessed on 3 January 2021).
  59. Antrop, M. The concept of traditional landscapes as a base for landscape evaluation and planning. the example of flanders region. Landsc. Urban Plan. 1997, 38, 105–117. [Google Scholar] [CrossRef]
  60. Bender, O.; Boehmer, H.J.; Jens, D.; Schumacher, K.P. Using GIS to analyse long-term cultural landscape change in Southern Germany. Landsc. Urban Plan. 2005, 70, 111–125. [Google Scholar] [CrossRef]
  61. Hussain, R.I.; Walcher, R.; Eder, R.; Allex, B.; Wallner, P.; Hutter, H.-P.; Bauer, N.; Arnberger, A.; Zaller, J.G.; Frank, T. Management of mountainous meadows associated with biodiversity attributes, perceived health benefits and cultural ecosystem services. Sci. Rep. 2019, 9, 1–9. [Google Scholar] [CrossRef]
  62. Díaz, S.; Demissew, S.; Carabias, J.; Joly, C.; Lonsdale, M.; Ash, N.; Larigauderie, A.; Adhikari, J.R.; Arico, S.; Báldi, A.; et al. The IPBES conceptual framework—connecting nature and people. Curr. Opin. Environ. Sustain. 2015, 14, 1–16. [Google Scholar] [CrossRef] [Green Version]
  63. Nazarea, V.D. Local knowledge and memory in biodiversity conservation. Annu. Rev. Anthropol. 2006, 35, 317–335. [Google Scholar] [CrossRef]
  64. Sobala, M. Landscape effects of conflicts in space management. a historical approach based on the Silesian and Żywiec Beskids (West Carpathians, Poland). Environ. Socio-Econ. Stud. 2016, 4, 51–60. [Google Scholar] [CrossRef] [Green Version]
  65. Van Meerbeek, K.; Muys, B.; Schowanek, S.D.; Svenning, J.-C. Reconciling conflicting paradigms of biodiversity conservation: Human intervention and rewilding. BioScience 2019, 69, 997–1007. [Google Scholar] [CrossRef]
  66. Gonçalves, P.; Alcobia, S.; Simões, L.; Santos-Reis, M. Effects of management options on mammal richness in a Mediterranean Agro-Silvo-Pastoral system. Agrofor. Syst. 2012, 85, 383–395. [Google Scholar] [CrossRef]
  67. Feurdean, A.; Ruprecht, E.; Molnár, Z.; Hutchinson, S.M.; Hickler, T. Biodiversity-rich european grasslands: Ancient, forgotten ecosystems. Biol. Conserv. 2018, 228, 224–232. [Google Scholar] [CrossRef]
  68. Biaggini, M.; Consorti, R.; Dapporto, L.; Dellacasa, M.; Paggetti, E.; Corti, C. The taxonomic level order as a possible tool for rapid assessment of arthropod diversity in agricultural landscapes. Agric. Ecosyst. Environ. 2007, 122, 183–191. [Google Scholar] [CrossRef]
  69. Raunkiaer, C. The life forms of plants and statistical plant geography; being the collected papers of C. Raunkiaer. In The Life Forms of Plants and Statistical Plant Geography; Being the Collected Papers of C. Raunkiaer; Clarendon Press: Oxford, UK, 1934. [Google Scholar]
  70. Klotz, S.; Kühn, I.; Durka, W. BIOLFLOR: Eine Datenbank Mit Biologisch-Ökologischen Merkmalen zur Flora von Deutschland; Schriftenreihe für Vegetationskunde; Bundesamt für Naturschutz: Bonn, Germany, 2002; ISBN 978-3-7843-3508-7. [Google Scholar]
  71. Fitter, A.H.; Peat, H.J. The ecological flora database. J. Ecol. 1994, 82, 415. [Google Scholar] [CrossRef]
  72. Pignatti, S.; Menegoni, P.; Pietrosanti, S. Biondicazione attraverso le piante Vascolari. Valori Di Indicazione Second. Ellenberg (Zeigerwerte) Per Le Specie Della Flora D’italia. Braun-Blanquetia 2005, 39, 97. [Google Scholar]
  73. Kleyer, M.; Bekker, R.M.; Knevel, I.C.; Bakker, J.P.; Thompson, K.; Sonnenschein, M.; Poschlod, P.; van Groenendael, J.M.; Klimeš, L.; Klimešová, J.; et al. The LEDA traitbase: A database of life-history traits of the Northwest European flora. J. Ecol. 2008, 96, 1266–1274. [Google Scholar] [CrossRef]
  74. Tavşanoğlu, Ç.; Pausas, J.G. A functional trait database for mediterranean basin plants. Sci. Data 2018, 5, 180135. [Google Scholar] [CrossRef] [Green Version]
  75. Bocci, G. TR8: An r package for easily retrieving plant species traits. Methods Ecol. Evol. 2015, 6, 347–350. [Google Scholar] [CrossRef]
  76. Simpson, E.H. Measurement of diversity. Nature 1949, 163, 688. [Google Scholar] [CrossRef]
  77. Shannon, C.E.; Weaver, W. The Mathematical Theory of Communication; University of Illinois Press: Champaign, IL, USA, 1949; Volume 96. [Google Scholar]
  78. Magurran, A.E. Measuring Biological Diversity; Wiley-Blackwell: Hoboken, NJ, USA, 2013; ISBN 978-1-118-68792-5. [Google Scholar]
  79. Berger, W.H.; Parker, F.L. Diversity of planktonic foraminifera in Deep-Sea sediments. Science 1970, 168, 1345–1347. [Google Scholar] [CrossRef] [PubMed]
  80. Hammer, Ø.; Harper, D.A.; Ryan, P.D. PAST: Paleontological statistics software package for education and data analysis. Palaeontol. Electron. 2001, 4, 9. [Google Scholar]
  81. R Core Team. R: A Language and Environment for Statistical Computing; R Foundation for Statistical Computing: Vienna, Austria, 2020; ISBN 3-900051-07-0. [Google Scholar]
  82. Savage, A.M.; Youngsteadt, E.; Ernst, A.F.; Powers, S.A.; Dunn, R.R.; Frank, S.D. Homogenizing an urban habitat mosaic: Arthropod diversity declines in New York City Parks after super storm Sandy. Ecol. Appl. 2018, 28, 225–236. [Google Scholar] [CrossRef] [PubMed]
  83. MacQueen, J. Some methods for classification and analysis of multivariate observations. In Proceedings of the Fifth Berkeley Symposium on Mathematical Statistics and Probability, Berkeley, CA, USA, 21 June–18 July 1965; Volume 1, pp. 281–297. [Google Scholar]
  84. Batterton, K.A.; Hale, K.N. The likert scale what it is and how to use it. Phalanx 2017, 50, 32–39. [Google Scholar]
  85. Kark, S. Effects of ecotones on biodiversity. In Encyclopedia of Biodiversity; Elsevier: Amsterdam, The Netherlands, 2007. [Google Scholar]
  86. San Miguel-Ayanz, A.; García-Calvo, R.P.; García-Olalla, M. Wild ungulates vs extensive livestock. Looking back to face the future. Options Meditérranneenes 2010, 92, 27–34. [Google Scholar]
  87. Svenning, J.-C. Rewilding should be central to global restoration efforts. One Earth 2020, 3, 657–660. [Google Scholar] [CrossRef]
  88. Prishchepov, A.V.; Radeloff, V.C.; Baumann, M.; Kuemmerle, T.; Müller, D. Effects of institutional changes on land use: Agricultural land abandonment during the transition from state-command to market-driven economies in Post-Soviet Eastern Europe. Environ. Res. Lett. 2012, 7, 024021. [Google Scholar] [CrossRef]
  89. Pătru-Stupariu, I.; Angelstam, P.; Elbakidze, M.; Huzui, A.; Andersson, K. Using forest history and spatial patterns to identify potential high conservation value forests in Romania. Biodivers. Conserv. 2013, 22, 2023–2039. [Google Scholar] [CrossRef]
  90. Kolecka, N.; Kozak, J. Wall-to-wall parcel-level mapping of agricultural land abandonment in the Polish Carpathians. Land 2019, 8, 129. [Google Scholar] [CrossRef] [Green Version]
  91. Sobala, M.; Myga-Piątek, U.; Szypuła, B. Assessment of Changes in a Viewshed in the Western Carpathians Landscape as a Result of Reforestation. Land 2020, 9, 430. [Google Scholar] [CrossRef]
Figure 1. Study area and its location in Southern Italy. The satellite image shows the pasture on Mount Boschetiello where this study was carried out, along with the location of sampling plots (in red circles, woodland plots; in turquoise circles, edge plots; in orange circles, grazed grassland plots; and in orange squares, ungrazed grassland plots). Satellite image attributed to Image ©2019 Google.
Land 10 00957 g001
Figure 2. Diversity analysis of plots from woodland (in orange), edge (in turquoise), and grassland (in yellow) habitats. (a) Richness, (b) Simpson index, (c) Shannon index, and (d) Berger–Parker index; bar plots represent the interquartile range with the median (bold black line), the outliers (circles), the whiskers (vertical lines), and the minimum and maximum (end of vertical lines). (e) NMDS ordination showing the first two coordinates. PERMANOVA p = 0.0001; pairwise differences between the habitats: grassland vs. edge: p = 0.028, edge vs. woodland: p = 0.032, grassland vs. woodland: p = 0.027.
Land 10 00957 g002
Figure 3. Diversity analysis of grazed (blue) and ungrazed (green) grassland plots. (a) Richness, (b) Simpson index, (c) Shannon index, and (d) Berger–Parker index; bar plots represent the interquartile range with the median (bold black line), the outliers (circles), the whiskers (vertical lines), and the minimum and maximum (end of vertical lines). (e) NMDS ordination showing the two coordinates.
Land 10 00957 g003
Figure 4. Floristic analysis. (a) Symmetric Venn diagrams of shared and exclusive plant species and families of grazed and ungrazed grassland plots. (b) Comparison of functional traits of species exclusive to grazed plots (top) and ungrazed plots (bottom); pie sections represent frequency of occurrence (%) of traits for each category. For dispersal, the percentage of species represented by animal dispersal includes exclusively zoochorous as well as polychorous species.
Land 10 00957 g004
Figure 5. (a) Position of propagules and distance from mature trees of the same species; (b) woodland edge expansion, calculated as a buffer the size of the mean distance (MD = 7.42 m), MD − SD (2.37 m), MD + SD (12.49 m). Satellite image attributed to Image ©2019 Google.
Land 10 00957 g005
Figure 6. Woodland margin from 1955 to 2019. (a) High-resolution orthophotos. (b) Ten meter resolution images obtained via resampling, used for the K-means clustering (c). (d) Woodland margin and the area it covers in the considered square. The green area, which represents the extent of the beech forest, consists of 0.106 km2 for 2019, 2006, 1997, and 1988, and of 0.104 km2 for 1955.
Land 10 00957 g006
Table 1. Information about the people interviewed in this study.
Type of InformationCategoryPercentage of Interviewees (n = 25)
Type of intervieweesLivestock farmers80
Administrative employees20
AgeAge < 3016
30 ≤ Age < 5036
Age ≥ 5048
Years farmingYF < 58
5 ≤ YF < 1540
YF ≥ 1552
Type of farmingTranshumant32
Non-transhumant60
Stabled8
Type of livestockCattle48
Sheep40
Horses12
Farming in protected areasYes56
No44
Farming as main activityYes60
No40
Common Agricultural Policy (CAP) direct paymentsYes60
No40
CAP Rural Development FundsYes40
No60
CAP income supportYes60
No40
Duration of CAP fundsNo funds36
Years of funding < 1032
Years of funding ≥ 1032
Table 2. Functional traits considered and frequency of occurrence (%) in grazed and ungrazed plots.
Trait CategoryTraitDescriptionGrazed %Ungrazed %
Raunkiær Life FormCh (Chamaephytes)Plants with persistent shoot systems between 25 and 50 cm from the soil29.416.7
G (Geophytes)Plants with a periodic reduction of the shoot system to soil-embedded organs11.816.7
H (Hemicryptophytes)Plants with a periodic reduction of the shoot system to the ground surface29.416.7
T (Therophytes)Plants with shoot and root systems that die after production, with one-year life cycles29.450.0
Life SpanannualPlants that complete their life cycle in one year35.350.0
pluriennialPlants that complete their life cycles in up to two years23.533.3
perennialPlants that complete their life cycle in more than two years41.216.7
Dispersal VectoranemochoryWind-dispersed plants17.616.7
autochorySelf-dispersed plants11.88.3
polychoryPlants dispersed by multiple vectors58.866.7
zoochoryAnimal-dispersed plants11.88.3
Pollen Vectorinsect 76.558.3
wind 17.625.0
selfing-insect 5.916.7
Animal DispersalYes(zoochory + polychory)70.675.0
No 29.425.0
Table 3. Responses to interviews. Answer scale: 1 = disagree, 2 = neutral, 2 = agree. Frequency of occurrence of the responses is reported in percentages. Mean score and standard deviation are also reported.
Statement1—Disagree2—Neutral3—AgreeMeanSD
Pastoralism and its traditions are important for personal and cultural identity0%40%60%2.60.50
Traditional pastoralism is strongly linked to the landscape0%24%72%2.760.44
Livestock farming has changed in the past decades0%32%68%2.680.48
Land management has changed in the past decades0%32%68%2.680.48
Rural de-population and pastoralism decline are directly linked0%28%72%2.720.48
Hired help is necessary for pastoralism0%44%56%2.440.51
Pastoralism provides sustainable income without agri-environmental schemes64%36%0%1.360.49
Agri-environmental schemes are adequate to support local pastoralism84%16%0%1.160.48
Schemes and regulations have an impact on production and commercialization0%36%64%2.640.50
Traditional pastoralism has future prospects32%48%20%1.880.73
Publisher’s Note: MDPI stays neutral with regard to jurisdictional claims in published maps and institutional affiliations.

