


Nomenclature
- A h
area at the working surface of the thermal head, m2
- α
thermal diffusivity, m2 s−1
- A p
area at the water-ice interface, m2
- ρ
density, kg m−3
- c
heat capacity, J kg−1 K−1
- δ
thickness of the melt film, m
- F
axial load, N
- μ
dynamic viscosity of water, Pa s−1
- F*
buoyancy corrected force, N
- η
efficiency of thermal head
- g
acceleration of gravity, m s−2
- φ
angular position, see Figure 1
- H
height of water column in melted borehole, m
- π
circumference ratio
- k
thermal conductivity, W m−1 K−1
- (o-xy)
Cartesian coordinate system
- L
maximum heat disturbance distance, m
- (o′-hs)
local coordinate system
- L m
latent heat of melting, J kg−1
- Г h
working surface of the thermal head
- p
pressure in the melt film, Pa
- Г w
outflow boundary of the melt film
- P
input power, W
- Г p
water-ice interface
- P E
power used for ice melting, W
- Г i
non-heat-disturbed isothermal virtual surface in ice
- P L
power loss, W
- q h
heat flux of the thermal head, W m−2
- R
radius of the thermal head, m
- T
Temperature, K
- T h
temperature of the thermal head, K
- T i
ice temperature, K
- T m
melting point temperature, K
- T w
average temperature of the melt film, K
- u
tangential velocity, m s−1
- u max
maximum value of the tangential velocity, m s−1
- v
normal velocity, m s−1
- V
penetration rate, m s−1
Subscripts
- water
w (ρ w, c w, k w, α w)
- ice
i (ρ i, c i, k i, α i)
1. Introduction
Since hot-point drills were first proposed by Weinberg (Reference Weinberg1912), they have been widely utilized in drilling boreholes in glaciers, ice caps and ice sheets for installing ablation sticks, determining ice thickness, locating englacial and subglacial streams, and measuring the temperature and other internal features of glaciers (Nizery, Reference Nizery1951; Gerrard and others, Reference Gerrard, Perutz and Roch1952; Sukhanov and others, Reference Sukhanov, Morev and Zotikov1974; Gillet, Reference Gillet1975; Hooke, Reference Hooke Rle1976). In recent years, hot-point drills were also proposed for exploring ice-covered aquatic systems in Antarctica and on extraterrestrial planets, such as Saturn's moon, Enceladus, and Jupiter's moon, Europa (Lorenz, Reference Lorenz2012; Stone and others, Reference Stone, Hogan, Siegel, Lelievre and Flesher2014; Talalay and others, Reference Talalay, Zagorodnov, Markov, Sysoev and Hong2014; Horne, Reference Horne2017; Dachwald and others, Reference Dachwald2020).
Without coring, a hot-point drill melts a borehole in ice by the thermal head at its bottom tip. A thermal head could be heated through electricity or a hot fluid. In the former case, the electrically heated element can be a cartridge heater, coil heater or silicon carbide heater (LaChapelle, Reference LaChapelle1963; Wirtza and Hildebrandt, Reference Wirtza and Hildebrandt2016). In the latter case, the thermal head is heated using circulating hot water or an antifreeze, as it is set out in Swiss Federal Institute of Technology Zürich (ETH) hot point and IceCube firn drill (Kasser, Reference Kasser1960; Benson and others, Reference Benson2014). A material with a high thermal conductivity, such as silver or copper, is usually used in manufacturing an electrically heated thermal head, which uniformly distributes the heat generated from the heaters to this working surface. The input power on the working surface of the thermal head remains constant during the drilling process, and the heat flux remains equal on all the parts of the working surface. This working condition is known as a power-driven condition (PDC). Alternatively, the temperature on the working surface of the hot-fluid-heated thermal head can be considered to be constant; this working condition with an isothermal working surface on the thermal head is called a temperature-driven condition (TDC). It should be noted that PDC and TDC can only be identified based on the condition of the working surface of the thermal head instead of the heat medium applied through the thermal head. For example, in some cases, the working surface of an electrically heated thermal head can also be isothermal and works in TDC mode (Shreve, Reference Shreve1962). Based on this classification, the working state for different thermal heads can be described better, and the details are given below.
The following parameters influence the rate of penetration (ROP) of a thermal head: power or temperature of the thermal head, buoyancy corrected force (BCF) on the thermal head, ice temperature, distribution of heaters, and material and shape used for producing the thermal head (Тalalay and others, Reference Talalay2019). Currently, there is no standard guidance for designing optimal thermal heads, and several researchers have relied on experimental methods in identifying the optimal configuration of thermal heads and for investigating the drilling performance in the field, which is expensive and time-consuming (Treffer and others, Reference Treffer2006; Weiss and others, Reference Weiss2008; Talalay, Reference Talalay2020). Therefore, it is necessary to apply theoretical modeling techniques in evaluating the ice drilling-melting process before producing and testing an actual thermal head.
During the drilling process using hot points, ice is melted, and the melted water is then squeezed out by an exerted force applied on the thermal head. Consequently, a thin water film is formed between the thermal head and the borehole bottom, resulting in a complex heat transfer between thermal head and ice. The first theoretical method used to study this heat transfer system was based on a simple macro-scale power balance method (Aamot, Reference Aamot1967). Later, more accurate close-contact melting (CCM) phenomena were used to describe the ice-melting process (e.g. Zotikov and others, Reference Zotikov, Kapitsa, Kudriavtsev Ye and Sukhanov1974).
A CCM phenomenon usually occurs when a solid heat source is pressed against a phase change material (PCM) with a lower melting point temperature (Mayer and Moaveni, Reference Mayer and Moaveni2008). The CCM process can be caused by a temperature rise in the PCM (Chen and others, Reference Chen, Chen, Zhao, Sun and Gong2008) or a decreased PCM melting point under high pressure (Bejan and Tyvand, Reference Bejan and Tyvand1992; Chen and others, Reference Chen, Li, Gao, Liu and Sun2005). The CCM phenomenon commonly occurs in several applications (Moallemi and Viskanta, Reference Moallemi and Viskanta1985). For example, the ‘self-burial’ of nuclear waste materials and the ‘melt-down’ of reactor cores in the nuclear industry are typical cases of CCM processes (Jansen and Stepnewski, Reference Jansen and Stepnewski1973; Logan, Reference Logan1974). Another similar situation occurs during hot welding (Jackson, Reference Jackson1965; Toshiyuki and Giedt, Reference Toshiyuki and Giedt1982). In the field of geology, magma flow in the Earth's interior can be regarded as a CCM process (Birth, Reference Birth1975; Marsh, Reference Marsh1978). Additionally, a thermal storage system with a PCM can also be seen as a CCM phenomenon (Roy and Sengupta, Reference Roy and Sengupta1987; Hirata and others, Reference Hirata, Makino and Kaneko1991; Hu and others, Reference Hu, Huang and Shi1999; Kumano and others, Reference Kumano, Saito, Okawa, Takeda and Okuda2005a).
CCM theories have been established in the past decades, and various models have been developed to describe the CCM process by considering the heat source configurations, such as a flat surface (Moallemi and others, Reference Moallemi, Webb and Viskanta1986; Yoo, Reference Yoo2000), a sphere (Emerman and Turcotte, Reference Emerman and Turcotte1983) and even an elliptical cylinder (Roy and Sengupta, Reference Roy and Sengupta1990). However, a few models can be used to describe the CCM processes that are directly related to ice drilling. Shreve (Reference Shreve1962) investigated the CCM process in ice drilling by assuming an isothermal working surface on a thermal head. In Shreve's model, a shape factor and a drilling performance number were given to evaluate the drilling performance of the thermal head. However, the effect of a single variable, such as thermal head temperature, BCF or ice temperature, was not considered. Later, additional models of the CCM process were developed to optimize the shape of the thermal head (Salamatin and others, Reference Salamatin, Fomin, Chistyakov and Chugunov1984; Pudovcin and others, Reference Pudovcin, Salamatin, Fomin and Chistyakov1988; Fomin and Cheng, Reference Fomin and Cheng1991). In these models, more attention was paid to the shape of the thermal head, but the effects of other variables were neglected. More recently, Schüller and Kowalski (Reference Schüller and Kowalski2019) investigated the effect of power, BCF and ice temperature on the drilling performance by analyzing the CCM process with respect to extraterrestrial ice. In their study, the shape effect of the thermal head was not considered, and the developed model could only be applied to PDCs.
In general, the ice-melting process was not comprehensively discussed in previous CCM models in terms of variation in parameters such as water-film thickness, distribution of pressure and flow velocity in melt films, heat loss and range of heat disturbance. In addition, the effects of thermal head shape, cone angle of conical thermal head, input power, BCF and ice temperature on ROP were not evaluated fully.
In this paper, we present a new approach by combining the conventional CCM model with a macro-scale power balance method established by Aamot (Reference Aamot1967). An analytical-numerical hybrid method is applied to solve the model using COMSOL Multiphysics 5.3a software. The ice-melting process of the thermal head is analyzed to determine the effects of the thermal head shape, cone angle of conical thermal head, BCF, power (or temperature) of the thermal head and ice temperature on ROP under both PDC and TDC. The variation in water-film thickness, distribution of the pressure and flow velocity in the melt film, temperature (heat flux) distribution of the thermal head, heat loss and the range of heat disturbance in ice are also evaluated.
2. Model development
2.1. Physical model
The CCM process of thermal drilling in ice is illustrated in Figure 1. A thermal head is heated setting constant temperature T h or constant power P at its outer surface Γh to melt the surrounding ice. Then, the meltwater is squeezed out by applying an axial load F acting on the thermal head. Consequently, a thin water film with a thickness of δ is formed, and the thermal head is separated from the ice by the water film. With the water film flowing out from its boundary Γw, the thermal head starts to decent in ice at a velocity of V. The temperature at the interface between the water film and ice Γp is equal to the melting point temperature of the ice T m. The water pressure p on the outflow boundary of the water film Γw equals to hydrostatic water pressure in the borehole.

Fig. 1. Schematic of the CCM process during thermal drilling in ice.
During the ice-drilling process, the ice around the thermal head is first heated before being melted. An isothermal virtual surface Γi, which is the border of the heated ice at the temperature of T i, exists at a specific distance from the bottom. The distance between the isothermal virtual surface and the water-ice interface just below the center of the thermal head L can be used to evaluate the heat disturbance range in the ice caused by the thermal head during the drilling process. We define a Cartesian coordinate system (o-xy) and a local coordinate system (o′-hs) in our model to describe the CCM process. The origin of the Cartesian coordinate system is fixed at the center of the thermal head, while that of the local coordinate system changes along the outer surface of the thermal head. The parameters u and v are the velocity components of the water film in the h-direction and s-direction, respectively.
Some assumptions have been made regarding the behavior of the physical process in melt films: (1) the melting process is quasi-steady (Yoo and others, Reference Yoo, Hong and Kim1998; Groulx and Lacroix, Reference Groulx and Lacroix2003); (2) the flow in the melt film remains laminar (Groulx and Lacroix, Reference Groulx and Lacroix2003, Reference Groulx and Lacroix2007); (3) the melt film is very thin compared with the diameter of the thermal head, δ ≪ R, and a lubrication theory is valid for describing the melt film (Chen and others, Reference Chen, Chen, Zhao, Sun and Gong2008; Schüller and Kowalski, Reference Schüller and Kowalski2017); (4) viscous forces are dominant in the melt film, and ∂2/∂h 2 ≪ ∂2/∂s 2 (Chen and others, Reference Chen, Cheng, Luo and Zhu1994); (5) the pressure in the melt film is uniform in the s-direction (Batchelor, Reference Batchelor1967; Kumano and others, Reference Kumano, Saito, Okawa and Yamada2005b); (6) heat transfer in the melt film is dominated by conduction, and the heat transported through convective flow is negligible (Bahrami and Wang, Reference Bahrami and Wang1987; Chen and others, Reference Chen, Cheng, Luo and Zhu1994); (7) the temperature distribution in the melt film is linear (Groulx and Lacroix, Reference Groulx and Lacroix2003; Schüller and others, Reference Schüller, Kowalski and Råback2016); (8) the distribution of water velocity in the h-direction is paraboloidal; (9) the buoyancy force is ignored.
2.2. Mathematical model
Based on assumptions (1) to (5) above, the governing Navier–Stokes equation for the melt film is simplified, and the conservation equation of continuity/momentum can be written as follows:


The energy equation of the water film can also be simplified based on assumptions (1) and (6):

where $\alpha _{\rm w}{\rm} = k_{\rm w}{\rm /( }\rho _{\rm w}c_{\rm w})$ is the thermal diffusivity of water. At the water-ice interface Γp $( s = \delta )$
 , an energy-balance equation or Stefan condition exists, which is

During the drilling process, the axial load acting on the thermal head is always balanced by the pressure built in the water film. The force-balance equation is expressed as follows:

Boundary conditions are required for the velocity and temperature of the water film to enclose the model. At the working surface of the thermal head Γh, we have a no-slip, zero-inflow condition and a constant power input or constant temperature:


At the phase interface Γp, we also have a no-slip condition in the h-direction, which is

Considering the density variations owing to the phase change, the velocity component of the water film in the s-direction is

As mentioned above, the temperature at the phase interface Γp remains the melting point of ice, and the pressure in the outflow boundary of melt film Γw equals to hydrostatic water pressure in the borehole:


The governing equation for ice can be expressed using a steady advection-diffusion equation:

in which $\alpha _{\rm i}{\rm} = k_{\rm i}{\rm /( }\rho _{\rm i}c_{\rm i})$ is the thermal diffusivity of ice. The boundary conditions for Eqn (13) are expressed as follows:


In the view of the macro-scale power energy balance, the energy input from the thermal head can be divided into two parts. The first part is used to increase the initial temperature of the ice to the melting point temperature and then, transform the solid ice into liquid water, which can be calculated as follows:

The second part is lost when the melting ice flows out through the small gap between the thermal head and the ice. The lost power can be calculated by integrating the outflow boundary of the water film:

Assumptions (7) and (8) are adopted to simplify Eqn (17). Therefore, the average temperature in the melt film is expressed as follows:

The integration of the velocity component u in the outflow boundary becomes

Hence, Eqn (17) is rewritten as follows:

Based on assumption (7) and Eqn (3), the temperature of the thermal head under the PDC is

Thus, the lost power becomes

Under TDC, the lost power is represented using Eqn (20). The heat flux at the working surface of the thermal head can be evaluated as follows:

By integrating Eqn (23), the input power under TDC can be calculated as follows:

Regardless of the type of boundary condition used for the working surface of the thermal head, the macro-scale power balance equation is expressed as

This study mainly focuses on ice-melting process below thermal head. To eliminate the influence of water column in the melted borehole on the drilling process, the pressure in the outflow boundary of melt film can be set as zero and Eqn (12) becomes

In this situation, the force balance equation (5) should be rewritten as

where F* is the BCF named by Schüller and Kowalski (Reference Schüller and Kowalski2019) and can be expressed as:

In ice drilling engineering, the efficiency of a thermal head is defined, as expressed in Eqn (29), to evaluate the energy efficiency when drilling downward:

2.3. Model solution
An analytical-numerical hybrid method implemented into commercial software, COMSOL Multiphysics 5.3a, was developed to solve the model. As shown in Figure 2, the calculation process involves five steps:
(1) The values of the water-film thickness and ROP were initially assumed. The water-film thickness is in μm, and the ROP can be estimated using Eqn (16) if PDC is applied.
(2) The conservation equation of continuity/momentum and force balance equations are solved numerically by coupling a thin-film flow (shell) module and a solid mechanics module in the software. Subsequently, the updated values of the water-film thickness, flow velocity and pressure distribution in the water film can be obtained.
(3) As the updated value of the water-film thickness is known, the energy equation can be solved analytically. Eqn (21) is then used to calculate the temperature of the thermal head (PDC), whereas Eqns (23) and (24) can be used to estimate the input power of the thermal head (TDC).
(4) The power loss is computed, and the macro-scale power equation is then evaluated. If the macro-scale power equation is balanced, we can go to the next step. Otherwise, the initial V should be adjusted, and the steps above should be repeated until the equation becomes balanced.
(5) The advection-diffusion equation in ice is solved numerically to observe the temperature distribution in the ice column and to evaluate the range of heat disturbance. In the calculations, the ice is moved at a velocity V with respect to the thermal head.

Fig. 2. Flow diagram for calculating the proposed model.
In steps (2) and (5), the governing equations are solved numerically and a spherical thermal head, which is shown in Figure 3, is used as an example to demonstrate the meshes used in the two steps. In both the meshes, the ice block is divided into two parts: the active ice layer near water-ice interface and the inactive ice layer far from it. The active layer has a smaller mesh size than the inactive layer. The thickness of the active ice layer is chosen to be 20 mm. In step (2), the spherical surface is water film while it is ice in step (5). To calculate the accurate distance of heat disturbance, the mesh in step (5) is recalculated to be smaller than the mesh used in step (2), especially in the active ice layer. In Figure 3a, the active ice layer contains 5220 pentagonal prism mesh elements while the inactive ice layer contains 55174 tetrahedron mesh elements. With finer mesh, the active ice layer in Figure 3b contains 58788 pentagonal prism mesh elements and the inactive ice layer contains 105347 tetrahedron mesh elements. The software COMSOL Multiphysics 5.3a was run on a computer with Windows 10 platform. The computer has a CPU of Intel (R) Core (TM) i5-3230M and its RAM is 8 GB. Depending on the shape of the thermal head, the calculation time for step (2) varies from 10 to 15 min while the calculation time for step (5) is in the range of 3–6 min. The total time consumed by all five steps is ~40–60 min.

Fig. 3. Examples of the meshes used in the calculation process with COMSOL Multiphysics 5.3a: (a) step (2); and (b) step (5).
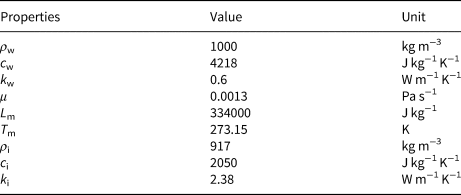
In our calculations, the physical properties of water and ice are assumed to be constant, as listed in Table 1.
Table 1. Physical properties of water and ice
2.4. Models comparison
To validate our model, our calculating results are compared with the analytical solutions given by Aamot (Reference Aamot1967) and Schüller and Kowalski (Reference Schüller and Kowalski2019). The initial conditions are taken from Schüller and Kowalski (Reference Schüller and Kowalski2019) where a cylindrical thermal head with a radius of 6 cm is used to drill ice in the vicinity of Enceladus' tiger stripes. During drilling, the power of the thermal head changes from 1000 to 5000 W while BCF is 0.1, 10 and 1000 N.
Aamot (Reference Aamot1967) ignored the power loss, so the ROP increases linearly with input power and the BCF had no influence on it (Fig. 4a). The maximum ROP for a predetermined power input calculated by Aamot's method is higher than our estimates. The ROP calculated in our model is a little higher than that in Schüller and Kowalski (Reference Schüller and Kowalski2019) except for the case where the BCF is 0.1 N. In the case of 0.1 N, the ROP starts to become lower than the results calculated by Schüller and Kowalski (Reference Schüller and Kowalski2019) when power is more than 2500 W. Generally, the discrepancy of ROP becomes bigger with increasing power. The maximum difference in ROP is 8% when BCF is 0.1 N while it is only ~2% if the BCF increases to 10 N or 1000 N.
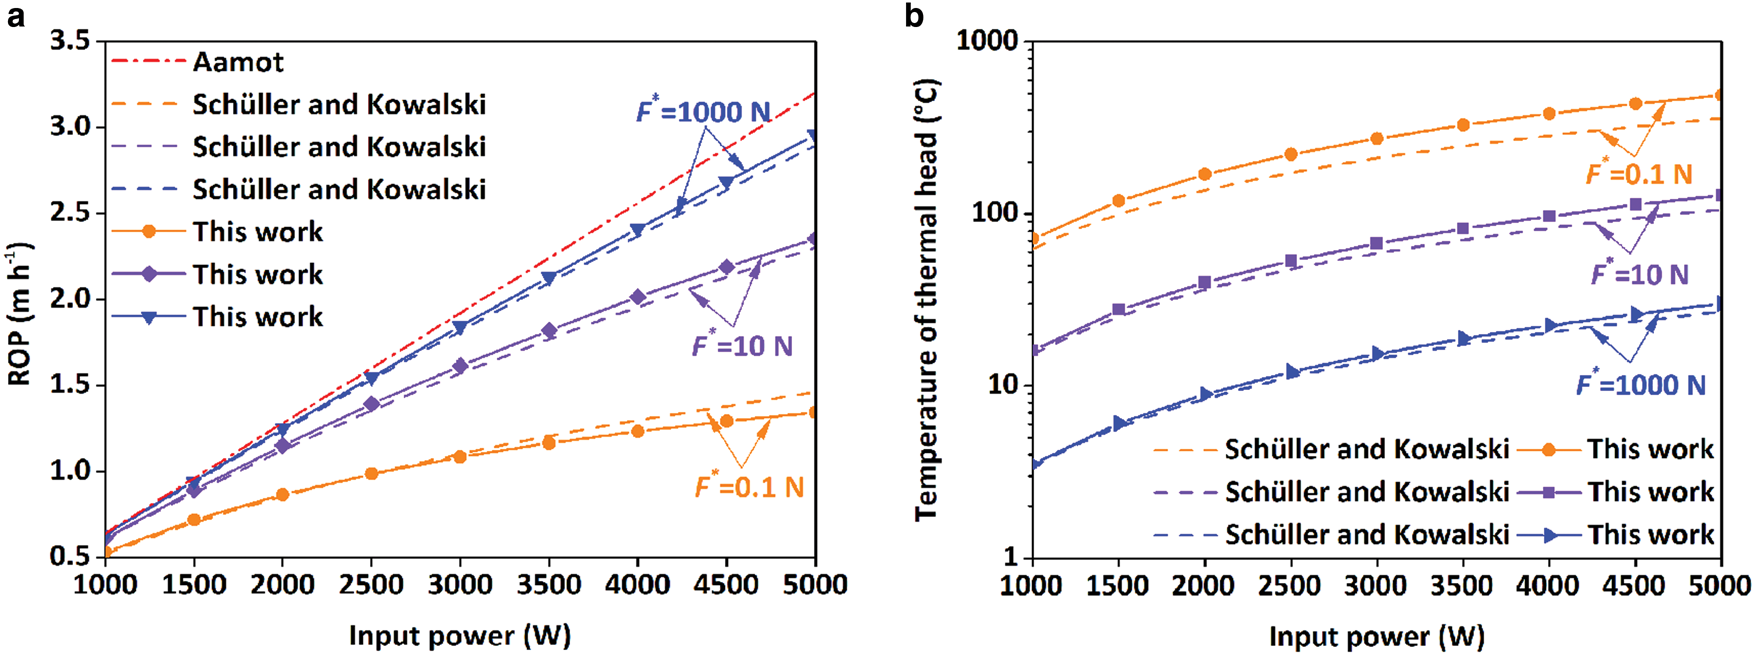
Fig. 4. Model validation by comparing with the analytical solutions given by Aamot (Reference Aamot1967) and Schüller and Kowalski (Reference Schüller and Kowalski2019): (a) ROP; (b) temperature of thermal head.
The difference in temperature of the thermal head is shown in Figure 4b. Similar to ROP, the temperature of the thermal head in our model is also higher than the value calculated by Schüller and Kowalski (Reference Schüller and Kowalski2019), but both models have the same trend in the temperature of thermal head. With the decrease of BCF, the discrepancy in the temperature of thermal head increases from 1.2 to 3.7%. This indicates a good agreement of our model with the analytical solution. Schüller and Kowalski (Reference Schüller and Kowalski2019) assumed that the heat transported by convective flow affects temperature distribution and a quadratic polynomial Ansatz for the temperature field in s direction was taken. This is the main reason which leads to the difference between our results and the analytical solution.
3. Results and discussion
3.1. Effect of thermal head shape
Four thermal heads with cylindrical, spherical, paraboloidal and conical shapes, respectively (Fig. 5), were applied to investigate how the shape of the thermal head influences the thermal drilling process. The radius of each of the thermal heads was 6 cm. The area of the working surface for the spherical, paraboloidal and conical thermal head was the same, whereas that for the cylindrical thermal head was one-half of the others. This difference indicates a double heat flux for the cylindrical thermal head under PDC. In the calculations, only a quarter of the thermal heads were used owing to their axisymmetric property.

Fig. 5. Four thermal heads with different shapes (working surfaces of the thermal heads are marked by red).
3.1.1 PDC
All the thermal heads were used to drill into −30°C ice with a power of 5000 W and a BCF of 1000 N. The distribution of the film thickness is shown in Figure 6a. The film thickness is even for the cylindrical and conical thermal heads. The paraboloidal thermal head had the highest difference in film thickness, and the film thickness decreased gradually from the center of the working surface to the outer edge. At the center of its working surface, the film thickness was close to 126 μm The cylindrical thermal head had the smallest film thickness.
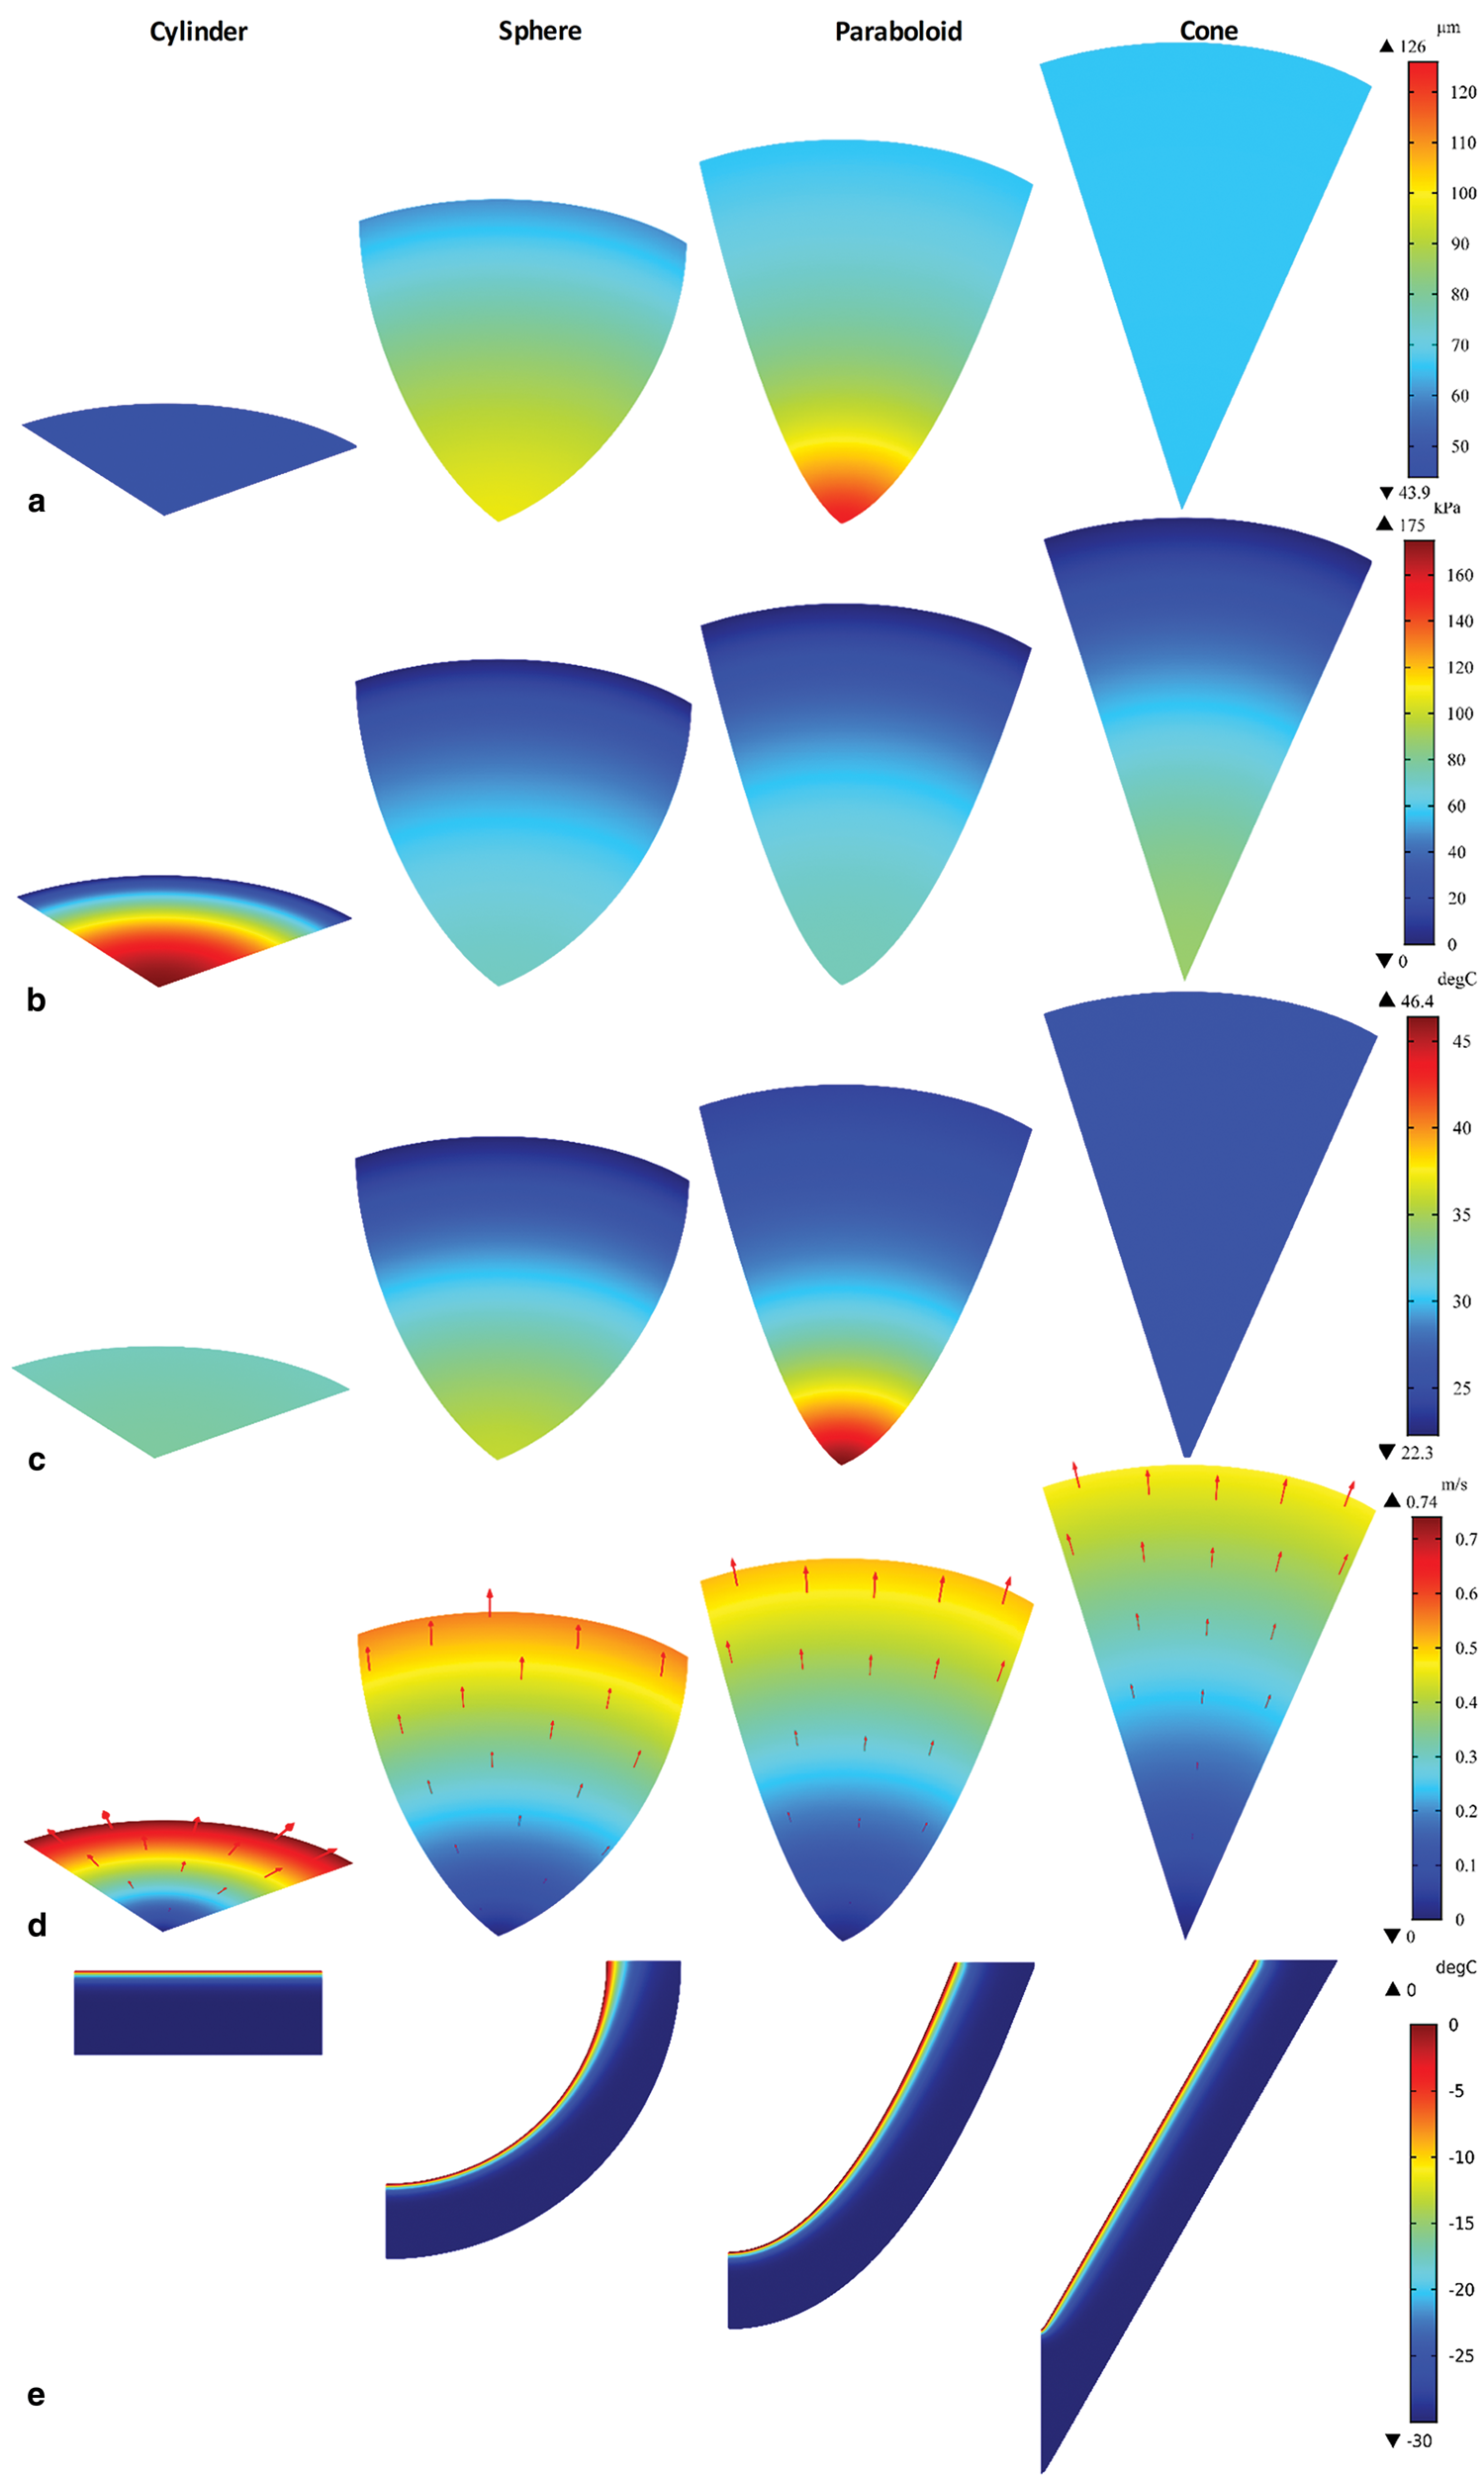
Fig. 6. Influence of thermal head shape on (a) film thickness; (b) pressure in melt film; (c) temperature of thermal head; (d) flow velocity of melt film; (e) temperature distribution in the active ice layer under PDC.
Figure 6b shows the pressure distribution in the water film. From the center of the working surface to the outer edge, the water pressure under the cylindrical thermal head varied from 175 to 0 kPa. For the other thermal heads, the change in pressure was not as significant as that of the cylindrical thermal head. The temperature values of the cylindrical and conical thermal heads were comparatively more uniform, and the paraboloidal thermal head had the highest temperature difference (Fig. 6c). With the input power of 5000 W, the working surface of the paraboloidal thermal head reached 46.4°C at its center. For the spherical and paraboloidal thermal heads, the temperature decreased gradually from the center of the working surface to its outer edge.
In Figure 6d, the maximum tangential velocity of the melt film u max is shown, and the flow direction is marked using red arrows. Irrespective of the thermal head type, the flow velocity increased from the center of the working surface to its outer edge, and the velocity at the center remained zero. At the outflow boundary of the melt film, the order of the flow velocity was as follows: cylinder > sphere > paraboloid > cone. The maximum flow velocity at the outflow boundary of the water film was 0.74 m s−1, which means that the water was squeezed out as jetting.
The temperature distribution in the active ice layer is shown in Figure 6e. The range of the heat disturbance is narrow, and the non-heat-disturbed isothermal virtual surface had almost the same profile as the thermal head. For the spherical thermal head and the paraboloidal thermal head, the temperature gradient became smaller with increasing distance from the center of working surfaces.
As shown in Figure 7, the order of ROP for the thermal heads at the same power is as follows: sphere > paraboloid > cone > cylinder. However, the difference in ROP was minimal; for example, the spherical thermal head could only drill 3.6% faster than the cylindrical thermal head. The difference in ROP between the paraboloidal and conical thermal heads was even smaller, namely <0.7%. It can also be observed that a higher ROP always indicates a lower power loss fraction, which is the ratio of lost power to input power. Correspondingly, the thermal head with higher ROP has higher efficiency. The conical thermal head had the smallest heat disturbance range, whereas the cylindrical thermal head had the broadest range. From the results reported above, a thermal head with a spherical shape should be used for drilling under PDCs.
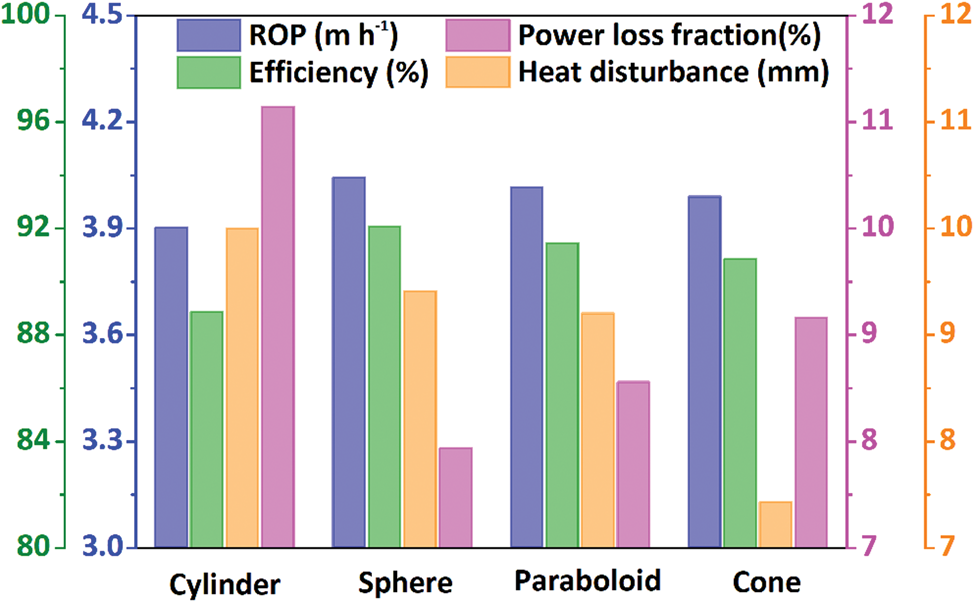
Fig. 7. Influence of thermal head shape on ROP, efficiency of thermal head, power loss fraction and distance of heat disturbance under PDC.
For an electrically heated thermal head, its shape usually influences the distribution of heaters, which consequently influences the heat distribution on the thermal head. Thus, in designing a thermal head, the fitting shape of the thermal head can only be determined by considering both the shape effect and the heater distribution.
3.1.2 TDC
Ice at −30°C was modeled for drilling using the four thermal heads at 20°C to evaluate the shape effect of the thermal head under TDC. The BCF had a constant value of 1000 N throughout the drilling process. Similar to the case under PDC, the cylindrical and conical thermal heads had a uniform film thickness, and the cylindrical thermal head had the smallest film thickness (Fig. 8a). The spherical thermal head had a higher difference in film thickness than the paraboloidal thermal head, which was different from the situation under the PDC. The largest film thickness existed at the center of the working surface in the spherical thermal head.

Fig. 8. Influence of thermal-head shape on (a) film thickness; (b) pressure in melt film; (c) heat flux of thermal head; (d) flow velocity of melt film; (e) temperature distribution in the active ice layer under TDC.
As shown in Figure 8b, the pressure distribution under TDC was entirely similar to that under PDC. Figure 9c displays the heat flux of the thermal head under TDC. The heat flux in the cylindrical thermal head was more uniform and significantly higher than that of the other thermal heads. The spherical thermal head had the most significant difference in terms of heat flux, and the value increased from 11.6 to 23.8 W cm−2. The heat flux of the conical thermal head was also evenly distributed and was ~18 W cm−2.

Fig. 9. Influence of thermal head shape on ROP, efficiency of thermal head, input power and distance of heat disturbance under TDC.
As depicted in Figure 8d, the distribution of the maximum tangential flow velocity under TDC was similar to that of PDC. The flow velocity increased from zero at the center of the working surface to its maximum value at the outflow boundary, and the maximum velocity was obtained for the cylindrical thermal head. Figure 8e illustrates the temperature distribution in the active ice layer. By comparison, it can be seen that there is an insignificant difference in the ice temperature distribution, regardless of the heat condition type applied to the thermal heads.
When a constant temperature of 20°C was applied to the working surface of the thermal heads, the order of the penetration rate was as follows: cone > paraboloid > sphere > cylinder (Fig. 9). The conical thermal head could melt ice at a velocity of 3.33 m h−1, whereas the cylindrical thermal head could only drill at a penetration rate as high as 2.79 m h−1. The order of the calculated input power is the same as the penetration rate, which suggests that a higher ROP requires a higher input power. For all the thermal heads, the efficiency was 92.8%. In contrast to the penetration rate, the heat disturbance distance for the cylindrical thermal head was the longest, whereas that of the conical thermal head was the shortest.
3.2. Effect of cone angle
Cone is the most widely used shape for thermal heads. To study how the cone angle affects the thermal drilling process, the conical thermal heads with cone angles varying from 20 to 180° were investigated under both PDC and TDC. All the conical thermal heads have a radius of 6 cm. With increasing cone angle, the working surface area of the thermal heads gradually decreases. The decreasing rate is high at the beginning, and then, it becomes lower.
3.2.1 PDC
The thermal heads with different cone angles were modeled with input power of 5000 W, BCF of 1000 N and ice temperature of −30°C. The thickness, pressure and flow velocity of water film increase with the increase of cone angle, while the temperature of thermal head decreases (Fig. 10a). The changing rate of the parameters has the same trend as the working surface area of the thermal heads. With the increase of cone angle, the differences in the water-film thickness and thermal head temperature become smaller. For example, the difference in film thickness decreases from 20 to 1 μm when cone angle increases from 20 to 180°. As shown in Figure 10b, the penetration rate and efficiency of conical thermal head decrease with cone angle. However, it should be mentioned that the decreases in ROP and efficiency are quite small. For example, the ROP and efficiency only decrease 0.189 m h−1 and 4.4%, respectively, when cone angle increases from 20 to 180°. The power loss increases with the increase of cone angle, while the range of heat disturbance in ice first decreases quickly and then increases a little. When cone angle is 60°, the thermal head has the minimum heat disturbance on ice.
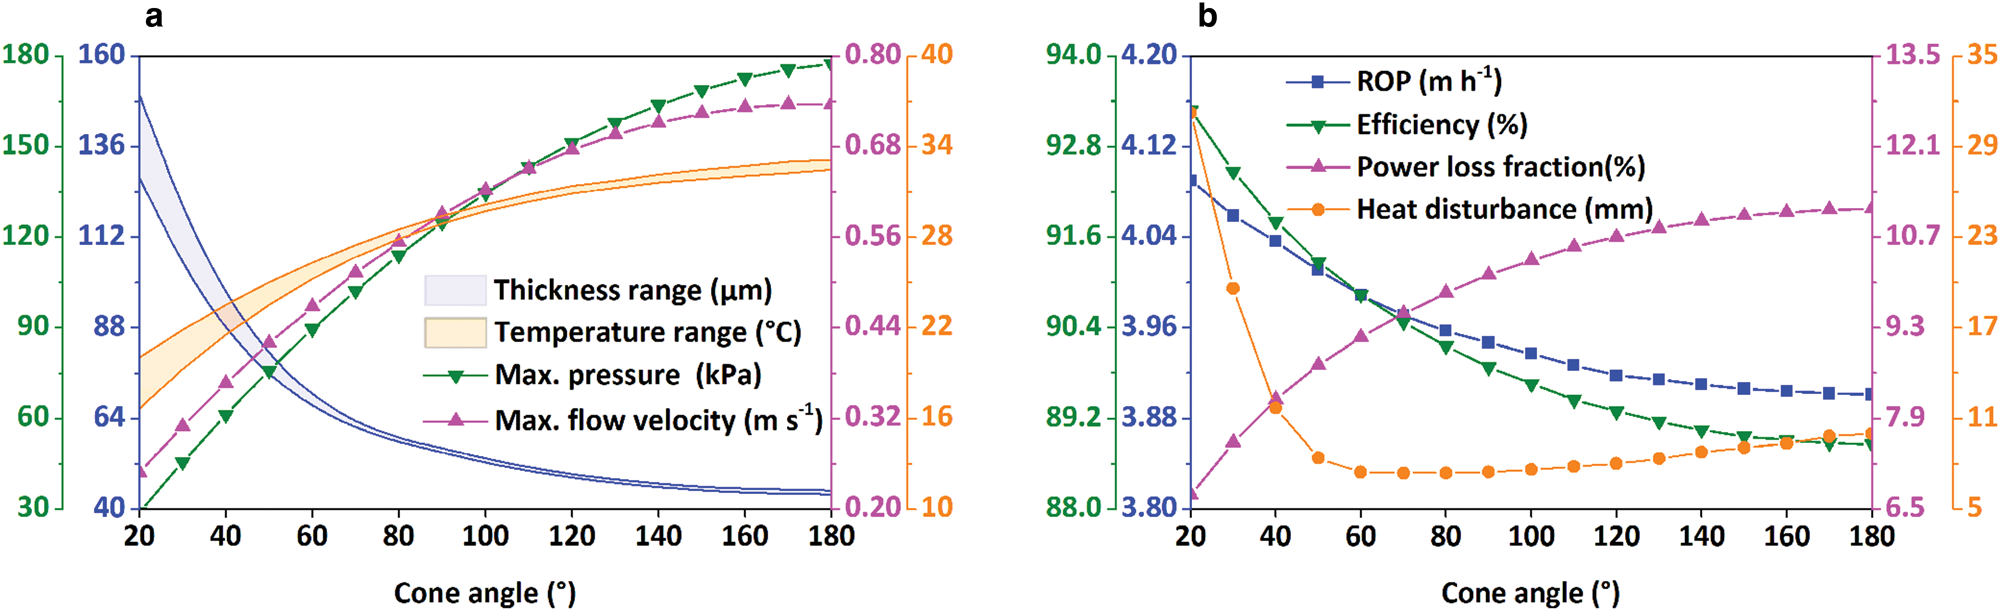
Fig. 10. Influence of cone angle on (a) film thickness, temperature of thermal head, maximum pressure and flow velocity in melt film; (b) ROP, efficiency of thermal head, power loss fraction and distance of heat disturbance under PDC.
3.2.2 TDC
The working surfaces of the conical thermal heads with different cone angles were assumed to be 20°C to investigate the effects of cone angle under TDC. In thermal modeling, BCF on the thermal heads is 1000 N and ice temperature remains −30°C. Under TDC, the variation of the parameters shown in Figure 11a, such as thickness, pressure and flow velocity of the melt film, has the same trends as the case under PDC. The heat flux of thermal head increases with the increase in cone angle, while the difference in heat flux decreases. As shown in Figure 11b, the ROP decreases quickly when cone angle is small. When cone angle becomes bigger, the reduction rate of ROP becomes smaller. Correspondingly, the input power also decreases with the increase of cone angle. Cone angle has no influence on thermal head efficiency. The change of heat disturbance distance with cone angle under TDC is the same as the case under PDC.
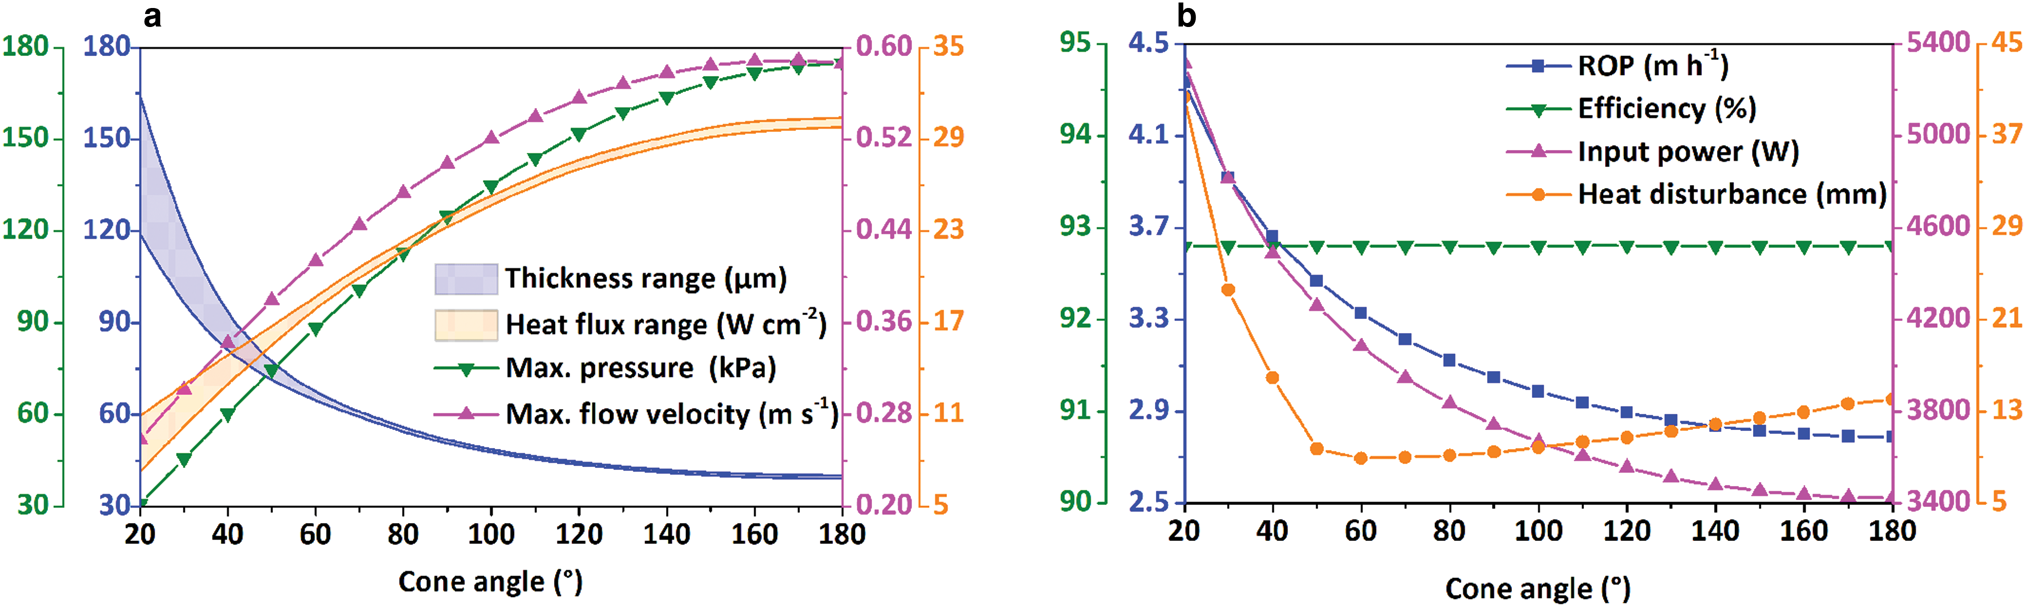
Fig. 11. Influence of cone angle on (a) film thickness, heat flux of thermal head, maximum pressure and flow velocity in melt film; (b) ROP, efficiency of thermal head, input power and distance of heat disturbance under TDC.
Generally, the decrease in cone angle can lead to the increase of ROP, but the increase is quite small. In designing a conical thermal head, it is suggested that the cone angle, material consumption, heater distribution and other factors should be considered together. It is not worthy to pursue a small cone angle for just a little improvement in ROP by sacrificing other factors.
3.3. Effect of buoyancy corrected force
Compared with other thermal heads, the calculation time for the cylindrical thermal head was shorter based on the output using COMSOL Multiphysics 5.3a. Hence, in the following sections, only the cylindrical thermal head is reported in analyzing the effects of the BCF, thermal head power (or temperature) and ice temperature.
3.3.1 PDC
The cylindrical thermal head with a power of 5000 W was modeled for drilling ice at −30°C, and the BCF varied from 1 to 10000 N. As shown in Figure 12a, the maximum pressure and flow velocity of the water film increased with BCF, while the film thickness and thermal head temperature decreased. With the increase in BCF, the differences in the water-film thickness and thermal head temperature, respectively, become higher. For example, the thermal head temperature was uniformly distributed when the BCF was <1000 N, but the temperature difference increased to 6.3°C when the BCF reached 10000 N. The higher the BCF, the faster the penetration rate (Fig. 12b). However, it should be mentioned that the rate of increase in ROP significantly reduces with the increase in the BCF. For example, ROP increased 1.32 m h−1 from 1 to 100 N, whereas it only increased 0.26 m h−1 from 1000 to 10000 N. The efficiency of the thermal head showed a similar trend as the ROP because the power loss decreases as the BCF increases. The range of the heat disturbance decreased gradually with the increase in BCF. This trend occurred because the cylindrical thermal head drilled faster with increased BCF, and there was no enough time to warm up the surrounding ice.
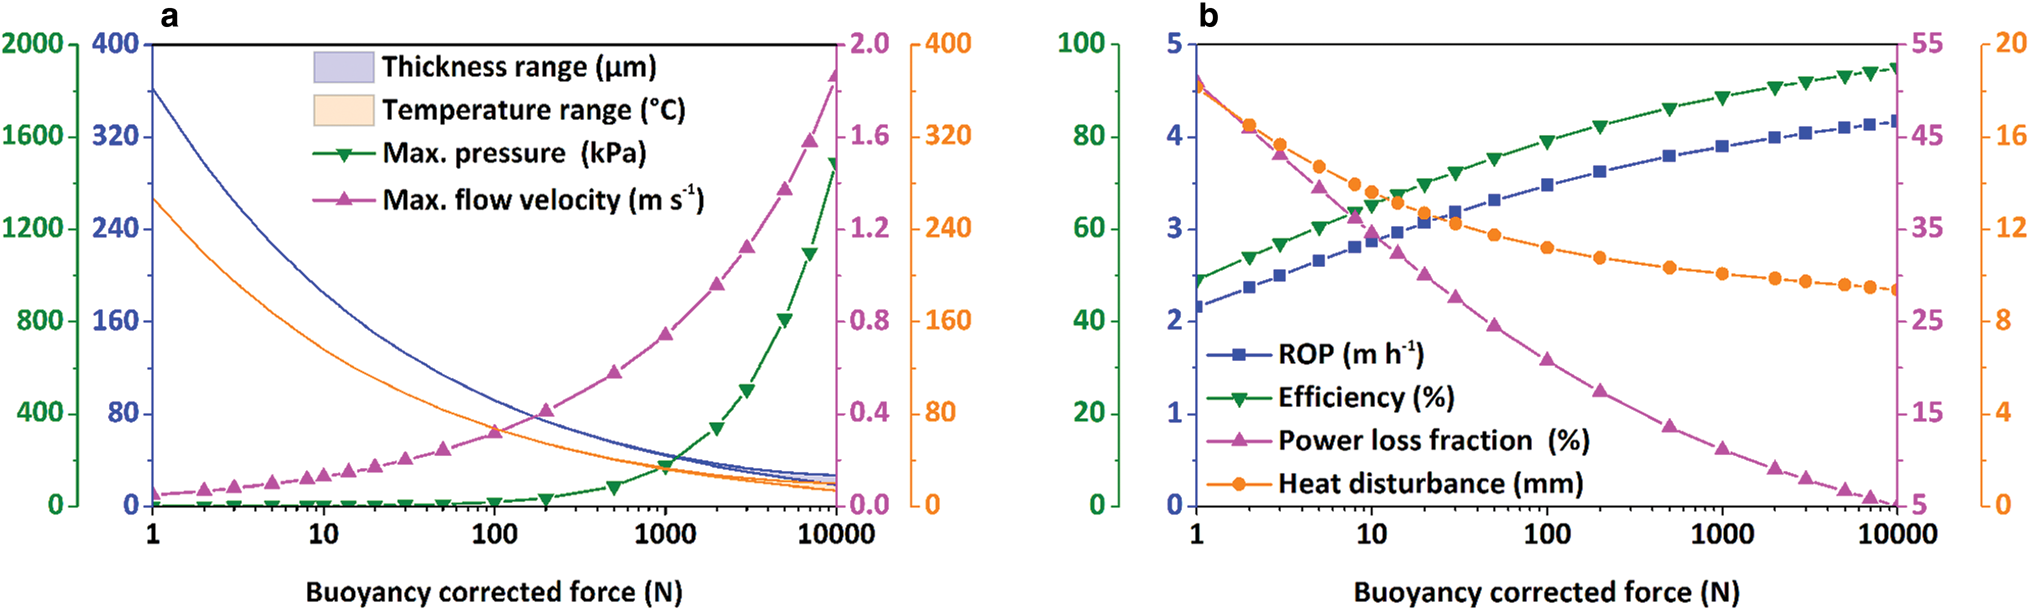
Fig. 12. Influence of buoyancy corrected force on (a) film thickness, temperature of thermal head, maximum pressure and flow velocity in melt film; (b) ROP, efficiency of thermal head, power loss fraction and distance of heat disturbance under PDC.
3.3.2 TDC
The modeled cylindrical thermal head was heated at 20°C to determine the effect of the BCF under TDC. Other working conditions were the same as those in the previous section. As depicted in Figure 13a, the water-film thickness decreased as the BCF increased. The pressure and flow velocity in the water film increased with BCF. Similar to PDC, the difference in the film thickness increased with BCF. Correspondingly, the difference in heat flux also increased. For example, when the BCF was 10000 N, the maximum heat flux on the working surface of the cylindrical thermal head could be 18.7 W cm−2 higher than the minimum value of the heat flux. Under TDC, the heat flux of the thermal head increased with BCF. Consequently, the power input on the thermal head and the ROP also increased (Fig. 13b). The BCF did not influence the efficiency of the thermal head under TDC, and the efficiency was maintained at 92.8%. Just as in the previous case for PDC, the heat disturbance distance decreased with the increase in BCF.
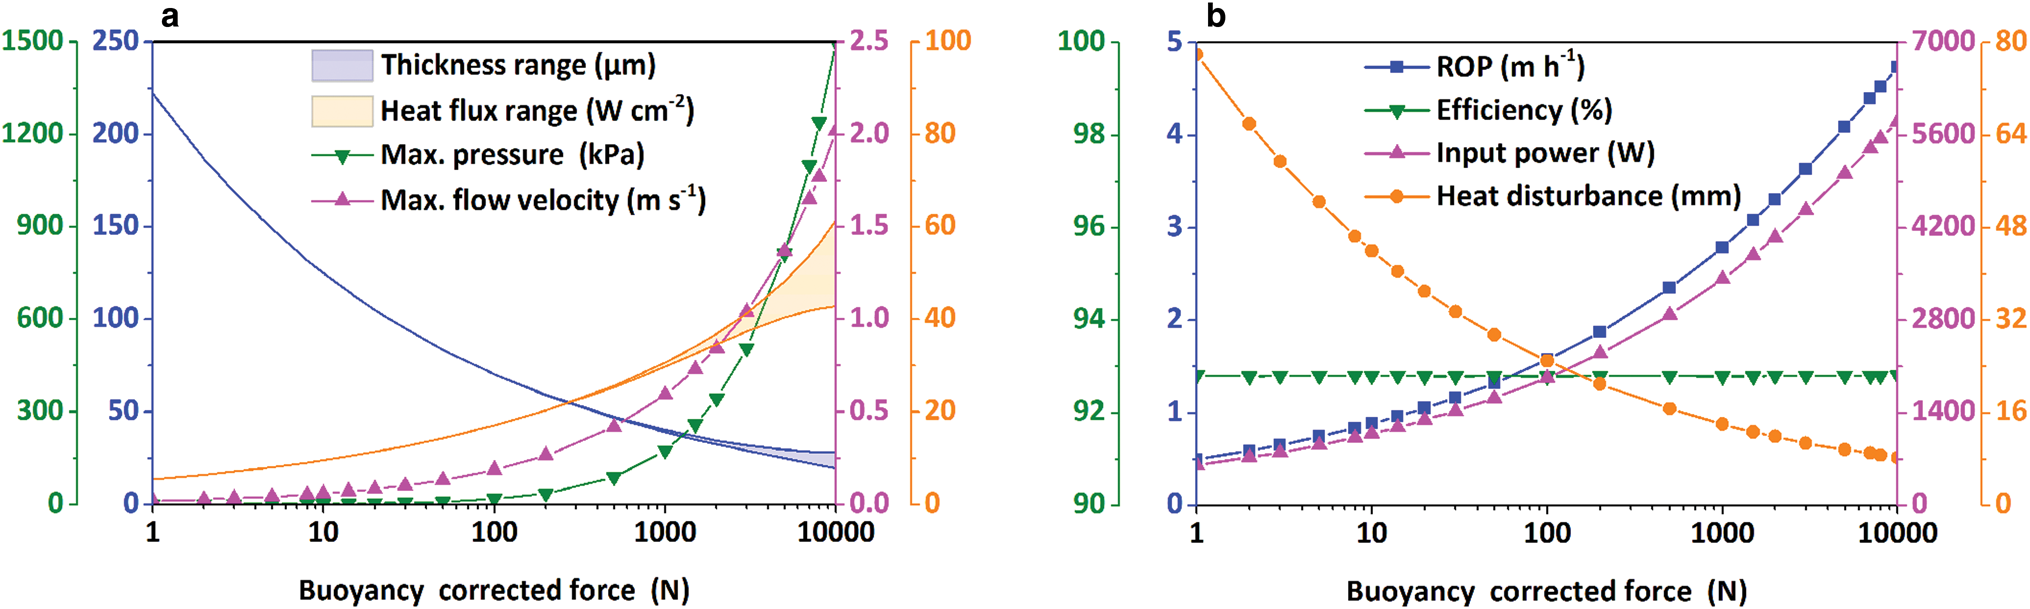
Fig. 13. Influence of buoyancy corrected force on (a) film thickness, heat flux of thermal head, maximum pressure and flow velocity in melt film; (b) ROP, efficiency of thermal head, input power and distance of heat disturbance under TDC.
Generally, the ROP of a thermal head increases with BCF, which is provided by the weight of the hot-point drill. Therefore, it is better to add a dead weight on a light hot-point drill to increase the axial load acting on the thermal head. For a heavy hot-point drill, its weight in water is usually enough to achieve a high ROP, and the addition of an extra dead weight only increases the ROP slightly and makes the hot-point drill complex. It should be noted that in practice, adding a very high axial load on the thermal head may tilt the hot-point drill.
3.4. Effect of power (or temperature)
3.4.1 PDC
The cylindrical thermal head with power ranging from 1000 to 5000 W was used to analyze the effect of power on the drilling process. During the drilling process, the ice temperature was assumed to be −30°C, and a constant BCF of 200 N acted on the thermal head. The results are presented in Figure 14a. The thickness and the flow velocity of the water film increased with the power. It is worth noting that the temperature of the thermal head increased linearly with input power. Both differences in the thermal head temperature and film thickness remained the same when the input power increased. The maximum pressure in the water film did not vary with the input power. As depicted in Figure 14b, the ROP continued to increase as the input power increased. This trend occurred because the increasing quantity of input power was significantly higher than that of heat loss. As an example, when input power increased from 1000 to 5000 W, the power loss only increased from 25 to 870 W. As a result, the efficiency of the thermal head decreased almost linearly from 97.5% at 1000 W to 82.6% at 5000 W. The distance of the heat disturbance initially decreased rapidly and then slowly.
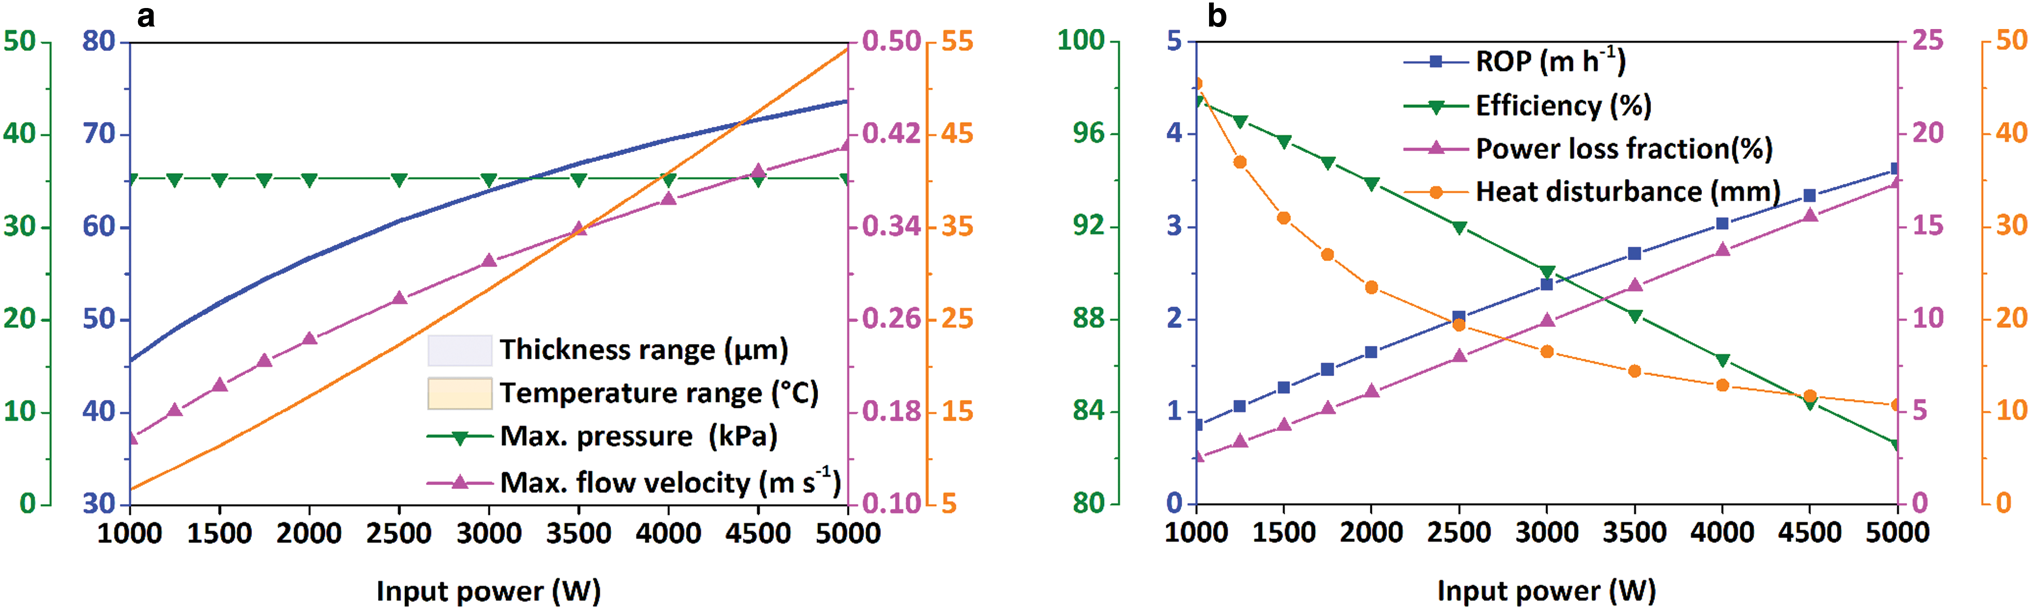
Fig. 14. Influence of power on (a) film thickness, temperature of thermal head, maximum pressure and flow velocity in melt film; (b) ROP, efficiency of thermal head, power loss fraction and distance of heat disturbance under PDC.
3.4.2 TDC
The temperature of the cylindrical thermal head was assumed to change from 5 to 40°C to evaluate the effect of the thermal head temperature on the drilling process. Similar to the effect of the input power, the maximum flow velocity and water-film thickness increased with thermal head temperature (Fig. 15a). The heat flux of the thermal head increased almost linearly with the temperature, which means that a higher input power is required to obtain a higher temperature on the working surface of the thermal head. The temperature of the thermal head did not influence the pressure in the water film. As shown in Figure 15b, the ROP increases with the thermal head temperature. Similarly, the input power also increased. However, the efficiency of the thermal head decreased from 98.1% at 5°C to 86.6% at 40°C. As previously highlighted, a higher ROP reduces the heat disturbance distance; therefore, the range of the heat disturbance under TDC decreased with the increased thermal head temperature.

Fig. 15. Influence of temperature on (a) film thickness, heat flux of thermal head, maximum pressure and flow velocity in melt film; (b) ROP, efficiency of thermal head, input power and distance of heat disturbance under TDC.
3.5. Effect of ice temperature
3.5.1 PDC
We assume that the cylindrical thermal head had an input power of 5000 W and a BCF of 200 N to study the effect of ice temperature on the drilling process under PDC. The ice temperature varied from −60 to 0°C. All the parameters displayed in Figure 16a increased with the ice temperature, except for the pressure in the water film, which remained constant. Combined with the discussion above, we suggest that only the thermal head shape and the BCF influence the pressure distribution in the water film. Similar to the effect of input power, the differences in water-film thickness and thermal head temperature did not change with ice temperature.
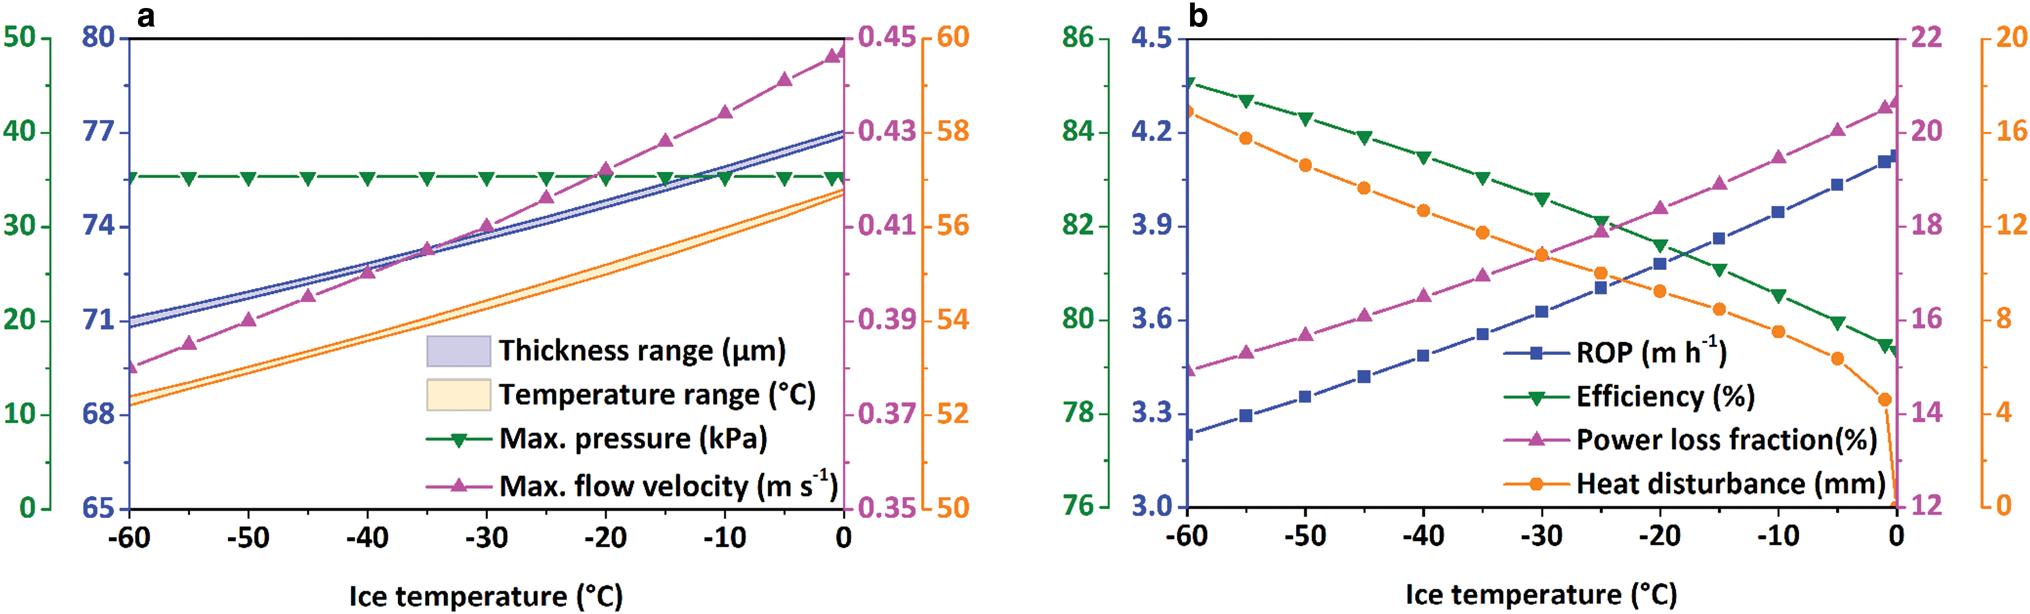
Fig. 16. Influence of ice temperature on (a) film thickness, temperature of thermal head, maximum pressure and flow velocity in melt film; (b) ROP, efficiency of thermal head, power loss fraction and distance of heat disturbance under PDC.
The variation of the penetration rate is shown in Figure 16b, and the ROP increases with ice temperature. However, the increase in ROP caused by the ice temperature was smaller than that caused by the BCF and input power. For instance, the maximum increase in ROP caused by the ice temperature was only 0.89 m h−1, whereas the value increased to 2.01 and 2.77 m h−1 for BCF and input power, respectively. The power loss fraction also increased with ice temperature, and consequently, the efficiency of the thermal head decreased. When ice temperature was lower than −5°C, the heat disturbance distance decreased gradually. However, when the ice temperature was above −5°C, it decreased rapidly.
3.5.2 TDC
To evaluate the effect of ice temperature under TDC, the drilling condition was set to be the same conditions as under PDC, except that the working surface of the cylindrical thermal head was heated by applying a constant temperature of 20°C. As shown in Figure 17a, both the thickness and maximum flow velocity of the water film increased when the ice temperature increased from −60 to 0°C. As ice temperature increased, the heat flux on the thermal head decreased, while the pressure in the water film remained constant. Figure 17b shows the variation of the ROP, thermal head efficiency, input power and heat disturbance distance with ice temperature. In Figure 17b, only the ROP increases with increased ice temperature. Consistent with the variation in heat flux, the input power of the thermal head decreased as ice temperature increased. This result means that less power is required to maintain the working surface of the cylindrical thermal head at 20°C when ice becomes warmer. For the heat disturbance distance, the variation under TDC was similar to the case under PDC.
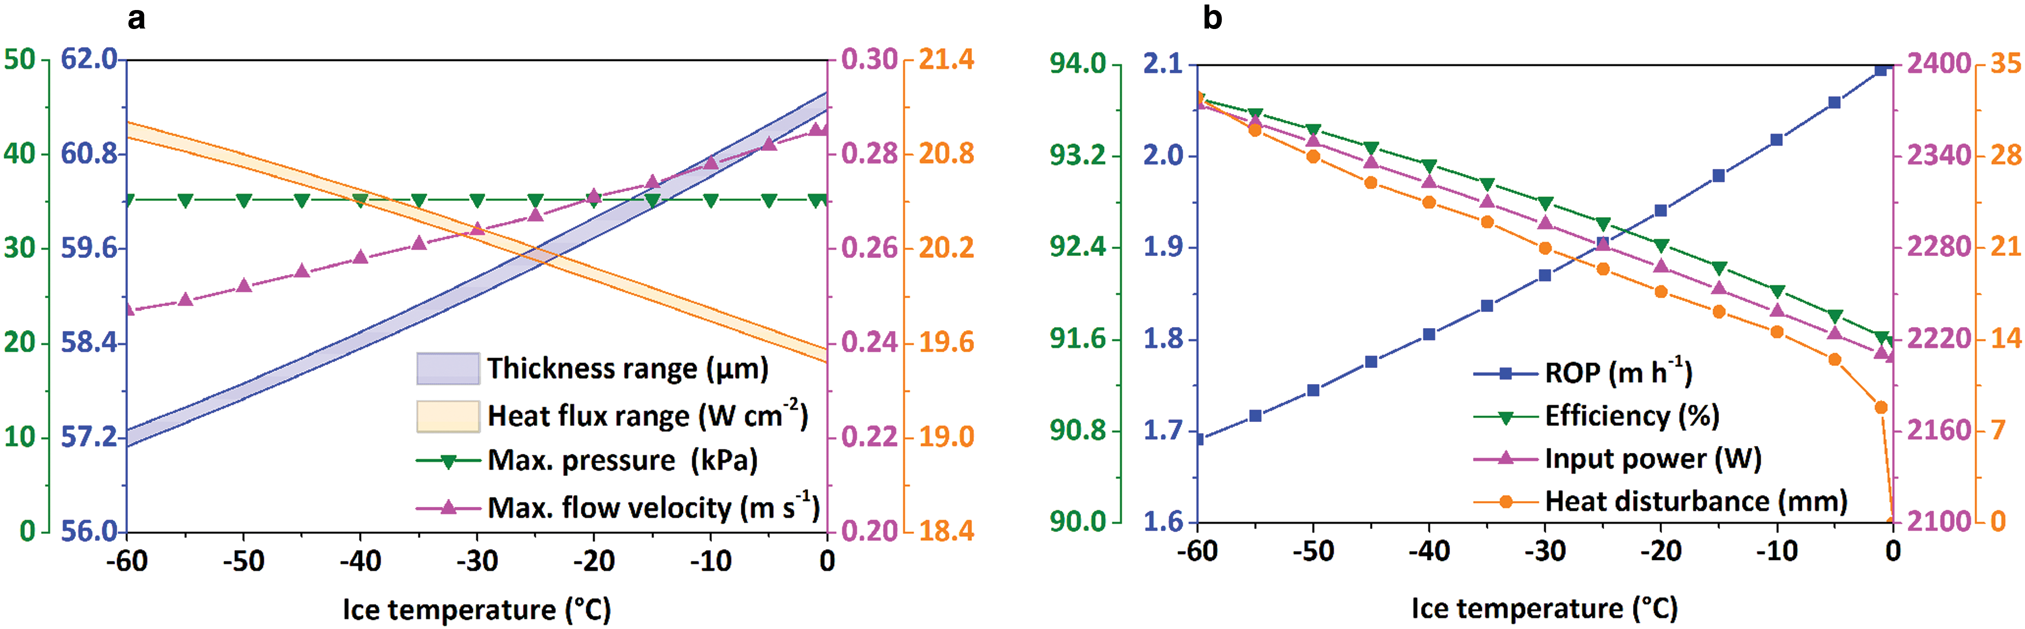
Fig. 17. Influence of ice temperature on (a) film thickness, heat flux of thermal head, maximum pressure and flow velocity in melt film; (b) ROP, efficiency of thermal head, input power and distance of heat disturbance under TDC.
Under both PDC and TDC, the ROP always increased with ice temperature. In the Antarctic ice sheet, the ice temperature usually increases with depth, so a hot-point drill will penetrate faster with increasing borehole depth. More power is required to reach the desired ROP for cold glaciers than for temperate glaciers. Similarly, drilling in extraterrestrial planets, such as Saturn's moon, Enceladus, and Jupiter's moon, Europa, will consume more energy in warming the ice to its melting point than for drilling in a terrestrial environment.
In summary, thin water film, low flow velocity and low water-film temperature can always result in a high penetration rate and small heat disturbance range. However, the BCF, thermal head power (or temperature) and ice temperature have mixed influence on the variables mentioned above. For example, an increase in BCF under PDC can result in a thinner water film and lower water-film temperature, which helps to increase ROP. Conversely, increasing the BCF can also lead to a faster flow velocity. The increase in ROP with BCF is the combined effect of these variables.
4. Conclusions
In this study, a thermal model was developed to evaluate the drilling performance of hot-point drills in ice. Under both PDC and TDC, the model was implemented using COMSOL Multiphysics 5.3a software to determine the effects of thermal head shape, cone angle, BCF, thermal head power (or temperature) and ice temperature. Based on the obtained calculation results, the following conclusions are summarized:
(1) The desired shape of the thermal head for the highest ROP is sphere under PDC and cone under TDC. The effect of thermal head shape on ROP is significantly lower compared with that of other variables; thus, the shape of the thermal head is not a critical factor to consider in the design of hot-point drills.
(2) A thermal head with a long cone shape is more aggressive than a thermal head with a short cone shape, but the increase in ROP is not big. In designing a conical thermal head, small cone angle can only improve the ROP a little.
(3) The ROP increases with BCF, but the effect of BCF decreases with the increase in BCF. It is recommended that a dead weight should be added to a lightweight hot-point drill while the axial load of a heavy hot-point drill should be reduced to prevent the tilting of the borehole. Typically, a specific BCF of 35 N cm−2 is high enough to achieve the desired ROP.
(4) The increase in power (under PDC) or temperature (under TDC) of the thermal head leads to an increase in ROP. Hence, in engineering practice, increasing the power or temperature of the thermal head is the most common and simplest method to apply for obtaining a high ROP.
(5) Irrespective of the heated boundary condition used for thermal heads, the ROP increases with increasing ice temperature. Ice temperature is an uncontrollable environmental factor that exists during drilling. It is reasonable to use a hypothetical ice temperature profile of targeted glaciers or ice sheets to design and manufacture hot-point drills, so that the required power of the thermal head and the ROP of the hot-point drill during the actual drilling can be estimated more precisely.
Acknowledgments
This work was supported by the Ministry of Science and Technology of the People's Republic of China (grant No. 2016YFC1400300), the National Nature Science Foundation of China (grant No. 41706214 and grant No. 41941005) and the Program for Jilin University Science and Technology Innovative Research Team (grant No. 2017TD-24). We thank the anonymous reviewers for their fruitful suggestions, useful comments and editing.


 Open access