
Public Space Layout Optimization in Affordable Housing Based on Social Network Analysis


1
Department of Urban Planning, School of Urban Design, Wuhan University, Wuhan 430072, China
2
Department of Graphics and Digital Technology, School of Urban Design, Wuhan University, Wuhan 430072, China
*
Author to whom correspondence should be addressed.
Land 2021, 10(9), 955; https://doi.org/10.3390/land10090955
Submission received: 6 August 2021
/
Revised: 2 September 2021
/
Accepted: 2 September 2021
/
Published: 8 September 2021
(This article belongs to the Special Issue Urbanization and Landscape Change: Tools for Analyzing Socioeconomic and Environmental Issues)
Abstract
:The efficient use of public space in affordable housing is of great significance to the physical and mental health of low-income and aging residents. Previous studies have evaluated the layout and quality of public space in residential areas based on residents’ subjective satisfaction, however, there still lack studies exploring residents’ behavior patterns and the use of public spaces based on objective measurement standards. Therefore, this paper selected the public space in the large affordable housing areas in the suburbs as the research object and used social network analysis (SNA) to objectively evaluate the network density, clustering coefficient and small-world value of the public space in affordable housing from the perspective of the physical spatial network of the built public space. Based on the network structure characteristics of existing public spaces, this paper further explores the relationship between the frequency of public space use in and the characteristics of nodes’ social networks and their own attributes, and the influence of public space layout structure on the behavioral patterns of affordable housing residents. This paper puts forward proposals for the renovation and optimization of public space according to the behavioral preferences of affordable housing residents, so as to complete the network of public space, promote the interaction and communication of residents in the residential area, enhance the residents’ experience of using public space and improve the living standard of residents in the residential area.
1. Introduction
In recent years, China has tightened regulation through rigid policy constraints on the adding of new quota of land for construction. A large number of studies have focused on the improvement of urban living environment and the renewal of old neighborhoods, making proposals to improve the living environment from spatial, policy, social and capital perspectives [1,2,3,4,5]. In particular, it is suggested that since the more early-built large affordable housing settlements tend to be located in remote areas, with poor mobility of residents and insufficient supply of public services in the surrounding areas, the living environment in the affordable housing area has a great impact on the health of its residents [6,7,8].
The public space and activity facilities in affordable housing areas are the main places for residents to engage in physical activities. Moreover, their high-frequency, efficient and high-quality use can significantly improve the health, enrich the daily lives, enhance the sense of identity and belonging and improve the quality of life of residents in affordable housing [9,10,11,12].
Most of the existing studies on the mechanisms influencing the use of public spaces and facilities in affordable housing areas have been conducted from the perspectives of user satisfaction and construction quality evaluation, with personal attributes of residents, accessibility of nodes and construction and maintenance quality evaluation as the main factors influencing their usage intensity [13,14]. Many studies have pointed out that the factors affecting the intensity of use of community spaces and facilities include residents’ personal attributes, such as age, education, work intensity, household income and family composition. Residents with younger age, higher education, more stable work intensity, higher household income and a larger proportion of children in the household have a higher frequency of using public activity spaces and facilities in the community [15]. In addition, the quality of public spaces and facilities (e.g., green space ratio, diversity of facilities) [16,17,18], accessibility (e.g., shortest route) [19,20,21] and demand preference [22,23,24], and management and maintenance level are also influencing factors [25]. Among them, construction quality and demand preference have significant effects on the intensity of use of public spaces and facilities. Some studies have also suggested that the utilization and satisfaction of public spaces and facilities in settlements can be significantly improved if they are built according to the characteristics of the local climate, with a greater number and diversity of spaces [26,27].
However, most studies have focused on general urban settlements, ignoring the differentiated needs of residents in affordable housing communities. Moreover, most of the spatial evaluation methods are subjective and cannot analyze the impact mechanisms of public spaces and facilities in the settlements as a whole. What is more, their findings are not able to correlate the spatial structure to behavior of residents and provide limited reference on how to transform public spaces and facilities at the spatial level to improve their intensity of use.
Recent studies have shown that social network analysis is able to analyze the relationships between individuals in a network, reflecting both the overall characteristics of the network structure and the position of individual objects in the network structure. In contrast, social network analysis is more objective, and it facilitates spatial simulation, so that the network characteristics of each node can be correlated with the activity patterns of residents for analysis [28,29,30,31]. The state of the urban spatial network of public spaces and facilities affects the efficiency of their use, and the social network analysis was used to analyze and stimulate the public space and facilities in affordable housing areas [32]. A complete and systematic urban spatial network can promote communication among residents, enhance the frequency and efficiency of the use of public space, and satisfy the inward demand of residents for internal public space use. It is also suggested in some studies that social network analysis can be used to graphically represent the nodes and paths of public space, so that the missing network relationships can be clearly understood at a glance [33,34]. At the same time, social network analysis can simulate the relationship of public space network after adding nodes or paths and observe the effect of public space network construction in real time, which gives more feedback [35,36].
However, the size of settlements may affect the results of social network analysis. When the settlement size is limited but the population density is high, a high network completeness can be obtained with fewer public space nodes and paths. However, in the actual survey, it is found that the residents are less satisfied with the use of public space in the settlement [37,38]. When small-scale settlements are selected as the object, the results are subject to error.
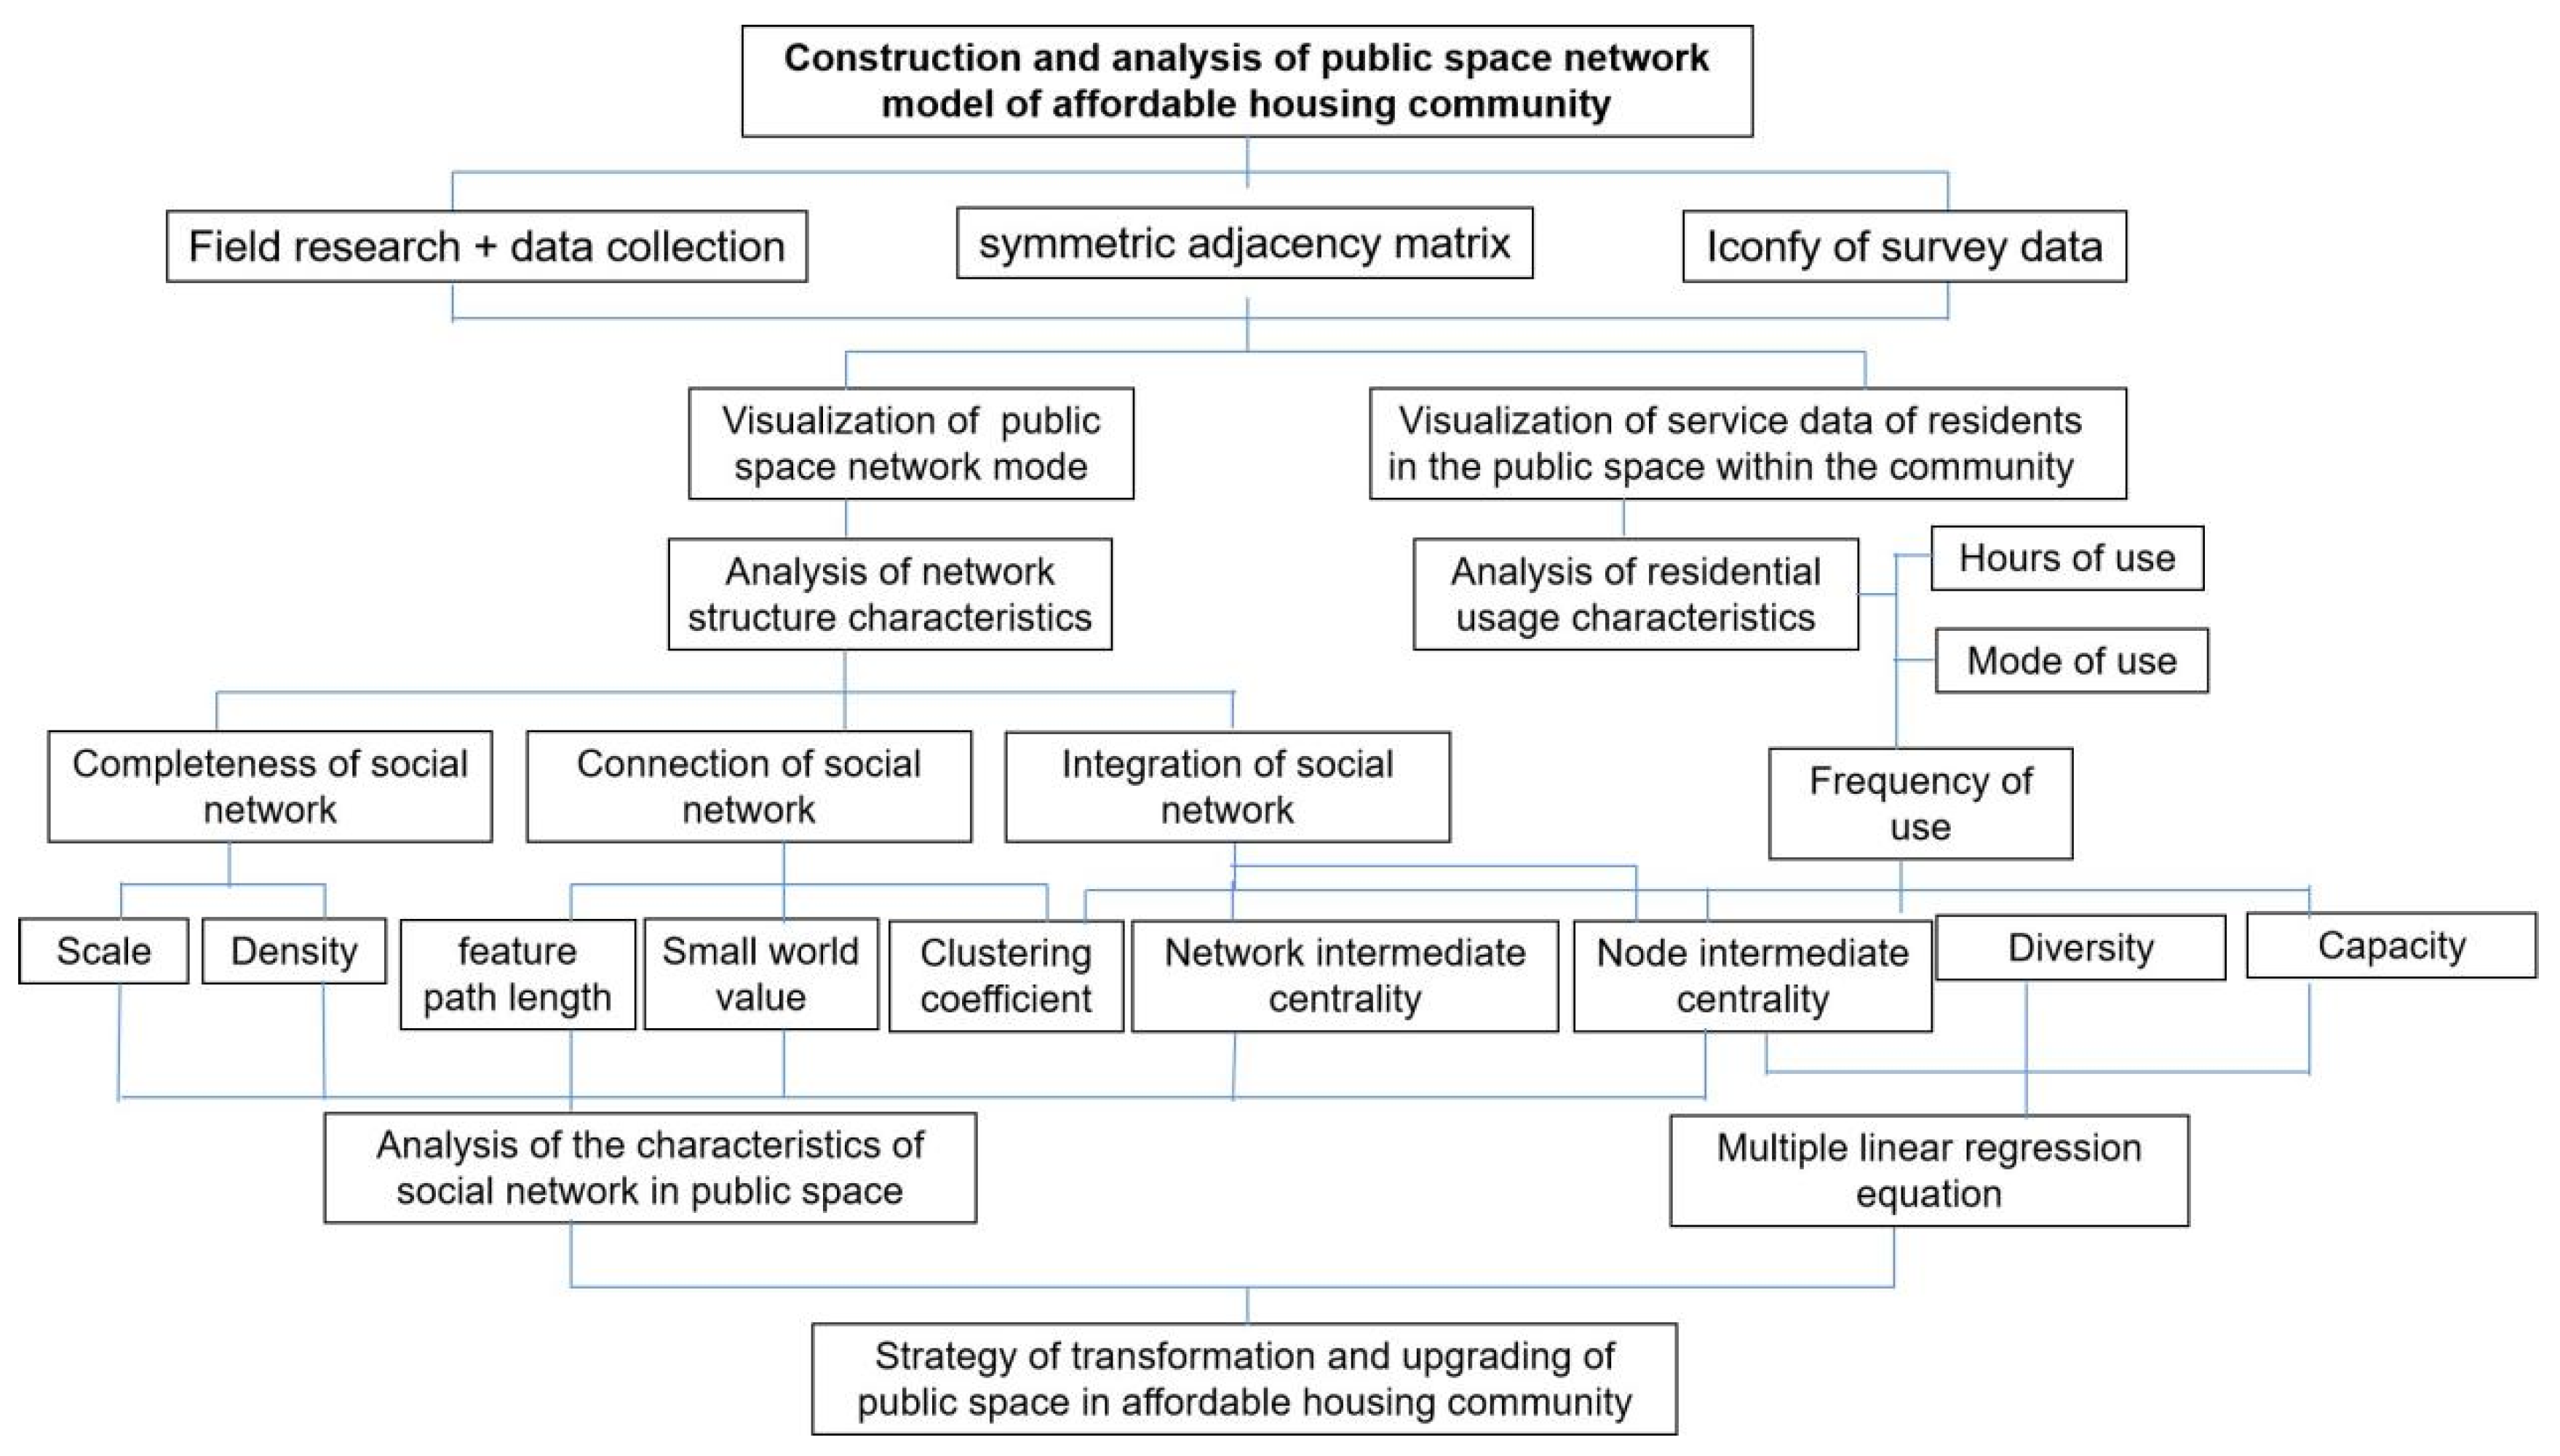
This paper selected the public space in large affordable housing areas in the suburbs as the research object. Social network analysis (SNA) was used to objectively evaluate the network density, clustering coefficient and small-world value of the public space in affordable housing from the perspective of the actual network nodes and paths of the built public space. Then, this paper examines the characteristics of the network structure of existing public spaces and correlates the activity patterns and behavioral characteristics of residents at each public space node with the characteristics of the node network, analyzing the interaction between the two. In this regard, it explains more objectively the influence of public space structure and form on the behavioral patterns of affordable housing residents. Finally, suggestions for the improvement and quality of public space in line with the behavioral preferences and needs of affordable housing residents are put forward (see Figure 1), so as to complete the network of public space, promote the interaction and communication of residents in the residential area, enhance the residents’ experience of using public space, and improve the living standard of residents in the residential area.
2. Materials and Methods
2.1. Data
2.1.1. Investigation Process
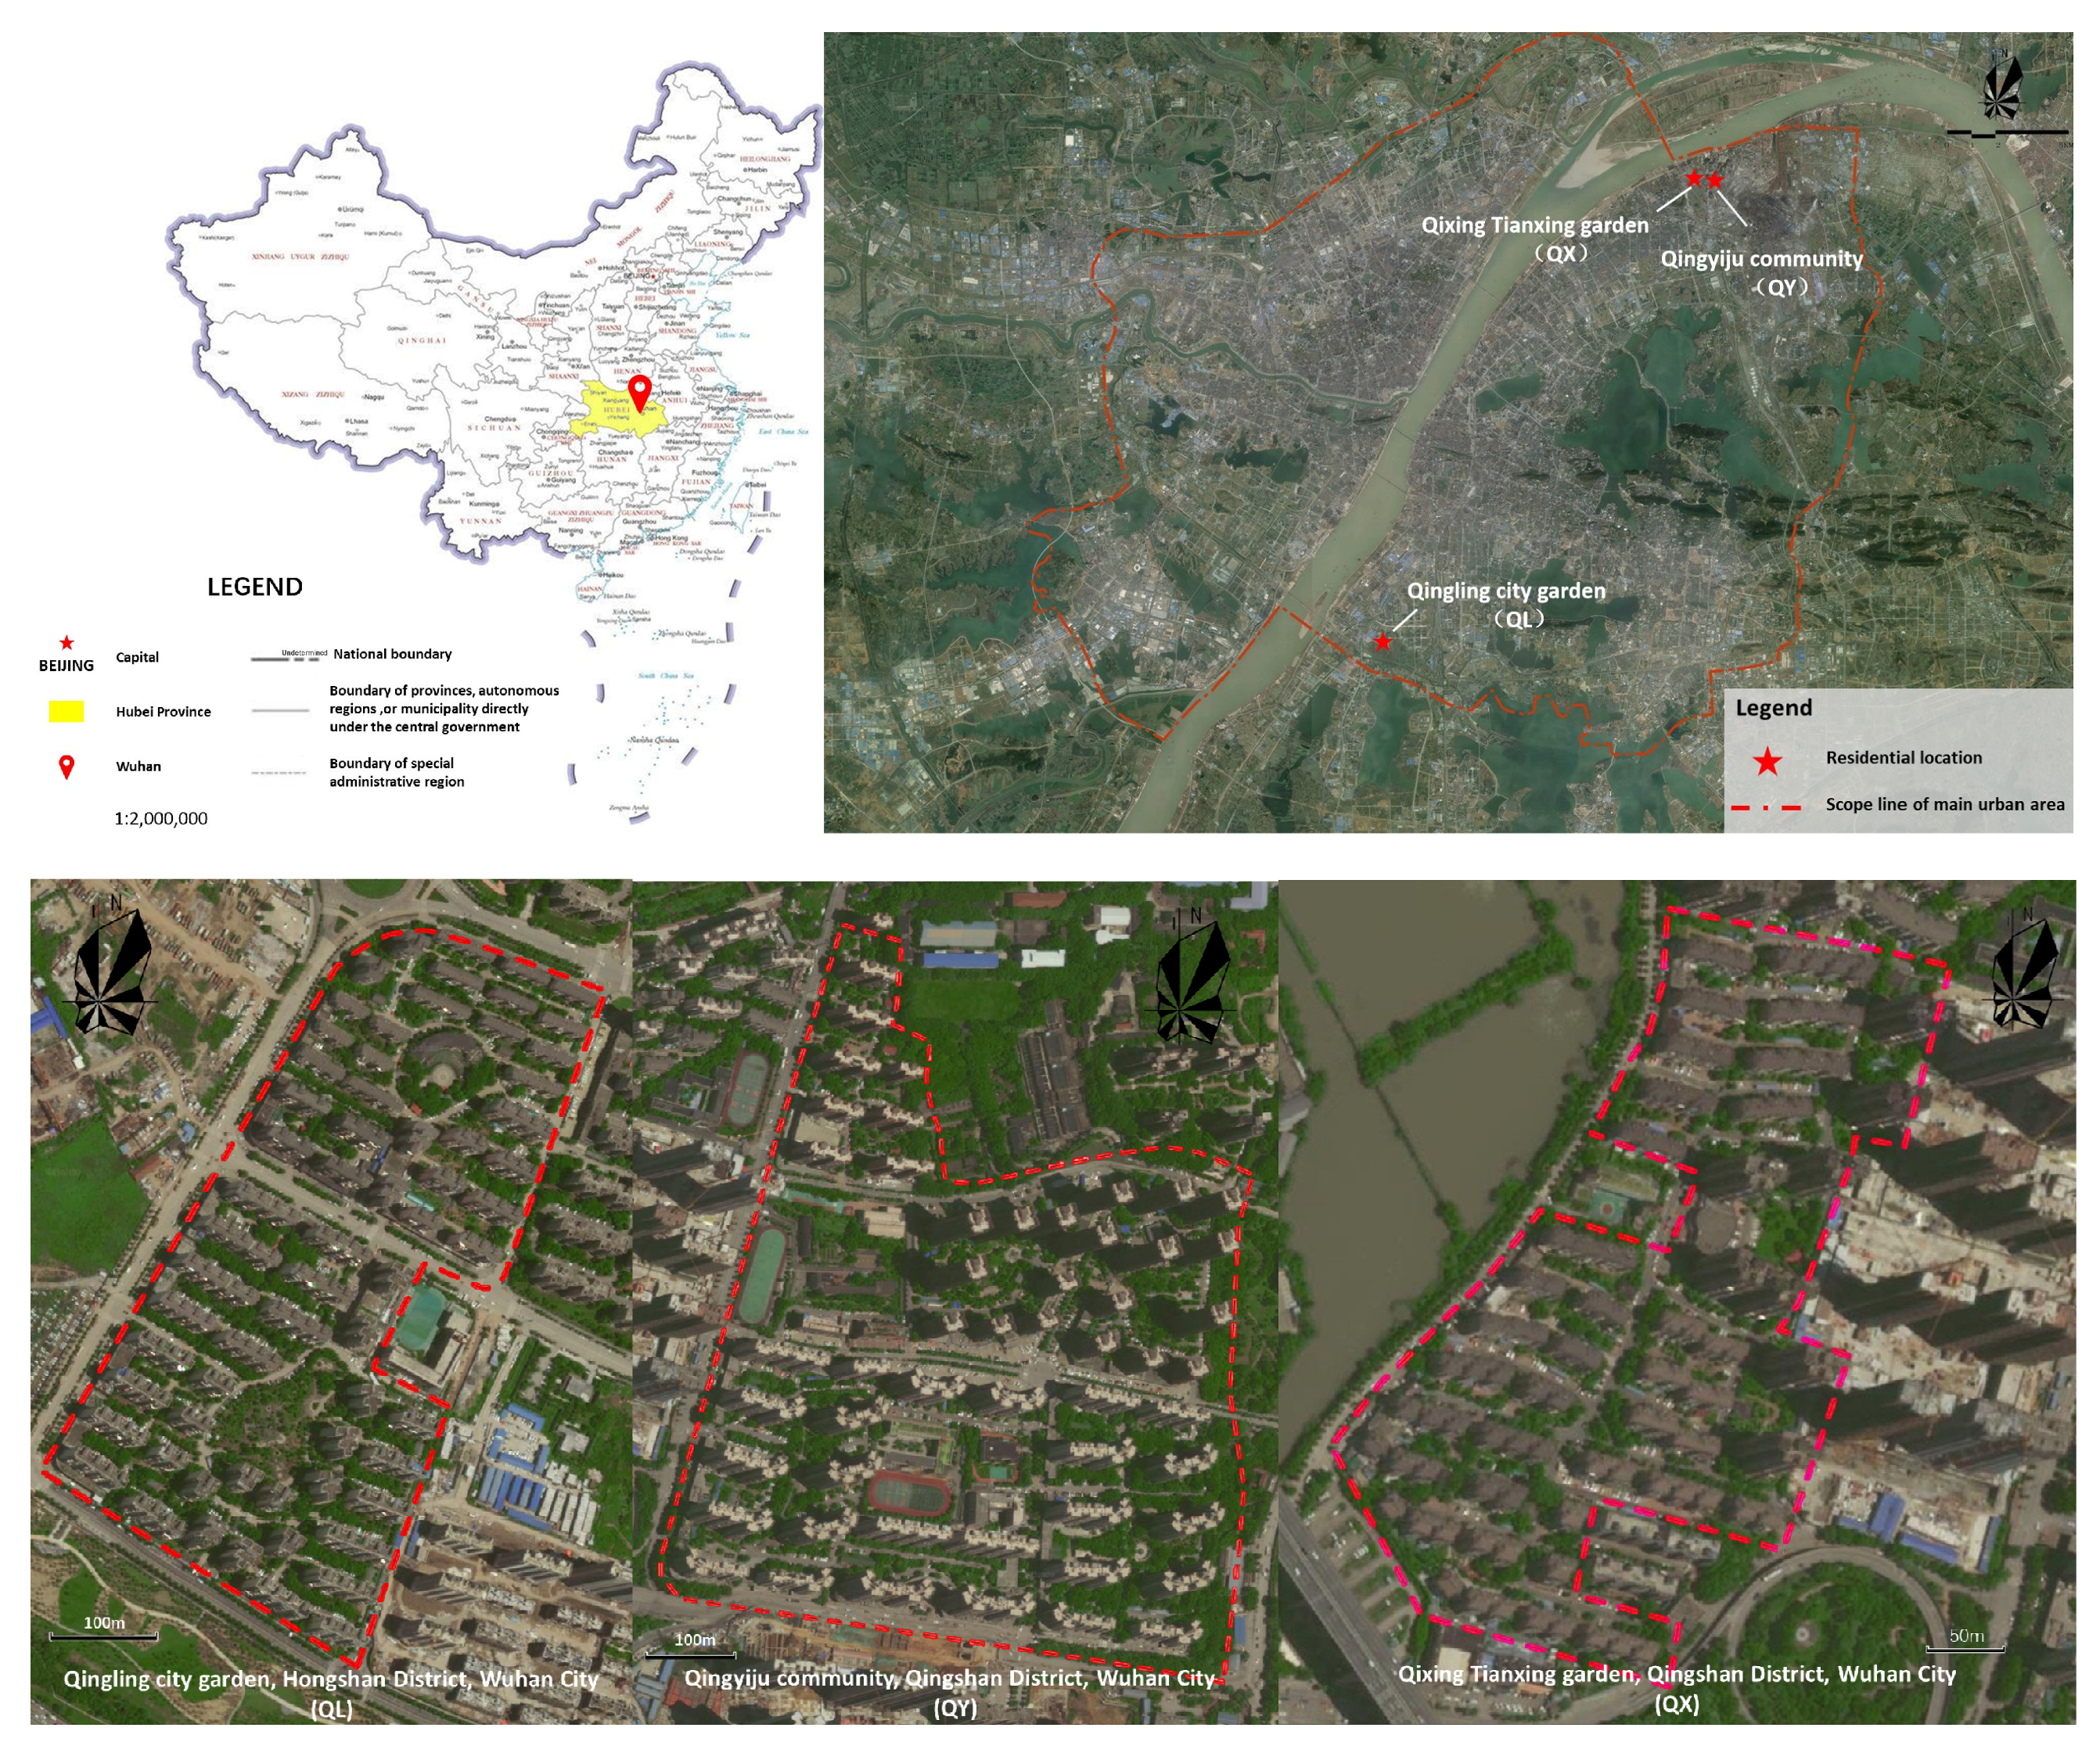
In this paper, a typical large affordable housing area in the suburbs was selected as a sample based on the crowd activity map (see Figure 2). This study identifies the frequency of public space use in large affordable housing areas in suburban areas on weekdays and non-weekdays based on the Baidu heat map and selects three large affordable housing areas in suburban areas with high, medium and low heat values as samples.
For the three large-scale affordable housing area, researchers are arranged to collect data on the distribution, capacity and functional diversity of public space nodes inside the residential area through field survey and collect the residents using frequency at each public space node on working and non-working days. Finally, we got the average value of residents’ use frequency of each public space node.
Field research and questionnaire survey were also carried out in this study. Statistical analysis was made on the attributes of the sample population of three typical affordable housing areas and the behavior characteristics of internal and external public space use (frequency of use, mode of use, etc.), so as to show the main needs of suburban affordable housing residents for public space use in their residential areas (see Table 1).
2.1.2. Data Collection and Graphing
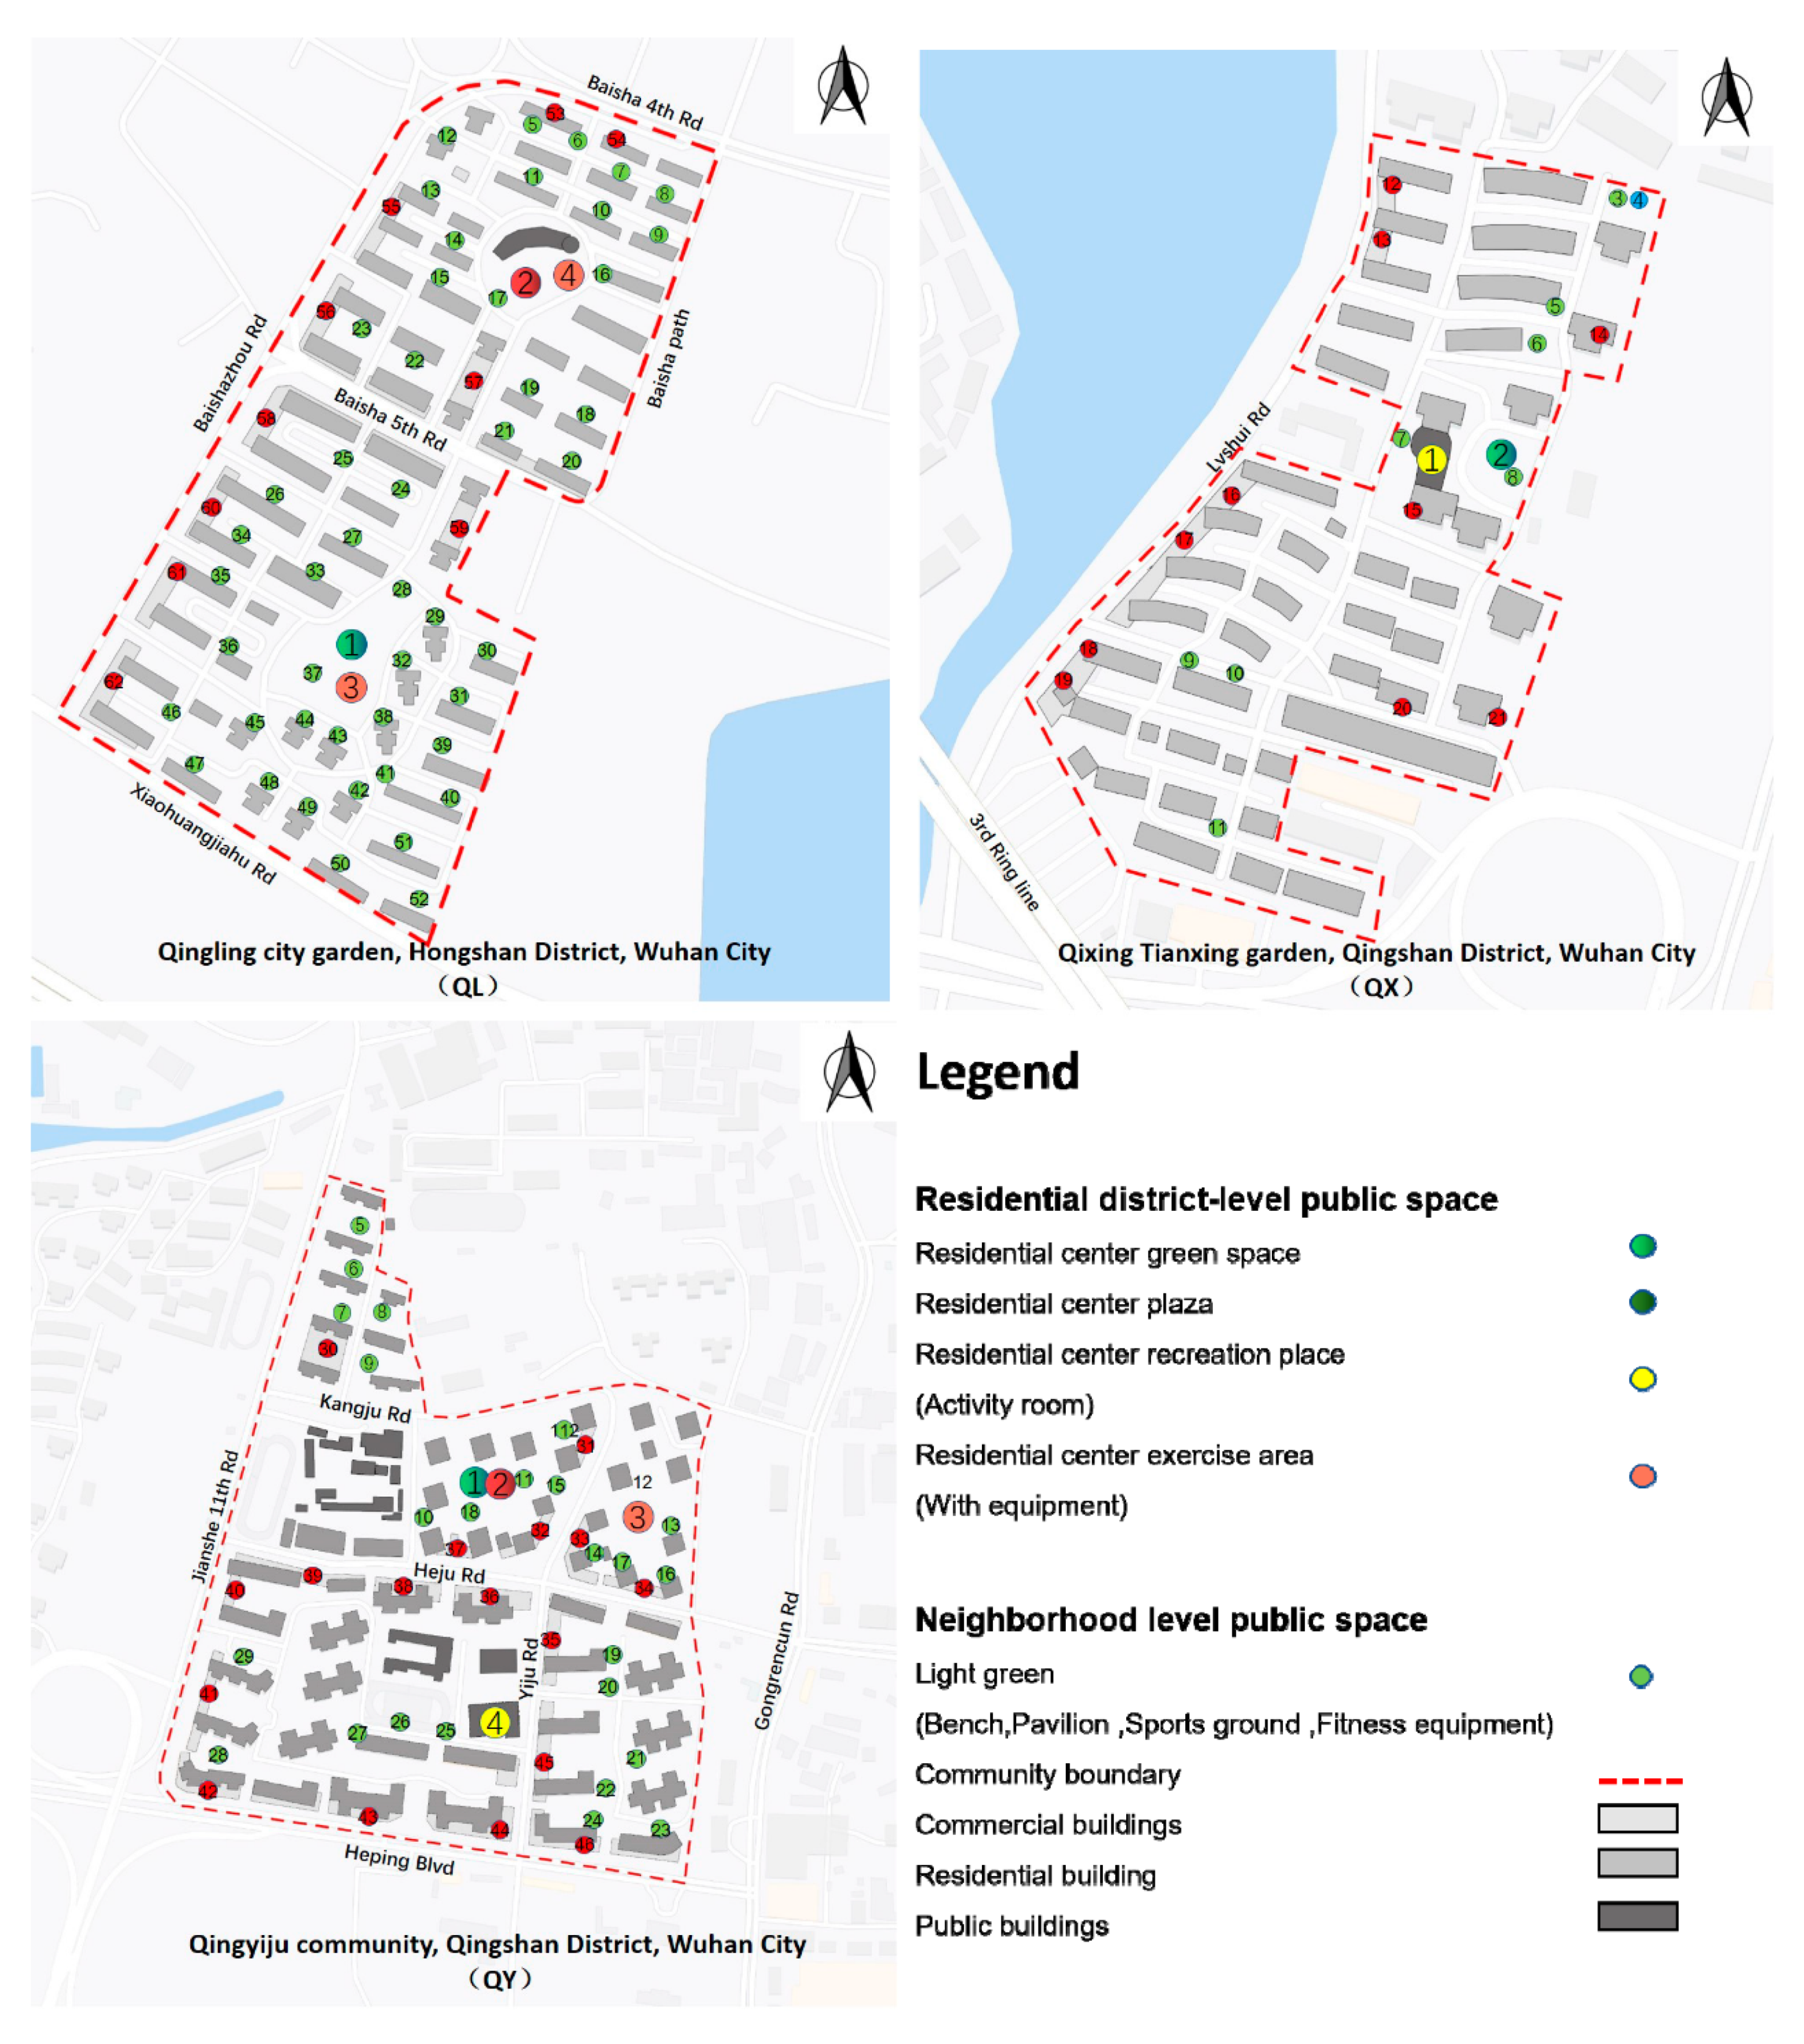
Based on the scale of public space, the study divided the public space in affordable housing areas into two levels: the settlement and the neighborhood. The neighborhood level public spaces are mainly central green areas and central squares (some with small sports and fitness facilities), while the neighborhood level public spaces are mainly bench (uncovered) open spaces (some combined with surface parking spaces). During the field research, the researchers recorded the frequency of residents’ activities at each public space node to explore the potential influence of the intermediate centrality and the frequency of residents’ activities at each node of the social network.
There are 52 public space nodes in Qingyi community (QY), including 4 residential public spaces and 48 neighborhood public spaces; There are 11 public space nodes in the affordable housing residential area of Qingxing community (QX) Tianxing garden, including 2 residential public spaces and 9 neighborhood public spaces; There are 29 public space nodes in Qingling (QL) urban garden affordable housing residential area, 4 residential public spaces and 25 neighborhood public spaces (see Figure 3).
2.2. Production of Symmetric Adjacency Matrix in Public Space
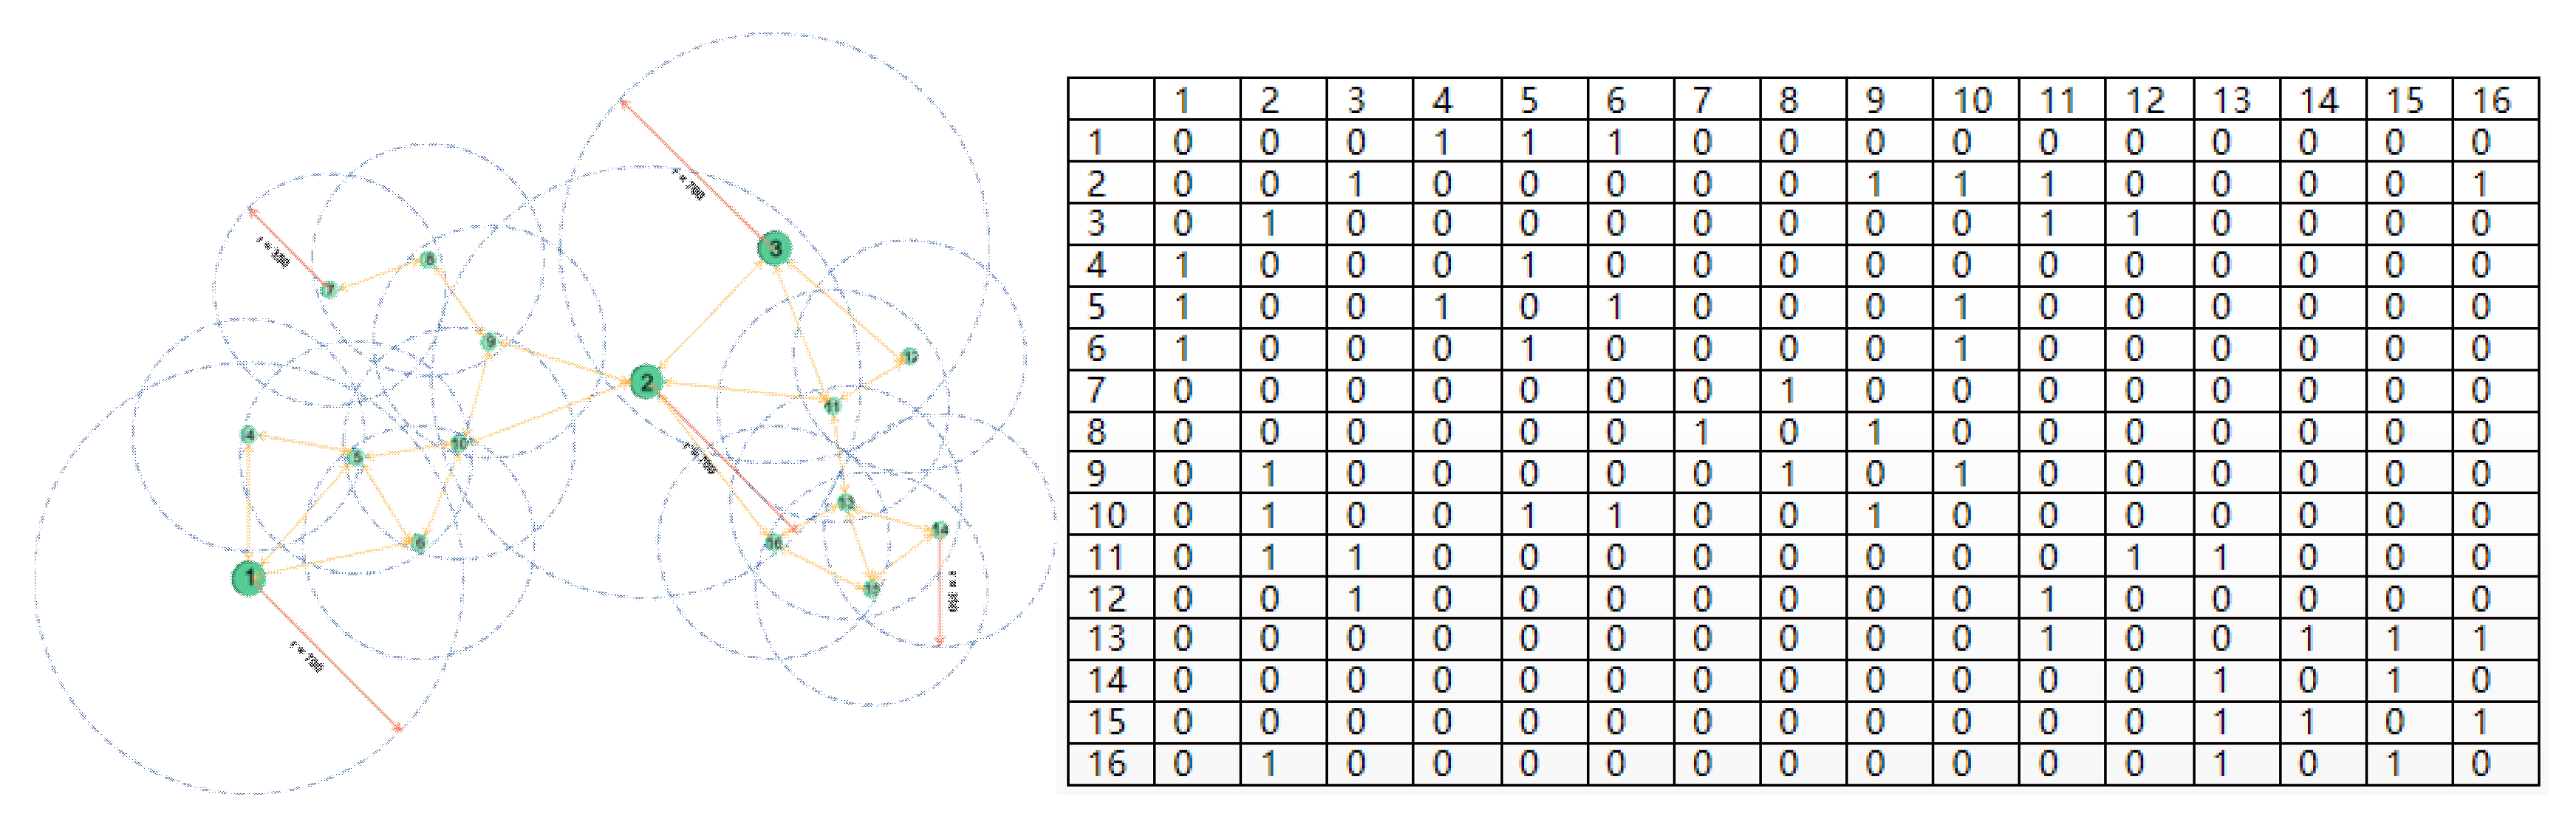
This study constructs a symmetric adjacency matrix based on the accessibility of every public space nodes. Since walking is the main travel mode for residents to use the public space in the settlement, the five-minute and 10-min walking distances are used as the service radius of the two levels of public space in the affordable housing community. If the walking distance from the geometric center of a public space at any settlement level to another public space is less than or equal to 700 m by the most convenient route, a connection can be established. If the walking distance from the geometric center of any neighborhood level public space to another public space is less than or equal to 350 m, a connection can be established. Next, the relations between all public space nodes were sorted out, where the nodes with connection are set as “1”, while those without connection are set as “0”. Then, the semantic model of the network was established, and finally the symmetric adjacency matrix with bimodular data was developed. For easy understanding, this paper draws a schematic diagram of the association between public space node accessibility and symmetric adjacency matrix (see Figure 4).
2.3. Public Space Node Usage Frequency, Average Capacity and Activity Diversity Data
In order to determine whether the social network status of public space nodes will have an impact on node use frequency (residents’ behavior), this paper collects the node use frequency on working and non-working days of public space of affordable housing, 9:30–11:30 a.m. and 14:30–16:30 p.m., the average capacity of each public space node and the activity diversity data contained in each node. Among them, the use frequency of nodes is the average value (unit: times/day) after field observation. The capacity of nodes in each public space is set according to the size of comfortable population that can be accommodated by the space scale, and the activity diversity is assigned according to the space and facility types covered by each public space (see Table 2).
The final statistics on the frequency of use, mean capacity and activity diversity of each public space node in the affordable housing samples was summarized as shown in Table 3.
2.4. SNA Approach
Social network analysis is a social space analysis method that can quantitatively analyze and visualize the network structure between social relations or social elements. Through the analysis and interpretation of social network, we can clarify the laws and characteristics of urban spatial layout and social interaction. This analysis method is especially suitable for analyzing closed and well-defined areas as the internal public space of the community than spatial syntax, GIS and other analysis methods.
The construction and analysis of public space network model in affordable housing comprise three steps: matrix construction, grid construction and network parameter calculation [39,40,41]. Firstly, we conducted on-site research on the public spaces used by the residents in affordable housing, collected and organized the nodes of public spaces and the association data between the nodes of public spaces, and formed the symmetric adjacency matrix of two-mode data. Then, Ucinet 6.0 was used to construct the public space network model in affordable housing [42,43,44]. Finally, the network completeness, integration degree and association degree were calculated to analyze the characteristics of the public space network in affordable housing.
Network completeness is divided into network size and network density. Network size is the number of common spatial nodes in affordable housing. The more spatial nodes per unit, the more likely the network may achieve completeness. Network density means whether the public space nodes are closely connected with each other (see Equation (1)).
where, P is the network density, L is the actual number of connections in the network and n is the actual number of nodes in the network. The more the number of actual connections in the network and the higher the network density, the higher the completeness of the network.
The network integration degree consists of the average intermediate centrality of nodes and the network intermediate centrality potential. The average intermediate centrality of nodes represents the core degree of each public space node in the network. The node is located at the core of the network, and the more connections it has with other public space nodes, the higher the absolute value of the intermediate centrality. The network intermediate centrality potential indicates whether there is a tendency of monocentric or polycentric clustering in public space (see Equation (2)).
where, CABi denotes the absolute intermediate centrality, bjk(i) denotes the probability that node i is on the shortest path between nodes j and k and n is the number of nodes.
The network intermediate centrality potential is calculated as follows:
where, CB is network intermediate centrality potential, CRBi is node relative intermediate centrality, CRB max is the maximum of node relative intermediate centrality and n is the number of nodes.
Network correlation can be measured by feature path length, clustering coefficient and “small-world value”. If the public space network in the central settlement has a small feature path length, but matches with a relatively large clustering coefficient, it proves that the public space network has small-world characteristics. Where, the feature path length is calculated as follows (see Equation (4)):
where L denotes the average distance, lij denotes the distance between node i and node j, and n denotes the number of nodes. Generally, if the network feature path length is less than 6, the distance between the nodes of the network is considered small.
The clustering coefficient is calculated as follows (see Equation (5)):
where, Ci denotes the local aggregation coefficient of the network, Ei is the actual number of edges between each neighboring node of ki of node i, C2 denotes the overall aggregation coefficient of the network, and n is the number of nodes of the network.
Network small-world value is calculated as follows (see Equation (6)):
where, Cactual is the aggregation coefficient of the sample network, Lactual is the feature path length of the sample, Crandom is the clustering coefficient of a random virtual network of the same size and Lrandom is the feature path length of a random virtual network of the same size.
(Cactual/Lactual)/(Crandom/Lrandom)
The whole parameters and significance of social network analysis is as below (see Table 4):
3. Results
3.1. SNA of Public Space Feature and Conclusion
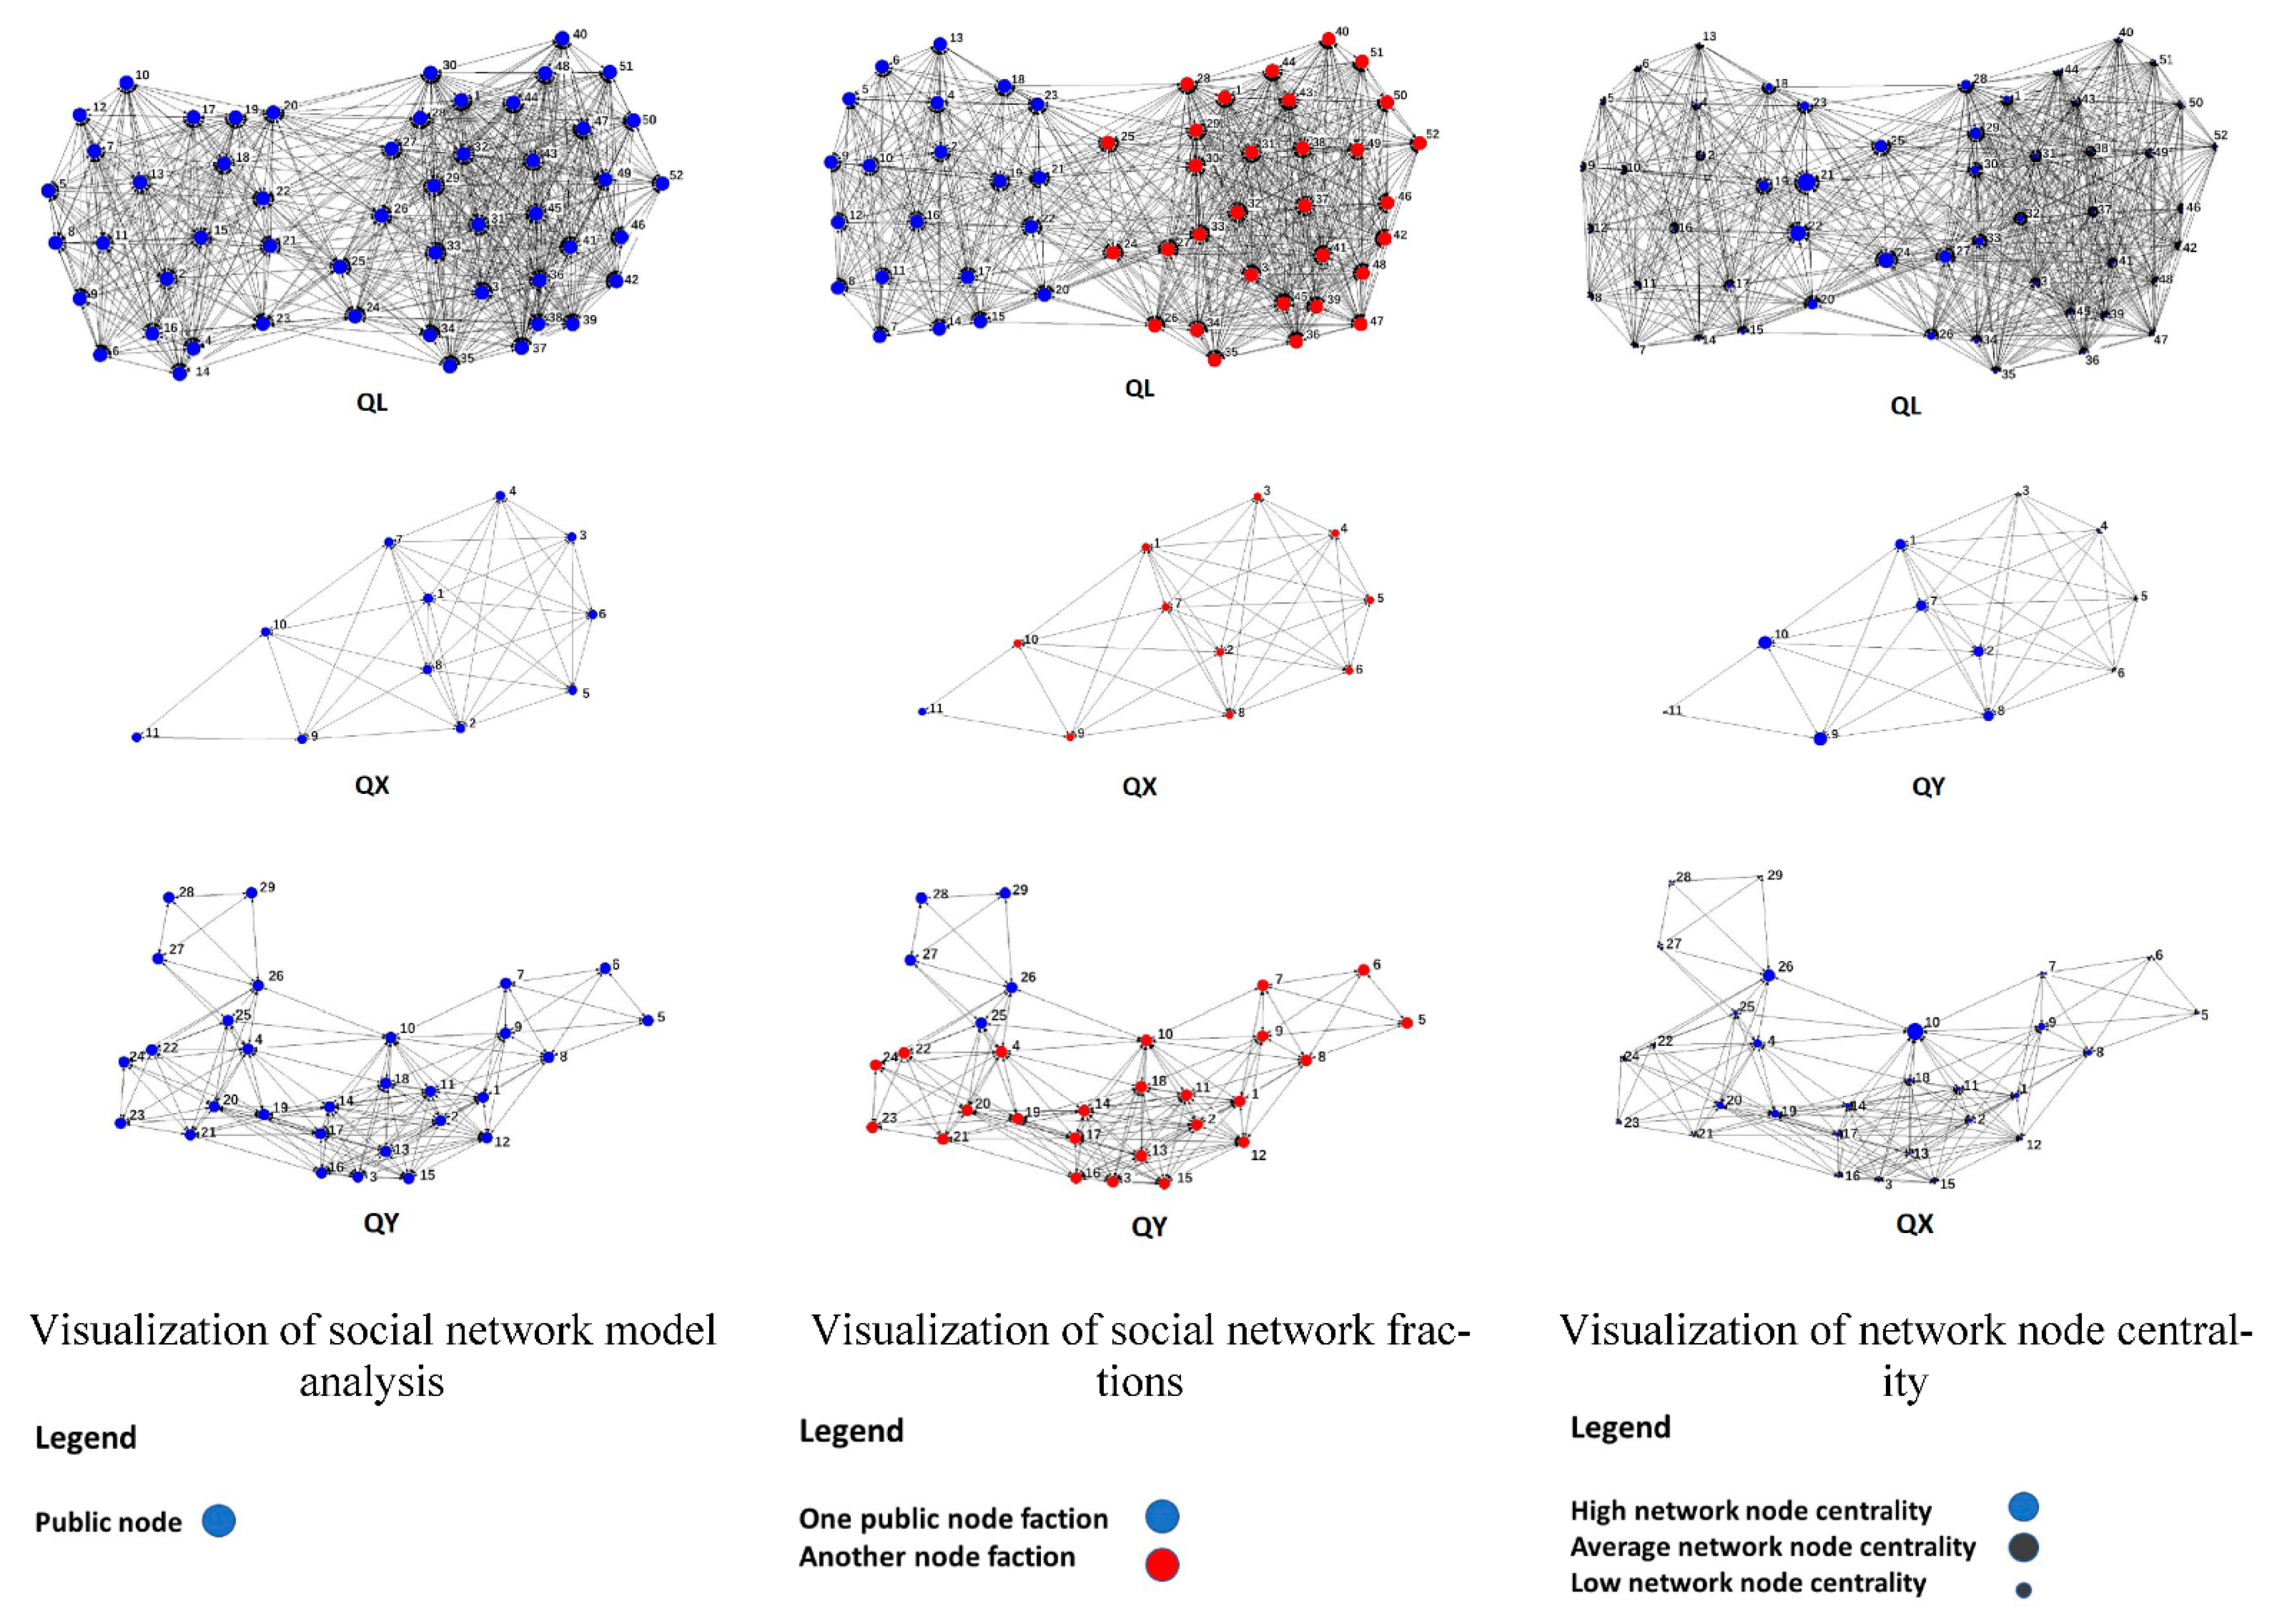
The social network structure of the public spaces within the three affordable housing areas is illustrated in Figure 5 below.
From the visual network model, the network model of the settlement-level public space of QL shows a cluster-like distribution of two areas, and the network as a whole is well-connected, with no isolated nodes without any connection. The settlement-level public space and the neighborhood-level public space have similar network density, and there are no highly marginalized nodes. The faction analysis of the closely connected subgroups in the public space network in affordable housing shows that the public space of QL can be divided into two factions. The division of QL into phase 1 and phase 2 by the urban bypass and the separation of the two phases by the courtyard wall have worsened the fragmentation between the factions.
The public space network model of QX shows a clear fragmentation pattern. Nodes 9 and 10 have a strong sense of fragmentation with the network of nodes 1 and 7 surrounding the settlement-level public space. Node 11 is clearly marginalized as an isolated node, which is also verified in the visualization model of the network faction.
The public space network model of QY shows a clear polycentric pattern, and the visualization images of the network and network factions indicate that the faction division of the public space network is not obvious. The node size and node density between the two factions differ greatly. Nodes 25–29 are not closely connected compared to other nodes.
The social network data of the public space in the three sample affordable housing areas were calculated, as shown in Table 5. The network density value of QL is 0.526, which means that the network nodes are closely connected to each other and the network completeness is moderate. The average node centrality is 15.79, and the nodes are arranged in descending order by centrality value and visualized. It can be found that the intermediate centrality of the nodes in the settlement-level public space of QL is no greater than that of the neighborhood-level public space. It means that the settlement-level public space has a limited role in the integration of the network and has not reached its due “core status” of the network. At the same time, the table shows that the network intermediate centrality potential of this settlement-level public space is only 5.46%, which indicates that the public space network has loose structure and low degree of agglomeration. The length value of feature path shows that the residents in this settlement need to span at least 1.6 public spaces to reach the target space when they engage in activities. The small-world value of 1.12 indicates that the overall correlation of the public space network in the settlement is low and that the connection between public space nodes is not convenient.
The network density of QX is 0.709, and the average intermediate centrality of nodes is only 1.82, indicating that there is no obvious core-edge effect among nodes, but the network integration is poor, the structure is loose, and the clustering degree is low. The feature path length is low and the clustering coefficient is high, indicating that the space has prominent small-world characteristics.
The network density of QY is 0.372, and the average intermediate centrality of nodes is 12.9. Nodes 10 and 26 in the neighborhood level public space have a greater integration effect on other nodes than nodes 1–4 in the settlement-level public space, and node 4 has a greater integration effect than nodes 1–3. However, its feature path length is 1.9, indicating that residents in the settlement need to span nearly 2 public spaces to reach the target public space.
By comparing the three affordable housing areas as typical samples, it can be seen that QL has the largest network size and the highest nodal intermediate centrality. The network density of QX is the highest and the clustering coefficient value is the highest. The network intermediate centrality potential of QY is the strongest. As shown in Table 5, network size and network density are not positively correlated, network density is positively correlated with the clustering coefficient, and the feature path length is negatively correlated with the clustering coefficient. In other words, if the network density of public space is increased and the length of feature path is reduced, the clustering coefficient of public space network can be significantly increased, so that the completeness of public space network is stronger and the network correlation is higher. Then, residents will have more choices of public spaces available and shorter time to arrive at the target space.
Meanwhile, in terms of node intermediate centrality, the mean values of node intermediate centrality in the neighborhood-level public space of QX and QY are higher than the mean values of node centrality in the neighborhood-level public space. The highest values of node intermediate centrality in the neighborhood-level public space of the three typical housing settlements are higher than those of the nodes in the settlement-level public space.
In terms of clustering coefficient, the average value of clustering coefficient of the neighborhood-level nodes of QX and QY is higher than that of the settlement-level nodes, but the difference of clustering coefficient is small (see Table 6).
3.2. Multivariate Linear Regression Analysis of the Frequency of Public Space Use in Affordable Housing Areas
In this paper, multivariate linear regression analysis was conducted with the frequency of use of each node in the public space within the sample affordable housing as the dependent variable, and the frequency of use of nodes in the public space within the three sample affordable housing areas, the intermediate centrality of nodes, the mean value of node capacity and activity diversity as the independent variables (see Table 7). After normalizing the data, the adjusted R Square (R2), which shows the goodness of fit, was 0.799, indicating good fitting results. The variable of the clustering coefficient was not significant, while all other variables were significant.
The regression model was finally developed as follows:
Frequency of node usage = −0.062 + 0.413 node intermediate centrality + 0.558 node capacity mean + 0.372 activity diversity.
Through the normalized fit coefficients, it can be seen that, the dependent variables that had the highest to lowest influence on the node usage frequency were the mean value of node capacity, the centrality of node intermediate and the diversity of node activity. The fit coefficients show that the frequency of node usage increases by 0.969 for each increase of 1 in the mean node capacity and by 0.162 for each increase of 1 in the centrality of node intermediate.
Taking QL as the reference, the average usage frequency of all nodes in QX is 6.876 higher and the average usage frequency of QY is 2.851 higher.
4. Discussion
The purpose of this paper is to evaluate the layout of affordable housing public space and explore its relationship with residents’ use through the SNA method. The main findings are as follows:
- (1)
- The intermediate centrality of public space nodes at the settlement level is not significantly higher than that at the neighborhood level. The main reason for this phenomenon is that the settlement-level public space located at the geometric center cannot play an integrative role due to the limited connectivity paths and the lack of secondary core nodes in the spatial network, which leads to the pronounced fragmentation of public space [45,46,47]. Compared with the randomly generated social network structure of nodes of the same scale, its network intermediate centrality potential is lower, its small-world feature is less obvious and its network integration and relatedness are very limited. Some study believes that the internal public space of the community with clear organizational structure can greatly support the daily life social activities of residents with Limited residential scale communities [48].
- (2)
- The frequency of use of public space nodes in a typical sample of affordable housing area has a significant linear relationship with node intermediate centrality, node capacity mean and activity diversity. The higher the degree of functional complexity, the higher the frequency of public space use, independent of whether the node is located in the center of the network. which leads to the importance of the participation in the design and construction of internal public space from mobilizing community residents [49]. Some studies have pointed out that in linear shaped public space, the node with stronger functional diversity has more access frequency and staying time of users, and such nodes do not need to be located in the central position of the linear space form [50,51]. The higher the intermediate centrality of a node (the more nodes are located on the connection path), the higher the development potential of the space and the higher the frequency of use [52,53].
- (3)
- In terms of community comparison, the mean value of frequency of node usage in public space in a typical sample of affordable housing is inversely proportional to the size of nodes. Some studies show that when the number of internal public space nodes is equal, the smaller the community scale, the higher the average using frequency of each nodes [54]. In other words, the more the number of public space nodes per unit space, the lower the mean value of node usage frequency [55,56]. The fragmentation or poor completeness of the social network does not significantly affect the average frequency of public space node use, indicating that affordable housing residents are highly dependent on the use of internal public space nodes. If the public spaces in affordable housing remain the status quo of single type, unreasonable layout and substandard scale, residents’ demand for high frequency and high-quality leisure activities cannot be met, which will further affect the physical and mental health of residents. As been pointed out, “The utilization rate of community public space is not only related to the unreasonable design in the early stage, but also related to the improper management and maintenance in the later stage” [57]. Some studies also pointed out that the life satisfaction and well-being of affordable housing residents are significantly lower than that of ordinary communities, and the degree of cooperation and self-restraint on community management are low, which is easy to form a Broken Windows Effect in affordable housing settlements [58,59,60].
Based on the above findings, the author puts forward the following solutions and optimizing strategies for the social network feature of public space in affordable housing areas:
- (1)
- The functional complexity of the neighborhood-level public space should be enhanced. For the QL community, although there are many public space nodes, most public space nodes have poor restability and lacks functions. It is urgent to rectify the existing space and improve the new public space functions, so as to enhance the intermediate centrality of the network nodes of public space and improve the use frequency of residents.
- (2)
- The network connection effect of public space at the settlement level should be fully enhanced. Secondary core nodes should be established to facilitate the high-frequency use of public space at the neighborhood level. We should make full use of the win-win effect of network connectivity. Such as QX community, the public space node scale is extremely limited, and urgently needs to establish secondary public space nodes at the weak points of the network structure to build a social network of public space with higher completeness, so as to significantly increase the frequency of use of public space at the neighborhood level and increase the overall frequency of use of public space nodes in affordable housing.
- (3)
- The path connectivity density of the neighborhood public space should be enhanced, and the walkability of all public space nodes should be enhanced. The path connectivity density of the neighborhood-level public space should be enhanced, so that residents can walk through the public space nodes more easily and quickly, without having to make excessive detours or repeatedly traverse the same path to reach the target public space.
5. Conclusions
This paper selected the public space in the large affordable housing areas in the suburbs as the research object and used social network analysis (SNA) to objectively evaluate the network density, clustering coefficient and small-world value of the public space in affordable housing from the perspective of the physical spatial network of the built public space. Based on the network structure characteristics of existing public spaces, this paper further explores the relationship between the frequency of public space use in and the characteristics of nodes’ social networks and their own attributes, and the influence of public space layout structure on the behavioral patterns of affordable housing residents. This paper puts forward proposals for the renovation and optimization of public space according to the behavioral preferences of affordable housing residents, so as to complete the network of public space, promote the interaction and communication of residents in the residential area, enhance the residents’ experience of using public space and improve the living standard of residents in the residential area.
In response to the findings of this paper, future research can be carried out in two aspects. On the one hand, the same type of study should be conducted on the general commercial settlements around affordable housing, and the differences in the social network features of public space between them should be compared to further clarify the ways of upgrading public space in affordable housing. In addition, GeoSpace should be used to simulate the renovation. On the other hand, urban public space within the vicinity accessible by public transportation can be taken into consideration. The lack of social network relationship in the public space in the settlement should be supplemented by enhancing the supply of external public space. This research paradigm can be extended to the renovation of public space in affordable housing in non-suburban areas.
Author Contributions
Conceptualization, J.Z. and L.L.; methodology, J.Z. and L.L.; investigation, J.Z.; software, J.Z. and Y.Y.; validation, Z.S., L.L.; data curation, J.Z.; writing—original draft preparation, J.Z.; writing—review and editing, J.Z., L.L. and Z.P.; supervision, Z.P., L.L. All authors have read and agreed to the published version of the manuscript.
Funding
This research was funded by National Natural Science Foundation Youth Fund of China (No. 51708425); National Natural Science Foundation of China (No. 52078390); National Natural Science Foundation of China (No. 51978535).
Informed Consent Statement
Informed consent was obtained from all subjects involved in the study.
Data Availability Statement
Data sharing not applicable.
Conflicts of Interest
The authors declare no conflict of interest.
References
- Zhang, H. Research on the Renewal Design of the Old City Center under the Background of Inventory Revitalizing—Taking the Old Municipal Government District of Hefei as an Example; Anhui Jianzhu University: Hefei, China, 2021. [Google Scholar]
- Zhang, Y.; Guo, J. Practice and Exploration on the Reconstruction of Old Resi-dential Area from the Perspective of Stock Planning—Taking Nanjing Lishui District Finance and Trade New Village Renovation Project as an Example. City House 2021, 28, 72–75. [Google Scholar]
- Anderson, J.; Kai, R.; Steemers, K.; Huppert, F. Lively Social Space, Well-Being Activity, and Urban Design: Findings From a Low-Cost Community-Led Public Space Intervention. Environ. Behav. 2017, 49. [Google Scholar] [CrossRef]
- Ou, Q. Renewal planning of old residential areas: Gradual and participatory stock planning shift–Taking the practice of qicha village in Chancheng District as an example. Hous. Real Estate 2018, 30, 220. [Google Scholar]
- Qu, Y. The Research on The Gradually Renewal Planning Strategy of Old Residential Area Based on the Perspective of Stock Space—Taking Zhengzhou Guomian Factory Area in Zhongyuan District for Example; Zhengzhou University: Zhengzhou, China, 2017. [Google Scholar]
- Wei, Z.; Zhang, Y.; Zhang, Y.; Zhai, Q. Evaluation and Optimization of Quality of Living Environment in Affordable Housing Estates. Planers 2017, 33, 30–38. [Google Scholar]
- Wang, X. A Study on the Impact Assessment of Public Housing Residential District to Urban Social Space; Southeast University: Nanjing, China, 2016. [Google Scholar] [CrossRef]
- Liu, Y. Review on Construction of Affordable Housing Settlements and Its Living Environment. Mod. Urban. Res. 2014, 29, 2–6. [Google Scholar] [CrossRef]
- Wang, F. Research on External Public Space Design of Affordable Housing Settlements in Guangzhou; South China University of Technology: Guangzhou, China, 2018. [Google Scholar]
- Zhu, M.; Zhou, J.; Wang, S. Research on Evaluation of External Environment Use of Public Rental Housing—A Case Study of Shanghai Xinyi Community. Hous. Sci. 2021, 41, 7–11. [Google Scholar] [CrossRef]
- Yang, C. Research on Satisfaction Evaluation and Design Optimization Strategy of Urban Leisure Plaza Based on POE—A Case Study of Hefei City; Hefei University of Technology: Hefei, China, 2019. [Google Scholar]
- Wang, J.; Xiao, Y.; Lv, Y. Public Space Survey Research on Residential Community in New Town Based on POE: Taking Tianjin Zhangjiawo Town as an Example. J. Tianjin Chengjian Univ. 2016, 22, 174–178. [Google Scholar]
- Kim, H.J.; Chae, B.K.; Park, S.B. Exploring public space through social media: An exploratory case study on the High Line New York City. Urban Des. Int. 2018, 23, 69–85. [Google Scholar] [CrossRef]
- Song, Y.; Wang, Y.; Li, G. Analysis on the influencing factors of public space satisfaction in suburban centralized community based on a survey of 10 communities in Suzhou. J. Suzhou Univ. Sci. Technol. (Eng. Technol.) 2018, 31, 50–57. [Google Scholar]
- Yu, Y.; Lin, N.; Gong, K. Urban Community Public Space Micro-Renewal Environmental Planning—Take Datang Xiang Community as an Example. IOP Conf. Ser. Earth Environ. Sci. 2021, 693, 012107. [Google Scholar] [CrossRef]
- Carro, D.; Valera, S.; Vidal, T. Perceived insecurity in the public space: Personal, social and environmental variables. Qual. Quant. 2010, 44, 303–314. [Google Scholar] [CrossRef]
- Weijs-Perrée, M.; Dane, G.; Berg, P. Analyzing the Relationships between Citizens’ Emotions and their Momentary Satisfaction in Urban Public Spaces. Sustainability 2020, 12, 7921. [Google Scholar] [CrossRef]
- Bodaar, A.; Rath, J.C. Cities, diversity and public space. Metrop. World Bull. 2005, 5, 3–5. [Google Scholar]
- Lotfi, S.; Koohsari, M.J. Measuring objective accessibility to neighborhood facilities in the city (A case study: Zone 6 in Tehran, Iran). Cities 2009, 26, 133–140. [Google Scholar] [CrossRef]
- Stasiak, A.; Wojtowicz-Jankowska, D. Public Spaces—Coexistence and Participation. IOP Conf. Ser. Mater. Sci. Eng. 2017, 245, 042026. [Google Scholar] [CrossRef] [Green Version]
- Susanti, A.; Natalia, T.W. Public space strategic planning based on Z generation preferences. IOP Conf. Ser. Mater. Sci. Eng. 2018, 407, 012076. [Google Scholar] [CrossRef] [Green Version]
- Purwanto, E.; Harani, A.R. Understanding the place attachment and place identity in public space through the ability of community mental map. IOP Conf. Ser. Earth Environ. Sci. 2020, 402, 012024. [Google Scholar] [CrossRef]
- Liu, Y.; He, W. Supply and Demand Characteristics of Public Service Facilities in Social Housing Settlements and its Dynamics in Guangzhou City. Modern Urban Research. China 2016, 1–10. [Google Scholar] [CrossRef]
- Wei, S.; Kuang, F.; Guo, Z.; Ren, B. Research on Public Space Optimization of Intelligent Community based on User Requirements. J. Phys. Conf. Ser. 2021, 1756, 012007. [Google Scholar] [CrossRef]
- Yuasa, K.; Ikebe, K. Management and Public Space Concepts in the Case of Adjacent Public Facilities and Urban Parks. J. Jpn. Inst. Landsc. Archit. 2018, 81, 583–588. [Google Scholar] [CrossRef]
- Nikolopoulou, M.; Lykoudis, S. Use of outdoor spaces and microclimate in a Mediterranean urban area. Build. Environ. 2007, 42, 3691–3707. [Google Scholar] [CrossRef] [Green Version]
- Jiang, C.; Leng, H. Climate Comfortable Condition Analysis and Planning Implications of Residential District Public Spaces in Transition Season of Cities in Severe Cold Region: Taking Harbin as an Example. Urban. Archit. 2017, 29–32. [Google Scholar] [CrossRef]
- Haythornthwaite, C. Social network analysis: An approach and technique for the study of information exchange. Libr. Inf. Sci. Res. 1996, 18, 323–342. [Google Scholar] [CrossRef]
- Raghavan, P. Social networks on the Web and in the enterprise. Lect. Notes Comput. Sci. 2001, 2198, 58–60. [Google Scholar] [CrossRef]
- Wai, A.L.J.T.; Boschma, R.A. Applying social network analysis in economic geography: Framing some key analytic issues. Ann. Reg. Sci. 2009, 43, 739–756. [Google Scholar] [CrossRef] [Green Version]
- Hong, I. Spatial Analysis of Location-Based Social Networks in Seoul, Korea. J. Geogr. Inf. Syst. 2015, 07, 259–265. [Google Scholar] [CrossRef] [Green Version]
- Li, H.; Zhang, Z. Optimization of leisure space for the elderly in urban community based on SNA. J. Suzhou Univ. Sci. Technol. (Eng. Technol.) 2020, 33, 72–80. [Google Scholar]
- Chen, H.; Hua, M.; Li, D. Influencing Factors for the Social Network Formation of Affordable Housing Community Residents. Mod. Urban. Res. 2018, 01, 93–98. [Google Scholar] [CrossRef]
- Yun, L.; Yuting, L.; Dong, C. On the optimal design of public space in affordable housing settlements in Guangzhou based on Residents’ needs. J. West. Hum. Settl. 2014, 29, 19–25. [Google Scholar] [CrossRef]
- Ghosh, R.; Lerman, K. Rethinking Centrality: The Role of Dynamical Processes in Social Network Analysis. Discret. Contin. Dyn. Syst. Ser. B 2017, 19, 1355–1372. [Google Scholar] [CrossRef]
- Zhuang, J. Intelligent Evaluation Method for Urban Public Space in the Big Data Era. Int. Conf. Smart Grid Electr. Autom. 2017, 489–492. [Google Scholar] [CrossRef]
- Foth, M.; Hearn, G. Networked Individualism of Urban Residents: Discovering the Communicative Ecology in Inner-City Apartment Buildings. Inf. Commun. Society 2007, 10. [Google Scholar] [CrossRef] [Green Version]
- Agryzkov, T.; Martí, P.; Nolasco-Cirugeda, A.; Serrano-Estrada, L.; Tortosa, L.; Vicent, J.F. Analysing successful public spaces in an urban street network using data from the social networks Foursquare and Twitter. Appl. Netw. Sci. 2016, 1. [Google Scholar] [CrossRef] [Green Version]
- Wolfe, A.W. Social Network Analysis: Methods and Applications. Contemp. Sociol. 1995, 91, 219–220. [Google Scholar] [CrossRef]
- Valera, S. Public space as a network. An approach to Environmental Psychology from Social Network Analysis. Redes Revista Hispana para el Análisis de Redes Sociales 2019, 31, 30. [Google Scholar] [CrossRef]
- Chen, J.; Chang, Z. Rethinking urban green space accessibility: Evaluating and optimizing public transportation system through social network analysis in megacities. Landsc. Urban Plan. 2015, 143, 150–159. [Google Scholar] [CrossRef]
- Butts, C.T. Social network analysis: A methodological introduction. Asian J. Soc. Psychol. 2010, 11, 13–41. [Google Scholar] [CrossRef] [Green Version]
- Leng, Y. Research and Development of Dynamic Social Network Visualization Technology; Nanjing University of Technology: Nanjing, China, 2012. [Google Scholar] [CrossRef]
- Yanxiang, Z. Research on Information Dissemination Model of Network Community based on Social Network Analysis; Nanjing University of Aeronautics and Astronautics: Nanjing, China, 2011. [Google Scholar] [CrossRef]
- Zhang, Q.; Xing, Z. The Influencing Mechanism of Community Space Layout on Elder’s Community Social Network: An Empirical Analysis in the Perspective of Functional Distance. Urban Dev. Stud. 2015, 22, 87–93. [Google Scholar] [CrossRef]
- Qi, L.; Liang, W.; Xi, M. The Public Space Pattern research of Guangfu Traditional Villages Based on Spatial Syntax: A Case Study of Huangpu Village in Guangzhou City, China. IOP Conf. Ser. Earth Environ. Sci. 2019, 267, 20–33. [Google Scholar] [CrossRef] [Green Version]
- Wang, S. Research on Public Space Reconstruction of Old Community in Main Urban Area of Handan City Based on Space Syntax; Hebei University of Engineering: Handan, China, 2021. [Google Scholar] [CrossRef]
- Rossini, F.; Melody, H.Y. Public open spaces in private developments in Hong Kong: New spaces for social activities? J. Urban Int. Res. Placemaking Urban Sustain. 2021, 14, 237–261. [Google Scholar] [CrossRef]
- Androulaki, M.; Frangedaki, E.; Antoniadis, P. Optimization of public spaces through network potentials of communities. Procedia Manuf. 2020, 44, 294–301. [Google Scholar] [CrossRef]
- Gong, Y.; Xiao, Y.; Lu, L. Study on Tianjin Public Housing Residential District Planning to Meet the Needs of Migration in Rapid Urbanization. J. Civ. Eng. Archit. 2016, 10. [Google Scholar] [CrossRef] [Green Version]
- Bishop, K. Encyclopedia of Sustainable Technologies || Social Interactions and the Quality of Urban Public Space. Ref. Modul. Earth Syst. Environ. Sci. 2017, 63–70. [Google Scholar] [CrossRef]
- Murgante, B.; Borruso, G. Smart cities or dumb cities? Smart communities, city dashboard e social network analysis. GEOmedia 2014, 18, 48–49. [Google Scholar] [CrossRef]
- Zhao, L.; Wang, Z.; Wei, G. Study on the Adaptive Alteration of Representative Residential Buildings of the 1980’S in Beijing. Urban Dev. Stud. 2016, 23, 23–27. [Google Scholar] [CrossRef]
- Rim, Y.S.; Choi, J.P. Deduction of the Design Objectives and Strategies of Communal Spaces in Apartment Complexes for ‘Social Interaction and Communication’. J. Korean Hous. Assoc. 2011, 22. [Google Scholar] [CrossRef] [Green Version]
- Sun, N. Study on the Optimization of the Shared Space of Guanxiangshan District in Qingdao Based on the Social Network Analysis; Qingdao University of Technology: Qingdao, China, 2020. [Google Scholar] [CrossRef]
- Roick, O.; Heuser, S. Location based social networks-definition, current state of the art and research agenda. Trans. Gis 2013, 17, 763–784. [Google Scholar] [CrossRef] [Green Version]
- Bonenberg, W. Public Space in the Residential Areas: The Method of Social-spatial Analysis. Procedia Manuf. 2015, 3, 1720–1727. [Google Scholar] [CrossRef] [Green Version]
- Yang, J.; Zhang, J.; Wang, J. Construction of Urban Community Publicity from the Perspective of Public Space. Urban Dev. Stud. 2020, 27, 106. [Google Scholar]
- Bao, J. Research on Public Space Designing of Shenzhen Mixed Low-Income Housing Based on the Perspective of Community Identity; Harbin Institute of Technology: Harbin, China, 2013. [Google Scholar] [CrossRef]
- Wang, K.; Li, K.; Yang, S. Research on the Construction of Community Public Space Based on the Citizenization Intention of Non-registered Population: A Survey of 181 Communities from the National New Areas. J. Renmin. Univ. China 2020, 34, 38–47. [Google Scholar]
Figure 1.
The technical route of space layout optimization in affordable housing based on social network analysis.
Figure 1.
The technical route of space layout optimization in affordable housing based on social network analysis.

Figure 2.
Locations of three affordable housing sample.

Figure 3.
Numbering of public space node in the Qingling City Garden, Qiyiju and Qixing Tianxing Garden.
Figure 3.
Numbering of public space node in the Qingling City Garden, Qiyiju and Qixing Tianxing Garden.

Figure 4.
Schematic diagram of the association between public space node accessibility and symmetric collar matrix.
Figure 4.
Schematic diagram of the association between public space node accessibility and symmetric collar matrix.

Figure 5.
Visualization of social network model of sample affordable housing’ internal public space.
Figure 5.
Visualization of social network model of sample affordable housing’ internal public space.


Table 1.
Investigation on the attributes of sample population and the characteristics of use behavior of internal and external public space.
Table 1.
Investigation on the attributes of sample population and the characteristics of use behavior of internal and external public space.
| Gender | Quantity | Proportion | Frequency of Use | Quantity | Proportion |
|---|---|---|---|---|---|
| Male | 270 | 58.32 | Not every day | 19 | 4.10 |
| Female | 193 | 41.68 | Once a day | 175 | 37.80 |
| Age | 2–3 times a day | 259 | 55.94 | ||
| 18–30 | 88 | 19.01 | 3–4 times a day | 10 | 2.16 |
| 30–60 | 165 | 35.64 | 6 or more times a day | ||
| 60–80 | 202 | 43.63 | |||
| Age 80 and above | 8 | 1.73 | |||
| Main activity period | Usage Mode (multiple selection) | ||||
| 6–8 o’clock | 14 | 3.02 | Chat | 175 | 13.50 |
| 8–10 o’clock | 177 | 38.23 | Take a walk | 294 | 22.69 |
| 10–12 o’clock | 38 | 8.21 | Sit | 163 | 12.58 |
| 12–14 o’clock | Sports and fitness | 195 | 15.05 | ||
| 14–16 o’clock | 156 | 33.69 | Square dancing | 26 | 2.01 |
| 16–18 o’clock | 25 | 5.40 | Chess and card | 100 | 7.72 |
| 18–20 o’clock | 53 | 11.45 | Take care of children | 105 | 8.10 |
| Hours of use | 0.00 | Nap | 233 | 17.98 | |
| Less than 10 min per day | 22 | 4.75 | Musical Instruments | 5 | 0.39 |
| 10–15 min per day | 50 | 10.80 | |||
| 15–30 min per day | 65 | 14.04 | |||
| 30–60 min per day | 227 | 49.03 | |||
| 60 min or more per day | 99 | 21.38 | |||
 |  | ||||
Table 2.
Assignment criteria for node capacity/activity diversity of public space of sample affordable housing.
Table 2.
Assignment criteria for node capacity/activity diversity of public space of sample affordable housing.
| Node Type | Capacity Interval Assignment | Activity Diversity Assignment |
|---|---|---|
| Large area for activities | 6–8 | 3 |
| Fitness equipment | 4–6 | 2 |
| Children’s rides | 5–7 | 2 |
| Bench | 2–4 | 1 |
| Multiple benches | 4–8 | 2 |
| A small amount of open space | 3–5 | 1 |
| Tables and chairs | 4–8 | 2 |
| Pavilion | 4–6 | 2 |
| Badminton court | 4–8 | 2 |
Table 3.
Summary of frequency of use, mean capacity and activity diversity data of public space nodes for affordable housing samples.
Table 3.
Summary of frequency of use, mean capacity and activity diversity data of public space nodes for affordable housing samples.
| QL Community | QX Community | QY Community | |||||
|---|---|---|---|---|---|---|---|
| Settlement-Level | Neighborhood-Level | Settlement-Level | Neighborhood-Level | Settlement-Level | Neighborhood-Level | ||
| Frequency of use | min | 16 | 0 | 24 | 5 | 12 | 0 |
| max | 33 | 26 | 32 | 20 | 25 | 22 | |
| mean | 23.75 | 7.54 | 28 | 11.89 | 18.25 | 6.84 | |
| Frequency ratio | min | 3.50 | 0.00 | 14.72 | 3.07 | 4.92 | 0.00 |
| max | 7.22 | 5.69 | 19.63 | 12.27 | 10.25 | 9.02 | |
| mean | 5.20 | 1.65 | 17.18 | 7.29 | 7.48 | 2.80 | |
| average capacity | min | 12 | 3 | 10 | 3 | 10 | 3 |
| max | 21 | 7 | 20 | 6 | 15 | 5 | |
| mean | 15 | 3.25 | 15 | 3.56 | 12.75 | 3.32 | |
| activity diversity | min | 5 | 1 | 4 | 1 | 4 | 1 |
| max | 8 | 2 | 8 | 2 | 6 | 2 | |
| mean | 6 | 1.06 | 6 | 1.22 | 5 | 1.16 | |
Table 4.
Parameters and significance of social network analysis of public space in affordable housing.
Table 4.
Parameters and significance of social network analysis of public space in affordable housing.
| Network Feature | Feature Parameter | Network Meaning | Interpretation |
|---|---|---|---|
| Network completeness | Network size | Number of network nodes | In the same network size, the larger the network density, the higher the network completeness |
| Network density | The average number of connections a node has with it in its neighborhood | ||
| Network integration | Node intermediate centrality | The probability that a node is located on a “path”, which is a measure of network centrality | The higher the intermediate centrality of a node, the higher the “status” of the node in the network.The greater the potential of network intermediate centrality, the stronger the degree of integration and concentration of the whole space. |
| Network intermediate centrality potential | The degree to which the network is monocentric or polycentric | ||
| Network correlation | Feature path length | Mean number of nodes to be spanned to connect any two nodes | The smaller the length of feature path, the better the accessibility of each public space.The larger the network clustering coefficient, the higher the degree of spatial aggregation of activities.The larger the small-world value, the higher the efficiency of activity occurrence. |
| Clustering coefficient | Mean local node density | ||
| Small-world value | Ratio of actual network paths to random network paths |
Table 5.
Network feature parameter table for public spaces within affordable housing areas as typical samples.
Table 5.
Network feature parameter table for public spaces within affordable housing areas as typical samples.
| Network Characteristics | Feature Index | QL | QX | QY |
|---|---|---|---|---|
| Network completeness | Network size | 52 | 11 | 29 |
| Network density | 0.526 | 0.709 | 0.372 | |
| Network integration | Node intermediate centrality | 15.79 | 1.82 | 12.90 |
| Network intermediate centrality potential | 5.46% | 5.33% | 16.57% | |
| Network correlation | Feature path length | 1.6 | 1.4 | 1.9 |
| Clustering coefficient | 0.854 | 0.871 | 0.759 | |
| Small-world value | 1.12 | 1.28 | 1.01 |
Table 6.
Node parameter statistics of public spaces within affordable housing areas as typical samples.
Table 6.
Node parameter statistics of public spaces within affordable housing areas as typical samples.
| QL Community | QX Community | QY Community | |||||
|---|---|---|---|---|---|---|---|
| Settlement-Level | Neighborhood-Level | Settlement-Level | Neighborhood-Level | Settlement-Level | Neighborhood-Level | ||
| min | 4.25 | 0.04 | 3 | 0 | 2.8 | 0 | |
| intermediate centrality | max | 20.35 | 84.12 | 3 | 4 | 33.79 | 73.39 |
| mean | 9.56 | 16.31 | 3 | 1.56 | 15.25 | 12.52 | |
| min | 0.811 | 0.607 | 0.778 | 0.733 | 0.526 | 0.472 | |
| clustering coefficient | max | 0.879 | 0.995 | 0.778 | 1 | 0.859 | 1 |
| mean | 0.86 | 0.853 | 0.778 | 0.891 | 0.723 | 0.765 | |
Table 7.
Results of multivariate linear regression analysis of the frequency of public space use within affordable housing areas.
Table 7.
Results of multivariate linear regression analysis of the frequency of public space use within affordable housing areas.
| Coefficient (Normalized) | Coefficient | p-Value | |
|---|---|---|---|
| QX | 0.208 | 6.876 | 0.000 |
| QY | 0.086 | 2.851 | 0.006 |
| intermediate centrality | 0.413 | 0.162 | 0.000 |
| clustering coefficient | 0.117 | 3.858 | 0.075 |
| node capacity mean value | 0.558 | 0.969 | 0.000 |
| activity diversity | 0.372 | 0.613 | 0.000 |
| Intercept | −0.062 | −4.601 | 0.266 |
| Multiple R-Squared: 0.8131 | |||
| Adjusted R-Squared: 0.7999 | |||
Publisher’s Note: MDPI stays neutral with regard to jurisdictional claims in published maps and institutional affiliations. |
© 2021 by the authors. Licensee MDPI, Basel, Switzerland. This article is an open access article distributed under the terms and conditions of the Creative Commons Attribution (CC BY) license (https://creativecommons.org/licenses/by/4.0/).
Share and Cite
MDPI and ACS Style
Zhao, J.; Peng, Z.; Liu, L.; Yu, Y.; Shang, Z. Public Space Layout Optimization in Affordable Housing Based on Social Network Analysis. Land 2021, 10, 955. https://doi.org/10.3390/land10090955
AMA Style
Zhao J, Peng Z, Liu L, Yu Y, Shang Z. Public Space Layout Optimization in Affordable Housing Based on Social Network Analysis. Land. 2021; 10(9):955. https://doi.org/10.3390/land10090955
Chicago/Turabian StyleZhao, Jie, Zhenghong Peng, Lingbo Liu, Yang Yu, and Zhourui Shang. 2021. "Public Space Layout Optimization in Affordable Housing Based on Social Network Analysis" Land 10, no. 9: 955. https://doi.org/10.3390/land10090955
Note that from the first issue of 2016, this journal uses article numbers instead of page numbers. See further details here.