Multi-Dimensional Enhanced Seizure Prediction Framework Based on Graph Convolutional Network
 Xin Chen
 Yuanjie Zheng
 Changxu Dong1
 - 1School of Information Science and Engineering at Shandong Normal University, Jinan, China
- 2School of Computer Science and Engineering at Southeast University, Nanjing, China
- 3Key Lab of Intelligent Computing and Information Security in Universities of Shandong, Shandong Normal University, Jinan, China
- 4Shandong Provincial Key Laboratory for Novel Distributed Computer Software Technology, Shandong Normal University, Jinan, China
- 5Institute of Biomedical Sciences, Shandong Normal University, Jinan, China
In terms of seizure prediction, how to fully mine relational data information among multiple channels of epileptic EEG? This is a scientific research subject worthy of further exploration. Recently, we propose a multi-dimensional enhanced seizure prediction framework, which mainly includes information reconstruction space, graph state encoder, and space-time predictor. It takes multi-channel spatial relationship as breakthrough point. At the same time, it reconstructs data unit from frequency band level, updates graph coding representation, and explores space-time relationship. Through experiments on CHB-MIT dataset, sensitivity of the model reaches 98.61%, which proves effectiveness of the proposed model.
1. Introduction
Epilepsy is a chronic disease caused by brain dysfunction, which is characterized by sudden and transient (Jia et al., 2004). In the study of seizure symptoms, EEG plays an important role. It is an important auxiliary technology for epilepsy diagnosis (Yuan et al., 2012). In traditional diagnosis of epilepsy symptoms, EEG data is often analyzed by experienced doctors. This process takes the doctors too much time and energy. Besides, doctors often work for long time, their judgments are also likely to be negatively affected by their body fatigue. To solve the problem, automatic detection technology of epilepsy EEG is born.
At present, there are abundant researches of automatic detection based on epilepsy EEG. However, only a few literatures have focused on the analysis of seizure prediction. In real life, it is meaningful to predict seizures. For patients, uncertainty of seizures may cause unpredictable accidents, which may seriously affect life and work (Holmes, 1984; Ahmed, 2005). The effective prediction of seizure can help patients to solve the problems in time, thus reducing the loss of patients to a minimum. In addition, for doctors and researchers, the effective prediction of seizures not only helps them to explore the basic mechanisms of epileptic seizures, but also provides important support for building accurate and stable epilepsy auxiliary diagnostic tools. In this paper, we will focus on seizure prediction.
The process of seizure prediction generally consists of EEG signal acquisition, data preprocessing, feature extraction, and classification. In particular, mining rich and effective features from native EEG data is essential to improve classification accuracy. According to variation of the domains that EEG features are extracted from, features may come from time domain, frequency domain, and the time-frequency domain.
In time domain, Tessy et al. (2016) focused on extracting two time-domain features of line length and energy to obtain high classification results on k-nearest neighbors (KNN) classifier. The algorithm proposed by Shanir et al. (2015) was based on average and minimum of each segment. In addition, the team of Zhang et al. (2018) divided EEG into several clusters and extracted a set of time-domain features from each cluster. Each group of features was regarded as a node of complex network. Then, average weighted degree was calculated from network as classification feature.
In frequency-domain, through experiments on Freiburg and CHB-MIT databases, Zhou et al. (2018) proved that classification accuracy of frequency-domain signals is significantly better than that of time-domain signals. Al Ghayab et al. (2019) extracted statistical features from sub windows by Fourier transform, and sorted features by using information gain technique to select the most appropriate ones.
In time-frequency-domain, more and more researches focused on extracting EEG features from time-frequency distribution (TFDs). Guerrero-Mosquera et al. (2010) extracted length, frequency, and energy from the smoothed Wigner-Ville distribution (SWVD) by using trajectory estimated from McAulay-Quatieri sinusoidal model. A new method (Wavelet-Chaos) of wavelet transformation was proposed by analyzing δ, θ, α, and β subbands of EEG, they found that significant differences could be captured by combining subband information (Adeli et al., 2007). Sharma et al. (2014) used cubical threshold denoising methods based on wavelet to analyze EEG signals before extracting statistical features from frequency bands (0 ~ 8, 8 ~ 16, 16 ~ 32, and 0 ~ 32 Hz). In addition, local binary pattern (LBP) was extended to analysis of EEG signals, because of its outstanding advantages such as rotation invariance and gray invariance. For example, Shanir et al. (2018) proposed a morphological feature extraction method based on LBP operator.
Considering comprehensively above these points, we propose multi-dimensional enhanced seizure prediction framework based on graph convolutional network (MESPF). The contributions of this research are as follows:
• It is very importance to improve accuracy of seizure prediction. To provide the prediction model with more powerful and abundant data, we enhance overall consideration of dimensions about epilepsy EEG signals. In particular, we take multichannel spatial relationship as breakthrough point, update representation of graph relational data at frequency band level, and explore the space-time relationships.
• We propose a multi-dimensional enhanced seizure prediction framework, which mainly includes information reconstruction space, graph state encoder, and space-time predictor. We combine technical advantages of wavelet packet decomposition, graph convolutional network and gated recurrent neural network in construction of the framework. From aspects of frequency, channel, and time, we intend to mine richer and more effective data information than previous studies.
• Finally, we apply the framework to data set (CHB-MIT) for verification. In terms of experimental results, it has surpassed or approached many existing algorithms. In short, our framework provides a novel way for peers to study principle of seizure prediction.
The organizational structure of our article is as follows, the second section introduces prediction principle of the framework (MESPF), the third section briefly describes experimental results and analysis, and the fourth section is summary.
2. Methodologies
For seizure prediction, we propose a multi-dimensional enhanced seizure prediction framework (MESPF). It mainly includes information reconstruction space, graph state encoder, and space-time predictor. The main process of the model is shown in Figure 1. The following contents give specific explanations in turn.

Figure 1. Our model mainly includes information reconstruction space, graph state encoder, and space-time predictor.
2.1. Information Reconstruction Space
Patients vary in physiological mechanisms, and their pre-ictal signals may occur in different frequency band range. To capture these subtle difference, we designs an information reconstruction space. It is mainly used to highlight specificity and explore the effect of feature enhancement on graph encoding.
Since epileptic EEG signals are random, non-stationary and non-linear, we actively introduce wavelet packet decomposition (WPD) in information reconstruction space to decompose EEG signals. It should be emphasized that since range of wavelet transform is mainly low frequency part of signals, it is difficult to characterize a large amount of detailed information. However, wavelet packet decomposition can orthogonally decompose signal in full frequency range, and resolution of high frequency part is better than the former. It is a more precise analysis method than wavelet transform. So that it has gradually become one of main methods for analyzing non-stationary signals (Hyvarinen et al., 2001). Through wavelet packet decomposition, we can analyze EEG signals from multiple frequency bands.
The principle of information reconstruction space in MESPF is shown in Figure 2. By decomposing epileptic EEG signals and calculating characteristics of energy value, it can update representation of graph data. First of all, C1 − Cn represents 18 channels. In the third step, data of each channel is processed by wavelet packet decomposition technique. Then we calculate energy values of corresponding sub-bands and reconstruct vectors characterized by energy values (step 4–5). After completion of channel data reconstruction, we use Pearson correlation coefficient calculation method to calculate correlation between multiple channels (step 6). We update graph relationship representation as one of direct inputs to graph encoder (equivalent to edges of graph). Finally, related relational data and each channel data itself (equivalent to vertex data of graph) are used as input to graph encoder, as shown in step 7.
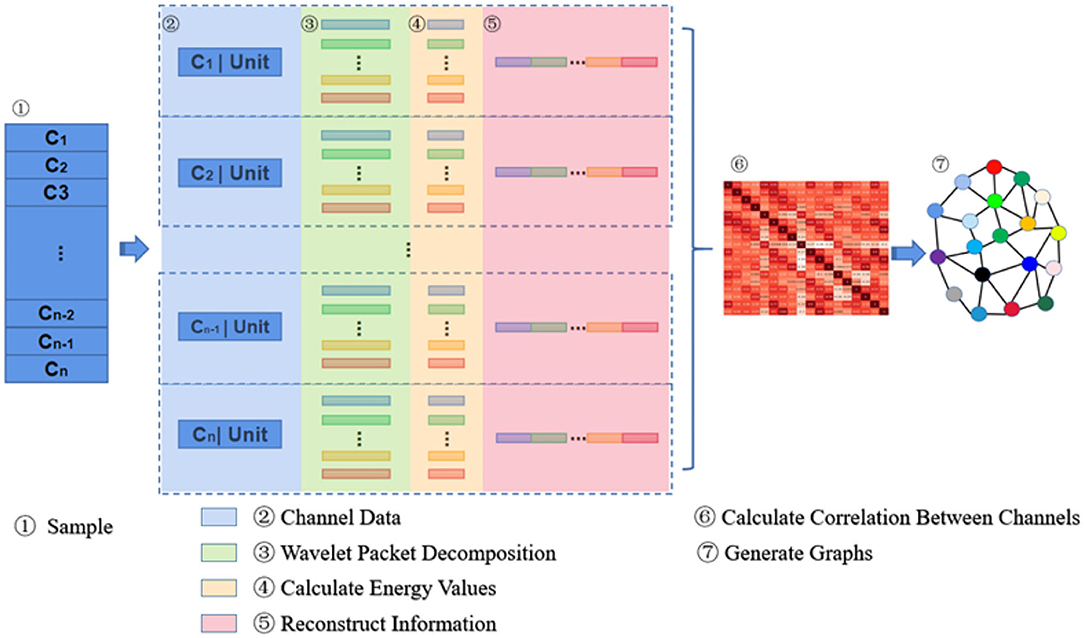
Figure 2. The figure shows concrete principle of information reconstruction space.
Specifically, decomposition principle of information reconstruction space is shown in Figure 3. For a signal, wavelet coefficients (A and D) are obtained by wavelet packet decomposition of the first layer. A represents low frequency part of signal, and D represents high frequency part. Each node in graph represents a data sequence. Then, energy values of each sub-band are calculated, respectively. In the experiment, four-layer wavelet packet decomposition is adopted to obtain wavelet coefficients of 16 frequency bands. In this way, each signal unit can be represented by energy values. It should be noted that since epilepsy EEG signal is continuous waveform, our experiment uses a relatively smooth Daubechies (Db) wavelet base.
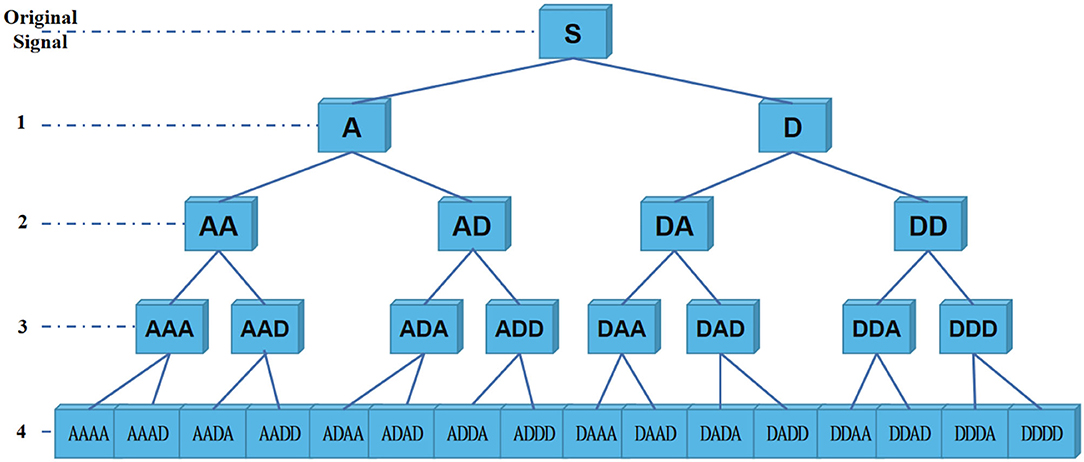
Figure 3. EEG signals are divided into several sub-bands by wavelet packet decomposition.
2.2. Graph State Encoder
After signal unit is processed by information reconstruction space, the graph data are given into graph encoder for further feature processing.
Seizure is a synergistic result of multiple brain regions. For EEG, each channel records activities of different brain regions, and there must be a certain relationship between channels. Therefore, we build a graph state encoder to explore relationship by extracting spatial features between multiple channels. The specific structure and parameters about graph encoder are shown in Figure 4, which mainly includes input layer, graph convolution layer-1, graph convolution layer-2, fully connected layer, and graph status code layer. The activation layer in network uses Rectified Linear Unit (ReLU), which can speed up convergence speed. In general, after extracting features of graph space through graph convolution layer, relevant data are weighted by fully connected layer. Then, graph status code is generated. As for status code, it is composed of 18 eigenvalues, which, respectively, represent 18 channels of graph data. Each status code represents data characteristics of corresponding time period. Finally, we feed status codes into space-time predictor in chronological order.
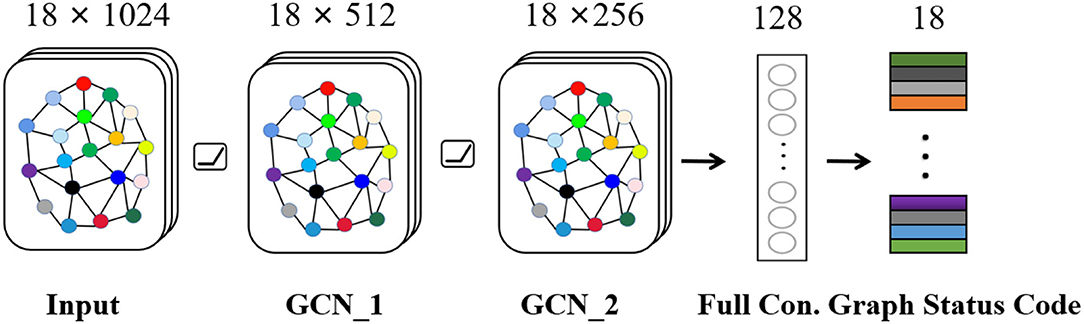
Figure 4. Graph state encoder mainly includes input layer, graph convolution layer, and fully connected layer.
As for graph state encoder, we refer to method proposed by Kipf and Welling (2016) and build sub-module based on graph convolutional network. In particular, we need to emphasize application of filter. Firstly, we define convolution operation on graph as:
XMESPF represents direct input (signal) of graph state encoder, Ke represents convolution kernel. Furthermore, in previous studies, Defferrard et al. (2016) introduced Chebyshev polynomials, and they provided an algorithm for constructing fast local filters in spectral domain, which can learn local, static and combined features on graph. Subsequently, Kipf and Welling (2016) optimized convolutional network structure through the first-order local approximation of spectrogram convolution. In process of graph convolution, due to existence of graph Fourier transform, computational complexity of model is relatively high. Chebyshev polynomials have numerical stability and computational efficiency in field of polynomial function approximation. Therefore, we actively introduce Chebyshev polynomials into the model. The relevant formula is as follows:
θ represents vector of Chebyshev coefficients, , Λ represents diagonal matrix of eigenvalues, λmax represents maximum eigenvalue of regularized feature matrix, I represents identity matrix, convolution on graph is finally expressed as:
OMESPF represents the output of graph convolution layer. Then OMESPF is processed through ReLU activation function, this is shown in Formula 5.
Finally, through fully connected layer, we synthesize several graph space features to generate status code SMESPF.
2.3. Space-Time Predictor
In the model, space-time predictor is constructed. After exploring multi-channel spatial relationship, we further explore change rule at time series level.
The internal structure of space-time predictor is shown in Figure 5. SMESPF_t−1 and SMESPF_t, respectively, represent graph status codes at time t − 1 and time t. Specifically, as complexity of neural network architecture increases or training time of experimental data becomes longer, phenomenon of gradient disappearance or explosion is easy to occur. It is difficult to master law of EEG timing signal. The emergence of gate recurrent network solves related problems well. So, it is mainly built on the basis of gate recurrent unit. And direct input of space-time predictor is output of graph state encoder. It should be emphasized that relevant input data should be entered in chronological order. By mining implicit relationship in terms of timing, prediction results are finally output by multilayer perceptron (MLP).
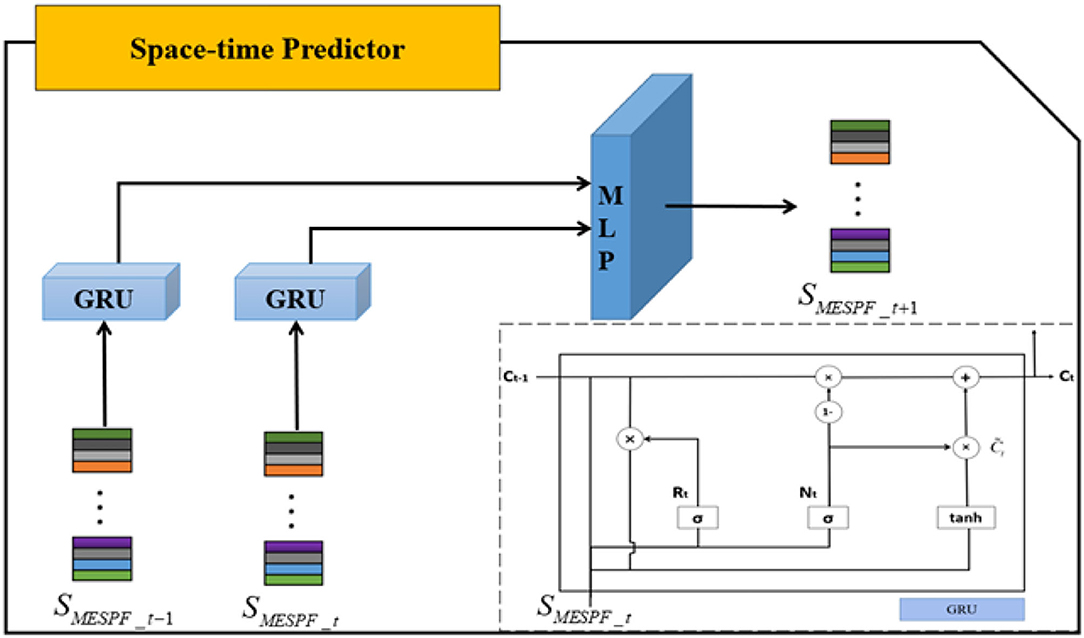
Figure 5. The core part of space-time predictor is gate recurrent unit.
Focus on gated recurrent unit, Cho et al. (2014) integrate forget gate and input gate into an update gate. Specifically, GRU includes update gate and reset gate. The former controls extent to which state information at previous moment is brought into the current state. And the latter controls extent to which state information at previous moment is ignored. The GRU structure is shown in lower right corner of Figure 6. Then, we combine diagram and formulas to further explain.
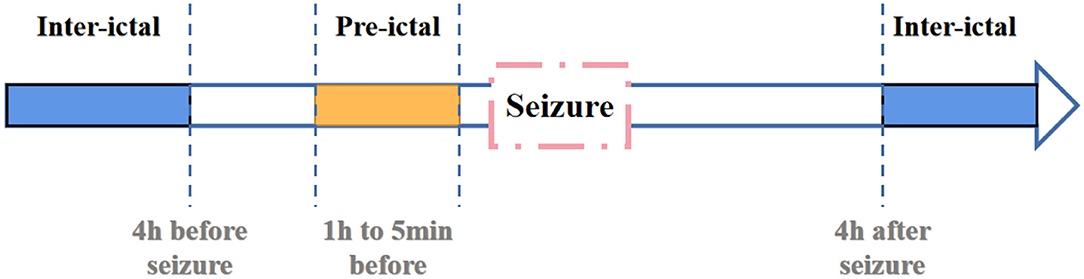
Figure 6. According to actual seizure process, EEG is divided into different stages.
The calculations for reset gate (Rt) is shown in Formula (5). Both Wr and Ur are weight matrices. And σ represents sigmoid function, which can map results between 0 and 1. The calculation principle of update gate (Nt) is similar to that of reset gate.
The calculation of candidate hidden layer () is as follows. Tanh represents tanh function, and its mapping range is −1 to +1.
The final output hidden layer information (Ct) calculation formula is as follows:
3. Results Analysis
3.1. Data Set Description
In order to prove effectiveness of the framework, we further apply it to CHB-MIT data set. The download link for complete database is https://physionet.org/content/chbmit/1.0.0/. It consist of 23 data samples from 22 subjects(5 males, ages 3–22; and 17 females, ages 1.5–19). All samples are stored in EDF format. And all signals are sampled at 256 samples per second. It should be noted that this is a verification experiment of validity. In order to achieve effective prediction of seizures, we uses the framework to classify pre-ictal and inter-ictal.
In previous studies, Litt et al. (2001) have demonstrated that seizure-like EEG signals become more frequent at 2 h before actual seizure. They propose that accumulated energy will increase within 50 min before initial state. And Affes et al. (2019) propose that pre-seizure phase is 1 h before seizure. Based on researches mentioned above, we defines pre-ictal period as data between 1 h and 5 min before seizure. And the definition of inter-ictal is shown in Figure 6.
It should be noted that in the process of data collection, data of inter-ictal period is much more than data of pre-ictal period. To make the number of samples in these two periods equal, an overlapped window is applied in pre-ictal period for data segmentation, and the window overlap rate is set as 50%.
3.2. Experimental Indicators
The evaluation indicators of our model include Accuracy, Sensitivity, Specificity, False Positive Rate, and F1-Score. The calculation formulas for these indicators are as follows:
TP indicates that it is actually a positive example and the predicted result is a positive example. FP is actually a negative example, and the predicted result is a positive example. TN indicates that it is actually a negative example, and predicted result is a negative example. FN indicates that it is actually a positive example, and predicted result is a negative example.
3.3. Experimental Environment Configuration
As for experimental environment, information reconstruction space of MESPF model is completed on the Windows10 system with Intel(R) Core(TM) I7-6500U CPU @ 2.50GHz 2.59GHz. Construction of graph encoder and space-time predictor is completed on the Ubuntu system. Relevant model is built based on TensorFlow framework with Python. Adam optimizer is also used in related experiments, and initial learning rate is set at 0.01.
In addition, the loss function of the model includes cross entropy term and L2 regularization term, as shown in Formula (18). H(pMESPF_O,qMESPF_R) represents the loss function of MESPF model for seizure prediction. pMESPF_O represents related predicted value of space-time predictor. qMESPF_R represents true label for each data unit.
3.4. Analysis of Experimental Results
To further explain principle of information reconstruction space, we set up a control group to visualize the process of reconstruction. One group is pre-ictal samples, and the other group is inter-ictal samples. Figures 7, 8 show time domain information. It can be seen that there are more high frequency signals before seizure. These are extremely important features for predicting seizure in advance. Figures 9, 10 are images after transforming from time domain to frequency domain. It can also be seen from the former that times of high frequency increases significantly in pre-ictal period.
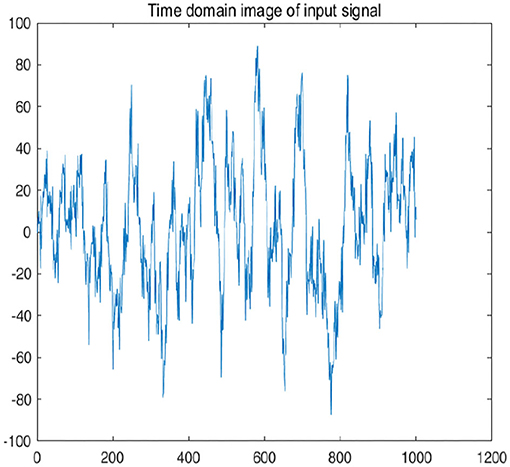
Figure 7. Time-domain image of signal in pre-ictal is shown in figure.
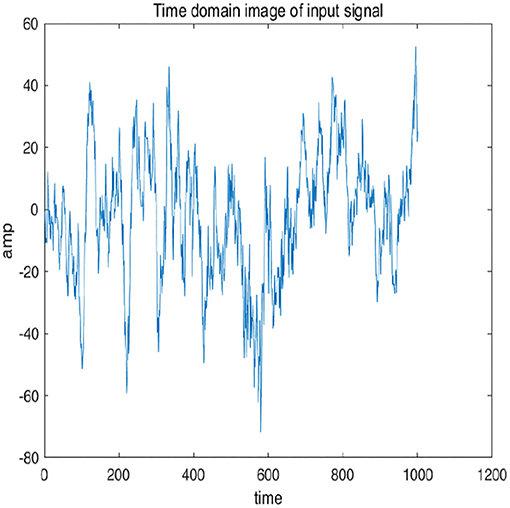
Figure 8. Time-domain image of signal in pre-ictal is shown in figure.
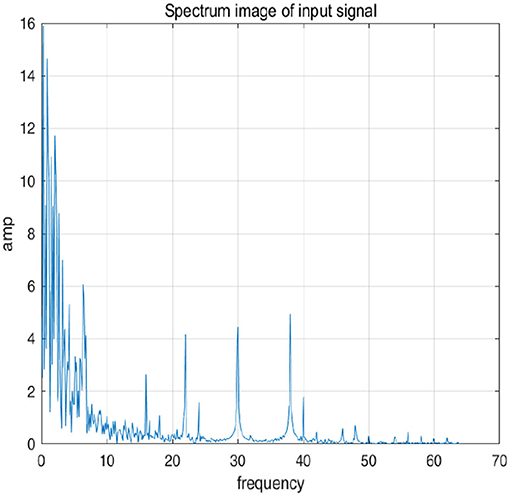
Figure 9. Frequency-domain image of signal in inter-ictal is shown in figure.
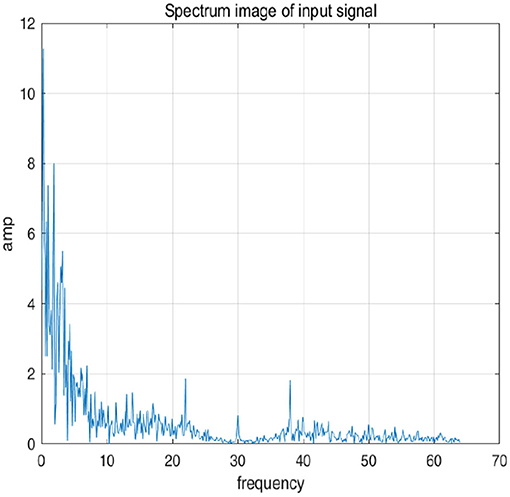
Figure 10. Frequency-domain image of signal in inter-ictal is shown in figure.
Subsequently, in order to mine the law of different frequency band in signals, we use WPD to decompose signals. Through WPD, we extract wavelet packet coefficients of nodes. Then energy of wavelet packet coefficients is used as eigenvalue to construct eigenvector. Figures 11, 12 show energy values of the fourth layer after four-layer WPD.
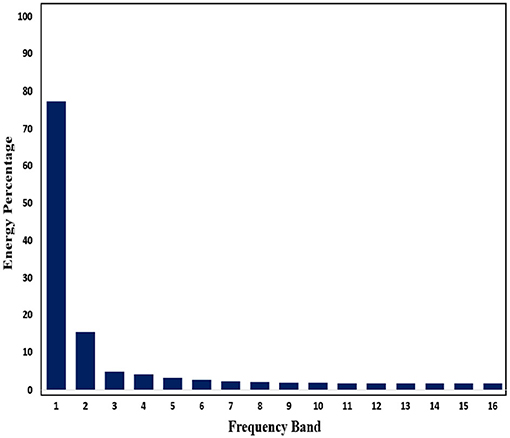
Figure 11. Energy percentage of each frequency band (pre-ictal) in the fourth layer of WPD is shown in figure.

Figure 12. Energy percentage of each frequency band (inter-ictal) in the fourth layer of WPD is shown in figure.
In our experiment, each epileptic patient is assigned a unique ID number, from case 1 to case 24. The comprehensive index analysis for each patient is shown in Table 1. These indicators include specificity, sensitivity, PPV, NPV, FPR, and accuracy. More than half of the experiments achieve sensitivity of 100%. The average level of false positive rate is only 0.0106. Experimental data shows that the lower false positive rate, the better model's performance. For details of other experimental indicators, please refer to Table 1.
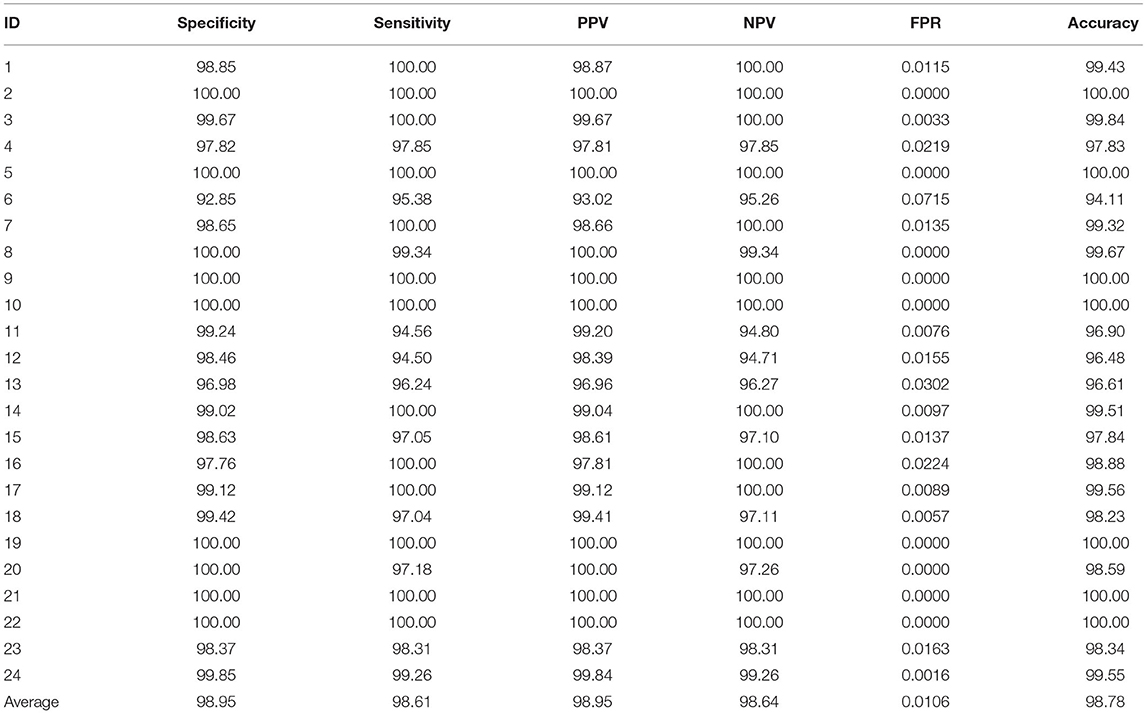
Table 1. Specific indicators of samples are shown in the table.
As a comprehensive index, F1-Score balances effects of precision and recall, and can systematically evaluate a classifier. The value of F1-Score ranges from 0 to 100%, and the larger the F1 value, the better the model performance. The result of F1-Score is shown in Figure 13. The average level of 24 cases is 0.9877. The best F1-Score value reach 100% for patients with ID 2, 3, and 5. And the lowest F1-score is 0.9419 for patient with ID 6.
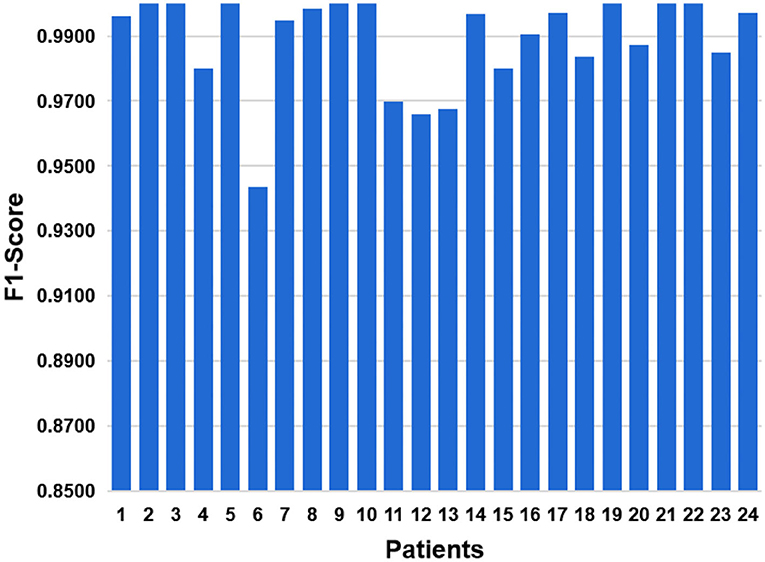
Figure 13. In order to balance influences of precision and recall, we have added F1-Score indicator.
Finally, we compare the performance of the proposed model with some existing algorithms, from traditional ones to that based on deep learning. The results are shown in Table 2. In terms of our method, we have analyzed epileptic EEG signals from multiple dimensions, including energy characteristics of frequency bands, spatial characteristics of channels, and timing characteristics of signals. In the process, we make full use of advantages of wavelet packet decomposition, graph convolutional network and gate recurrent unit network in their professional fields.
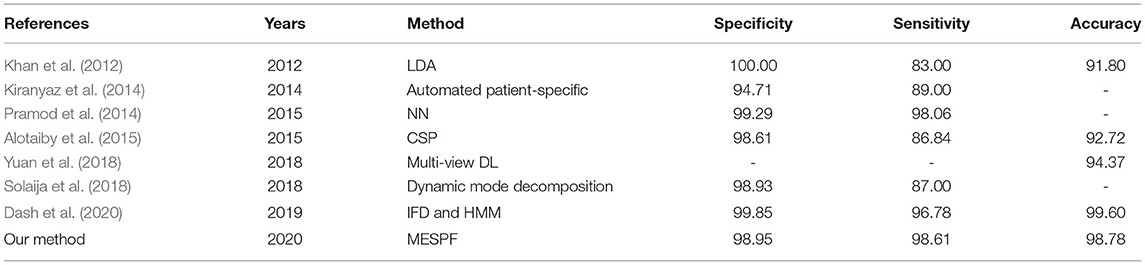
Table 2. In classification tasks of pre-ictal and inter-ictal, the framework is compared with other advanced methods.
As we all know, sensitivity is the proportion of people who are actually sick that are correctly judged as true positives. It is a meaningful indicator in medical clinical diagnosis. Table 2 shows an excellent performance of our model in sensitivity (98.61%). Besides, the accuracy is also consistent with the high level of other algorithms, and the specificity also reaches the average level of the other algorithms.
4. Conclusions
In conclusion, we propose the MESPF framework to explore the law of epilepsy EEG signals. From frequency, channel and time, we, respectively, build information reconstruction space based on wavelet packet decomposition, graph state encoder based on graph convolution network, and space-time predictor based on gated recurrent unit. We make full use of advantages of different methods to build an efficient seizure prediction framework (MESPF). MESPF has achieved better results in classification of pre-ictal and inter-ictal than existing methods. This integrated method of multidimensional and multi-method epileptic EEG provides a more novel idea for peers to study biomedical signals.
As far as the research is concerned, we take frequency, space (channel), and time into consideration. However, there is still a lot of work to be done. In our next step, we will consider more features, such as multiple spikes, approximate entropy, information entropy, fuzzy entropy, etc. Finally, we hope to build a more accurate and stable intelligent framework for seizure prediction by continuously mining surface meaning and internal correlation of epileptic EEG.
Data Availability Statement
Publicly available datasets were analyzed in this study. This data can be found here: https://www.physionet.org/content/chbmit/1.0.0/.
Author Contributions
XC: conceptualization, methodology, software, and writing—reviewing and editing. YZ: conceptualization, methodology, supervision, and funding acquisition. CD: validation, formal analysis, and data curation. SS: conceptualization, methodology, and writing—reviewing and editing. All authors contributed to the article and approved the submitted version.
Funding
This work was supported by the National Natural Science Foundation of China (Nos. 61572300, 81871508, and 61773246); Taishan Scholar Program of Shandong Province of China (No. TSHW201502038); Major Program of Shandong Province Natural Science Foundation (No. ZR2018ZB0419).
Conflict of Interest
The authors declare that the research was conducted in the absence of any commercial or financial relationships that could be construed as a potential conflict of interest.
Publisher's Note
All claims expressed in this article are solely those of the authors and do not necessarily represent those of their affiliated organizations, or those of the publisher, the editors and the reviewers. Any product that may be evaluated in this article, or claim that may be made by its manufacturer, is not guaranteed or endorsed by the publisher.
References
Adeli, H., Ghosh-Dastidar, S., and Dadmehr, N. (2007). A wavelet-chaos methodology for analysis of EEGs and EEG subbands to detect seizure and epilepsy. IEEE Trans. Biomed. Eng. 54, 205–211. doi: 10.1109/TBME.2006.886855
Affes, A., Mdhaffar, A., Triki, C., Jmaiel, M., and Freisleben, B. (2019). “A convolutional gated recurrent neural network for epileptic seizure prediction,” in International Conference on Smart Homes and Health Telematics (Cham: Springer), 85–96. doi: 10.1007/978-3-030-32785-9_8
Ahmed, S. N. (2005). Epileptic seizures and epilepsy. Epilepsia 46, 1700–1701. doi: 10.1111/j.1528-1167.2005.00273_3.x
Al Ghayab, H. R., Li, Y., Siuly, S., and Abdulla, S. (2019). Epileptic seizures detection in EEGs blending frequency domain with information gain technique. Soft Comput. 23, 227–239. doi: 10.1007/s00500-018-3487-0
Alotaiby, T. N., Abd El-Samie, F. E., Alshebeili, S. A., Aljibreen, K. H., and Alkhanen, E. (2015). “Seizure detection with common spatial pattern and support vector machines,” in 2015 International Conference on Information and Communication Technology Research (ICTRC) (Abu Dhabi). doi: 10.1109/ICTRC.2015.7156444
Cho, K., Van Merriënboer, B., Gulcehre, C., Bahdanau, D., Bougares, F., Schwenk, H., et al. (2014). Learning phrase representations using rnn encoder-decoder for statistical machine translation. arXiv preprint arXiv:1406.1078. doi: 10.3115/v1/D14-1179
Dash, D. P., Kolekar, M. H., and Jha, K. (2020). Multi-channel EEG based automatic epileptic seizure detection using iterative filtering decomposition and hidden markov model. Comput. Biol. Med. 116:103571. doi: 10.1016/j.compbiomed.2019.103571
Defferrard, M., Bresson, X., and Vandergheynst, P. (eds.). (2016). “Convolutional neural networks on graphs with fast localized spectral filtering,” in Advances in Neural Information Processing Systems (Barcelona, New York, NY: Curran Associates), 3844–3852.
Guerrero-Mosquera, C., Trigueros, A. M., Franco, J. I., and Navia-Vázquez, A. (2010). New feature extraction approach for epileptic EEG signal detection using time-frequency distributions. Med. Biol. Eng. Comput. 48, 321–330. doi: 10.1007/s11517-010-0590-5
Holmes, G. L. (1984). Electroencephalography. Basic Principles, Clinical Applications, and Related Fields.
Hyvarinen, A., Oja, E., and Karhunen, J. (2001). Independent Component Analysis. New York, NY: Wiley.
Jia, W., Gao, S., Gao, X., and Yang, F. (2004). The progress in epileptic seizure prediction. J. Biomed. Eng. 21:325. doi: 10.3321/j.issn:1001-5515.2004.02.038
Khan, Y. U., Rafiuddin, N., and Farooq, O. (2012). “Automated seizure detection in scalp EEG using multiple wavelet scales,” in 2012 IEEE International Conference on Signal Processing, Computing and Control (IEEE, Waknaghat), 1–5. doi: 10.1109/ISPCC.2012.6224361
Kipf, T. N., and Welling, M. (2016). Semi-supervised classification with graph convolutional networks. 5th International Conference on Learning Representations, ICLR 2017, Toulon, France. arXiv preprint arXiv:1609.02907.
Kiranyaz, S., Ince, T., Zabihi, M., and Ince, D. (2014). Automated patient-specific classification of long-term electroencephalography. J. Biomed. Inform. 49, 16–31. doi: 10.1016/j.jbi.2014.02.005
Litt, B., Esteller, R., Echauz, J., D'Alessandro, M., Shor, R., Henry, T., et al. (2001). Epileptic seizures may begin hours in advance of clinical onset: a report of five patients. Neuron 30, 51–64. doi: 10.1016/S0896-6273(01)00262-8
Pramod, S., Page, A., Mohsenin, T., and Oates, T. (2014). Detecting epileptic seizures from EEG data using neural networks. arXiv preprint arXiv:1412.6502.
Shanir, P., Khan, Y. U., and Farooq, O. (2015). “Time domain analysis of EEG for automatic seizure detection,” in National Conference on Emerging Trends in Electrical and Electronics Engineering (ETEEE-2015). (Jamia Millia Islamia, New Delhi).
Shanir, P. M., Khan, K. A., Khan, Y. U., Farooq, O., and Adeli, H. (2018). Automatic seizure detection based on morphological features using one-dimensional local binary pattern on long-term EEG. Clin. EEG Neurosci. 49, 351–362. doi: 10.1177/1550059417744890
Sharma, P., Khan, Y. U., Farooq, O., Tripathi, M., and Adeli, H. (2014). A wavelet-statistical features approach for nonconvulsive seizure detection. Clin. EEG Neurosci. 45, 274–284. doi: 10.1177/1550059414535465
Solaija, M. S. J., Saleem, S., Khurshid, K., Hassan, S. A., and Kamboh, A. M. (2018). Dynamic mode decomposition based epileptic seizure detection from scalp EEG. IEEE Access 6, 38683–38692. doi: 10.1109/ACCESS.2018.2853125
Tessy, E., Shanir, P. M., and Manafuddin, S. (2016). “Time domain analysis of epileptic EEG for seizure detection,” in 2016 International Conference on Next Generation Intelligent Systems (ICNGIS) (IEEE, Kottayam), 1–4. doi: 10.1109/ICNGIS.2016.7854034
Yuan, Q., Zhou, W., Liu, Y., and Wang, J. (2012). Epileptic seizure detection with linear and nonlinear features. Epilepsy Behav. 24, 415–421. doi: 10.1016/j.yebeh.2012.05.009
Yuan, Y., Xun, G., Jia, K., and Zhang, A. (2018). A multi-view deep learning framework for EEG seizure detection. IEEE J. Biomed. Health Inform. 23, 83–94. doi: 10.1109/JBHI.2018.2871678
Zhang, H., Meng, Q., Meng, B., Liu, M., and Li, Y. (2018). “Epileptic seizure detection based on time domain features and weighted complex network,” in International Conference on Intelligent Computing (Springer, Wuhan), 483–492. doi: 10.1007/978-3-319-95933-7_57
Keywords: epilepsy EEG signal, seizures prediction, multichannel relationship, graph convolutional network, space-time prediction
Citation: Chen X, Zheng Y, Dong C and Song S (2021) Multi-Dimensional Enhanced Seizure Prediction Framework Based on Graph Convolutional Network. Front. Neuroinform. 15:605729. doi: 10.3389/fninf.2021.605729
Received: 13 September 2020; Accepted: 26 July 2021;
Published: 19 August 2021.
Edited by:
Giuseppe Luigi Banna, United Lincolnshire Hospitals NHS Trust, United KingdomReviewed by:
Xizi Song, Tianjin University, ChinaDong Wen, Yanshan University, China
Fangzhou Xu, Qilu University of Technology, China
Copyright © 2021 Chen, Zheng, Dong and Song. This is an open-access article distributed under the terms of the Creative Commons Attribution License (CC BY). The use, distribution or reproduction in other forums is permitted, provided the original author(s) and the copyright owner(s) are credited and that the original publication in this journal is cited, in accordance with accepted academic practice. No use, distribution or reproduction is permitted which does not comply with these terms.
*Correspondence: Yuanjie Zheng, zhengyuanjie@gmail.com; Sutao Song, sutao.song@sdnu.edu.cn