

Abstract
For improving flow rate of multi-chamber piezoelectric pump with active valves, principle and structure of multi-chamber piezoelectric pump based on pumping unit with double circular piezoelectric unimorph actuators (CPUAs) are proposed. Double CPUAs are coaxially and symmetrically arranged on top and bottom of pump chamber and work in same frequency and phase at same time to provide driving force for pump. Two active piezoelectric valves with annular boundary are designed on left and right of pumping unit to ensure the multi-chamber piezoelectric pump bidirectionally pump fluid with high control accuracy and stop characteristics. Process compatible with printed circuit board (PCB) process is used to manufacture pump to ensure low cost. Flow rate model is established to numerically simulate flow characteristics of the pump. Pump is also experimentally tested and analyzed. Results show that proposed principle and structure can effectively improve flow rate and out pressure of multi-chamber piezoelectric pump with high control accuracy and stop characteristics of flow. Moreover, flow rate model can accurately describe its flow characteristics, which will be beneficial to design and optimize multi-chamber piezoelectric pumps with active valves. Proposed principle and structure of multi-chamber piezoelectric pumps with active valves have potential applications in complex microfluidic systems such as biochemical analysis, drug delivery and chip cooling.
Export citation and abstract BibTeX RIS
1. Introduction
With rapid development of microfluidic systems, microfluidic pumps have become key components to drive fluid in microfluidic systems [1–3]. Due to fast response speed, high sensitivity and large driving force of piezoelectric actuators, piezoelectric pumps [4–6] have small size and operate stably. Accordingly, piezoelectric pumps have become the most widely researched microfluidic pumps. According to whether there are valves, piezoelectric pumps can be divided into valve-less [7–10], with passive valves [11–13] and with active valves [14–16]. According to number of chambers, piezoelectric pumps can be divided into single-chamber [17, 18] and multi-chamber [9, 14–16, 19–21]. Moreover, due to structural characteristics, almost all piezoelectric pumps with active valves are multi-chamber piezoelectric pumps [14–16].
In general, valve-less piezoelectric pumps [22–24] and piezoelectric pumps with passive valves [25–27] have large flow rate and high output pressure. However, because of their structural characteristics, they can only pump fluid in one direction with low flow control accuracy. Compared with them, multi-chamber piezoelectric pumps with active valves have high control accuracy, high stop characteristics of flow and flexible flow direction control, which make them be the most suitable type to provide fluid driving force for complex microfluidic systems [28]. Cazorla et al [29] proposed a silicon based multi-chamber piezoelectric pump with active valves, the maximum flow rate of pump is 3.5 μl min−1 under the frequency and peak-to-peak value of driving voltage are 1 Hz and 24 V, respectively. Geipel et al [30] proposed a multi-chamber piezoelectric pump with actives valves with high control accuracy of flow rate. It ensured the controlled release of minute amounts of fluid with flow rate from 0.1 μl min−1 to 50 μl min−1. Utilizing active piezoelectric microfluidic valve with annular boundary proposed by Pan and Wang [31], Wang et al [32] proposed a multi-chamber piezoelectric pump with active piezoelectric microfluidic valves base on printed circuit board (PCB) process. The multi-chamber piezoelectric pump provides driving force through circular piezoelectric unimorph actuators (CPUAs) [33], and the maximum back pressure and flow rate are 760 Pa and 500 μl min−1, respectively. Its minimum change in flow rate is about 5.7 μl min−1. Accordingly, most of multi-chamber piezoelectric pumps with active valves have low output pressure and flow rate, which limit their application in complex microfluidic systems. Therefore, how to improve flow rate of multi-chamber piezoelectric pump with active valves has become the key to promote its application in complex microfluidic systems.
In addition to above researches on principle and structure of multi-chamber piezoelectric pump with active valves, there are also researches on theoretical modeling for its flow characteristics. Chao et al [24] established flow rate model of multi-chamber piezoelectric pump with active valves by analyzing the variation of chamber volume. Through utilizing the fluidic network theory, Goldschmidtboin et al [15] established lumped-element model of multi-chamber piezoelectric pump with active valves, and the modeling difficulty is simplified by using the well-known analogy of electric and fluidic networks. By researching the capillary effect across a gas–liquid interface in the working process of multi-chamber piezoelectric pump with active valves, Geipel et al [30] established model of critical compression ratio. The model can guide structural design of this kind of piezoelectric pump, so that the pump can overcome the capillary pressure drop and achieve robust and bubble-tolerant pumping. However, in the modeling process, the flow rate model either does not considered the effect of fluid-solid coupling on flow rate of pump [24], or does not consider the effect of fluid resistance on flow rate of pump [15], or can only describe the relationship between geometrical parameters and flow rate [30]. Accordingly, existing flow rate models of multi-chamber piezoelectric pump with active valves can not well describe the dynamic characteristics of its flow rate, and can not effectively describe the relationship between working frequency and flow rate. Since the higher working frequency is, the greater fluid resistance is, the above relationship can also be expressed as the relationship between fluid resistance and flow rate. Moreover, in the process of theoretical modeling, the flow rate model not only needs to include piezoelectric effect, thin plate vibration, electromechanical coupling and fluid-solid coupling, but also needs to analyze the coordination of each chamber and liquid flow in the active valves when multi-chamber piezoelectric pump is working, so modeling is difficult. These reasons lead to few researches on flow rate theory of multi-chamber piezoelectric pump with active valves, which limits structural design and optimization. Meanwhile, due to the commercial simulation tools (such as CFD-ACE+ and COMSOL MultiphysicsTM) struggle to solve such a comprehensive model of multi-chamber piezoelectric pump with active valves [16], so it is necessary to research its flow rate model. Therefore, it is meaningful to establish theoretical model that can accurately describe the relationship between flow rate of multi-chamber piezoelectric pump with active valves and its parameters, including geometrical parameters and working conditions, and reveal the physical characteristics behind the flow characteristics.
Therefore, in order to improve flow rate of multi-chamber piezoelectric pump with active valves to meet requirements of complex microfluidic systems such as biochemical analysis, drug delivery and chip cooling, the principle and structure of multi-chamber piezoelectric pump based on pumping unit with double CPUAs is proposed. Flow rate model is established to numerically simulate characteristics of the pump. Moreover, pump is also experimentally tested and analyzed.
2. Principle and structure
Figure 1(a) shows schematic diagram of multi-chamber piezoelectric pump based on pumping unit with double CPUAs. Figures 1(b) and (c) illustrate pumping in and pumping out of pumping unit, respectively. Figure 1(d) presents the working principle of multi-chamber piezoelectric pump. From figure 1, pumping unit is composed of double CPUAs (CPUA1 and CPUA2) coaxially and symmetrically installed on top and bottom of pump chamber. From figure 1(b), when pumping unit works at pumping in, both CPUA1 and CPUA2 protrude to outside of pump chamber. The volume of pump chamber increases by ΔV to generate pressure  in pump chamber and input pressure
  . The fluid flow into pump chamber from fluid channel on both sides. From figure 1(c), when pumping unit works at pumping out, both CPUA1 and CPUA2 squeeze into inner side of pump chamber. The volume of pump chamber is compressed by −ΔV to generate pressure
  in pump chamber and output pressure
  . The fluid in pump chamber flows out of fluid channel on both sides. Two active piezoelectric microfluidic valves are installed on left and right of pumping unit which consist of CPUA (CPUA3 and CPUA4 corresponding to the inlet and outlet valves, respectively) and annular boundary [31]. Because double CPUAs are used to provide the driving force for pumping unit, it can generate higher compression volume of pump chamber to improve output pressure, so as to improve flow rate of multi-chamber piezoelectric pump with active valves. From figure 1(d), multi-chamber piezoelectric pump realizes the function of pumping liquid by driving each chamber to work in turn. The working phase of multi-chamber piezoelectric pump can be divided into five stages, which include preparation stage (as shown in phase 1), fluid suction stage of inlet valve (as shown in phase 2), fluid suction stage of pumping unit (as shown in phase 3), fluid discharge stage of pumping unit (as shown in phase 4) and fluid discharge stage of outlet valve (as shown in phase 5). By allowing the multi-chamber piezoelectric pump to circulate in phases 2–5, the pump can achieve continuous pumping of liquid. By changing amplitude, frequency and phase difference of driving voltages, flow rate, flow velocity and flow direction of the pump can be changed. According to [32], in order to continuously pump liquid by multi-chamber piezoelectric pump, the driving voltage Ui
(i= 1–4) acting on CPUAi
should be set to
. The fluid in pump chamber flows out of fluid channel on both sides. Two active piezoelectric microfluidic valves are installed on left and right of pumping unit which consist of CPUA (CPUA3 and CPUA4 corresponding to the inlet and outlet valves, respectively) and annular boundary [31]. Because double CPUAs are used to provide the driving force for pumping unit, it can generate higher compression volume of pump chamber to improve output pressure, so as to improve flow rate of multi-chamber piezoelectric pump with active valves. From figure 1(d), multi-chamber piezoelectric pump realizes the function of pumping liquid by driving each chamber to work in turn. The working phase of multi-chamber piezoelectric pump can be divided into five stages, which include preparation stage (as shown in phase 1), fluid suction stage of inlet valve (as shown in phase 2), fluid suction stage of pumping unit (as shown in phase 3), fluid discharge stage of pumping unit (as shown in phase 4) and fluid discharge stage of outlet valve (as shown in phase 5). By allowing the multi-chamber piezoelectric pump to circulate in phases 2–5, the pump can achieve continuous pumping of liquid. By changing amplitude, frequency and phase difference of driving voltages, flow rate, flow velocity and flow direction of the pump can be changed. According to [32], in order to continuously pump liquid by multi-chamber piezoelectric pump, the driving voltage Ui
(i= 1–4) acting on CPUAi
should be set to


Figure 1. Principle and structural of multi-chamber piezoelectric pump based on pumping unit with double CPUAs (the direction of red arrow is the movement direction of CPUA): (a) structure schematic diagram, (b) pumping in of pumping unit, (c) pumping out of pumping unit and (d) working principle.
Download figure:
Standard image High-resolution imagewhere subscript i (=1–4) denotes number of ways;  ,
,  and
and  denote the amplitude, frequency and phase difference of driving voltage, respectively. In this paper, in order to ensure the uniform working state of pump in numerical simulation and experiment, the values of driving voltage parameters are set as
  =50 V,
  =50 Hz,
  to
to  are 0,
  ,
,  and
and  , respectively.
Figures 2(a) and (b) present three-dimensional exploded drawing and photograph of designed pump according to structural principle shown in figure 1, respectively. Geometrical parameters of pump are listed in table 1. From figure 2, pump is processed on PCB substrate by PCB process. Considering that double CPUAs are used in pumping unit, there are two working modes of pump, which include: (a) double CPUAs of pumping unit work at same frequency and phase at the same time, which is defined as working mode 1 and (b) only one of double CPUA of pumping unit works, which is defined as working mode 2.
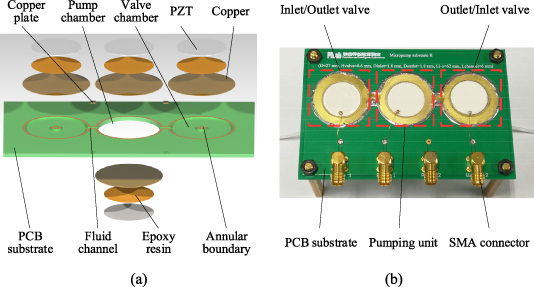
Figure 2. Multi-chamber piezoelectric pump based on pumping unit with double CPUAs: (a) three-dimensional exploded drawing and (b) photograph.
Download figure:
Standard image High-resolution imageTable 1. Geometrical parameters of multi-chamber piezoelectric pump (unit: mm).
| Number | Parameter | Symbol | Value |
|---|---|---|---|
| 1 | Radius of pump chamber (or base layer of CPUA) |

| 12.5 |
| 2 | Height of pump chamber |

| 1.6 |
| 3 | Radius of valve chamber |

| 12.5 |
| 4 | Height of valve chamber |

| 0.6 |
| 5 | Outer radius of annular boundary |

| 2 |
| 6 | Inner radius of annular boundary |

| 0.8 |
| 7 | Radius of PZT layer (or bonding layer) of CPUA |

| 10 |
| 8 | Thickness of PZT layer of CPUA |

| 0.14 |
| 9 | Thickness of bonding layer of CPUA |

| 0.02 |
| 10 | Thickness of base layer of CPUA |

| 0.22 |
| 11 | Length of inlet (or outlet) |

| 1 |
3. Theory
In this section, by analyzing the working principle of multi-chamber piezoelectric pump based on pumping unit with double CPUAs, mathematical models of volume change in chamber, output pressure of chamber and flow rate are established when the inlet and outlet pressures (i.e. back pressure) are 0 Pa. These models provide a theoretical basis for analyzing the relationship between flow rate of multi-chamber piezoelectric pump with active valves and parameters, including geometrical parameters and working conditions. In order to simplify the modeling process, the following assumptions are made: (a) when pumping unit suction fluid, as shown in figure 1(b), inlet valve is completely open and (b) when pumping unit discharges fluid, as shown in figure 1(c), inlet valve is completely closed.
3.1. Volume change in chamber
Taking pumping unit as an example, the mathematical model of volume change in pump chamber during its working process is established. Figures 3(a) and (b) illustrate the schematic diagram of pumping in and pumping out of pumping unit, respectively. According to figures 3(a) and (b), when pumping unit is working in pumping in and pumping out, convex outward and concave inward of CPUA result in volume change in pump chamber, which can be approximately as four cones, as shown in four regions of red dotted line in figure 3 and indicated by V1 to V4. Therefore, the volume change in pump chamber can be approximated to the sum of volume of four cones. Considering the structure and fixing diagram of CPUA in figure 3 as shown in figure 4(a), and the dynamic model under fluid-solid coupling as shown in figure 4(b), where the green and blue layers represent the reduced and actual deflections of CPUA when there is liquid in chamber, respectively. Therefore, the actual volume change of pump chamber can be expressed as

Figure 3. Volume change in pump chamber: (a) pumping in and (b) pumping out.
Download figure:
Standard image High-resolution image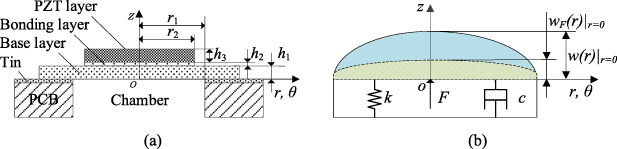
Figure 4. Model of CPUA installed with a fixed support edge: (a) structural schematic and (b) dynamic model under fluid-solid coupling.
Download figure:
Standard image High-resolution imagewhere  is the radius of pump chamber,
  is the radial distance from any point of CPUA to central axis,
  is deflection of CPUA at any radial
  without fluid in pump chamber,
  is reduced deflection of CPUA at any radial
  under fluid resistance, subscript
  represents the center position of CPUA. And
  and
and  can be expressed as

where  and
and  are the parameters to be determined,
  is the mass of CPUA,
  is the damping coefficient of fluid in pump chamber,
  is the elastic coefficient and
  is the fluid resistance, which can be expressed as

where ΔP is the pressure loss in pump chamber.
Based on the Rayleigh–Ritz method [34] and equation (3), energy equation of CPUA installed on chamber with fixed support edge can be expressed as
where  (
( ) is the maximum total strain energy of CPUA;
  (
( ) is the maximum total energy of CPUA;
  ,
,  and
and  are the strain energy of CPUA of base layer, bonding layer and PZT layer, respectively;
  ,
,  and
and  are the kinetic energy of CPUA of base layer, bonding layer and PZT layer, respectively.
According to figure 4, we have
where  and
and  are the radial and circumferential strain components of PZT layer, respectively;
  ,
,  and
and  are the radial stress components on microelement of base layer, bonding layer and PZT layer, respectively;
  ,
,  and
and  are the circumferential stress components on microelement of base layer, bonding layer and PZT layer, respectively;
  ,
,  and
and  are the thickness of base layer, bonding layer and PZT layer, respectively;
  ,
,  and
and  are the density of base layer, bonding layer and PZT layer, respectively;
  is the radius of bonding layer and PZT layer.
According to equations (3) and (6)–(8), we have
where  to
to  are the parameters after merging similar items. We have
where  to
to  can be expressed as

where  ,
,  and
and  are the elastic modulus of base layer, bonding layer and PZT layer, respectively;
  ,
,  and
and  are the Poisson's ratio of base layer, bonding layer and PZT layer, respectively;
  is the piezoelectric constant;
  is the reciprocal of dielectric constant;
  is the electromechanical coupling coefficient.
According to equations (3), (9) and (10), central deflection  of CPUA can be obtained. According to equation (4), based on the Galerkin method in weighted residual method [35] and combined with the structural characteristics of CPUA proposed in this paper, the reduced central deflection of CPUA under fluid resistance can be obtained as
where  is the first-order natural frequency of CPUA, which can be expressed as
where  .
.
Equations (2), (3) and (9)–(23) determine volume change model of pumping unit. Similarly, volume change model of outlet valve can be established.
3.2. Output pressure of chamber
According to figure 3(b), the schematic diagram of output pressure distribution in pump chamber can be obtained as shown in figure 5. From figure 5, in the process of liquid flowing from pump chamber to fluid channel 2, the flow area of fluid changes from large to small, which will result in local head loss of pressure. Meanwhile, frictional head loss of pressure will be generated when liquid flows in fluid channel 2. Under combined action of this two head losses of pressure, the pressure will change in pump chamber. According to [7] and combined with the structural characteristics of pumping unit proposed in this paper, local head loss of pump chamber can be obtained as

Figure 5. Schematic diagram of output pressure distribution in pump chamber.
Download figure:
Standard image High-resolution imagewhere  is the fluid density,
  is the change rate of pump chamber volume,
  is the cross-sectional area of flow channel,
  is the maximum cross-sectional area of the pump chamber and
  is the local damping coefficient in this process.
In the same way, the frictional head loss of pressure in fluid channel 2 can be expressed as
where  is the friction damping coefficient in fluid channel 2, which can be expressed as

where  is the dynamic viscosity,
  is length of fluid channel 2 and
  is the hydraulic diameter of fluid in fluid channel 2.
Thus, pressure change of pump chamber can be expressed as

where  is the pressure in pump chamber,
  is the output pressure of pump chamber.
According to relationship between pressure change and volume change in pump chamber [5] and combined with the structural characteristics of pumping unit proposed in this paper, pressure  in pump chamber under fluid-solid coupling is obtained as
where  is the compression coefficient of fluid and
  is the volume of pump chamber when CPUA does not work.
According to equations (24)–(28), output pressure of pumping unit can be obtained as
Similarly, output pressure of outlet valve can be obtained.
3.3. Flow rate model
Flow rate modeling of multi-chamber piezoelectric pump is carried out in two cases: (a) modeling flow rate under action of pumping unit, as shown in figure 6(a), and (b) modeling flow rate under action of outlet valve, as shown in figure 6(b). Case 1 models flow of fluid first from flow channel 2 into outlet valve chamber, then through annular boundary, and finally out from outlet. Case 2 models flow of fluid from outlet valve chamber to annular boundary and then out from outlet. By combining flow rate model of these two cases, complete flow rate model of multi-chamber piezoelectric pump can be obtained.
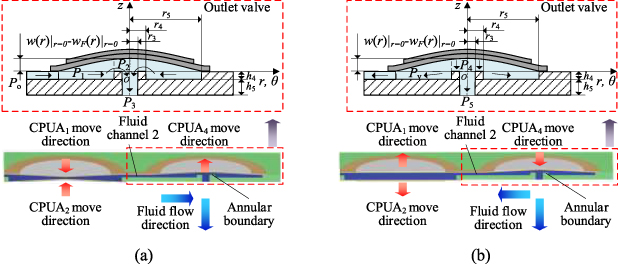
Figure 6. Fluid flow in outlet valve chamber: (a) outlet valve discharge under action of pumping unit and (b) outlet valve discharge under action of outlet valve.
Download figure:
Standard image High-resolution image(a) Case 1
From figure 6(a), there are two local head losses of pressure in the whole flow process, which are: (a) local head loss of pressure during liquid flow from the end of fluid channel 2 to outlet valve chamber, as shown in figure 7, and (b) the local head loss of pressure during liquid flow from outlet valve chamber to outlet, as shown in figure 8. These two processes are modeled separately.

Figure 7. Schematic diagram of pressure distribution in outlet valve chamber.
Download figure:
Standard image High-resolution image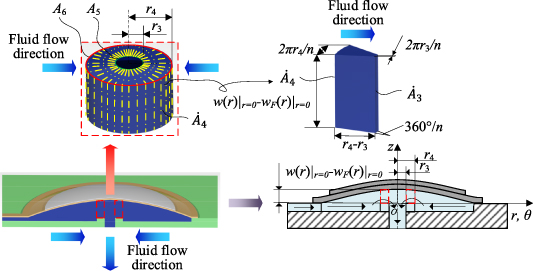
Figure 8. Fluid flow diagram of annular boundary.
Download figure:
Standard image High-resolution imageFrom figure 7, when liquid flows from the end of flow channel 2 to outlet valve chamber, there is a change in flow area from small to large, and local head loss of pressure will occur in this process, which can be expressed as
where  is the pressure in outlet valve chamber under action of pumping unit,
  is the local damping coefficient in this process and
  is the maximum cross-sectional region of outlet valve chamber.
From figure 8, when liquid flows from outlet valve chamber to outlet, there is a change in flow area from large to small, and local head loss of pressure will also occur in this process, which is as shown in the region of red dotted line in figure 8. The liquid in this region flows from a cylindrical surface with radius of r4 to that of r3. Ideally, since the flow process and state are symmetrical around the center of circle, the flow process and state at any position on the cylindrical surface with any radius of r in this region are the same, where r3
⩽ r ⩽ r4. Therefore, the liquid in this region can be divided into n microelements according to yellow dash-dotted line, as the 3D insert shown in the left side of the top of figure 8. Particularly, when n tends to infinity, the nozzle angle of nozzle channel tends to 0°. If so, it is impossible to model the flow process and state of liquid in this region by using the flow theory of liquid in nozzle channel. Therefore, n must be a finite integer, and the larger n is, the higher the accuracy of the model is. One of the microelements is extracted to analyze, as the 3D insert shown in the right side of the top of figure 8. The outer arc length of the microelement is  , the inner arc length is
  , and the angle between two walls is
  , which is the nozzle angle of nozzle channel. Since the flow process and state of each microelement are same as that of the liquid in a nozzle channel, each microelement can be approximately equivalent to a nozzle channel. Therefore, the local head loss of the pressure in this process can be expressed as
where  is the pressure in the red dotted line region under the action of pumping unit;
  is the change rate of chamber volume of the outlet valve when its CUPA moves upward;
  and
and  are the side areas of inner and outer cylinders in the region of red dotted line, respectively;
  and
and  are the areas of the inner and outer curved surfaces of the microelement in the region of red dotted line, respectively;
  is the local damping coefficient of nozzle channel when the nozzle angle is
  ;
;  is the local damping coefficient of nozzle channel in this process.
Since the outlet is a cylindrical pipe, by using the flow rate formulation of circular pipe, the flow rate of outlet valve chamber under action of pumping unit can be obtained as
where  is the radius of outlet,
  is the height of valve chamber and
  is the length of outlet.
And considering that the pressure of outlet is atmospheric pressure ( =0), according to equations (30)–(32), flow rate of pump under action of pumping unit can be expressed as
(b) Case 2
From figure 6(b), there are two head losses of pressure for this case, which are local head loss of pressure in the process of flowing from region of red dotted line to outlet, as shown in figure 8, and frictional head loss of pressure in the process of flowing in outlet.
According to the principle in section 3.2, the pressure at region of red dotted line, as shown in figure 8, under action of outlet valve can be expressed as
where  is the change rate of red dotted line region when CPUA of outlet valve moves downward;
  and
and  are the cross-sectional area of outlet and cylindrical gap, respectively;
  is the local damping coefficient in this process;
  is the volume of outlet valve chamber when CPUA does not work.
Thus, flow rate of pump under action of outlet valve can be expressed as
According to equations (33)–(35), flow rate model of pump can be obtained as
4. Numerical simulation and analysis
In numerical simulation, the materials of CPUA from bottom to top are copper, epoxy resin and PZT-5 H, respectively. The pumped liquid is water. Four-way driving voltages are given by equation (1), geometrical parameters of the pump are listed in table 1 and material parameters of the pump are listed in table 2. In numerical simulation of effect of chamber radius on output pressure and flow rate of multi-chamber piezoelectric pump, the range of geometrical parameters of CPUA should be determined because the geometrical parameters of CPUA will change with the change of chamber radius. According to [36], when the thickness of PZT layer is optimal, the optimum variation range of the ratio of radius of PZT layer to radius of pump chamber ( ) is from 0.81 to 1.0. Therefore,
  should be selected within the above range or as close to it as possible. In this paper, it is set to 0.8.
Table 2. Material parameters of multi-chamber piezoelectric pump.
| Number | Parameter | Symbol | Value |
|---|---|---|---|
| 1 | Density of base layer (kg m−3) |

| 8700 |
| 2 | Density of bonding layer (kg m−3) |

| 7000 |
| 3 | Density of PZT layer (kg m−3) |

| 7500 |
| 4 | Elastic modulus of base layer (GPa) |

| 108 |
| 5 | Elastic modulus of bonding layer (GPa) |

| 5.17 |
| 6 | Elastic modulus of PZT layer (GPa) |

| 56 |
| 7 | Poisson's ratio of base layer |

| 0.38 |
| 8 | Poisson's ratio of bonding layer |

| 0.3 |
| 9 | Poisson's ratio of PZT layer |

| 0.36 |
| 10 | Piezoelectric constant (V·m N−1) |

| 3.32 × 10⁻³ |
| 11 | Reciprocal of dielectric constant (m F−1) |

| 8.4 × 10⁷ |
Figure 9(a) illustrates effect of amplitude of driving voltage on output pressure and flow rate. Output pressure and flow rate are positively correlated with  . When
  is 50 V, output pressure of pumping unit and pump reaches the maximum, which are 1447.83 Pa and 1851.26 Pa, respectively. Their respective flow rates have also reached the maximum, which are 669.13 μl min−1 and 855.46 μl min−1, respectively. According to equations (2), (3), (9), (10), (29) and (36), when other conditions remain unchanged, both parameters A and B in equations (9) and (10) are increased with increasing
  , which leads to increase of
  in equation (3). Then
  in equation (2) increases. Finally, both flow rate of pumping unit and
  in equation (29) increase. Similarly, it can be concluded that both flow rate and output pressure of outlet valve increase with increasing
  . Under the combined action of pumping unit and outlet valve, both output pressure of the multi-chamber piezoelectric pump and
  in equation (36) increase. Figure 9(b) illustrates effect of frequency of driving voltage on output pressure and flow rate. Output pressure of pumping unit and pump do not increase monotonously, both of them firstly increase and then decrease with increasing
  , so does their flow rate. When
  is 60 Hz, output pressure of pumping unit and pump reaches the maximum, which are 1457.6 Pa and 1862.48 Pa, respectively. Their respective flow rates have also reached the maximum, which are 675.03 μl min−1 and 862.54 μl min−1, respectively. According to equations (2) and (22), when other conditions remain unchanged,
  in equation (22) increases with increasing
  , resulting in that
  in equation (2) decreases. Similarly, it can be concluded that the actual volume change of the outlet valve chamber decreases with increasing
  . Meanwhile, the cumulative flow rate increases with increasing
  . When volume change in chamber decreases lower than increase of cumulative flow rate, the total flow rate of pump shows an upward trend. On the contrary, the total flow rate of pump shows a downward trend. When the velocity of volume change in chamber decreases and the velocity of cumulative flow rate increases are at a certain critical value, the total flow rate of pump is the largest, and the corresponding
  is the best working frequency. Figure 9(c) presents effect of chamber height on output pressure and flow rate. Output pressure and flow rate are negatively correlated with chamber height. According to equation (36), when the central deflection of CPUA is constant, the summation of
  and
and  increases with increasing
  and
and  , resulting in that
  in equation (36) increases. Figure 9(d) shows effect of chamber radius on output pressure and flow rate. Output pressure and flow rate are positively correlated with chamber radius. According to equations (2), (29) and (36), when the central deflection of CPUA is constant,
  in equation (2) increases with increasing
  , resulting in that both the flow rate of pumping unit and
  in equation (29) increase. Similarly, it can be concluded that the increase of
  results in that both the flow rate and output pressure of outlet valve increase. Under the combined action of pumping unit and outlet valve, both output pressure of multi-chamber piezoelectric pump and
  in equation (36) increase. Figures 9(e) and (f) show effect of inner and outer radius of annular boundary on flow rate obtained by numerical simulation, respectively. When outer radius of annular boundary remains unchanged, flow rate is positively correlated with inner radius of annular boundary. When inner radius of annular boundary remains unchanged, flow rate is negatively correlated with outer radius of annular boundary. According to equations (34)–(36), when
  gradually approaches to
  ,
,  in equation (34) increases with increasing the value of
  . Therefore, more pressure will be used for liquid transportation, resulting in the increase of
  in equation (35) and Q in equation (36). In the limit case, when
  , annular boundary and even active valve disappear, flow rate of pump reaches the maximum, but control accuracy and stop characteristics of flow will decrease. Therefore, in actual structural design, geometrical parameters of annular boundary should be determined according to specific conditions.

Figure 9. Effect of geometrical parameters of the pump on its output pressure and flow rate obtained by numerical simulation: (a) amplitude of driving voltage, (b) frequency of driving voltage, (c) chamber height, (d) chamber radius, (e) inner radius of annular boundary and (f) outer radius of annular boundary.
Download figure:
Standard image High-resolution imageThrough numerical simulation, it can be seen that flow rate model of multi-chamber piezoelectric pump with active valves established in this paper can well describe the relationship between flow rate of multi-chamber piezoelectric pump with active valves and its parameters, including geometrical parameters and working conditions.
5. Experiment and analysis
5.1. Experimental setup
Figures 10(a) and (b) illustrate the schematic diagram and photograph of experimental setup which is mainly composed of flow rate measurement system and controller system. The controller system, which applied driving voltage to multi-chamber piezoelectric pump as shown in figure 2(b), is mainly composed of a multi-channel piezoelectric ceramic power amplifier (model: AMP-304.03.A.150, DH Science & Technology Co. Ltd, China) and a multi-channel signal generator (model: MFG 2260MRA, Good Will Instrument Co. Ltd, China). The flow rate measurement system, which is used to measure flow rate of pump, is mainly composed of a flow sensor (model: MFS 4, Elveflow, France), a measuring cylinder and a host computer. In experiment, the pumped fluid is water and the effect of geometrical parameters and working conditions under two working modes of the pump on flow rates are tested, respectively. The four-way driving voltages U1 to U4 acting on CPUA1 to CPUA4 can be set by equation (1). Under the action of U1 to U4, the inlet valve, pumping unit and outlet valve work in turn to realize the flow process of liquid from inlet to outlet. The parameters of U1 to U4, which are listed in table 3, are divided into two cases: (a) when testing effect of a certain parameter of driving voltages on flow rate, only a variation range is set for this parameter, and the other parameters of driving voltages are given in table 3; (b) in other cases, all parameters of U1 to U4 are given in table 3.

Figure 10. Experimental setup: (a) schematic diagram and (b) photograph.
Download figure:
Standard image High-resolution imageTable 3. Parameter settings of four-way driving voltages.
| Number | Parameter | Symbol | Value |
|---|---|---|---|
| 1 | Amplitude of U1 (V) |

| 50 |
| 2 | Amplitude of U2 (V) |

| 50 |
| 3 | Amplitude of U3 (V) |

| 50 |
| 4 | Amplitude of U4(V) |

| 50 |
| 5 | Frequency of U1 (Hz) |

| 50 |
| 6 | Frequency of U2 (Hz) |

| 50 |
| 7 | Frequency of U3 (Hz) |

| 50 |
| 8 | Frequency of U4 (Hz) |

| 50 |
| 9 | Phase difference of U1 |

| 0 |
| 10 | Phase difference of U2 |

|

|
| 11 | Phase difference of U3 |

|

|
| 12 | Phase difference of U4 |

|

|
5.2. Experimental results and discussion
5.2.1. Effect of geometrical parameters on flow rate.
Figure 11(a) shows effect of inner radius of annular boundary on flow rate. Flow rate is positively correlated with inner radius of annular boundary. The explanation of this phenomenon is the same as that in figure 9(e). When inner radius of annular boundary is 0.8 mm, the maximum experimental flow rate is 835 μl min−1. The maximum relative error between experimental measurement and numerical simulation is 5.08%. Figure 11(b) shows effect of outer radius of annular boundary on flow rate. Flow rate is negatively correlated with outer radius of annular boundary. The explanation of this phenomenon is the same as that in figure 9(f). When outer radius of annular boundary is 2.0 mm, the maximum experimental flow rate is 834 μl min−1. The maximum relative error between experimental measurement and numerical simulation is 2.4%. Figure 11(c) shows effect of pump chamber height on flow rate. Flow rate is negatively correlated with pump chamber height. The explanation of this phenomenon is the same as that in figure 9(c). When pump chamber height is 1.6 mm, the maximum experimental flow rate is 833 μl min−1. The maximum relative error between experimental measurement and numerical simulation is 5.39%. Figure 11(d) shows effect of valve chamber height on flow rate. Flow rate is negatively correlated with valve chamber height. The explanation of this phenomenon is the same as that in figure 9(c). When valve chamber height is 0.6 mm, the maximum experimental flow rate is 830 μl min−1. The maximum relative error between experimental measurement and numerical simulation is 5.56%.
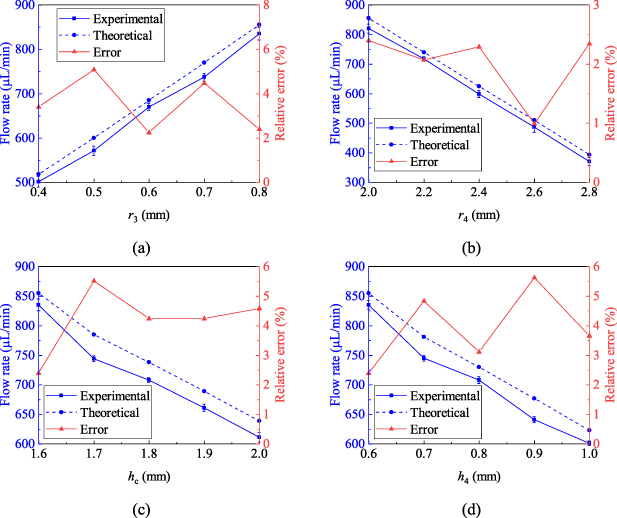
Figure 11. Effect of geometrical parameters on flow rate: (a) inner radius of annular boundary, (b) outer radius of annular boundary, (c) height of pump chamber and (d) height of valve chamber.
Download figure:
Standard image High-resolution imageThrough the experiment of effect of geometrical parameters of multi-chamber piezoelectric pump with active valves on flow rate, it is proved that the established flow rate model can well describe the relationship between geometrical parameters and flow rate.
5.2.2. Effect of working conditions on flow rate.
Figure 12 illustrates relationship between flow rate of the pump and back pressure. Flow rate decreases with increasing back pressure. When pump works in working modes 1 and 2, the maximum back pressure are 1.6 kPa and 0.74 kPa, respectively. The results show that the pump can effectively increase the back pressure when working in working mode 1.
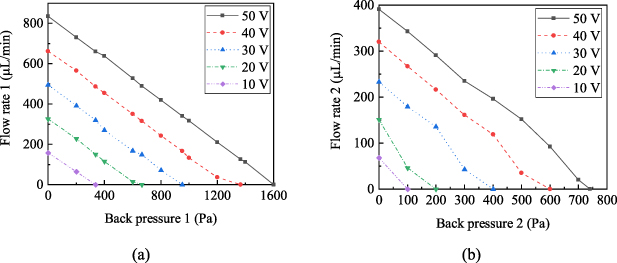
Figure 12. Effect of back pressure on flow rate of the pump: (a) working mode 1 and (b) working mode 2.
Download figure:
Standard image High-resolution imageFigure 13 shows relationship between flow rate of the pump and phase difference of four-way driving voltages. In forward pumping, when  , flow rate increases with increasing
  ; when
  , flow rate decreases with increasing
  . The optimal phase difference of forward pumping is
  . The maximum values of forward flow rate under working mode 1 and 2 are 835 μl min−1 and 391 μl min−1, respectively. In backward pumping, flow rate changes the same as that of forward pumping. The optimal phase difference of backward pumping is −
 , and the maximum values of backward flow rate under working modes 1 and 2 are −833 μl min−1 and −386 μl min−1, respectively. Moreover, the maximum values of flow rate differential of forward and backward pumping under working mode 1 and 2 are 17 μl min−1 and 15 μl min−1, respectively. The results show that the pump has excellent structure symmetry and working mode symmetry, which can well realize the bidirectionally pumping.
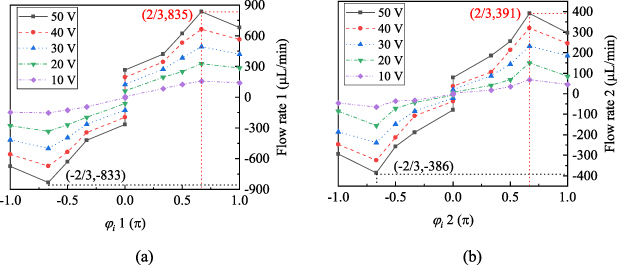
Figure 13. Effect of phase difference of four-way driving voltages on flow rate of the pump: (a) working mode 1 and (b) working mode 2.
Download figure:
Standard image High-resolution imageFigure 14 show curves of three sets of experimental measurement on flow rate of the pump under same conditions. When amplitude of four-way driving voltages change 0.1 V, the average variation of flow rate under working modes 1 and 2 are 0.903 μl min−1 and 0.379 μl min−1, respectively. Moreover, the standard deviation of repeatability accuracy are 0.793 and 0.824, respectively. The results show that the pump has high control accuracy of flow ate and repeatability accuracy.
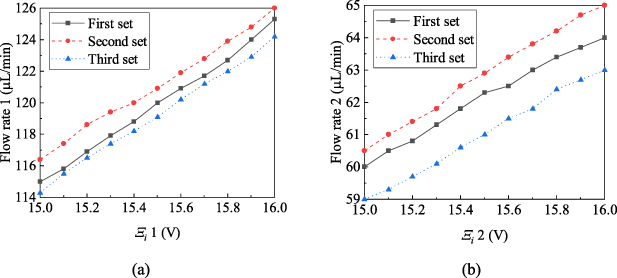
Figure 14. Control accuracy of flow rate and the repeatability accuracy of the pump obtained by experimental measurement: (a) working mode 1 and (b) working mode 2.
Download figure:
Standard image High-resolution imageFigure 15 illustrates relationship between flow rate of the pump and frequency of four-way driving voltages. When  50, flow rate increases with increasing
  ; when 50
 , flow rate decreases with increasing
  . The explanation of this phenomenon is the same as that in figure 9(b). The optimum frequency of multi-chamber piezoelectric pump is 50 Hz, and the maximum values of flow rate under working modes 1 and 2 are 835 μl min−1 and 391 μl min−1, respectively. Moreover, for working modes 1 and 2, the maximum relative error between the flow rate obtained by experimental measurement and that by numerical simulation are 7.59% and 10.55%, respectively. The results show that the pump can effectively increase flow rate when it works in working mode 1.
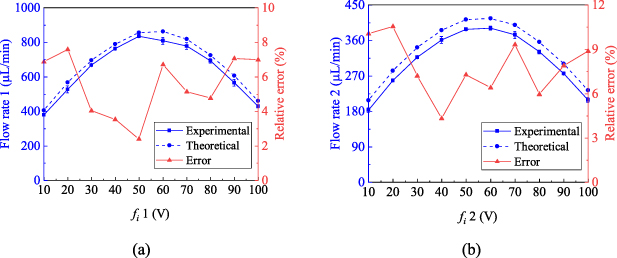
Figure 15. Effect of frequency of four-way driving voltages on flow rate of the pump obtained by experimental measurement and numerical simulation: (a) working mode 1 and (b) working mode 2.
Download figure:
Standard image High-resolution imageFigure 16 show curve of experimental measurement and numerical simulation of relationship between flow rate of the pump and amplitude of four-way driving voltages. The relative error curve between flow rates obtained by numerical simulation and that by experimental measurement is also depicted in figure 16. Flow rate increase with increasing  . The explanation of this phenomenon is the same as that in figure 9(a). When
  is 50 V, the flow rates under working modes 1 and 2 reach their respective maximum values that are 835 μl min−1 and 391 μl min−1, respectively. Moreover, for working modes 1 and 2, the maximum relative error between the flow rate obtained by experimental measurement and that by numerical simulation are 8.23% and 10.87%, respectively. The results show that the flow rate model of multi-chamber piezoelectric pump can accurately predict its flow rate.

Figure 16. Effect of amplitude of four-way driving voltages on flow rate of the pump obtained by experimental measurement and numerical simulation: (a) working mode 1 and (b) working mode 2.
Download figure:
Standard image High-resolution image
Through the experiment of effect of working conditions of multi-chamber piezoelectric pump with active valves on flow rate, it is proved that the established flow rate model can well describe the relationship between working conditions and flow rate.
6. Conclusions
In order to improve flow rate of multi-chamber piezoelectric pump with active valves, principle and structure of multi-chamber piezoelectric pump based on pumping unit with double CPUAs is proposed. Flow rate model is established to numerically simulate characteristics of the pump. Moreover, the pump is tested and analyzed. The results show that:
- (a)Proposed principle and structure of multi-chamber piezoelectric pump based on pumping unit with double CPUAs can effectively improve output pressure, so as to improve flow rate. The maximum output pressure, forward and backward flow rate are respectively 1.6 kPa, 835 μl min−1 and −833 μl min−1 when double CPUAs of pumping unit work in same frequency and phase at same time. Compared with only one CPUA of pumping unit works, the measured values are increased by 53.75%, 53.17% and 53.66%, respectively.
- (b)The manufactured pump can bidirectionally pump fluid with high control accuracy and stop characteristics. Average flow rate changed 0.903 μl min−1 for every 0.1 V change of driving voltage. Moreover, the maximum value of flow rate differential of forward and backward pumping is 17 μl min−1.
- (c)The established flow rate model can accurately describe the relationship between the flow rate of pump and its parameters, including structural parameters and working conditions, which will be beneficial to design and optimize multi-chamber piezoelectric pumps with active valves. The maximum relative error between numerical simulation and experimental measurement is only 8.23%.
- (d)The pump has structural symmetry and can be manufactured by process compatible with PCB process with low cost.
Due to characteristics of high output pressure, large flow rate, high control accuracy of flow rate, high stop characteristics of flow and flexible flow direction control, the realized multi-chamber piezoelectric pump has potential applications in complex microfluidic fields such as biochemical analysis, drug delivery and chip cooling.
Acknowledgments
This work is supported by the Advance Research Project on Civil Space Technology of State Administration of Science, Technology and Industry for National Defense, China (Grant No. D020210), the National Natural Science Foundation of China (Grant No. 51675070), the Graduate Scientific Research and Innovation Foundation of Chongqing, China (Grant No. CYB20060) and the LPMT, CAEP (Grant No. 2015-01-001).
Data availability statement
All data that support the findings of this study are included within the article (and any supplementary files).