
Abstract
We report tuning of the moduli and surface roughness of magnetorheological elastomers (MREs) by varying applied magnetic field. Ultrasoft MREs are fabricated using a physiologically relevant commercial polymer, SylgardTM 527, and carbonyl iron powder (CIP). We found that the shear storage modulus, Young's modulus, and root-mean-square surface roughness are increased by ∼41×, ∼11×, and ∼11×, respectively, when subjected to a magnetic field strength of 95.5 kA m−1. Single fit parameter equations are presented that capture the tunability of the moduli and surface roughness as a function of CIP volume fraction and magnetic field strength. These magnetic field-induced changes in the mechanical moduli and surface roughness of MREs are key parameters for biological applications.
Export citation and abstract BibTeX RIS
1. Introduction
Magnetorheological elastomers (MREs) are a type of heterogeneous composite fabricated using magnetically soft particles (e.g. carbonyl iron powder (CIP)) embedded within an elastomeric matrix. The unique advantage of MREs is their ability to rapidly and reversibly stiffen or soften with the application of a magnetic field [1, 2]. Work on MREs has spanned two decades but only recently have these materials been applied to the field of biology. While the mechanical and magnetic properties of rubber-like (E ∼ 1MPa) MREs have been previously reported [3–7] and still remain as an area of active investigation [8–14], the characterization of ultrasoft (E ∼ 3kPa) poly-dimethylsiloxane (PDMS)-based MREs for biological applications has only recently been explored [15]. The usage of ultrasoft PDMS has several advantages, such as commercial availability as a two-part resin (liquid state) that facilitates easy suspension of magnetic particles, excellent biocompatibility, can vulcanize at room temperature, highly deformable and insensitive to variations in temperature [2]. It is of great interest to develop ultrasoft materials to temporally manipulate matrix elasticity that better mimics in vivo conditions for not only a deeper understanding but also to develop strategies to control dynamic biological processes (e.g. development, fibrosis, cancer). Additionally, being able to conditions cells and tissues on the same substrate allow for single cell tracking of behavioral response.
Recently, several in vitro platforms have been developed to mimic the changing extracellular matrix (ECM) stiffness, which has been shown to be a key modulator of cell mechanobiology. These efforts made use of external stimuli such as application of light [16], pH modifications [17, 18], temperature changes [19, 20], and addition of biomolecules [21–23] as mechanical effectors. However, these approaches are often limited to irreversible or unidirectional changes in the material stiffness and long response time for appreciable change (∼minutes to hours). On the contrary, ultrasoft PDMS-based MREs tuneable by magnetic field are more ideal active materials for in vitro systems because their mechanical properties can be quickly and bi-directionally changed over a physiological range with precise control over the rate and magnitude [24].
The utilization of ultrasoft PDMS-based MREs for biological applications requires quantification of their magnetic field-dependent mechanical tunability. In this work, we characterized the shear and elastic moduli as well as surface roughness of ultrasoft PDMS-based MREs at the nano-, micro- and macro- scales as a function of iron volume fraction and applied magnetic field strength. We further developed single fit parameter equations to describe the observed change in the moduli and surface roughness as a function of iron volume fraction and applied magnetic field strength. In addition, we discuss the application of ultrasoft PDMS-based MREs to mimic dynamic changes in the ECM for a wide range of biological systems.
2. Methods
2.1. Fabrication of ultrasoft PDMS-based magnetorheological elastomers
PDMS-based MREs were fabricated using SylgardTM 527 elastomer (Dow Corning) and CIP (spherical, 3.9–5.2 μm mean diameter). SylgardTM 527 was first mixed in equal weights of part A and part B and then thoroughly mixed with CIP (Chemical Store Inc.) at CIP volume fractions of  = 0%, 9%, 17%, and 23%, and then poured to a thickness of ∼5 mm into the culture dishes (35 mm in diameter). The samples used for shear rheology were fabricated by pouring the same mixture into 35 mm dishes containing a Teflon mold to decrease the diameter to 20 mm in order to fit the rheometry measurement requirement. The mixtures were degassed for 5 min to remove air bubbles introduced during the preparation process, placed on a hot plate at 60 °C for 4 h, and then left at room temperature for 24 h to ensure fully cross-linking of the polymers.
2.2. Application of magnetic field
Figure 1 shows the experimental set up, consisting of an electromagnet (from GMW), soft iron core and a neodymium iron boride (NdFeB) magnet (from CMS Magnets Inc.) for applying magnetic field during rheology, indentation and interferometry studies. The GMW electromagnet was placed on the measurement stage of the instrument. The iron core, 31.75 mm in diameter and 19.05 mm in height, was used to separate the samples from the NdFeB magnet, magnify the field strength and improve the field uniformity at the sample. The cylindrical N45 NdFeB magnet was 31.75 mm in diameter and 6.35 mm in height. The overall magnetic field applied at the sample is the vector sum of the fields from the electromagnet and the NdFeB magnet, which were also magnified by the iron core. For example, to achieve zero magnetic field at the sample, the current through the electromagnet was set so the magnetic field generated by the electromagnet cancelled that from the permanent magnet. For all tests, the magnetic field strength was set from 0 to 95.5 kA m−1 with steps of 15.9 kA m−1 and measured by a Lakeshore®-410 gaussmeter. The electromagnet was cooled by an industrial chiller (CW-3000) and powered by a Volteq power supply. To reduce vibrational noise in the measurements, the chiller was shut off as the test proceeded and was turned back on in between tests. Heat generated by the electromagnet increased the sample temperature by <2 °C during the measurements.
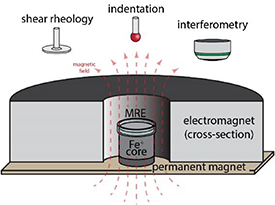
Figure 1. Schematic of the magnetic field setup for shear rheology, indentation and interferometry measurements. The MRE sample was placed within the annulus of the electromagnet on top of a 31.75 mm diameter × 19.05 mm thick iron core attached to a permanent magnet.
Download figure:
Standard image High-resolution image2.3. Shear rheology
Magnetic field-dependent oscillatory rheology was carried out with a Kinexus lab+ rheometer (Malvern Instruments) in strain-controlled mode fitted with the magnetic field setup described above. The shear storage (G') and loss (G'') moduli were measured as a function of the frequency, strain, and magnetic field for elastomers of three different CIP volume fractions ( ). First, a frequency sweep from f = 10 to 0.01 Hz at
  was carried out, followed by shear strain sweeps from
  at f = 1 Hz at six different fields from H = 0–95.5 kA m−1. The MREs were naturally sticky, and slip was thus avoided.
2.4. Compression indentation
Indentations on MREs were performed on a custom micro-indenter similar to that described by Rennie et al [25] and Schulze et al [26]. To measure the MRE response to compressive loads we brought a spherical indenter into contact of the MRE surface up to a target load of 5 mN at 50 µm s−1 and then immediately retract the indenter at the same rate. All experiments were conducted with the MRE inside the annulus of the electromagnet (figure 1). Ten indentations were made at each magnetic field strength (0–95.5 in 15.9 kA m−1 steps). This protocol was followed for each MRE sample.
Indentation force and displacement were measured by a capacitance probe (Capacitec) and optical, linear encoder (Renishaw). The capacitance probe has a resolution of 25 µm V−1 and measures the deflection of a calibrated titanium cantilever. The normal stiffness of the cantilever is, knormal = 1385.9 N m−1. A spherical, 2 mm radius, ruby probe was attached to a 5 mm long cylindrical aluminum rod and was used for all indentations. The probes and encoder were wired into a data acquisition device (National Instruments, USB-6343) which communicated with a custom programmed code (Matlab). The code used Matlab's Appdesigner software as well as µManager Java libraries to control the instrument.
2.5. White light interferometry
Magnetic field-dependent surface roughness measurements were conducted on a scanning white light interferometer (Zygo, NT6100). These measurements were made using the same MRE and EM configuration as the rheology and indentation. Surface scans were acquired at each magnetic field strength interval between 0 and 95.5 kA m−1 with a 20× objective set at 0.5× optical zoom (10× magnification) over a ∼500 × ∼700 µm rectangle. A planar shift was applied to the data and average (Ra) and root-mean-squared (Rq) roughness was recorded at each field strength.
3. Results
3.1. Dependence of shear modulus on magnetic field
Figure 2 shows the bulk rheological response measured by the rheometer as a function of magnetic field strength, frequency and strain. For all magnetic field strengths and a broad range of frequencies, the ultrasoft PDMS-based MREs behave as a chemically cross-linked gel. The shear storage modulus measured in the linear viscoelastic regime ( ), increased quadratically with increasing magnetic field strength and CIP volume fraction up to ∼41× for
  (figure 2(A)), which is an order of magnitude larger than the increase in shear modulus
  reported for isotropic rubber-like MREs subjected to the same range of magnetic field strengths [1, 2]. There is a slight frequency dependence in the viscoelastic moduli over the frequency range of about three orders of magnitude (figure 2(B)). Shear strain amplitude sweeps from
  reveal a weakening of the shear storage and loss moduli. (figure 2(C)). For the highest CIP volume fraction and largest magnetic field strength, both moduli decrease by ∼1/3 (G' ∼ 100→30kPa, G'' ∼ 13→4kPa). While collagen and other biopolymer networks have been shown to be strain-stiffening [27], a less often reported deformation mechanism is strain-weakening [28]. Ultrasoft PDMS-based MREs weaken as the strain increases and this effect is stronger at higher magnetic fields.

Figure 2. Characterization of the magnetic field-dependent storage (solid) and loss (empty) moduli by shear rheology. (A) Dependence of shear moduli on the magnetic field strength for  subjected to 2% shear strain. (B) Frequency dependence of the shear moduli for
  at four different magnetic field strengths. (C) Strain dependence of the shear moduli for
  at four different magnetic field strengths.
Download figure:
Standard image High-resolution image3.2. Dependence of elastic modulus on magnetic field
Figure 3 shows the compressive indentation measurements, as described in section 2.4, for  at various magnetic field strengths. Figures 3(A) and (B) compare the indentation force F as a function of the compressive displacement for
  and
and  . For
. For  , the force vs indentation depth curve and measured elastic modulus were unaffected by the strength of the magnetic field (figure 3(A)), as expected. However, for MREs containing
  , the slope of the force vs indentation curve increases monotonically with increasing magnetic field strength (figure 3(B)). The elastic moduli are calculated by fitting the unloading portion of the indentation force vs depth curves with the JKR adhesive contact model [29]

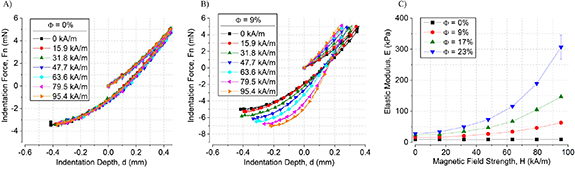
Figure 3. Force vs. indentation depth curves for (A)  and (B)
  . (C) The modulus values from the JKR—fit as a function of magnetic field strength for
  .
.
Download figure:
Standard image High-resolution imagewhere R is the radius of the indenter while the elastic modulus, E, and work of adhesion, Δγ, are the fit parameters. The depth of indentation into the material, δ, is taken as the difference between the stage displacement, z, and the cantilever deflection, δc, where  . Since this contact model accounts for adhesion, the unloading portion of the curve, which is most affected by adhesion, was used for the fit. Figure 3(C) shows the obtained elastic moduli as a function of the magnetic field strength for
  . The elastic modulus increased quadratically with increasing magnetic field strength and CIP volume fraction up to ∼11× increase for
  , which is an order of magnitude larger than the increase in elastic modulus
  reported for rubber-like MREs subjected to the same range of magnetic field strengths [1, 2].
3.3. Dependence of roughness on magnetic field
Figure 4 shows the results of the surface roughness measurements with white light interferometry. The root-mean-square roughness, Rq, was used as a quantitative measure of the roughness across the entire surface. Surface profiles for  at 95.5 kA m−1 (figure 4(A)) show an increase in Rq at both large and small length scales. Figure 4(B) shows the surface profiles for
  at various magnetic field strengths. Rq was found to increase monotonically with magnetic field strength and
  , as shown in figure 4(C). Interestingly, Rq also increased quadratically with increasing magnetic field strengths up to ∼7× increase for
  .
.
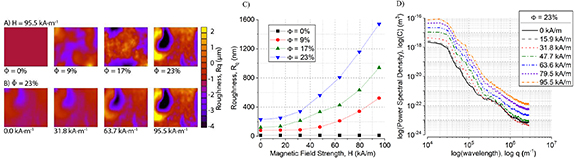
Figure 4. Surface characterization by white light interferometry. (A) Surface profiles at H = 95.5 kA m−1 for Φ = 0%, 9%, 17%, 23%. (B) Surface profiles for  at four magnetic field strengths. (C) Root-mean-square roughness of the MRE surface as a function of magnetic field strength for
  . (D) 2D power spectral density of
  for increasing magnetic field strength.
Download figure:
Standard image High-resolution imageWe used a 2D power spectral density (C(q), PSD) analysis to study the evolution of the surface topography with magnetic field strength. We follow the methods of Dash et al [30] and Jacobs et al [31] to obtain the 2D-PSD of the measured surfaces given by equation (2),

where L [2] is the scanned area of length L, q is the spatial frequency, and z is the height. Figure 4(D) gives the PSD curves for the  sample for all magnetic field strength values. We consider two parameters: (a) the plateau height at low wavelengths, which is related to the average height of the rough surfaces; and (b) the slope of the tail of the PSD curve which gives an idea of the fractal dimension of the roughness. For increasing magnetic field strength, the plateau height increases monotonically while maintaining a similar slope as q increases.
Finally, we examine the Hurst exponent (h) to determine the degree of self-affinity of each surface. The Hurst exponent was obtained by fitting a power law to the tail of the PSD to equation (3) [32, 33]:

The PSDs for the  sample (figure 4(D)) have nearly constant h (h = 0.97 ± 0.01) which signifies that no particular spatial wavelength is amplified by applied magnetic field or particle inclusion. Combining this knowledge with the fact that the amplitude of Rq increases with magnetic field, we have determined that the topography of the surface remains similar only increasing in magnitude with magnetic field strength.
3.4. Single fit parameter equations
The inclusion of CIP increases the zero-field shear modulus and RMS surface roughness of the MREs approximately by the square of the CIP volume fraction, as shown in figures 5(A) and (B) respectively. The dependences of the zero-field (H = 0) shear storage moduli ( ) and RMS surface roughness
  on the CIP volume fraction (
 ) can be fit by the following equations,


Figure 5. The effect of increasing CIP volume fraction  on the (A) shear storage modulus and (B) surface roughness of MREs in the absence of an applied magnetic field (H = 0).
Download figure:
Standard image High-resolution imageIn the magnetic field regime (H < ∼100 kA m−1 ), the shear storage modulus increases quadratically with respect to the magnetic field strength, which is consistent with a recent theory that has been compared to data for PDMS elastomers loaded with CIPs [24]. While analytic models [34, 35] have shown success in predicting the magnetic field-dependent increase in shear storage modulus for rubber-like MREs, they fail to predict the large increase observed in ultrasoft PDMS-based MREs. Here, we propose a single fit parameter equation for the shear storage modulus as a function of CIP volume fraction ( ) and magnetic field strength (H):

where  is the shear storage modulus of the MRE,
  is a fit parameter,
  is the CIP volume fraction,
  is the vacuum permeability, and H is the magnetic field strength. The fit parameter
  (dimensionless) was determined by averaging
  for each magnetic field strength and volume fraction. The proposed equation fits the experimental data well (figure 6(A)) but begins to deviate at higher CIP volume fractions. Equation (6) can be extended to the elastic modulus by approximating the MRE as a perfectly elastic material that conserves volume such that
  resulting in [36]:


Figure 6. Comparison of the experimental (solid) and fit (dashed) increase in (A) shear storage modulus, (B) elastic modulus and (C) RMS surface roughness as a function of magnetic field strength for  .
.
Download figure:
Standard image High-resolution imageThe equation agrees well with the experimental data as shown in figure 6(B). Equations (4), (6) and (7) provide researchers with a method for tuning the moduli of ultrasoft PDMS-based MREs to a wide range of desired biological systems.
Similarly, the magnetic field-dependent RMS surface roughness, which originates from the magnetic interactions between the magnetic particles [37], can also be fit by:

where  is the fit parameter. Interestingly, the fit also agrees well with the experimental data as shown in figure 6(C), which suggests similarities in the underlying mechanisms driving the magnetic field-dependent change in moduli (volumetric) and surface roughness (interfacial).
4. Discussion
Our characterization results provide critical information for utilizing ultrasoft PDMS-based MRES to mimic dynamic changes in the ECM. The elastic modulus of our ultrasoft PDMS-based MREs can be tuned between E = 5 kPa (on the order of human liver tissue) at zero magnetic field and E = 500 kPa (nearly the order of cartilage) by application of a magnetic field up to 95.5 kA m−1. The two orders of magnitude span of the elastic modulus makes ultrasoft PDMS-based MREs ideal dynamic cell culture substrates for a wide range of biological systems (figure 7). For, example, these MREs can be used to mimic the increase in tissue stiffness associated with fibrotic scaring, or diseases that have tissue pathologies typified by an increase in tissue stiffness (e.g. atherosclerosis, non-alcoholic fatty liver disease). An MRE containing  CIP can achieve the five times increase in elastic moduli between healthy and infarct scarred myocardium with magnetic fields as low as 80 kA m−1.
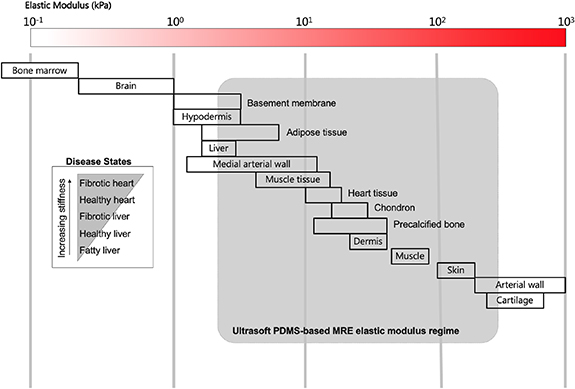
Figure 7. Tunable elastic modulus regime of ultrasoft PDMS-based MREs on the biological tissue stiffness continuum.
Download figure:
Standard image High-resolution imageThe low magnetic fields required for tuning the mechanical properties of MREs can be easily achieved by either rare earth permanent magnets [15] or electromagnets. Electromagnets have the advantage of high uniformity and easy field control via changing the driving electrical currents. Additionally, the unique reversibility and dynamic tunability of these MREs provide new avenues for investigating time scales associated with cell-matrix interactions.
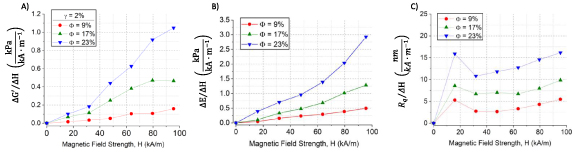
Furthermore, the tunability of the shear storage modulus, elastic modulus, and RMS surface roughness defined as  ,
,  , and
, and  respectively, can be adjusted by the CIP volume fraction providing different tunability to the applied magnetic field (figure 8). For instance, at a magnetic field strength of 80 kA m−1, using MREs with
  results in a tunability of shear storage modulus of
  , elastic modulus of
  and RMS surface roughness of
  . Increasing the CIP volume fraction to
  results in greater tunability of the shear storage modulus of
  , elastic modulus of
  and RMS surface roughness of
  . A lower tunability, which occurs at low CIP volume fractions, provides a system with small moduli and RMS surface roughness tunability. Conversely, a high tunability is achieved at high CIP volume fractions and magnetic field strengths providing a system with larger tunability. Our results can provide guidance for the choice of magnetic field strength and CIP volume fraction to suit the specific needs for tuning of the mechanical properties required by the biological system under investigation.
Figure 8. Tunability of the (A) shear storage modulus, (B) elastic modulus and (C) RMS surface roughness of the MREs as a function of magnetic field strength for  .
.
Download figure:
Standard image High-resolution image
Changes in the mechanical properties of the ECM influences cells to respond with a mechanosensitive 'signature'. The capabilities we have described of this MRE system are potentially powerful and reliable to mimic such signatures, however, it is important to recognize that choosing the appropriate model for the biological question is necessary. Therefore, control over the tunability of the mechanical properties of the material provides new avenues for exploring disease phenotype transitions. The controllable tunability of the presented MREs provides a platform with the necessary resolution in modulus and roughness step size for pinpointing the mechanical thresholds in a wide range of biological systems. For instance, embryonic cardiomyocytes have been shown to stop spontaneous beating on both soft (E ∼ 1 kPa) and stiff (E ∼ 34 kPa) matrices, but a mid-range matrix stiffness (E ∼ 11 kPa) provided optimal conditions for beating [38]. Applying an MRE containing  provides high resolution control over modulus as a function of external magnetic field (i.e. small changes in stiffness with change in applied magnetic field). This would allow for interrogation of the mechanosensitive responses across a range of environmental stiffnesses and identify transitions between normal and abnormal behavior. Moreover, surface nanotopography can be used to induce specific biological performance (e.g. adhesion, orientation, cytoskeleton organization, differentiation). Human vascular endothelial cells are an exemplar of change in biological performance on surfaces having an Rq = ∼100 nm compared to surfaces having Rq = ∼300 nm [39]. An MRE containing
  can achieve the 100–300 nm range in RMS surface roughness as a single substrate. The MRE substrates can also find applications in biological systems given the relevant range of physiological and pathological stiffness and roughness.
5. Conclusion
We fabricated and characterized the magnetic field-dependent tunability of ultrasoft PDMS-based MREs. Mechanical properties of MREs based on an ultrasoft PDMS ( ∼1 kPa) with CIP volume fraction at
  were investigated over a magnetic field range of 0–95.5 kA m−1. The shear storage modulus of the bulk MREs at 2% shear strain shows an increase up to ∼16 ×
  and ∼41 ×
  , revealed by shear rheology measurements. The elastic modulus of the bulk samples, measured by compressive indentation, increased up to ∼4 ×
  and ∼11 ×
  . Interferometry revealed a monotonic increase in the surface roughness as the magnetic field and CIP volume fraction increased. Single fit parameter equations are presented to predict the increase in moduli and surface roughness as a function of CIP volume fraction and applied magnetic field strength. Our results provide guidance for utilizing ultrasoft PDMS-based MREs as dynamic cell culture substrates.
Acknowledgments
This work was supported by the Center for Engineering Mechanobiology (CEMB), an NSF Science and Technology Center, under Grant Agreement CMMI:15-48571. Additionally, this work was in part supported by NSF under award CMMI-1663037, PFAD program supported by a fellowship from the Vice Provost of the University of Pennsylvania, the Delaware INBRE program supported by a grant from the National Institute of General Medical Sciences—NIGMS (P20 GM103446) from the National Institutes of Health and the State of Delaware, the National Science Centre of Poland under Grant Agreement 2017/26/D/ST4/00997 and the Scientific Council of Latvia under Grant Agreement lzp-2020/1-0149. The authors would like to also acknowledge Richard Willard and Rob Cunningham from Bryn Mawr College's Machine and Instrument Shop for their support and craftmanship.
Data availability statement
The data that support the findings of this study are available upon reasonable request from the authors.