
Abstract
This paper presents an overview of a measurement system that is designed for in-line shape inspection of metal sheet components in real-time utilizing pre-calibrated close-range photogrammetry and a CAD-model. The system is currently designed to measure parts thrown out on a conveyor belt that moves at about 1 m s−1 at a frequency of 0.5 Hz or less without fixturing. Detected features on the components in the camera images are used to align the CAD-model, describing the nominal shape, to the images from which required deviations are computed using photogrammetry. The measurement volume of the current system is 500 × 800 × 200 mm3 and absolute measurements are performed with an accuracy in the order of 0.1 mm. The in-line functionalities of the system have been verified at several real production sites in Sweden. In this paper, the basic components of the system are described together with a few results from real tests.
Export citation and abstract BibTeX RIS

Original content from this work may be used under the terms of the Creative Commons Attribution 4.0 licence. Any further distribution of this work must maintain attribution to the author(s) and the title of the work, journal citation and DOI.
1. Introduction
Digitalisation and traceability are key issues in the fourth industrial revolution and systems with the ability to generate traceable information that is also relevant have become key technologies in a modern production plant. One such key information is the geometrical outcome from a manufacturing operation such as welding, milling or stamping. A complex system as a car consists of a multitude of components that are manufactured individually, often in different plants and sometimes on different continents, and later assembled in a series of assembly lines. In such a complex operation quality assurance is crucial in all steps and an ability to trace geometrical deviations on an individual component level becomes key information for preparing future assembly operations. In an efficient process, digital information about key aspects of the component therefore accompanies the physical component down the production line. However, there are a rich number of other uses for digital information on every produced component that are just as useful and that on their own have the potential to transform the way manufacturing is performed today. Immediate detection of erroneous components will help to reduce scrap but will also help to avoid unnecessary rework operations. The ability to follow trends can be used to plan maintenance on the production unit in a more optimum way without relying on pre-defined service intervals. Such direct feedback can also be used to adjust settings in the machine automatically to secure a more stable production through process control.
Despite the needs, systems that measure the geometry of components in-line and without any special additional arrangements are rare and manufacturers are left with near-line solutions that often require some sort of fixturing. For optical measuring systems the choice of measurement technology fundamentally defines what is possible to accomplish, see [1, 2]. The most common approach is to utilize active illumination in the form of projected fringes or projected random patterns often combined with fixed markings and photogrammetry for global alignment. Most major measurement system suppliers have in their product line systems that are based on such an approach. These active techniques have proven successful for near-line and off-line applications where scanning is possible but have a few disadvantages that reduces their attractiveness for in-line applications. One limitation is that in general the measurement outcome is based on a temporal sequence of images that makes them prone to motions during acquisitions. Ideally, therefore in-line systems should rely on measurement techniques with single-shot capability. Another limitation is that systems based on active illumination in general are susceptible to specular reflections. Although blue-light illumination partly reduces specular effects, reflections are not eliminated completely. A technique that resembles the projected pattern approach but that relies on features naturally present on the measurement object is close-range photogrammetry [3]. While both techniques are based on triangulation and often use similar types of camera arrangements, the difference in technology is substantial. In close-range photogrammetry, diffuse illumination is used that ideally eliminates specular reflections and aims for an even illumination regardless of object shape. Because of that, features identified on the object surface and that are observed from several cameras can be projected onto a common 3D-coordinate system defined from calibration. Close-range photogrammetry therefore has single-shot capability. An alternative to triangulation-based techniques and a technique that has found applications in high-quality control is digital holography [4]. In contrast to the previous techniques, digital holography is based on the measurement of a phase change caused by a change in the measurement set-up, most often a wavelength shift. Digital holography is less prone to specular reflections and less dependent on calibration than triangulation-based techniques. In addition, single-shot capability can be obtained from multiplexing. However, costs and security issues with strong pulsed laser systems currently reduces the use of digital holography to measurement volumes in the cm3 range. In this paper, therefore we focus on the use of close-range photogrammetry for in-line quality control.
A well-functioning in-line measurement system requires many additional steps apart from capturing the required images. Three important aspects are calculation speed, alignment of the measurement result with the digital master and the calculation of critical measures. Traditionally, the measurement result is first calculated over the whole field-of-view and represented as a point-cloud. After identification of points that belong to the object, and hence elimination of the measurement background and outliers, the point-cloud is transformed to be represented on the same coordinate system as the digital model. That step is often performed in a separate multi-purpose program. Finally, critical points are identified and deviations from nominal values are calculated. Depending on the speed with which point-clouds can be generated, often the calculation speed is limited by the alignment procedure, particularly if the point-cloud representation consists of many points. The procedure to generate point-clouds in photogrammetry is in general a time-consuming process ill-suited for real-time applications. To circumvent that limitation and still be able to use the advantages with photogrammetry a special procedure is adopted in which the digital model is utilized fully [5]. This approach also makes it possible to limit the evaluation points to the ones that are needed for the current evaluation. In that way real-time evaluation is possible.
In this paper, the measurement system is briefly presented in section 2. The section is sub-divided into illumination, camera system, calibration, triggering, object detection and calculation of measures. Section 3 presents verification tests and results from an installation at a real production line. The results are discussed in section 4 together with a few concluding remarks.
2. Close-range photogrammetry
The measurement system considered is sketched in figure 1 and different aspects of this system are discussed in the following five subsections. The illumination arrangement is presented and discussed in sub section 2.1. Two important aspects with this arrangement is that it should allow for moving objects to be measured with the precision required and that shadowing and specular reflections should be reduced as much as possible. The camera system used is discussed in sub section 2.2. One of the most important aspects of the system is to have a reliable and robust calibration procedure. The approach we decided to use is sketched in sub section 2.3. Since this approach is somewhat different from the approach most commonly used in photogrammetry some more details are provided. The triggering and component localization are discussed in sub sections 2.4 and 2.5, respectively, and finally, the way in which the digital model is utilized to calculate measures of interest is sketched in sub section 2.6.

Figure 1. A sketch of the presented measurement system (sketch by Adam Murphy).
Download figure:
Standard image High-resolution image2.1. Illumination
The illumination is modularized into panels of size 500 × 500 mm2 and organized such that the measurement volume is illuminated equally from all directions. Each panel consists of parallel LED strips (5000 K) fixed to an aluminum panel and covered by diffuse acrylic glass. A specially designed circuit feeds the LED strips and allows the generation of synchronized light pulses from 10 μs to 10 ms with a repetition rate up to 10 Hz. The ability for the system to generate short pulses of intense light over an evenly illuminated area is crucial for the system and is one of the features that ultimately sets the precision of the measurements. As an example, figure 2 shows an image of a typical component placed inside the measurement volume.

Figure 2. Diffuse lighting inside the measurement system.
Download figure:
Standard image High-resolution image2.2. Camera system
The camera system consists of four 12.3 Mpixel monochrome digital cameras mounted on a fixture made out of carbon-fiber beams as shown in figure 3. The four cameras are mounted with a fixed angle and directed towards the common centerline at a distance of 90 cm from the cameras. With the chosen 16 mm objectives, this gives a measurement volume of approximately 500 × 800 × 200 mm3. The cameras have a global shutter which allows easy synchronization with the illumination. Image acquisition is controlled by the light source with the result that moving objects are frozen. As an example, for an object movement of 1 m s−1 the object moves 30 μm during a typical 30 μs exposure, which corresponds to 60 ppm of the field-of-view. Such a small movement is within the Airy spot of the imaging and will not influence the sharpness of the image. As an effect the acquired images can be considered stationary.
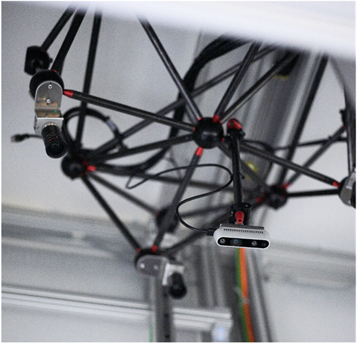
Figure 3. The four cameras are mounted on a frame made from carbon-fiber beams and points towards a common image center 90 cm below the cameras. The depth camera used for triggering extends down below the camera plane.
Download figure:
Standard image High-resolution image2.3. Calibration
One of the bottlenecks with photogrammetry is the need for a robust and accurate calibration procedure [3]. In the calibration position, orientation, and projection parameters of the cameras are estimated defining the global coordinate system of the measurement volume. The common approach is to place a calibration pattern at a large number of random positions and orientations within the measurement volume and then solve for the extrinsic and intrinsic camera parameters in relation to the global coordinate system. Although well established and well investigated we found this procedure to result in numerical instabilities that generated a certain degree of inaccuracy for the higher order terms of the camera model. Instead we adopted and further developed a procedure previously introduced by Synnergren in which a flat plate with identifiable targets is moved in known steps depth-wise throughout the measurement volume [6]. With a priori knowledge of dimensions and step size of the translation the camera parameters can be solved with greater numerical stability. An additional advantage is that the procedure can be automated to a larger degree, which is a great advantage for a measurement system that should be operated by non-experts. In the current system the flat calibration plate, made of a diabase stone, is placed within the measurement volume and the linear movement is performed by a translation of the camera frame in known steps, in total 10 depth steps are utilized evenly distributed over the 200 mm measurement depth.
2.4. Triggering
As the measurements are performed without a fixture and on moving objects, robust and reliable triggering is essential. For this purpose, a commercial Intel® RealSense™ depth camera is utilized that is seen extending down on a rod in figure 3. This camera continuously generates a stream of 3D point clouds of 307200 points at a frame rate of 30 Hz, which is sufficient for the speed of 1 m s−1 at which the components are moving. Points within a given region are analyzed giving an estimate of movement and position of an object in the field of view. Once the object passes a predefined limit under certain conditions, a trigger signal is sent to the camera system. Then the four cameras activate synchronously while the diffuse flash illuminates the measuring volume. The illumination level is set so that the natural pattern on the measured object is clearly visible in the captured images to obtain the best possible conditions for photogrammetric processing. For the measurements in this paper a flash duration of 30 μs was used.
2.5. Object detection
Before the actual measures are calculated, the component must first be detected in the images and aligned with the digital model describing its nominal shape, i.e. the CAD-model, see figure 4. We perform the alignment based on feature detection; in this case hole features in the CAD-model that will be clearly visible in the images. The feature detection used is based on image binarization [7], and the method of Maximally Stable Extremal Region [8]. The detected feature pattern is used to initially align the CAD-model to the images. As a next step, surface alignment points, which together with the hole features define a rigid body transformation for a specific alignment, are used to fine-tune the alignment. That specific alignment is the alignment between the CAD-model and the measured object wherefrom required measures of deviations are defined. The surface alignment points are identified using image correlation, see section 2.6. The CAD-model, hole features and surface alignment points aligned to the object in the images are shown in figure 5.
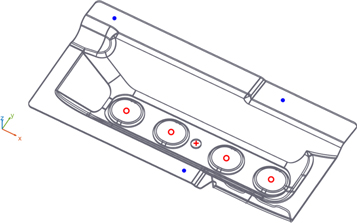
Figure 4. CAD-model of the component investigated. Four slot features, marked with red circles, a circular hole feature, marked with a red plus sign, and three surface alignment points, marked as blue points defines the geometry of the component.
Download figure:
Standard image High-resolution image
Figure 5. CAD-model, hole features and surface alignment points aligned to the object in the images.
Download figure:
Standard image High-resolution image2.6. Calculation of measures
Once the CAD-model is well aligned to the detected object in the images, actual measures are calculated. Measures are calculated using camera parameters estimated in the calibration and local correlations where a combination of intensity and intensity gradient information is utilized to formulate a robust correlation measure [9]. Measurement points on the CAD-model, see figure 4, defines positions of measured deviations of interest. Correlation points distributed on a local surface representation around the measurement points, are projected onto all images. Correlation trials are performed along the direction of the surface normal at the measurement points. The measure of deviation is calculated from the maximum image correlation peak. Using four cameras, up to six image correlation pairs can be used to calculate the deviation at a given measurement point, dependent of its visibility in the images. In general, all six are used in this investigation.
3. Experimental evaluation
The measurement system has been installed adjacent to a progressive die press producing car body components for about four months and its performance has been monitored and evaluated continuously, see figure 6 for a picture from the installation. The left part of the picture shows the progressive die press that produces cold formed steel components. On the conveyor belt seen in the lower right part of the picture are the parts transported to packaging. The measurement system is hung from a three-legged frame and is placed in direct vicinity to the exit of the press. The reason one of the legs is removed from the frame is to allow normal user access to the belt. During normal operation a continuous stream of components is transported under the measurement system and measurements are automatically triggered once a component is in a correct position inside the predefined measurement volume.

Figure 6. A picture from the installation. The measurement system is placed in a frame above the conveyor belt.
Download figure:
Standard image High-resolution imageThe basic functionality of the system and its ability to follow trends in the geometrical output from the stamping machine has been evaluated in several test series over the test period of four months. The frequency of production was 30 items per minute in which the components were thrown from the press onto the conveyor belt randomly. During these investigations, the speed of the conveyor belt was 0.5 m s−1 and the flash duration was set to 30 μs. Typical images are shown in figures 2 and 5, respectively. During this production every 5'th component was measured generating one updated measurement every ten seconds for a total of 600 measurements per batch. In total, 40 batches have been investigated. During these test series, we experienced no false triggering. In comparison to a typical 3 per batch measurement cycle, this data has the potential to generate immense value in production.
For the evaluation of random and systematic error sources one component per batch was scanned in a measurement room using an industry standard measurement system and the measured shapes from the two different measurement systems where compared. The industry standard measurement system used for the comparisons was the Nikon scanner MMDX200 mounted on the measurement arm Nikon MCA 3.5+. One result is shown in figure 7. This result is presented on a best fit basis where the color coding is chosen such that green indicates deviations that are within an acceptable uncertainty limit while blue and red are deemed unacceptable. It is seen that on average the two systems generate similar results over the whole extension of the component, which indicates that

Figure 7. Results from a comparative measurement between scanning and measurement in the described system. Best fit alignment is used.
Download figure:
Standard image High-resolution image
the calibration is satisfactory. In some areas, however, larger deviations are present. These are areas where the steel was heavily deformed during the stamping and as a result from plastic deformation have few natural features and higher specularity.
4. Discussion and conclusions
Several interesting results emerge from the tests out of which a few are presented in this paper. The illumination consists of LED-strips placed inside the measurement box and was designed to generate short flashes of diffuse light inside the measurement volume to freeze motion and to minimize effects of specular reflections. Indeed, the illumination panels were able to generate short enough flashes for the application and with minor variability in power between flashes. The light panels have functioned satisfactory all through the test series with no need for adjustments. We also see in figure 2 that the component is reasonably evenly illuminated although there is a small global intensity gradient across the field-of-view. It is further seen that some areas of the component are locally darker or brighter than the average intensity. There are two reasons for these variations. The first reason is that the component is made out of rather shiny steel that gets even more shiny in regions that are plastically deformed in the press. Specular reflections are therefore hard to avoid completely with the result of dark and bright patches depending on the local orientation of the component. The specular reflections can be somewhat reduced with blue light illumination, but as long as the system is used in its present design, with components traveling underneath the box and not being put inside the box, some specularity is hard to avoid. The second reason is that the panels are slightly unbalanced where too much light is coming from the top panels in the ceiling of the box as compared to the side panels. The illumination balance was somewhat improved with the addition of skirt light panels, however in this installation it was only possible to have one vertical and one horizontal skirt panel, as seen is figure 6, creating varied shading and specular highlights on some areas of the components being measured. It is therefore concluded that there still is room for some adjustments and optimization of the illumination to reach the best possible lighting conditions.
The triggering worked satisfactory all through the test series. The triggering system used is based on a cheap depth camera that generates 3D point clouds at video speed. Despite the fact that the point cloud is rather sparse with a depth accuracy in the order of mm, a robust and reliable triggering was obtained that didn't malfunction once during the tests. In addition, the point cloud could be used to narrow down the search area for the component in the images. Localization of the component in each of the images is a crucial step that requires a certain amount of contrast between the component and the background. In figure 2 for example, the contrast is significantly lower as compared to the situation in figure 5 which makes the necessity to choose correct settings for the feature localization more important. As the color of the background may vary between installations and during the same installation a certain amount of finetuning is in general required. During this installation for example the belt went from white to almost completely black because of a continuous contamination with oil and dust. One result from a localization and alignment is seen in figure 5. The reason to perform the alignment on the images rather than on calculated point clouds is calculation speed. For the results in figure 5, the features marked in figure 4 was used that only requires eight coordinates to be identified for a unique description of the position and orientation of the reference coordinate system. For the present system the alignment operation takes less than 100 ms on a regular personal computer. This step also relies on the calibration of the system.
The calibration procedure introduced appears to generate negligible systematic errors over the measurement volume considered, as can be seen from the even distribution of errors in figure 7. The introduction of a known flat and known translations stiffens up the calibration numerically generating calibration values for each of the cameras relative the calibration plate rather than between the cameras. This procedure has the additional advantage of being able to automate as it is enough to put the calibration plate inside the measurement volume and move the camera frame in known steps. The disadvantage is that this type of calibration requires a well-controlled calibration plate with a flatness in the order of a few micrometer over the field-of-view and translational motors that can move the frame with tens of micrometer resolution over a measurement depth. For larger measurement volumes than considered in this investigation those requirements may be difficult to fulfil.
The precision of the system in repeated tests was found to be in the order of 20 μm. These tests were performed on the same component run through the system in the same orientation and at the same position multiple times. However, in tests where the component was allowed to have a random position and orientation the point-to-point variation increased to approximately 0.1 mm, hence we conclude that the accuracy is in the order of 0.1 mm for the present system. This conclusion is also in line with the comparative results shown in figure 7 where the maximum deviation is in the order of 0.1 mm. The main reason for the increase in the uncertainty when allowing the component to take on random orientations is as discussed above the increased variability in the illumination thus obtained. This variability slightly influences the position of the correlation peak used to locate surface points, which may have major impact primarily on the alignment of the component. For example, if one of the three alignment points is slightly off, the plane that defines the orientation of the reference coordinate system is slightly wrong and the relative measures calculated will as a consequence also be wrong. It is therefore of importance to choose these alignment points with care.
In conclusion, the measurement system evaluated was developed specifically for the task of in-line measurement in high speed and high frequency production. The hardware and software solutions were developed to work together to achieve this goal. The target specifications were to achieve an accuracy of 50 μm and precision of 20 μm while being able to measure freely orientated objects moving at up to 1 m s−1 with complete analysis within 1 s. From the results presented above, the measurement system meets most specifications except for the speed of analysis and accuracy. The speed may be addressed by parallelization of the computations and is achievable but is dependent on the number of selected measurement points for analysis. To meet the accuracy specification a slight redesign of the illumination is required together with a more robust procedure to perform the alignment. These improvements are currently being implemented and an updated version will be tested in the near future.
Acknowledgments
This research was funded by VINNOVA (the Swedish innovation agency) through the program FFI.
Data availability statement
The data that support the findings of this study are available upon reasonable request from the authors.