
Abstract
In this work, the activities and activity coefficients of binary precious metal alloys (Ag-Pb, Ag-Sb, Ag-Bi, Au-Pb, Pd-Pb, Pt-Pb and Cu-Pb) were predicted using molecular interaction volume model (MIVM), modified MIVM (M-MIVM), Wilson equation and nonrandom two-liquid (NRTL) model. The average standard deviation and average relative deviations of these models were also calculated. The results show that the prediction deviations of the M-MIVM were smallest among the four thermodynamic models, indicating that the M-MIVM is reliable. On this premise, the separation coefficient and vapor-liquid equilibrium (VLE) data of Ag-Pb, Au-Pb, Pd-Pb and Pt-Pb were calculated based on the M-MIVM. The results show that the separation coefficients were much larger than one, indicating that these alloys can be easily separated by vacuum distillation. There is good agreement between the predicted and experiment VLE data, indicating that M-MIVM is reliable for the VLE calculation in vacuum distillation. The VLE phase diagrams procured in this work can afford theoretical guidance for experimental design and industrial production in vacuum distillation.
Export citation and abstract BibTeX RIS

Original content from this work may be used under the terms of the Creative Commons Attribution 4.0 licence. Any further distribution of this work must maintain attribution to the author(s) and the title of the work, journal citation and DOI.
1. Introduction
PMs (Precious metals) are widely used in electronics and catalysts industry because of their excellent physical and chemical properties (e.g., high catalytic activity and conductivity, strong corrosion resistance, etc.) [1]. PMs, especially silver, gold and palladium, are mainly used to prepare contacts, bonding wires and switches and computer hard disk drives in electron industry [2]. PGMs (platinum group metals), called 'vitamin of modern industry', are usually applied as the active components in automobile emission purification, petrochemical engineering and pharmaceutical industry [3, 4]. With the rapid development of global information industries, the demand for PMs continues to increase [5].
At present, a large part of PMs was recovered from precious metal alloys (e.g., Ag-Pb, Ag-Sb, Ag-Bi, Au-Pb, Pd-Pb, Pt-Pb and Cu-Pb), which were usually produced from the lead smelting process [6, 7]. In addition, huge quantities of precious metal alloys were also produced during the recovery process of secondary resources such as electronic waste, end-of-life electronics and spent automobile exhaust purification catalysts [8, 9]. The conventional treatment method of precious metal alloys was oxidization blowing, in which lead, bismuth, antimony and copper were preferentially oxidized into dust or slag and PMs were concentrated [7, 9]. The drawbacks of the method were low resource utilization rate, high energy consumption, long production period and serious environmental pollution. Vacuum distillation has such advantages as short flow, simple equipment, high metal recovery rate, environmentally friendly [10]. Over the past decades, it has been researched and applied to separate and purify various non-ferrous metals and alloys by Dai, Yang and co-workers [10, 11]. Recently, based on advantages of vacuum distillation and the fact that the difference of vapor pressure between lead, bismuth, antimony and PMs, the National Engineering Laboratory of Vacuum Metallurgy, China proposed a method of separating precious metal alloys and recovering PMs by vacuum distillation.
Vapor-liquid equilibrium (VLE) phase diagrams are usually used for quantitative analysis of the distribution of alloy components in liquid and vapor phase. Therefore, credible VLE data is significant for experiment design and industrial production in vacuum distillation. However, experimental determination of VLE data is difficult because of high temperature, low pressure, large manpower and material consumption. Thermodynamic model prediction as an efficient and convenient method is frequently used to calculate VLE data of alloy systems. In our previous work, thermodynamic properties of many alloy systems have been calculated based on MIVM and Wilson equation by Yang and Kong [12–15]. The results show that MIVM and Wilson equation has weaknesses in handling asymmetric system while most precious metal alloys belong to asymmetric system. In contrast, M-MIVM shows unique superiority and reliability in calculating the thermodynamic properties of asymmetric systems [16, 17]. However, researches on modeling of VLE of binary precious metal alloys using M-MIVM in vacuum distillation have not been reported until now.
In this work, the activities and activity coefficients of Ag–Pb, Ag–Sb, Ag–Bi, Au–Pb, Pd–Pb, Pt–Pb and Cu–Pb were calculated using MIVM, M-MIVM, Wilson equation and NRTL model. The prediction deviations of each thermodynamic model were calculated. Separation coefficients and VLE data of these alloys were calculated based on M-MIVM. The VLE phase diagrams obtained in this study can provide theoretical guidance for the efficient separation of binary precious metal alloys by vacuum distillation.
2. Method
2.1. Molecular interaction volume model (MIVM)
MIVM was obtained from statistical thermodynamics and the basic characteristics of the nonrandom transfer of liquid molecules [18]. The expression of mole excess Gibbs free energy GE m of MIVM is:
For a binary system i-j, equation (1) can be rewritten as:

According to equation (2) and (∂GE m /∂xi )T, P, xi≠j = RT ln γi , the activity coefficients of i and j are:
where xi and xj are the molar fractions; Vmi and Vmj are the molar volumes; Zi and Zj are the first coordination numbers; Bij and Bji are the pair-potential energy interaction parameter which are defined as equation (5). Zi can be calculated from equation (6).

Where εii , εjj and εij (εij = εji ) are the pair-potential energy of i-i, j-j and i-j, respectively.

where rmi is equal to the atomic diameter, rmi = σi ; r0i (r0i = 0.918dcov, i ) is proportional to the atomic covalent diameter dcov, i ; ρi is the molecular number density; ΔHmi and Tmi are the melting enthalpy and melting temperature, respectively; Zc (Zc = 12) is a close-packed coordination.
2.2. Modified molecular interaction volume model (M-MIVM)
M-MIVM and MIVM are deduced from the same partition function [16]. However, M-MIVM is obtained from different hypothesis and theories. In the derivation of M-MIVM, the Scatchard-Hildebrand theory [19, 20] and radial distribution function [19] are further introduced on the base of cell theory [18, 21] which are employed by MIVM. The mole excess Gibbs free energy GE m of M-MIVM is:

For i-j binary system, equation (7) are rewritten as:
where Vmi and Vmj are liquid molar volumes of i and j, respectively; the volume parameters (Bij and Bji ) and the energy parameters (Aij and Aji ) are defended as equation (9) and equation (10) as follows, respectively.


where K is a constant; kB is the Boltzmann constant; C0 i and C0 j are temperature independent proportional constants; εij (εij = εji ), εii and εjj are pair potential energy of i-j, i-i and j-j, respectively; pij is the probabilities that the molecule i arise in the first coordination layer of the centrical molecule j. Aij and Aji are temperature independent in the system of weak intermolecular interaction such as alloys separation during vacuum distillation. However, Bij and Bji are temperature dependent and the Bij (T1) and Bji (T1) at other temperature T1 are obtained from equation (11).

According to the relationship (∂GE m /∂xi )T, P, xi≠j = RTlnγi , the activity coefficients of i and j are:


where the parameters Cij , Cji and Dij , Dji are defended as equations (14) and (15).


2.3. Separation coefficient
Separation coefficient β is used for the judgement of separation feasibility of alloys in vacuum distillation [10]. For i-j binary system,

where γi and γj are the activity coefficients of i and j, respectively; P*i is the saturated vapor pressure of component i which can be obtained from Van Laar equation [10]:

where A, B, C and D are evaporation constants; T is the absolute temperature in Kelvin.
2.4. Vapor-liquid equilibrium (VLE)
The thermodynamic condition of VLE of i-j binary system is the fugacity of component i in liquid phase  equal to that of i in vapor phase

If pressure effect can be neglected, in other words, the vapor phase is an ideal gas,  can be expressed as equation (19). In this case, the liquid phase cannot be considered ideal. The deviations from ideality are investigated by introducing a correction factor γi
into Raoult's law and
can be expressed as equation (19). In this case, the liquid phase cannot be considered ideal. The deviations from ideality are investigated by introducing a correction factor γi
into Raoult's law and  can be expressed as equation (20).


where  is vapor phase fugacity coefficient of i;
  is saturated fugacity coefficient of pure i in liquid phase; Vi
l
is liquid molar volume of component i.
is saturated fugacity coefficient of pure i in liquid phase; Vi
l
is liquid molar volume of component i.
The vapor phase is regarded as an ideal gas in vacuum distillation, thus  and
and  are equal to one and
 ![$\exp \left[{{V}_{i}}^{l}(P-{{P}_{i}}^{* })/RT\right]$](https://content.cld.iop.org/journals/2053-1591/8/9/096508/revision2/mrxac20f9ieqn9.gif) equals approximately one at low pressure. Simultaneous equations (18)–(20), the equation of modified Raoult's law can be written as:
equals approximately one at low pressure. Simultaneous equations (18)–(20), the equation of modified Raoult's law can be written as:

For i-j binary alloy system:


Combining equations (21)–(23), xi and yi are:

3. Results and discussion
3.1. Thermodynamic model calculation and comparison
Substituting the corresponding parameters of pure metals (table 1) [22, 23] into equation (6), the coordination numbers Zi and Zj of MIVM were obtained. Substituting Zi , Zj , the experimental data of activity coefficients (γi, exp. and γj, exp.) [24, 25] and the relevant parameters into equations (3) and (4), the pair-potential energy interaction parameters (Bij and Bji ) of MIVM were obtained by fitting at least squares principle.
Table 1. The necessary parameters of the pure metals for MIVM and M-MIVM.
| Element, i | Vmi (cm3 mol−1) | ΔHmi (kJ mol−1) | σi (× 10–8cm) a | dcov, i (×10–8cm) b |
|---|---|---|---|---|
| Ag | 11.64 × [1 + 0.98 × 10⁻⁴ (T − 1235)] | 11.09 | 2.89 | 2.68 |
| Au | 11.37 × [1 + 0.69 × 10⁻⁴ (T − 1337)] | 12.76 | 2.88 | 2.68 |
| Pb | 19.45 × [1 + 1.24 × 10⁻⁴ (T − 601)] | 04.81 | 3.50 | 2.94 |
| Pd | 10.17 × [1 + 1.17 × 10⁻⁴ (T − 1825)] | 16.70 | 2.75 | 2.56 |
| Pt | 10.33 × [1 + 1.52 × 10⁻⁴ (T − 2045)] | 22.20 | 2.77 | 2.60 |
| Cu | 07.99 × [1 + 1.00 × 10⁻⁴ (T − 1311)] | 13.00 | 2.56 | 2.34 |
| Bi | 20.87 × [1 + 1.17 × 10⁻⁴ (T − 544)] | 10.88 | 3.38 | 2.92 |
| Sb | 18.87 × [1 + 1.30 × 10⁻⁴ (T − 904)] | 39.70 | 3.14 | 2.80 |
Similarly, the volume parameters (Bij and Bji ) and the energy parameters (Aij and Aji ) of M-MIVM can be obtained from equations (12) to (15). The calculated model parameters of MIVM and M-MIVM are shown in table 2.
Table 2. The calculated parameters of MIVM, M-MIVM, Wilson and NRTL.
| Systems | Parameters of MIVM | Parameters of M-MIVM | Parameters of Wilson | Parameters of NRTL | ||||||||||
|---|---|---|---|---|---|---|---|---|---|---|---|---|---|---|
| i-j | T/K | Bij | Bji | Zi | Zj | Bij | Bji | Aij | Aji | Aij | Aji | τij | τji | αij |
| Ag-Pb | 1273 | 1.3968 | 0.5960 | 10.68 | 9.29 | 0.5358 | 0.3429 | −0.4931 | 0.0000 | 0.2866 | 1.5091 | −1.3873 | 2.5055 | 0.1700 |
| Ag-Sb | 1250 | 0.7950 | 1.3132 | 10.72 | 6.96 | 1.9215 | 7.0125 | 1.5936 | 6.6747 | 6.1161 | 0.1636 | 1.2028 | −1.7164 | 0.4496 |
| Ag-Bi | 1000 | 1.7191 | 0.4386 | 11.24 | 7.84 | 2.7088 | 1.8016 | 2.8230 | −0.0062 | 0.1240 | 1.8216 | −1.9819 | 4.0415 | 0.1700 |
| Au-Pb | 1200 | 1.0195 | 1.1245 | 11.15 | 9.39 | 1.1943 | 0.2301 | −1.2561 | −0.4813 | 2.0547 | 1.3164 | −0.2441 | −0.7562 | 0.4499 |
| Pd-Pb | 1873 | 0.6641 | 1.6102 | 10.55 | 8.59 | 3.0941 | 2.5130 | 0.2692 | −0.1100 | 5.1943 | 1.2958 | −0.0652 | −1.7507 | 0.4500 |
| Pt- Pb | 1273 | 1.5224 | 1.0454 | 13.05 | 9.29 | 1.4543 | 2.2197 | −3.9129 | 10.0991 | 2.9020 | 3.9017 | −1.9793 | −0.9579 | 0.1700 |
| Cu-Pb | 1473 | 0.8097 | 0.8351 | 10.46 | 9.03 | 0.4958 | 0.3932 | −0.1887 | 1.0352 | 0.3810 | 0.3331 | 1.0737 | 0.7085 | 0.1700 |
Substituting Bij , Bji , Zi , Zj and corresponding parameters of MIVM into equation (3) and equation (4), the activities and activity coefficients of components of Ag-Pb, Ag-Sb, Ag-Bi, Au-Pb, Pd-Pb, Pt-Pb and Cu-Pb alloys can be predicted. Similarly, substituting Aij , Aji Bij , Bji and relevant parameters of M-MIVM into equations (12) to (15), the activities of above binary precious alloys can be calculated.
For the purpose of confirming the dependability of M-MIVM, two other successful classical thermodynamic model Wilson equation and NRTL model were employed to calculate the activities of these binary precious metal alloys. Wilson equation is a two-parameter model and the adjustable parameters Aij and Aji can be obtained by utilizing the Newton-Raphson methodology on the condition that the experimental values of activities are known [26]. NRTL model is deduced from the two-liquid solution theory of Scott [27] and local composition concepts of Wilson. It is also regarded as a reliable model to predict the activities of liquid alloys. NRTL model is a three-parameter model and the non-randomness factors αji (αij = αji ) and the energy parameters τij and τij (τij ≠ τij ) are calculated by the Newton-Raphson methodology under the condition of the experimental values of activity coefficients are known. All of the obtained model parameters of Wilson equation and NRTL model were listed in table 2.
The activities and activity coefficients of these precious metal alloys calculated from MIVM, M-MIVM, Wilson equation and NRTL model are shown in figure 1(a) to (g).
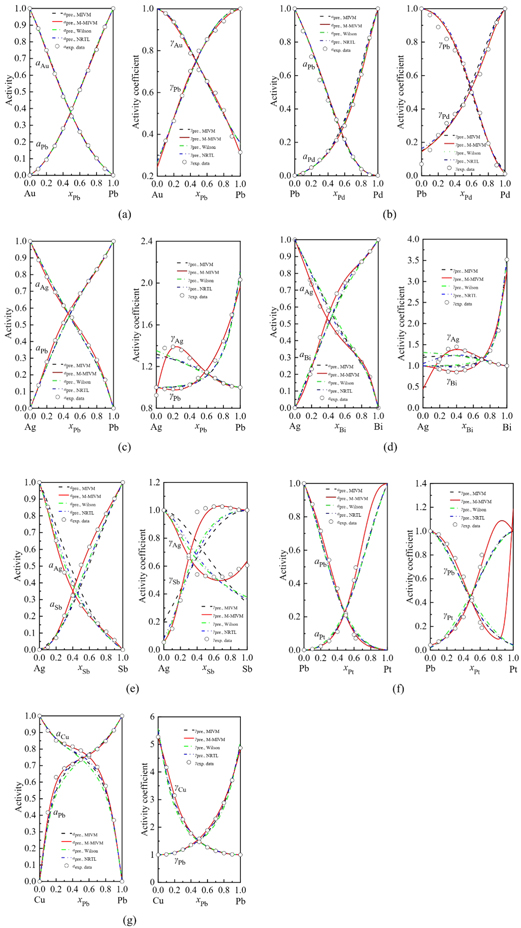
Figure 1. Predicted values (line) and experimental data (points) of activities and activity coefficients of binary precious metal alloys: (a) Au–Pb; (b) Pd–Pb; (c) Ag–Pb; (d) Ag–Bi; (e) Ag–Sb; (f) Pt–Pb; (g) Cu–Pb.
Download figure:
Standard image High-resolution imageFigures 1(a) and (b) show that all models display great data fitting capability in Au-Pb and Pd-Pb alloys. The reason is that MIVM, Wilson equation and NRTL model are good at handling symmetric systems (The characteristic of the symmetric system is that the experimental activity curves of the two components intersect near x = 0.5 in the coordinate axis, and are symmetrical about x = 0.5 or near.). M-MIVM inherits this good capacity from MIVM and plays it better. For Ag–Pb, Ag–Bi, Ag–Sb, Pt–Pb and Cu-Pb alloys, figures 1(c) to (g) show that the predicted values of MIVM, Wilson equation and NRTL model are obviously disagreement with the experimental data. However, M-MIVM shows great data fitting capability in these asymmetric systems (The characteristic of the asymmetric system is that the two experimental activity curves are generally not mirror-symmetrical, and the abscissa of the focus of the measurement curve has different degrees of deviation relative to x = 0.5.), especially for the alloy system with complex trend of activity coefficients such as Ag–Pb, Ag–Bi and Ag–Sb alloys. In fact, the complicated change trend is the characteristics of the alloy system and these characteristics will directly affect the VLE calculation.
In order to accurately characterize the deviation extent between experimental values and calculated data and the reliability of M-MIVM, the average standard deviation S*i and the average relative deviations Si of each model are also calculated from equation (29), as shown in figure 2 and table 3.

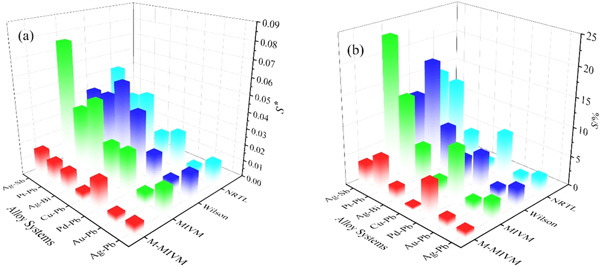
Figure 2. The mean value of deviations of each model in different alloy systems: (a) the average standard deviations S*; (b) the average relative deviations S.
Download figure:
Standard image High-resolution imageTable 3. The average standard deviations S* and average relative deviations S of MIVM, M-MIVM, Wilson equation and NRTL model.
| System | MIVM | M-MIVM | Wilson | NRTL | |||||
|---|---|---|---|---|---|---|---|---|---|
| i-j | T/K | ±S* i | ±Si (%) | ±S* i | ±Si (%) | ±SS* i | ±Si (%) | ±S* i | ±Si (%) |
| Au-Pb | 1200 | 0.0083 | 2.25 | 0.0050 | 1.66 | 0.0079 | 2.18 | 0.0084 | 2.26 |
| Pd-Pb | 1873 | 0.0270 | 9.54 | 0.0182 | 6.09 | 0.0181 | 6.53 | 0.0242 | 8.09 |
| Ag-Pb | 1273 | 0.0169 | 3.61 | 0.0061 | 1.26 | 0.0168 | 3.56 | 0.0153 | 3.30 |
| Ag-Bi | 1000 | 0.0477 | 7.22 | 0.0124 | 2.42 | 0.0534 | 8.66 | 0.0405 | 5.94 |
| Ag-Sb | 1250 | 0.0761 | 23.16 | 0.0156 | 3.71 | 0.0419 | 12.04 | 0.0515 | 14.42 |
| Pt-Pb | 1273 | 0.0392 | 14.28 | 0.0129 | 6.02 | 0.0425 | 18.58 | 0.0368 | 13.65 |
| Cu-Pb | 1473 | 0.0264 | 2.97 | 0.0058 | 0.62 | 0.0392 | 4.65 | 0.0198 | 2.19 |
| Over mean | 0.0345 | 9.00 | 0.0109 | 3.11 | 0.0314 | 8.03 | 0.0281 | 7.12 | |
Figure 2 shows that the values of S*i and Si of M-MIVM were smallest among the four models, indicating that the M-MIVM has higher reliability and universality.
Table 3 shows that in symmetric system (Au-Pb and Pd-Pb), the average relative deviations of each model are low enough, less than 3% in Au-Pb alloy and less than 10% in Pd-Pb alloy, respectively. The differences of the average standard deviations of each model are not very significant. However, the values of S* i and Si of M-MIVM are lower than that of other three models. In asymmetric system (Ag-Pb, Ag-Bi, Ag-Sb, Pt-Pb and Cu-Pb alloys), the values of S* i and Si of MIVM, Wilson equation and NRTL model are several times larger than that of M-MIVM. Particularly, for Ag-Sb alloy, the values of Si of Wilson equation and NRTL model are over 10% and MIVM over 20%, while M-MIVM less than 4%; for Pt-Pb alloy, it is hard to estimate whether it is symmetric or asymmetric system because of the absence of partial experimental data, the values of Si of MIVM and NRTL model are around 14% and Wilson equation are close to 20%, while M-MIVM is 6.02% and the S* i values of M-MIVM are decreased about three times than that of other three models. The Cu-Pb alloy usually produced with the precious alloys during the recovery process of electronic waste and it is necessary to be studied. It is asymmetric system, and the values of S* i and Si of M-MIVM are 0.0058 and 0.62%, respectively, which are quite small than that of other three models.
The average relative deviations of M-MIVM in all binary precious metal alloys are less than 7%, which indicates that M-MIVM is reliable and stable. The prediction capacity and effect of M-MIVM are better than other models in symmetric or asymmetric alloy system. M-MIVM with excellent data fitting capability can describe the characteristics of these binary precious metal alloys more accurately which will in turn improve the calculation accuracy of the separation coefficients and VLE data in vacuum distillation. In addition, this excellent capability undoubtedly makes up for the drawback of other classic models in asymmetric systems and will greatly expend the application range of M-MIVM.
3.2. Separation coefficient
The separation coefficient plays a relatively important role on researching these binary precious metal alloys in vacuum distillation. The yields of silver, gold, palladium and platinum are far higher than that of other PMs, and the Ag-Pb, Au-Pb, Pd-Pb and Pt-Pb are the commonest alloys in PMs production and recycling. Therefore, the separation coefficients of Ag-Pb, Au-Pb, Pd-Pb and Pt-Pb alloys were calculated from equation (16) based on M-MIVM, as shown in figures 3(a) to (d). The saturated vapor pressure P* i of each component was calculated form equation (17) and the relevant parameters for P* i calculation of pure metals are presented in table 4.

Figure 3. The separation coefficient at 1073K to 1573K: (a) Ag-Pb; (b) Au-Pb; (c) Pd-Pb; (d) Pt-Pb.
Download figure:
Standard image High-resolution imageTable 4. The constants for saturated vapor pressure calculation [10].
| Element, i | A | B | C | D | Temperature range, K |
|---|---|---|---|---|---|
| Ag | −14400 | −0.85 | 0 | 13.82 | 1234–2420 |
| Bi | −10400 | −1.26 | 0 | 14.47 | 300–1837 |
| Au | −19820 | −1.01 | 0 | 14.50 | 1337–3130 |
| Cu | −17250 | −1.21 | 0 | 15.33 | 1356–2843 |
| Pb | −10130 | −0.98 | 0 | 13.28 | 601–2023 |
| Pd | −17500 | 1.00 | 0 | 2.69 | 1828–3236 |
| Pt | −27890 | −1.77 | 0 | 17.83 | 2042–4443 |
| Sb | −6500 | 0.00 | 0 | 8.49 | 904–1948 |
The separation coefficients of Ag-Pb, Au-Pb, Pd-Pb and Pt-Pb alloys are much larger than one, indicating that they can be easily separated by vacuum distillation. In addition, the results show that the separation coefficients are decreased with the temperature increasing, indicating that the tendency of liquid phase volatilization is more obvious with the temperature increasing, and that it is not favorable for separation when the temperature too high.
3.3. VLE calculation
Separation coefficient can judge the feasibility of separation of precious metal alloys by vacuum distillation, but cannot predict the separation degree. Therefore, the VLE phase diagram is needed to be calculated to quantitatively and accurately analysis of the distribution of alloy components in liquid and vapor phase in vacuum distillation.
Substituting corresponding parameters γi
, γj
, P* i
, and S* i
under different temperatures into equations (22) to (24), the VLE data can be obtained, and then T-x-y and P-x-y phase diagram can be drawn. The saturated vapor pressure P* i
is calculated from equation (17) and the needed constants are shown in table 4. The flowchart of T-x-y and P-x-y phase diagram calculation is displayed in figures 4(a) and (b), respectively. T-x-y phase diagram calculation is an iterative procedure in which a reasonable and estimated temperature T is needed first, and then the partial pressure Pi
can be calculated from  at the temperature T. When
  the corresponding yi
and T can be obtained. The calculation process of P-x-y phase diagram resembles that of T-x-y phase diagram.
the corresponding yi
and T can be obtained. The calculation process of P-x-y phase diagram resembles that of T-x-y phase diagram.
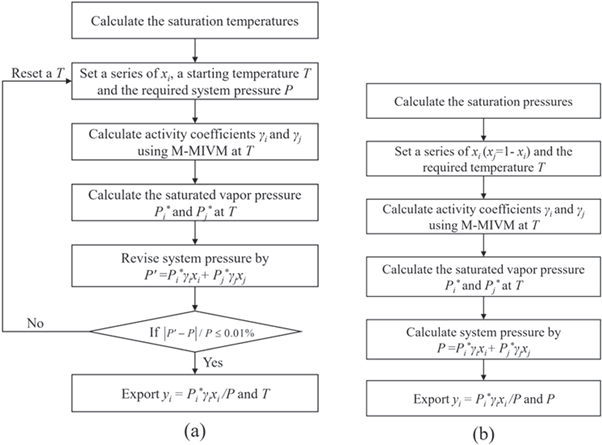
Figure 4. The flowchart for VLE phase diagram calculation: (a) T-x-y phase diagram, (b) P-x-y phase diagram.
Download figure:
Standard image High-resolution imageFollowing the procedure shown in figure 4, the VLE phase diagrams of Ag-Pb, Au-Pb, Pd-Pb and Pt-Pb alloys were calculated based on M-MIVM, as shown in figures 5 to 8.

Figure 5. VLE phase diagrams of Ag-Pb alloy based on M-MIVM: (a) T-x-y (5–15 Pa) and Exp. data at 5–10Pa [28], (b) P-x-y (1173–1373K).
Download figure:
Standard image High-resolution image
Figure 6. VLE phase diagrams of Au-Pb alloy based on M-MIVM: (a) T-x-y (5–15 Pa), (b) P-x-y (1173–1373K).
Download figure:
Standard image High-resolution image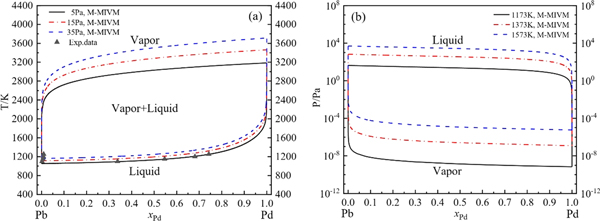
Figure 7. VLE phase diagrams of Pd-Pb alloy based on M-MIVM: (a) T-x-y (5–35 Pa) and p. data at 35Pa [29], (b) P-x-y (1173–1573K).
Download figure:
Standard image High-resolution image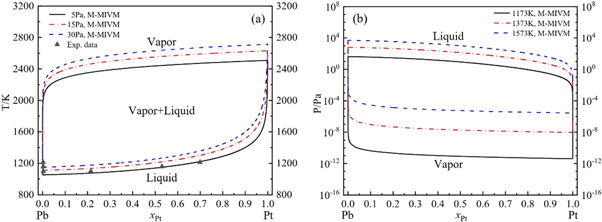
Figure 8. VLE phase diagrams of Pt-Pb alloy based on M-MIVM: (a) T-x-y (5–30 Pa) and Exp. data at 30Pa [30], (b) P-x-y (1173–1573K).
Download figure:
Standard image High-resolution image
It is founded that the calculation values are basically consistent with the experimental data in figures 5(a), 6(a) and 8(a). These deviations are inevitable and reasonable because of the complex experimental conditions, high temperature and low pressure in the procedure of intermittent and small-scale vacuum distillation.
Besides, the T-x-y phase diagrams show that the temperature fluctuation extent of vapor and liquid phase lines decrease with pressure of system reduction, indicating that the alloys can be separated more easily at lower pressure with less energy consumption. For example, for Au-Pb alloy, if Au purity is required to be larger than 0.999 (mole fraction), when the system pressure is decreased from 15 Pa to 5 Pa, the minimum design temperature can be decreased from 1907.6K to 1771.2 K.
The optimal experimental conditions of separation can also be acquired through T-x-y phase diagrams. For instance, if the precious metal purity is required to be larger than 0.999 (mole fraction), the temperature of separation is needed to be higher than 1369.7 K for Ag-Pb alloy, 1771.2 K for Au-Pb, 2176.9 K for Pd-Pb and 2304.7 K for Pt-Pb at 5 Pa.
Furthermore, the law of leverage can also be utilized into VLE phase diagram analysis to quantificationally forecast the amount of substance of distillate and residue under the condition of the separated temperature and pressure are determined. Take T-x-y phase diagram of Ag-Pb alloy as an example, suppose xE is the mole fraction of Pb in Ag-Pb binary system under the condition of the separation pressure and temperature of the system are 5 Pa and 1200 K, respectively. And then make a straight line that intersects the liquidus and gaseous lines at points A and B, respectively, as shown in figure 5(a). The components of A and B are xl and yg , respectively when the alloy system reaches VLE. According to the law of leverage:

where nl
and ng
are the amount of substance of residues and volatiles, respectively.  and
and  are the length of line of segment EA and EB, respectively.
If the total moles of raw materials are n (n = nl + ng ), then the moles of residues and volatiles (nl and ng ) can be calculated from equations (31) and (32), respectively:


where  is the length of AB.
The P-x-y phase diagrams of Ag-Pb, Au-Pb, Pd-Pb and Pt-Pb alloys with a certain temperature range were obtained based on M-MIVM. The P-x-y phase diagrams can be used to analyze the product component dependence of temperature or pressure in the process of vacuum distillation. In other words, if the temperature and system pressure of operation are selected based on VLE phase diagrams, the metal content in residue and volatile can be predicted.
4. Conclusions
In this work, the activities and activity coefficients of Ag-Pb, Au-Pb, Cu-Pb, Pd-Pb, Pt-Pb, Ag-Sb and Ag-Bi alloys were predicted using MIVM, M-MIVM, Wilson equation and NRTL model. The average standard deviation and average relative deviation of each model were calculated. The results show that the prediction deviations of M-MIVM are smallest among four thermodynamic models, indicating that M-MIVM is stable and reliable. The separation coefficients and VLE phase diagrams of Ag-Pb, Au-Pb, Pd-Pb and Pt-Pb alloys were calculated based on M-MIVM. The separation coefficients are much larger than one, indicating that they can be separated easily by vacuum distillation. The consistency between the VLE calculation values and the experimental data shows that the VLE phase diagrams calculated from M-MIVM are reliable. Based on the VLE phase diagrams obtained in this paper, the optimized and relatively accurate experimental conditions for separating Ag-Pb, Au-Pb, Pd-Pb and Pt-Pb alloys by vacuum distillation can be determined.
Acknowledgments
This work is financially supported by (1) Yunnan Fundamental Research Project, China (Grant No.2019FD037); (2) The High-level Talent Platform Construction Program of Kunming University of Science and Technology, China (Grant No. KKKP201752023); and (3) The Science and Technological Talent Cultivation Plan of Yunnan Province, China (Grant No. 2017HB009).
Data availability statement
All data that support the findings of this study are included within the article (and any supplementary files).