
Abstract
Earlier reports on rod-like conjugated molecules of similar shape and size such as α-sexithiophene (6T) and para-sexiphenyl (6P) indicated mixed crystal growth in equimolar blends. The spectral overlap between the 6P fluorescence and 6T absorption might there give rise to resonant energy transfer between the two species. In marked contrast to H-type aggregation found for 6T bulk crystals, isolated monolayers of 6T as well as 6T monolayers sandwiched between 6P multilayers have been reported to show pronounced green (instead of red) fluorescence, which has been attributed to J-type aggregation. Here, we investigate whether these altered optical properties of 6T translate from the monolayer to a bulk equimolar blend with 6P. Insight into the mixed crystal structure for vacuum co-deposited films of 6T + 6P is provided by using synchrotron grazing-incidence x-ray diffraction on different substrates. By correlating the optical properties of the pure and the mixed systems using absorption and photoluminescence spectroscopy we identify the green emission known from 6T monolayers to prevail in the blend. Our analysis indicates the formation of aggregates which are promoted by the molecular arrangement in the mixed crystal structure highlighting that the remarkable optical properties of 6T/6P heterostacks translate into mixed crystalline films. This study underlines that tuning the opto-electronic properties of organic semiconductors by blending species of similar shape but distinct opto-electronic properties is a promising pathway to achieve altered material properties.
Export citation and abstract BibTeX RIS

Original content from this work may be used under the terms of the Creative Commons Attribution 4.0 licence. Any further distribution of this work must maintain attribution to the author(s) and the title of the work, journal citation and DOI.
1. Introduction
Para-sexiphenyl (6P) has been intensively investigated due to its blue luminescence, thermal stability, and high quantum yield in the solid state and has been regarded as promising material in the research targeting organic light emitting diodes [1–3]. Equally, α-sexithiophene (6T) has been widely used in organic solar cells [4–6] and together with its alkylated derivatives in organic field effect transistors owing to a high field-effect mobility [7–9]. Apart from their individual properties, combinations of these rod-like molecules as layered systems have attracted much interest in the past. It has been reported that the emission from 6T/6P heterostacks can be tuned from yellow, red via white to blue by varying the stacking distance [10–14], and that in epitaxially aligned nanofibers grown by the periodic deposition of 6T and 6P the lasing properties of the nanofibers could be tuned from deep blue to the red–orange [15]. In principle, the significant overlap between the spectral range of 6P emission and 6T absorption makes it possible to have efficient resonance energy transfer (RET) between these materials [16], and for the layered 6T/6P system it was observed that the optical properties of these heterostructures differ considerably from those of the pure materials [10–17]. A characteristic green emission has been observed in the layered system, which adds to the blue and red emission from pristine 6P and 6T, respectively. In a study to investigate the green emission from that system, Schwabegger et al [17] performed photoelectron spectroscopy and found a sharp interface between the 6T as deposited on 6P and no evidence for electronic coupling between the individual 6T and 6P molecules. Therefore, the origin of the green emission has been explained by the contribution from interfacial, isolated 6T which adds to the emission from the pure materials in their bulk crystal structures. Notably, studies by Vogel et al suggested the possibility of mixed crystal structure formation by vacuum codeposition of 6T and 6P molecules, as deduced from specular x-ray diffraction (XRD) and Fourier-transform infrared spectroscopy (FTIR) [18, 19]. In the present study, we investigate whether mixed crystal growth indeed occurs in thin films of equimolar blends of 6T and 6P and whether the green emission observed for layered systems translates into such blends. By combining specular and grazing-incidence x-ray diffraction (GIXRD) we observe growth of a mixed crystalline structure similar to that of pristine 6P, which prevails both in lying and standing orientation. Via optical absorption and fluorescence spectroscopy we find that the green emission behaviour known from layered systems prevails in the codeposited films, which we explain by the underlying molecular arrangement (figure 1).
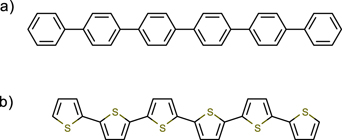
Figure 1. Chemical structure of (a) para-sexiphenyl (6P) and (b) α-sexithiophene (6T).
Download figure:
Standard image High-resolution image2. Methods
Thin films were deposited by physical vapour deposition under high vacuum conditions (base pressure: 2 × 10⁻⁸ mbar) using 6P and 6T from TCI chemicals. 6P was used as received while 6T was purified by thermal sublimation before use (see schematics of the setup in the supporting information figure S1 (https://stacks.iop.org/EST/3/034004/mmedia)). The codeposited film of 6T and 6P was grown using a 1:1 M ratio of the materials. For the depositions, 1 × 1 cm2 quartz slides, silicon wafers (prime grade) with a native oxide layer (referred to as SiOx in the following), and freshly cleaved highly oriented pyrolytic graphite (HOPG, ZYA quality) were used as substrates. The rate of deposition for all the films was set to 2 Å min−1 (rate of the individual materials and total rate) and was measured using a quartz crystal microbalance. To monitor the deposition rate during codeposition, first, we set the rate of the individual materials using a shutter; once the desired rate was set to be stable for both the sources, the substrates were exposed to the stream of vapours from the pure materials (see supporting information). The nominal film thicknesses of the codeposited films, as measured by the microbalance (using the average mass density of the pristine materials) was 30 nm for spectroscopy measurements and 20 nm for structural investigations.
The optical properties of the thermally deposited films were investigated using UV–Vis–NIR spectroscopy (UV–Vis–NIR), photoluminescence (PL) spectroscopy and infrared absorption spectroscopy (FTIR). The optical spectra were recorded on thin films deposited on quartz substrates. Optical absorption spectra of the samples were obtained by using Varian Cary 5000 UV–Vis–NIR spectrophotometer with an average time of 0.033 s and 1 nm data interval. The emission spectra were recorded using Horiba PTI Quanta Master 8075 spectrofluorometer (1 nm steps with 1 s per step integration time). Infrared absorption spectra were recorded using Thermo Nicolet 6700 spectrometer. For infrared absorption spectroscopy, thin films on SiOx substrates were used and the resolution of the infrared spectrometer was set to 4 cm−1.
For structural analysis, pure and mixed films of 6P and 6T were grown on freshly cleaved HOPG and SiOx by physical vapour (co-)deposition in the high vacuum. The films were characterized at beamline W1 at the synchrotron radiation facility DORIS (HASYLAB, Hamburg). GIXRD experiments were performed immediately after specular XRD (without altering the sample alignment) using a goniometer (by Risø) in pseudo 2 + 2 geometry and a one-dimensional detector (MYTHEN, Dectris); the use of a primary and secondary slit system (evacuated flight tube with entrance and exit slits behind the sample) allowed for recording high resolution data required for the precise determination of peak positions; the primary beam energy was 10.5 keV, peaks were fitted using Voigt functions. GIXRD experiments were performed using an incident angle of the primary beam relative to the substrates of 0.15°, alignment was done via surface reflection (SiOx ) and the HOPG (002) peak, respectively. Reciprocal space maps were recorded by keeping the sample fixed and performing a series of detector scans along the in-plane scattering angle at differently fixed out-of-plane scattering angle, thus relying on the fibre textured growth of the adsorbate (on SiOx ) and the fibre texture of the HOPG substrate, respectively. The vertical mounting of the detector allowed the simultaneous measurement of ca 3.5° in out-of-plane direction. The experimental diffraction pattern was transformed to reciprocal space using the custom-made software PyGID [20].
To determine the packing motif in the unit cell a combined experimental/computational approach was used, where to get the unit cell dimensions (table 1) a recently developed indexing routine [21] was employed. This crystallographic unit cell coming from experiment was then used as input for molecular dynamics simulations, which were carried out utilizing the LAMMPS software package [22] with the CHARMM general force field version 3.0.1 [23]. Several thousand trial structures are generated by placing one 6P and one 6T molecule with a random orientation in an expanded (140%) unit cell with periodic boundaries. No fixes are applied, and the molecules can freely move in this cell. During the simulation run, the unit cell was then continuously reduced in size to the experimentally determined value, while the molecules could find a relaxed conformation. Resulting candidate structures are clustered, based on their packing motif and high-energy solutions are discarded to make a final comparison of the calculated structure factors with the measured peak intensities from the GIXRD experiment (for our best solution see figure S5).
3. Results
3.1. Structural properties by x-ray diffraction
To investigate the growth of equimolar 6T + 6P blends we performed XRD and GIXRD on films grown on SiOx and HOPG, respectively, the results are shown in figure 2. The XRD results for the film on HOPG (top curve in figure 2(a)) shows, apart from the dominant HOPG (002) reflection, only one peak that we ascribe to the adsorbate. Its position at 1.406 Å−1 corresponds to a lattice spacing of 4.47 Å which is close to the strongest reflection of pure 6P, as calculated to 4.57 Å for the 6P single-crystal structure reported by Baker et al [24] (position indicated by a vertical dotted line in figure 2(a)); no indications of 6T related reflections are observed. We note that the deviation from the calculated 6P structure we observe for this peak is way beyond the error margin of our experiment for the following reasons: the HOPG (002) peak in figure 2(a) lies close to the reflection which we observe for the 6T + 6P film, therefore, the error margin due to sample misalignment and wavelength determination is expected to be similar for both reflections. As the measured HOPG (002) peak position agrees with the calculated value within 7 × 10⁻⁴ Å we expect the error margin of the adsorbate related reflection to be in the same range. Thus, the peak we observe in XRD on HOPG cannot be explained by pure 6P. In the XRD data of a nominally identical film on SiOx (bottom curve in figure 2(a)) we find a series of equally spaced peaks starting at 0.2361 Å−1 (position deduced from a fit of the third reflection) which corresponds to a lattice spacing of 26.61 Å and reminds of the (00ℓ) series observed for pure 6P deposited on isotropic substrates [26]; as on the HOPG substrate, we find no indication of 6T related XRD features. The lattice spacing we observe here is, again, significantly different to the calculated values for the (001) reflection of the two 6P polymorphs known to grow on isotropic substrates (β-phase: 25.97 Å [24, 26], γ-phase: 27.24 Å [27]). From the well-defined side-oscillations of the first two peaks (Laue oscillations) we can estimate the out-of-plane coherence length of the film to be 158 Å (±15%), which is close to the nominal film thickness of 200 Å. The similarity to the 6P single-crystal structure [24] is also evident from our GIXRD data for 6T + 6P on HOPG, which is shown in form of a reciprocal space map in figure 2(b). The peak positions calculated for pure 6P [24] are plotted in white for (−111)-texture (circle diameters correspond to calculated intensities). They lie close to, but deviate significantly from the experimental reflections; again, the strong reflections from the HOPG substrate (labelled by 'H' in figure 2(b)) can serve here as an internal reference for sample alignment. In the reciprocal space map, we also plot the calculated reflections for pure 6P in (−112)-texture, as this texture plane has a lattice spacing of 4.43 Å and is thus even closer to the XRD peak we observe (figure 2(a)); the calculated intensities (circles plotted in magenta) however are a much worse match for the experimental values. Overall, from these results we conclude that on both substrates 6T + 6P forms a mixed crystalline film. While similar to the that of single-crystalline 6P [2, 24], its structure is significantly altered due to the presence of 6T. We attempted to refine the unit cell parameters of 6P to match the GIXRD data of the mixed film on HOPG following an indexation method developed recently [21, 28, 29]. This yielded a triclinic 6T + 6P unit cell with the parameters given in table 1 juxtaposed with those of pristine 6P (in cell choice II) [24, 25]; see supporting information figure S5 for the reciprocal space map with the calculated reflections based on our refined 6T + 6P unit cell. Most notably, the lattice spacings of the (00ℓ) series calculated for the 6T + 6P unit cell match very well the XRD data for the mixed film on SiOx (e.g. the calculated (001) lattice spacing is 26.67 Å, the experimental value is 26.61 Å). This indicates the same mixed crystal structure to also grow on SiOx despite the different texture plane [(001) on SiOx , (−111) on HOPG].

Figure 2. Structural analysis of 6T + 6P films. (a) XRD on SiOx and HOPG substrates, calculated peak positions for pure 6P (cell choice II) [24, 25] are indicated by vertical dotted lines for the (−111) reflection on HOPG and the (003) peak on SiOx ; the asterisk marks a second order contribution by the substrate. (b) Reciprocal space map obtained by GIXRD on the film grown on HOPG showing the experimental data together with calculated reflections of pure 6P for (−111) orientation (white) and (−112) texture (magenta); diffraction intensity due to the HOPG substrate is labelled by 'H'. (c) GIXRD data for the film on SiOx (bottom) and plotted together with Debye–Scherrer rings calculated for the strongest reflections based on our structure solution (top), which highlights the occurrence of vertical Bragg rods and the similarity of the mixed crystal structure on both substrates.
Download figure:
Standard image High-resolution imageThe GIXRD data recorded for the film on SiOx (figure 2(c)) does neither show well-defined Bragg peaks as it would be expected for a crystalline, fiber-textured film (2D powder), nor Debeye–Scherrer rings reminiscent of a crystalline non-textured adsorbate (3D powder). Instead, we observe elongated vertical diffraction features at qxy positions which are indicative of the molecular herringbone arrangement of 6P (the most prominent being the -11ℓ, −20ℓ, −21ℓ series) [21], but no peaks in the out-of-plane direction. Such uncommon features are referred to as Bragg rods and are found in textured, crystalline monolayers due to the lack of out-of-plane periodicity [30, 31]. However, from our XRD data, owing to its strong and sharp diffraction features and pronounced Laue oscillations which allowed deducing the out-of-plane crystalline coherence length, we know that the film is certainly far thicker than a monolayer. Therefore, the occurrence of Bragg rods is indicative of a layered structure, where the individual layers show crystalline order only within the planes while the lateral position of the layers with respect to each other is arbitrary. Note that we have recently reported a similar growth mode for asymmetrically substituted 6P films on SiOx with two fluorine substitutions at the meta position of the terminal ring [32]. Still, however, our 6T + 6P unit cell refined for the film on HOPG matches well the experimental positions for the film on SiOx , as illustrated in figure 2(c), which strongly supports that the same mixed structure grows on both substrates (with different texture planes). Overall, our structural analysis strongly suggests mixed crystal growth to occur for equimolar 6T + 6P films in a crystal structure similar to that of pure 6P.
3.2. Fourier transform infrared spectroscopy (FTIR)
To spectroscopically investigate the mixed films and to gain information on the composition complementary to our diffraction data, we performed FTIR on the blend and correlated these data to that of the pure systems. Figure 3 shows FTIR spectra recorded on pure 6P, 6T and 6T + 6P films as codeposited on SiOx , the vibrational modes are labelled in accordance with previous studies [33–35]. The modes related to the out-of-plane γ(Cα –H) end-ring vibration and γ(Cp–H) para-substituted ring vibration of 6P show a blue shift of 1.7 cm−1 and 1.0 cm−1 respectively, upon codeposition with 6T. Similarly, the γ(Cβ –H) vibration of 6T shows a blue shift of 2.5 cm−1 in the codeposited 6P environment.

Figure 3. FTIR spectra of pure 6T (red curve), 6P (blue) and codeposited 6T + 6P (magenta) films grown on SiOx .
Download figure:
Standard image High-resolution imageThe feature in the FTIR data of the codeposited film which is most relevant to our study is the vanishing of the Davydov split peaks, which are originally at 687.7 cm−1 and 701.2 cm−1 for pure 6T. Instead, a peak at 687.7 cm−1 appears in the codeposited film. As its width is significantly broader than the pure modes we interpret it as a superposition of two neighbouring modes, the ring deformation δ(Cα –H) vibration of 6P (688.3 cm−1) and the out-of-plane end-ring bending γ(Cα –H) of 6T [18]. Importantly, the vanishing of Davydov split 6T peaks in the codeposited film is an indication of a change in the local environment of the 6T molecules due to the presence of 6P. Therefore, these data strongly support the notion of mixing on the molecular scale, and that no pure 6T phase precipitates in the mixed film. These results are in agreement with previous findings by Vogel et al [19].
3.3. UV–Vis–NIR spectroscopy
It is well established that blending organic semiconductors on the molecular scale can lead to gradual changes in the optical and electronic structure of the blend. Tuning the ionization energy of the mixed system is possible by changing the mixing ratio [36], which can be exploited to tune the open circuit voltage of organic solar cells [37]. Also, for rod-like organic semiconductors such as pentacene (PEN) and perfluoropentacene (PFP) it has been found that mixed crystal formation can translate into significantly altered optical properties of the blend. There, the emergence of a charge transfer absorption has been reported in blends of PEN and PFP [38, 39] which was promoted by a cofacial arrangement of the molecules in their crystalline structure [40–42] and led to effects like singlet exciton fission [43]. To investigate the optical properties of the 6T + 6P blend we performed UV–Vis–NIR spectroscopy on the mixed films and the pure films as reference, the results are shown in figure 4. Consistent with previous studies [44–46] pure 6P displays strong absorption in the range between 3–4 eV, with an absorption onset at 3.1 eV (blue curve in figure 4). The absorption in this region has been assigned to fundamental π → π* transitions of 6P molecules with their long molecular axis oriented almost perpendicular to the substrate (referred to as 'standing' in the following). Likewise, the absorption spectrum of pure 6T (red curve in figure 4) shows the known characteristics of 6T films with an absorption maximum around 3.4 eV (labelled as T4) and weaker features around 2.4 eV, 2.6 eV and 2.8 eV (peaks labelled as T1 ... T3) [47,48]. The origin of these absorption features has been under debate in earlier papers on the opto-electronic properties of 6T [48–53]. It has been concluded that the fundamental π → π* transition of 6T occurs from the symmetric 11Ag ground state to the asymmetric 11Bu excited state [54]. For 6T in solution [48] and if isolated in a polymer matrix [47] this transition (peak) is found around 2.8 eV and 2.4 eV, respectively, while in the condensed phase it is heavily hypsochromically shifted to 3.4 eV. This has been explained for 6T crystals by Davydov splitting of the 11Bu excited state with all oscillator strength on the higher energy level [47, 54] and a remarkable degree of Davydov splitting of ca 1 eV [47, 55]. Note that like 6P [24], 6T also grows in a herringbone crystal structure. It exhibits four molecules per unit cell, parallel long molecular axes, a planar all-trans configuration, and molecular planes between nearest neighbours inclined by 60° which can promote such a splitting [56]. Also, absorption of 6T is largely influenced by the order of the molecules in the film. In films of multilayer thickness (in the following referred to as 'bulk') on dielectric substrates the long molecular axis of 6T tends to grow standing on the substrate surface, however, with some film portion also adopting an orientation parallel to the surface ('lying') [57]. Notably, the growth on dielectric substrates such as SiOx is increasingly complex as it depends strongly on preparation conditions whether polymorphism in thin films with the occurrence of a standing disordered phase together with crystalline 6T is found [50, 58, 59]. The absorption spectra for 6T films have been found to depend on the film thickness where intensity in the low energy transitions has been ascribed to increasing disorder in the films, which breaks the selection rule and makes forbidden transitions partially allowed [60]. Thus, although the transition to the lower Davydov band is expected to carry no oscillator strength, such an absorption around 2.4 eV (labelled T1 in our data in figure 4) has been observed in thin films correlating with our observations [47]. The energy separation of ca 0.2 eV between the peaks T1, T2 and T3 is close to the energy of the C=C stretching mode (∼0.18 eV) [51, 61–63] suggesting that T2 and T3 are then vibronic progressions of T1 [50, 64]. The pronounced absorption background in the spectrum of 6T below the fundamental transition can be explained by Mie scattering which comes into play when the crystallite size in a polycrystalline structure is in the range of the incident wavelength. Note that the marked dominance of T4 has also been discussed as H-aggregation in condensed 6T, that is, exciton coupling between molecules having parallel transition dipoles [48, 50, 60, 61].

Figure 4. UV–Vis–NIR spectra of pure 6T (red curve), pure 6P (blue), and codeposited 6T + 6P (magenta) films on quartz; features discussed in the text are labelled.
Download figure:
Standard image High-resolution imageWe now turn our attention to the absorption of the equimolarly mixed 6T + 6P film (magenta curve in figure 4). Here, we observe a marked difference to the spectra of the pure films: features T1, T2 and T3 now become dominant in the spectrum, while the formally strongest 6T transition T4 is no longer detected. As we know from our FTIR data, Davydov splitting of 6T does not prevail in the 1:1 blend indicating the formation of a mixed crystal structure (vide supra), which is also strongly suggested by our structural analysis, absorption peaks T1 ... T3 cannot stem from transitions into the lower Davydov band. As they occur at the same energies as in the pure film, we rather ascribe these peaks to transitions of the isolated molecules, possibly with some extent of J-aggregation in the blend (see also our PL data below), as T1 is found redshifted as compared to 6T in a PET matrix [47].
3.4. Photoluminescence spectroscopy (PL)
To finally explore whether green emission reported for monolayers of 6T prevails in the mixed crystal structure, we performed photoluminescence spectroscopy on pure 6P, bulk 6T and the 1:1 codeposited 6T + 6P film on the various substrates. Figure 5 shows PL spectra of the films on SiOx using an excitation wavelength of 315 nm (3.95 eV) and 373 nm (3.33 eV) for pure 6P and 6T, respectively, and of 325 nm (3.82 eV) for the 6T + 6P film, which is thus well above the 6T absorption region. Note that due to the substantial spectral overlap between 6P emission and 6T absorption and their mixing on the molecular scale emission from the codeposited film is expected to comprise sensitized emission from 6T due to RET [11]. This is promoted by the fact that the transition dipole moments of both 6T and 6P are oriented along the molecular long axes [2, 10, 47, 65] and, thus, lie essentially parallel in the 6T + 6P blend based on the structure we determined (see table 1 and figure 7 below).

Figure 5. Photoluminescence spectra from pure 6T (red curve), 6P (blue) and codeposited 6T + 6P (magenta) films on SiOx . For better comparison, PL emission of pure 6P and the codeposited film has been normalized to 0–1 emission peak of pure 6P while the emission of pure 6T has been normalized to 0-1 emission peak of 6T.
Download figure:
Standard image High-resolution imageThe emission spectrum of 6T (red curve in figure 5) shows poorly resolved peaks which can be deconvoluted into four peaks using the Voigt function (figure S2) centred around 2.38 eV, 2.26 eV (0–0), 2.1 eV (0–1) and 1.94 eV (0–2). The energy separation of 0.16 eV between the latter three (in the range of the C=C stretching energy) indicates that they are the vibronic progressions of the same electronic transition. However, the peak at 2.38 eV does not fit into this series and must be of different origin. Its position is close to the reported value of the fundamental emission peak observed for a flat-lying sub-monolayer of 6T on silicon oxide (2.3 eV) [57, 63], where growth of a 6T monolayer between 6T bulk islands may give rise to this emission feature on SiOx . The fact that this peak is absent on the quartz substrate while the vibronic peaks are still observed (figure S2) supports this view, as quartz has a higher surface roughness and is thus expected to induce more three-dimensional growth. Alternatively, as 6T has been found to exhibit polymorphic growth on SiOx [50, 58, 59] we cannot fully exclude that transition to be the fundamental transition shifted due to the different packing. The other three peaks at lower energy and their intensity distribution are well in line with those found in a 6T single crystal with the dominating 0–1 emission peak indicating H-aggregate formation [57, 63].
The emission spectrum of 6P (blue curve in figure 5) shows well resolved peaks around 3.11 eV (0–0), 2.93 eV (0–1) (dominant peak), 2.76 eV (0–2) and another weaker feature around 2.58 eV (0–3). They are separated by 0.18 eV and can be well fitted by Voigt functions (figure S3). Note that the emission spectrum of 6P on quartz is very similar but shows no resolved vibronic features, likely due to disorder.
Due to the growth of a mixed crystal structure of 6T + 6P the PL spectra of the codeposited films are no simple superposition of the pure film spectra. Rather, several observed peak positions resemble those reported for lying monolayers of 6T sandwiched between 6P layers on muscovite mica and HOPG. There, 6T—in the following referred to as 'interfacial 6T' in accordance with literature [11, 13, 14, 66]—showed green instead of the red emission which is characteristic for the 6T bulk crystal structure; literature data taken from reference [11] is shown and fitted in figure 6(a) [11, 13, 14, 17]. We note that the time evolution of the green emission from 'interfacial 6T' has been investigated in detail in reference [11], where the authors deduced nonradiative energy transfer between 6P and 6T. As it is apparent in figures 6(b) and (c) for our codeposited films on HOPG and SiOx , respectively, the observed peak positions for the 6T related emission features can be well explained by 'interfacial 6T' (green curves) together with some contribution from bulk 6T (orange curve). We note that while the 6T related emission peaks on HOPG (i.e. in lying orientation) are perfectly aligned with those on the other two substrates, 6P emission is weaker there and the peaks appear slightly shifted (see figure S4 for full spectra). All PL spectra of the codeposited films have been fitted using the same peak parameters (number, position, and width) as determined for the pure films, the data for 'interfacial 6T' has been taken from reference [11].

Figure 6. (a) PL data for 'interfacial 6T' extracted from reference [11] and fitted with four Voigt functions (green curves). (b) Corresponding PL data recorded for the 6T + 6P film on HOPG; data is fitted with 'interfacial 6T' peaks (positions taken from (a)) and bulk 6T peaks (orange curves). (c) PL data recorded for the 6T + 6P film on SiOx again fitted with the peaks from 'interfacial 6T', bulk 6T, and with peaks assigned to 6P (blue curves); the fits of the pure spectra (bulk 6T, 6P) are provided as figures S2 and S3 in the supporting information; peak positions are provided in tables S3 and S4.
Download figure:
Standard image High-resolution imageIt has been suggested by Loi et al and Da Como et al for the lying sub-monolayer of 6T on SiOx that the PL has J-aggregate character [57, 63], which is in agreement with the findings for 'interfacial 6T' [14]. Note that charge transfer in the ground state between the species can be excluded on the basis of previous photoemission results [11]. Therefore, we regard our PL data as indication for J-aggregation of 6T in the co-crystalline 6T + 6P blend as well, which entails end-to-end alignment of neighbouring 6T molecules in the mixed crystal structure. Our tentative structure solution based on GIXRD revealed a unit cell volume capable of hosting two molecules, the length of the c-axis of 2.89 nm is essentially equal to the van der Waals length of 6P. Therefore, it can be expected that the molecules are not (much) inclined with respect to this axis and, thus, a 6T orientation suitable for J-aggregation is likely in the mixed crystal structure, which explains the green emission. Our attempts to model the 6T + 6P mixed crystal structure yields a structure of herringbone type with essentially parallel molecular long axes, calculated diffraction intensities match well the experimental ones (figure S5); this tentative structure solution is depicted in figure 7. This allows us to determine the angles between the molecular long axes and the respective texture planes of the films on HOPG and SiOx [(−111) and (001), respectively], which are <1° for HOPG ('lying orientation') and 74.7° for SiOx ('standing orientation'). We now recall the GIXRD data on SiOx where Bragg rods have been observed despite multilayer film thickness in the fibre-textured film, which indicates a structure which is crystalline within the layers (i.e. the crystallographic ab-plane) but in which the lateral position of the layers is arbitrary. For such a structure, in the statistical average, significant end-to-end alignment of 6T molecules is therefore expected, at least for half of the 6T molecules if the layers were indeed completely uncorrelated with each other. In addition, however, the PL spectra also show a contribution similar to the emission found for the 6T single crystals ('bulk 6T'). There, H-aggregation occurs due to side-by-side stacked molecules in the 6T herringbone structure. On the basis of our GIXRD data on SiOx we can conclude from the occurrence of the three strong qz -rods between 1.3 Å−1 and 2.0 Å−1 a structure of herringbone type (as it is found for both pristine materials as well) to prevail also in the mixed system. Therefore, H-aggregation of 6T can, in principle, occur also in the mixed film and dominate for those 6T molecules in the structure that are not suitable for J-aggregation. Note that systems showing both H- and J-aggregation and the prerequisites thereof have been discussed in great detail recently by Kreger et al [67], Hestand and Spano [68], Yamagata et al [69], and Eder et al [70], the latter demonstrating the possibility of reversible switching between H- and J-aggregation. Alternatively, the precipitation of bulk 6T cannot be entirely excluded, if too little to be detected by our XRD experiments, and if of too low concentration to be observed in FTIR. We regard this, however, as very unlikely given its expected significant contribution to the PL. Clearly, fully understanding the photophysics of the present system would require growing a mixed 6T + 6P single crystal of sufficient size to perform both PL and single-crystal XRD to precisely determine its crystal structure.

Figure 7. Sketch of the two extreme cases of interlayer arrangement that can occur for 6T + 6P films on SiOx together with the crystallographic unit cell suggested for the mixed structure and the proposed orientation of the molecules within the unit cell (the angle between the long molecular axes of 6P and 6T is smaller than 1°); the calculated GIXRD intensities for this tentative structure solution are shown together with the reciprocal space map of 6T + 6P on HOPG in the supporting information figure S5.
Download figure:
Standard image High-resolution image
4. Conclusions
We have detailed the structural and optical properties of equimolar vacuum codeposited films of the organic semiconductors 6T and 6P in order to assess how the optical properties of the individual species translate into a solid-state blend. From the disappearance of the characteristic Davydov splitting found in pristine, crystalline 6T, intimate molecular-level mixing could be concluded. Structural analysis by specular XRD and GIXRD corroborated this finding and pointed towards mixed crystal structure formation both in lying (on HOPG) and standing (on SiOx ) molecular orientation. The unit cell parameters deduced from GIXRD yielded a unit cell volume capable of hosting two molecules, which allowed us to conclude on the molecular orientation in the film to be of herringbone type. For the standing film on SiOx the occurrence of Bragg rods reveals that this crystalline order prevails in the layered mixed film, but that the layers are non-correlated with each other. The photoluminescence of the mixed films showed green emission in addition to the characteristic red and blue emission known for pure 6T and 6P, irrespective of the substrate. These observations can be explained by contributions of J- and H-type aggregation of 6T, which is supported by our absorption spectroscopy results of the mixed films as well as by the structural film properties deduced from XRD. Our study thus shows that the remarkable optical properties of 6T/6P heterostacks translate well into the mixed phase of this material pair and, once more, that tuning the opto-electronic properties of organic semiconductors through establishing blends of functional materials is a promising pathway to achieve altered material properties.
Acknowledgments
IS acknowledges financial support by the Natural Sciences and Engineering Research Council of Canada (NSERC) (funding Reference No. RGPIN-201805092), the Fonds de recherche du Québec-Nature et technologies (FRQNT) (funding Reference No. 2020-NC-271447), the Government of Canada's New Frontiers in Research Fund (NFRF), [NFRFE-2018-00725], and by Concordia University. RR acknowledges financial support by the Austrian Science Foundation FWF (Grant No. P30222). MBM acknowledges financial support by the Natural Sciences and Engineering Research Council of Canada (NSERC) (funding Reference No. RGPIN-2018-04391) and the Fonds de recherche du Québec-Nature et technologies (FRQNT) (funding Reference No. 2020-NC-271700).
Data availability statement
The data that support the findings of this study are available upon reasonable request from the authors.