
Abstract
The influence of the load on the elastic modulus in a polycrystalline age-hardenable Cu-2Be (wt%) alloy with different microstructures was studied. Nanoindentation measurements were carried out on homogenized samples (α phase), aged for 1 h at 400 °C (α phase with γ' precipitates) and aged for 10 h at 400 °C (α phase with γ precipitates). A sample of α Cu was also studied to compare its behavior with the values of the Cu-2Be specimens. The surface of the samples after unloading was analyzed by AFM images and the specimens with nanoprecipitates showed the presence of pile-up. The elastic modulus was estimated from the load-depth curves carried out at different maximum loads, using the Oliver and Pharr method and the method of the indentation work. From the Oliver and Pharr method, the modulus decreases with increasing maximum load, but this variation is reduced using the estimation by the indentation work method in some of the studied samples. Even so, a dependence of the modulus with the load is observed, especially in the α Cu-2Be sample and in the sample with γ' nanoprecipitates.
Export citation and abstract BibTeX RIS
1. Introduction
The Cu-2Be (wt%) alloy is an age-hardenable material that can exhibit special properties such as high strength and hardness, good corrosion resistance, non-sparking and non-magnetic qualities [1–3]. Due to these characteristics, this alloy is used in specialized applications such as high hardness, non-magnetic and spark resistant hand tools, blow molds, plastic injection molding and sensors, among others. The high strength and hardness properties are based on the formation of precipitates by aging treatments from the Cu solid solution (α phase) [4]. The precipitation sequence has been studied in detail and includes the formation of metastable nanoprecipitates before the formation of the stable γ phase [4, 5]: Guinier-Preston zones, γ' phase and γ' phase. The Guinier-Preston zones are formed by coherent monolayers of beryllium atoms, which pile-up in metastable spherical γ' phase as aging time increases [5]. After that, γ' precipitates grow, their shape changes to ellipsoids and γ' phase is formed [5, 6]. For longer aging times, the formation of the stable γ phase occurs with B2 structure [7].
The mechanical and physical properties of the Cu-2Be (wt%) alloys are strongly dependent on aging treatments and the formation of different precipitates. Some authors have studied the strengthening behavior of Cu-Be based alloys with beryllium contents of 1.9–2.0 wt% when different ageing treatments are carried out. Guoliang et al [4] found that the strength of the alloy increases considerably to more than 1 GPa after a treatment of 4 h at 320 °C due to the formation of γ' and γ' phases. Tang et al [8] analyzed the dependence of the nature of the precipitates formed on the mechanical properties of samples submitted to tension-compression tests. Montecinos et al [3] studied the influence of the microstructure on the Vickers hardness and the elastic modulus determined by the impulse excitation technique (IET) in an alloy submitted to aging treatments at different times up to 5 h and temperatures in the range 267 °C–407 °C. The maximum elastic modulus was obtained in the sample aged for 1 h at 407 °C due to the formation of metastable γ' nanoprecipitates, and no significant variation was found for longer aging. The hardness curve for the sample aged at 407 °C shows a similar behavior, but for times longer than about 1 h, a softening of the material is observed. Yagmur et al [9] studied the effect of the microstructure on the elastic modulus determined by a strain gauge in specimens subjected to tensile loads.
The elastic modulus and hardness of the material can also be characterized by instrumented indentation tests. In a recent work, the influence of the pile-up on nanoindentation measurements was studied in a Cu-2Be (wt%) alloy submitted to aging treatments of 1 h at temperatures in the range of 267 °C–407 °C [2]. However, it is known that the hardness determined by nanoindentation measurements shows a strong dependence on the applied load, which is commonly known as the Indentation Size Effect (ISE) [10–13]. Normal ISE occurs when higher hardness values are obtained at small depths compared to those obtained at greater depths. This effect has been reported in copper samples and has been modeled using the concept of geometrically necessary dislocations [10–13]. Montecinos et al [14] studied the dependence of the hardness with the load, determined by instrumented nanoindentation and Vickers hardness measurements on polycrystalline copper, β CuAlBe pseudoelastic and CuBe alloys. On the other hand, Dub et al [13] found that the elastic modulus of a Cu (111) single crystal obtained from nanoindentation tests decreases with the load. However, to our knowledge, no studies have been reported to date on the behavior of the elastic modulus with the load in age-hardenable Cu-Be alloys.
In this work, the influence of the load on the elastic modulus was studied in an age-hardenable Cu-2Be (wt%) alloy with different microstructures. Nanoindentation measurements were performed on samples aged at 400 °C for different times. The elastic modulus was determined from load-depth curves obtained by instrumented nanoindentation at different loads.
2. Materials and method
2.1. Materials
The material used in this work was a commercial polycrystalline Cu-2Be (wt%) alloy with some impurity elements such as Ni, Co and Si, with contents lower than 0.5%. The alloy was provided by Roberto Cordes S.A. as 10 mm diameter bars. The UNS (Unified Numbering System) for the material is C17200. For comparison, an electrolytic copper cylindrical bar of 6.4 mm diameter was also used. Samples of 2 mm thick were cut using an Isomet Low Speed Saw with a diamond disc. Then, they were homogenized for 10 min at 800 °C followed by quenching into water at room temperature, and a grain size of 0.04 mm was obtained. The specimens of Cu-2Be alloy were aged for 1 and 10 h at 400 °C to induce the formation of precipitates.
The samples were characterized by optical microscopy using a Leica DMI3000M microscope. They were previously electropolished in a satured solution of chromium trioxide in phosphoric acid at around 4 V and etched with ferric chloride for a few seconds. The intercept line method was used to estimate the mean grain size of the samples.
2.2. Nanoindentation measurements
For nanoindentation measurements, each specimen was smoothed with 600 and 1200 grit emery paper, polished with diamond paste of 3 μm size and alumina powder of 1 μm size. Then, the samples were washed and sonicated for 10 min in an ultrasonic bath to remove surface impurities.
Instrumented nanoindentation measurements were carried out according to the ISO 14577-1 test method using a Hysitron triboindenter at room temperature. A Berkovich diamond indenter with an included angle of 142.3° was used. The indentations were done under load control at different maximum loads and at a loading and unloading speed of 300 μN s−1 without holding time. At least ten indentations were done for each load in different positions of the sample, distant from each other and no significant differences were found between the measurements. The reported values correspond to the average for each load and sample. The load-depth curve of each indentation was obtained. Micrographs of the sample surfaces after the indentations were obtained by atomic force microscopy (AFM) using the Hysitron triboindenter. The depth profiles of the topographic micrographs were analyzed using the Gwyddion 2.47 software.
The elastic modulus was determined from the load-depth curves obtained by nanoindentation measurements and using the Oliver and Pharr method [14]. From this method, the reduced elastic modulus (Er ) is determined from the following relationship:

where S is the slope of the upper portion of the unloading curve and Ac is the projected contact area, which is a function of the contact depth (hc ) [15]:

The parameters C0, C1 and C2 were determined experimentally using a calibration tip function carried out on fused quartz.
According to the Oliver and Pharr method, hc can be determined for a Berkovich indenter as follows:

where hmax is the maximum depth and Pmax is the maximum load. For samples with pile-up, hc was estimated using the equation proposed by Loubet et al [16]:

In this way, the elastic modulus of the material (E) can be calculated from Er and knowing the properties of the indenter:

where νi = 0.07 is the Poisson's ratio and Ei = 1141 GPa is the elastic modulus of the diamond. ν is the Poisson's ratio of the material, and a value of ν = 0.35 was used for Cu-2Be [3].
3. Results and discussion
The homogenized Cu-2Be samples consist of a matrix of α phase, which corresponds to a fcc (Cu) solid solution, with an estimated mean grain size of around 40 μm. A representative optical micrograph is presented in figure 1. According to previous works, this material has a hardness of around 100 HV and an elastic modulus of around 121.5 GPa, determined by IET [3]. Representative load-depth (P-h) curves of indentations carried out at different maximum loads in the homogenized Cu-2Be samples are shown in figure 2(a). Topographic images were obtained by AFM on the surface of the samples after the indentations made at different maximum loads. A topographic image of the sample after the indentation at 6 mN and a 3D image are presented in figures 3(a) and (c). The depth profiles along each of the three directions were obtained using the Gwyddion software. Representative profiles for some of the maximum loads are shown in figure 2(b).

Figure 1. Micrograph of a homogenized Cu-2Be sample.
Download figure:
Standard image High-resolution image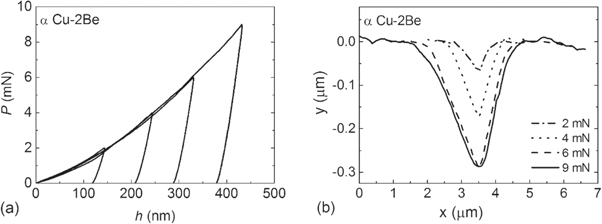
Figure 2. (a) Representative P-h curves of indentations carried out at different maximum loads in homogenized Cu-2Be samples (α phase). (b) Depth profiles of surfaces after the indentations at different maximum loads.
Download figure:
Standard image High-resolution image
Figure 3. Topographic images obtained by AFM of the surface of the homogenized Cu-2Be sample (a) and Cu-2Be sample aged for 10 h at 400 °C (b), after the indentation at 6 mN. (c) and (d) correspond to the 3D images of (a) and (b), respectively.
Download figure:
Standard image High-resolution imageAccording to a previous work with the same alloy [3], the microstructure of the samples aged for 1 h at 400 °C consists of a matrix of an α phase with around 17%v of metastable γ' nanoprecipitates. The presence of this kind of metastable precipitate makes that the material presents the highest Vickers hardness values, and the peak for this temperature is reached for times between 0.5 and 1 h of aging. A hardness of 344 HV and an elastic modulus of around 134 GPa were reported in reference for a sample aged for 1 h at 400 °C [3]. It has been also reported that the yield stress of the sample with γ' precipitates is almost six times greater than that corresponding to the sample in α phase [4]. As the aging time increases, the material softens slightly and the elastic modulus remains almost constant due to the formation of the stable γ nanoprecipitate. The hardness of the material aged for longer times, in the range 3–5 h, has been reported to be around 315 HV, the elastic modulus for the material aged for 4 h is around 134 GPa, and the volume fraction of precipitates is 17%v [3].
In the present study, Cu-2Be samples aged for 1 and 10 h at 400 °C were analyzed. According to previous studies, the sample aged for 1 h at 400 °C corresponds to an α matrix with metastable γ' nanoprecipitates, while the sample aged for 10 h at 400 °C would correspond to a matrix of α phase with γ nanoprecipitates. P-h curves were obtained at different maximum loads from nanoindentation measurements for Cu-2Be samples with γ' and γ nanoprecipitates. A maximum depth of around 300 nm was reached for both samples for the maximum load of 9 mN. Representative curves carried out at different maximum loads in the sample with γ precipitates are shown in figure 4(a). On the other hand, the sample without precipitates reached a depth around 430 nm for the maximum load of 9 mN (figure 2(a)). Lower indentation depths are reached in samples with precipitates compared to those obtained for the same loads in the sample without precipitates. This behavior is associated with the hardening of the material produced by the presence of precipitates. Representative profiles for some of the maximum loads in the sample aged for 10 h at 400 °C are shown in figure 4(b). A topographic image of the sample after the indentation at 6 mN and a 3D image are presented in figures 3(b) and (d). The presence of pile-up can be observed in these images. The pile-up level of each sample was estimated from the topographic images obtained by AFM after the indentations using the ratio of the indentation depth considering the deformed surface (hrp ) with respect to the indentation depth considering the original surface (hm ) (figure 4(b)). The details of this methodology and the values obtained for Cu, α Cu-2Be and Cu-2Be with γ' precipitates at different maximum loads are presented in [14]. α Cu-2Be does not exhibit pile-up for any of the loads in the range of 2 to 9 mN. The sample Cu-2Be with γ' precipitates exhibits pile-up for loads greater than 4 mN. On the other hand, the sample Cu-2Be with γ precipitates exhibits pile-up for all the loads, as can be seen in the depth profiles presented in figure 4(b), with ratios hrp /hm higher than 1.1.

Figure 4. (a) Representative P-h curves of indentations carried out at different maximum loads in Cu-2Be samples aged for 10 h at 400 °C (α matrix with γ precipitates). (b) Depth profiles of the surfaces after indentations at different maximum loads.
Download figure:
Standard image High-resolution imageThe elastic modulus of each sample at the different maximum loads was estimated using equations (1) to (5). For cases where hrp /hm was higher than 1.1, it was considered that the sample presents a considerable pile-up for this maximum load, and the Loubet correction was used for the calculation of the contact depth (equation (4)). Otherwise, equation (3) was used. The values of the elastic modulus obtained for each sample and maximum load are presented in figure 5. A decrease in E is observed as the maximum load increases for all Cu-2Be samples up to a load of 6 mN. For higher maximum loads, the sample with γ' precipitates presents a slight increase in E. The homogenized Cu-2Be specimen presents values of E close to those of the sample with γ' precipitates up to 6 mN, while the sample with γ precipitates presents higher values. By way of comparison, the values obtained for a polycrystalline Cu sample are shown, whose elastic modulus was obtained from indentations made at different maximum loads and using the same methodology mentioned for the Cu-2Be samples. Cu presents the lowest values of E among the different samples, and also a decrease with the maximum load up to 6 mN. From there on, E presents a slight increase. Qian et al [17] found a similar behavior in a single crystal Cu sample, while Dub et al [13] found a continuous decrease in E with the maximum load for a Cu (111) single crystal specimen.
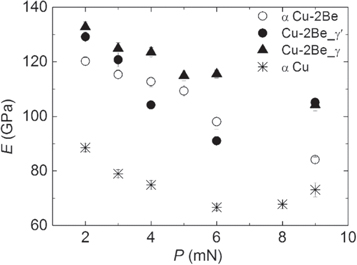
Figure 5. Variation of E with the maximum load for samples submitted to nanoindentation.
Download figure:
Standard image High-resolution imageAs reported in a previous work [2], the assumption that the unloading is completely elastic and the presence of a negative slope at the beginning of the unloading can lead to some errors in the estimation of E by the methodology used due to errors in the calculated slope S. Therefore, the relationship between hardness, Er and the work of indentation studied by Cheng et al [18–20] can be used to estimate Er :

where Wtot is the total work done by the indenter and Wu is the work done by the material to the indenter during unloading. H is the hardness and Cθ is a dimensionless parameter, which depends on the indenter angle and is independent of the work-hardening behavior [18]. Wtot and Wu were determined from the areas under the P-h curves. Wtot corresponds to the area under the loading curve, while Wu corresponds to the area under the unloading curve. Wu /Wtot is the relationship between the elastic recovery work and the total work, and the average values obtained for each sample at each maximum load are shown in figure 6. The Wu /Wtot ratios remain almost constant, exhibiting only slight variations with maximum load. Cu and homogenized Cu-2Be exhibit the lowest values, in the range 0.10–0.15. Cu-2Be with γ' precipitates presents values around 0.25, while Cu-2Be with γ precipitates presents values between 0.25 and 0.3.
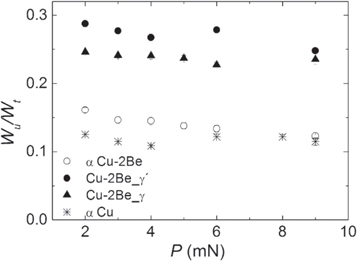
Figure 6. Variation of Wu /Wtot with the maximum load for samples submitted to nanoindentation.
Download figure:
Standard image High-resolution imageThe parameter Cθ was estimated from the relationship derived in [2]:

where m is the exponent of the unloading curve and was determined for each curve. Cθ was calculated using equation (7) for all samples and maximum loads, and the average values obtained for each sample are shown in table 1. The values are in the range 7–9, where the Cu-2Be sample with γ precipitates has a higher value of Cθ . The α Cu and α Cu-2Be samples exhibit the lowest Cθ . In previous studies, values between 5 and 10 of Cθ have been reported [2, 18, 19].
Table 1. Values of Cθ obtained for each sample.
| Cθ | |||
|---|---|---|---|
| Cu-2Be | Cu | ||
| α | α + γ' | α + γ | α |
| 7.7 ± 0.2 | 8.1 ± 0.1 | 8.8 ± 0.3 | 7.9 ± 0.4 |
From the values of Cθ shown in table 1, the Wu /Wtot ratio shown in figure 6 and the hardness values estimated with the Oliver and Pharr method [15], Er was estimated for each sample and maximum load using equation (6). E was estimated from these values of Cθ using equation (5), E(Cθ ). The variation of E(Cθ ) with the maximum load for different samples is presented in figure 7. The modulus calculated from the Oliver and Pharr method and presented in figure 5 is also included as E(O-P).

Figure 7. Variation of E with the maximum load for samples submitted to nanoindentation: (a) α Cu-2Be; (b) Cu-2Be_γ'; (c) Cu-2Be_γ; (d) α Cu.
Download figure:
Standard image High-resolution imageIt can be seen in figure 7 that the elastic modulus estimated from Cθ is higher than that estimated by the Oliver and Pharr method for all samples and maximum loads. In the α CuBe sample, E(Cθ ) presents almost constant values for maximum loads up to 5 mN, and then it decreases similarly to E(O-P) (figure 7(a)). In the Cu-2Be_ γ sample, E(Cθ ) decreases more slowly with the maximum load with respect to the decrease of E(O-P), by around 20 GPa between 2 and 9 mN (figure 7(c)). However, in the Cu-2Be_ γ' sample, E(Cθ ) presents a similar behavior with the load with respect to E(O-P), with a decrease of around 45 GPa between 2 and 9 mN (figure 7(b)). In the α Cu sample, E(Cθ ) presents values in the range of 90 to 120 GPa, with an average modulus of 104 GPa (figure 7(d)). The values of the elastic modulus obtained by IET (EIET ) reported in [3] for the same alloys and aging treatments are also indicated in figure 7. There is a high concordance between EIET and those corresponding to E(Cθ ) for the highest maximum loads. According to the values of EIET reported in [3], it would be reasonable to think that after 10 h of aging there would be an elastic modulus similar to that of the sample with 1 h of aging at 400 °C, of 134 GPa. E(Cθ ) for 9 mN of maximum load corresponds almost perfectly to this value.
As was mentioned above, it is known that the hardness presents an ISE effect with the maximum load. A normal ISE effect has been reported for some copper-based alloys in a previous work [14]. In the present work, an effect of the maximum load on the elastic modulus was found. The decreasing of the elastic modulus with the maximum load is more pronounced for E(O-P). The modulus estimated from the indentation work shows smaller variations of E(Cθ ) as a function of the maximum load, especially in the Cu-2Be_γ sample and in the α CuBe sample at low loads. Although the variation of the modulus with the load is reduced using the estimation by the indentation work method in some of the studied samples, even so, a dependence of the modulus with the load is observed. These results would highlight the fact that the decrease in the modulus with load is not an artifact of the methodology of estimation. It is important to note that the values of the contact depth were corrected in the samples that presented pile-up.
In principle, the elastic modulus values would be expected to be independent of the test conditions under nanoindentation measurements. However, other researchers have also found a decrease in the elastic modulus with the applied maximum load for different materials, especially for Cu [13, 17]. The mechanism by which the elastic modulus would present higher values for lower applied loads is uncertain and there are no models in this regard in the literature.
To analyze the effect of the microstructure on the dependence of the modulus E(Cθ ) with the maximum load, a normalized modulus was calculated for each sample and maximum load as E(P)/E(P = 2 mN). The variation of the normalized modulus with the maximum load for each Cu-2Be sample is presented in figure 8. It can be observed that the Cu-2Be_γ sample presents the lowest variation, while the other samples present similar variations. According to a previous work, a sample aged for 1 h at 400 °C and that aged for 4 h at 400 °C have approximately the same volume fraction of precipitates γ' and γ, of around 17%, respectively [3]. Therefore, the sample aged for 10 h at 400 °C is expected to have a similar volume fraction of γ phase. However, Zhang et al [21] studied the metastable precipitates in a Cu-2Be (wt%) alloy and reported that γ' precipitates are semi coherent with the matrix, while γ precipitates are non-coherent with the matrix. The differences in the behavior of the samples with different metastable nanoprecipitates could be associated with the coherence of the precipitates with the matrix.

Figure 8. Variation of the normalized modulus as a function of the maximum load for Cu-2Be samples submitted to nanoindentation.
Download figure:
Standard image High-resolution image
4. Conclusions
The influence of the load on the elastic modulus was studied in an age-hardenable Cu-2Be (wt%) alloy with different microstructures. Nanoindentation measurements were carried out on homogenized samples (α phase), aged for 1 h at 400 °C (α phase with γ' precipitates) and aged for 10 h at 400 °C (α phase with γ precipitates). The elastic modulus was estimated from load-depth curves obtained by instrumented nanoindentation at different loads. A sample of α Cu was also studied to compare its behavior with the values of the Cu-2Be sample.
The P-h curves for different maximum loads in the samples with γ' and γ precipitates show similar values, with a maximum depth around 300 nm for the maximum load of 9 mN, while the sample without precipitates has a value around 430 nm. The surface of the samples with nanoprecipitates also shows pile-up after unloading. The contact depth was corrected in the samples with the presence of pile-up. The ratio of elastic recovery work to total work presents only slight variations with the maximum load for all samples. The α phase samples show the lowest values of this ratio in the range of 0.10–0.15, while the samples with precipitates show the highest values.
The elastic modulus was estimated from the Oliver and Pharr method and using the method of the indentation work. Although the variation of the modulus with the load is reduced using the estimation by the indentation work method in some of the studied samples, even so, a dependence of the modulus with the load is observed. The α Cu-2Be sample and Cu-2Be_γ' sample present the highest variation of the elastic modulus with the maximum load. These differences in the behavior of the samples could be associated with the coherence of the precipitates with the matrix.
Acknowledgments
This work was supported by Consejo Nacional de Investigaciones Científicas y Técnicas (CONICET), Argentina; Comisión de Investigaciones Científicas de la Provincia de Buenos Aires (CICPBA), Argentina; and SECAT (UNCPBA), Argentina. The authors would also like to thank to Bernardo Daga for his collaboration with the nanoindentation measurements and Techn. Dora Granate for her collaboration with the sample preparation.
Data availability statement
All data that support the findings of this study are included within the article (and any supplementary files).