

Abstract
This short note is a supplement to the paper 'Primary thermometry from 2.5 K to 140 K applying dielectric-constant gas thermometry' (2017 Metrologia 54 141–7). It deals with thermodynamic temperature measurements at the boiling point of the heavy isotope of helium (4He, 4 K) and the triple points of hydrogen (14 K) and neon (25 K). This is of special interest because recent data published in this temperature range have an unexpectedly large spread. The results presented in this short note show that the International Temperature Scale of 1990, ITS-90, is thermodynamically correct at 4 K and 14 K, but too high by about half a millikelvin at 25 K. Furthermore, care is given to two aspects of dielectric-constant gas thermometry in the low-temperature range. First, dielectric-constant gas thermometry can be applied for practical primary thermometry. The measurement of only one isotherm in one day yields a temperature value with an uncertainty order of a few tenths of a millikelvin. Second, the use of recent ab initio values for the virial coefficients of helium as a measuring gas can reduce the efforts significantly. Even one data pair of pressure and dielectric constant can yield a thermodynamic temperature value of uncertainty less than a factor of two larger compared to the uncertainty of the usually used fit evaluation. For 4 K and 25 K, the achieved final uncertainty for T is still larger than the realization uncertainty of T90. Thereby in the case of 14 K, both uncertainties are comparable.
Export citation and abstract BibTeX RIS

Original content from this work may be used under the terms of the Creative Commons Attribution 4.0 licence. Any further distribution of this work must maintain attribution to the author(s) and the title of the work, journal citation and DOI.
1. Introduction
The appendix 'Estimates of the differences T − T90' [1] of the Mise en Pratique ('practical realisation') of the definition of the kelvin [2] gives recommended estimates of the differences between thermodynamic temperature T and temperature T90 on the International Temperature Scale of 1990 (ITS-90) [3]. These estimates allow corrections to be made to T90 values when values of T are needed. The appendix is based on an evaluation of the existing thermodynamic data completed in 2010 by a working group of the Consultative Committee for Thermometry [4]. In some temperature ranges below the triple point of water (TPW), the uncertainty of the estimates approaches 2 mK, while the absolute differences T − T90 are smaller than 10 mK. To overcome this unfavourable situation, an international campaign of thermodynamic temperature measurements was organised mainly within the framework of the European Metrology Research Programme project 'Implementing the new kelvin' [5, 6]. In the paper [7], the results of measurements with a dielectric-constant gas thermometer (DCGT), carried out in the temperature range from 2.5 K to 140 K as part of this project, are described. Since recently published data [8] shows larger differences to formerly published DCGT data given in [7] (especially below 20 K), this short note deals with thermodynamic temperature measurements at the boiling point of the heavy isotope of helium (4He, 4 K) and the triple points of hydrogen (14 K) and neon (25 K). Connected with this, the application of DCGT for practical primary thermometry and the use of recent ab initio values for the virial coefficients to reduce the efforts significantly are discussed.
This short note is organised as follows. Since it is a supplement to the paper [7], section 2 gives only detailed references to the main papers, for the DCGT method, its working equation, and the experimental setup. Solely one new evaluation method is discussed in detail. In section 3, the primary experimental data and their uncertainty are described. Furthermore, the results of the evaluation of these new DCGT data are presented together with uncertainty estimates and compared with literature data. Section 4 provides the summary and conclusions.
2. DCGT principle, evaluation methods and experimental setup
DCGT is based on replacing the density in the equation of state of a gas by the dielectric constant ε, which is an intensive quantity. The dielectric constant is determined via the change of the capacitance C(p) of a suitable capacitor measured with and without the measuring gas. For an ideal gas, the replacement yields a simple relation between the pressure p and ε: p = kT(ε − ε0)/α0, where k and ε0 are the exactly known Boltzmann constant and electric constant, respectively, and α0 the static electric dipole polarizability of a gas particle. For a real gas, the interaction between the particles must be considered by combining the virial expansions of the equation of state and the Clausius–Mossotti equation [9]. Thus, for investigating the influence of particle interaction, isotherms can be measured.
Two different working equations of the form p(μ) with μ = γ/(γ + 3) and γ = (C(p) − C(0))/C(0) = εr − 1 + εr κeff p, where εr = ε/ε0 is the relative dielectric constant of the gas, are deduced in [9] for describing the isotherms. κeff denotes the effective compressibility of the capacitor, which describes the change of the capacitance only due to the mechanical deformation caused by the measuring gas. (The term 'effective' indicates the fact that each capacitor is a composite because small pieces of insulator materials are necessary to isolate the electrodes electrically.) At temperatures well below the TPW, the influence of the gas pressure on the capacitor dimensions is sufficiently described by using the lowest order with respect to κeff in the power expansion of the combination of the two virial expansions. The resulting low-temperature working equation (equation (10) in [9]) can be applied at the three temperatures treated in this short note.
DCGT can be used as a primary thermometer only if the molar polarizability Aε is known from fundamental principles or independent thermodynamic measurements with sufficient accuracy. Aε is defined as Aε = NA α0/(3ε0), with NA being the Avogadro constant. At present, a sufficiently accurate value for α0, obtained from ab initio calculations, is available only for helium, providing a relative uncertainty below one part per million (1 ppm) [10–13]. With the fundamental constants and their uncertainties published by CODATA in [14], and the value given in [13], Aε = 5.172 5408(5) × 10−7 m3 mol−1, has been obtained for 4He (the number in brackets is the standard uncertainty given as multiple of the last digit). The design of the capacitors used and the determination of their κeff is described in detail in [7, 15].
At the three measuring temperatures and pressures up to 0.3 MPa, virial expansions up to the fourth order are necessary to describe the measured isotherms. However, the fourth order evokes only a minor correction, so that an approximation with e.g. theoretical values for the virial coefficients can be applied. Thus, different evaluation methods are possible. The 'classical' evaluation used in [7, 16] is to perform a polynomial fit to the obtained pressure versus dielectric constant dependence. The slope of the linear portion of this dependence near zero pressure describes the ideal-gas behaviour. The fitting coefficient of the linear term is given by A1 = (Aε /RT + κeff/3), where Aε is the molar polarizability, R is the molar gas constant, and T is the thermodynamic temperature. For helium, a completely different evaluation method is applicable because theoretical values for the virial coefficients are available that have uniquely small uncertainties, see the overview of ab initio calculations given in [17]. In this work, ab initio values for the second density virial coefficient from [18]; the third density virial coefficient from [19]; the fourth density virial coefficient from [20]; the second dielectric virial coefficient from [21] together with the specified uncertainties have been used. For the third dielectric virial coefficient, there is still no theory available. Its calculation is the subject of ongoing investigation. Therefore, the experimental value from [22] was used. The influence of the corresponding term is so small that it is still valid to quote that the used input originates from ab initio theories. The working equation allows one to deduce an 'individual' value of thermodynamic temperature T from each data pair (p, μ). Then, the final value of T is the weighted mean of all 'individual' ones of an isotherm. (For the first time, the 'individual' evaluation of DCGT data was used in [17] for determining high-accurate second-virial-coefficient values of helium in the low-temperature range.)
The DCGT setup of the second generation, leading to the present results, is already described extensively in [23] and in full detail in [24]. A short summary of the major changes and improvements achieved, in comparison with this original equipment, is given in [7]. In view of the extremely small measuring effect, special emphasis was given to (i) the stabilisation of the measurement temperature at a level of a few 10 μK, (ii) the pressure measurement with a relative uncertainty of 3.6 parts per million (3.6 ppm) and (iii) the capacitance measurement with one part per billion (1 ppb), (iv) the individual determination of the effective compressibility of the measuring capacitor, and (v) the safeguarding of the purity of the measuring gas especially with respect to a dangerous contamination with water (resulting in a relative uncertainty component not larger than 1 ppm). The realisation of the ITS-90 is directly supported by the results of a European Key Comparison (inclusion of rhodium–iron resistance thermometer No. 229074 in the measurement campaigns, see [25]).
3. Primary data, evaluation, and uncertainty estimation
New triplets of temperature, pressure and dielectric constant (represented by the DCGT measuring quantity μ ≈ (εr − 1)/3) were measured with helium (purity 99.999 99%) as the working gas at the boiling point of the heavy isotope of helium (4He, 4 K) and the triple points of hydrogen (14 K) and neon (25 K). The complete dataset is given in table 1, in which the temperature is given on the ITS-90 (T90) together with its uncertainty (u(T90)). Each isotherm consists of seven data pairs of pressure p and quantity μ. Considering the time constants for thermalisation of the measuring system after changes of the gas pressures, seven pairs can be measured during one working day. The uncertainty values u(T90) have been deduced from the results of a European Key Comparison [25].
Table 1. The new DCGT dataset at 4 K, 14 K and 25 K is listed. For each isotherm, the triplet T90, p and μ is given, were μ is the measuring quantity used in the DCGT measurements, see text. The p and μ values are the result of one single isotherm measured within one day. The reference temperature is the PTB realisation of the ITS-90 applying capsule-type standard platinum and rhodium–iron resistance thermometers, especially rhodium–iron resistance thermometer No. 229074 (for details see [25]). The nominal purity of the measuring gas helium stated by the manufacturer, before further purifying procedures described in the text, was 99.999 99%. The measuring capacitor was C1, see [7].
| κeff × 1012 (Pa−1) | R229074(Ω) | T90 (K) | u(T90) (mK) | TDCGT (K) | u(TDCGT) (mK) | p (Pa) | μ × 104 |
|---|---|---|---|---|---|---|---|
| −2.349(4) | 6.796 82 | 3.998 09 | 0.13 | 3.998 20 | 0.17 | 4303.53 | 0.677 120 |
| 7226.34 | 1.145 786 | ||||||
| 10 150.31 | 1.622 433 | ||||||
| 15 996.61 | 2.599 493 | ||||||
| 21 842.14 | 3.611 094 | ||||||
| 30 613.27 | 5.202 246 | ||||||
| 45 227.83 | 8.091 487 | ||||||
| −2.349(4) | 10.065 24 | 13.764 59 | 0.19 | 13.764 66 | 0.16 | 15 992.25 | 0.723 879 |
| 30 604.37 | 1.387 347 | ||||||
| 45 213.85 | 2.052 736 | ||||||
| 74 437.56 | 3.389 642 | ||||||
| 103 657.97 | 4.734 214 | ||||||
| 132 882.09 | 6.086 680 | ||||||
| 162 103.10 | 7.446 651 | ||||||
| −2.349(4) | 11.992 51 | 24.555 68 | 0.19 | 24.555 12 | 0.21 | 45 211.76 | 1.144 842 |
| 74 433.92 | 1.884 509 | ||||||
| 132 877.36 | 3.362 925 | ||||||
| 162 098.60 | 4.101 692 | ||||||
| 191 319.69 | 4.840 096 | ||||||
| 249 762.89 | 6.315 715 | ||||||
| 308 206.95 | 7.789 641 |
As explained in the former section, different methods can be used for deducing values of the thermodynamic temperature T from the isotherm data. In this short note, the following three evaluation methods are discussed:
- (A)'Classical' evaluation: third-order polynomial fit after correcting of the pressure values using ab initio virial-coefficient values for the fourth-order virial-expansion term.
- (B)Different-order evaluation: the resulting coefficient A1 is the weighted mean of three A1 values obtained from fits of single to third order, where the higher-order virial-expansion terms up to the fourth order are approximated by theoretical ab initio results.
- (C)'Individual' pair evaluation: 'individual' T values are obtained from the data pairs applying the working equation and theoretical ab initio values for the virial coefficients up to the fourth order. The final thermodynamic temperature is the weighted mean of the 'individual' ones.
Table 2 gives the uncertainty budgets for the thermodynamic-temperature values obtained at the three measuring temperatures applying the three evaluation methods A to C. The type A uncertainty component of the fitting parameter A1 was deduced in each case using the maximum likelihood estimation [26]. For evaluation B, the minimum uncertainty of the three A1 values was used as a more realistic estimate compared to the weighted-mean uncertainty because the three data are highly correlated. In the case of evaluation C, the individual type A uncertainties of the single pressure points have been combined, and in the next step, the type B uncertainties as well as a component for the joint zero-pressure measurement was added.
Table 2. Results and uncertainty budgets for the differences TDCGT − T90 between the thermodynamic temperature measured with DCGT, TDCGT, and the temperature on the ITS-90, T90, determined applying evaluation methods A, B, and C, see text. The estimates are given in mK.
| Component | 4 K | 14 K | 25 K | |||||||||||||||
|---|---|---|---|---|---|---|---|---|---|---|---|---|---|---|---|---|---|---|
| Evaluation method | A | B | C | A | B | C | A | B | C | |||||||||
| pmin | pmax | Mean | pmin | pmax | Mean | pmin | pmax | Mean | ||||||||||
| Type A component | ||||||||||||||||||
| Fit coefficient A1 | 0.34 | 0.14 | 0.14 | 0.09 | 0.31 | 0.14 | ||||||||||||
| u(μ) and u(pres) | 0.30 | 0.18 | 0.13 | 0.39 | 0.20 | 0.14 | 0.75 | 0.28 | 0.28 | |||||||||
|
Type B estimates
| ||||||||||||||||||
| Susceptibility measurement (capacitance change) | 0.00 | 0.00 | 0.00 | 0.00 | 0.00 | 0.01 | 0.01 | 0.01 | 0.01 | 0.01 | 0.01 | 0.01 | 0.01 | 0.01 | 0.01 | |||
| T90 (realisation of the ITS-90) | 0.13 | 0.13 | 0.13 | 0.13 | 0.13 | 0.19 | 0.19 | 0.19 | 0.19 | 0.19 | 0.19 | 0.19 | 0.19 | 0.19 | 0.19 | |||
| Determination of the effective compressibility | 0.00 | 0.00 | 0.00 | 0.00 | 0.00 | 0.01 | 0.01 | 0.01 | 0.01 | 0.01 | 0.01 | 0.01 | 0.01 | 0.01 | 0.01 | |||
| Pressure (effective area) | 0.01 | 0.01 | 0.01 | 0.01 | 0.01 | 0.05 | 0.05 | 0.05 | 0.05 | 0.05 | 0.09 | 0.09 | 0.09 | 0.09 | 0.09 | |||
| Polarizability of helium | 0.02 | 0.02 | 0.02 | 0.02 | 0.02 | 0.03 | 0.03 | 0.03 | 0.03 | 0.03 | 0.03 | 0.03 | 0.03 | 0.03 | 0.03 | |||
| Surface layers (4He) | 0.10 | 0.10 | 0.10 | 0.10 | 0.10 | 0.03 | 0.03 | 0.03 | 0.03 | 0.03 | 0.02 | 0.02 | 0.02 | 0.02 | 0.02 | |||
| Surface layers (impurities) | 0.00 | 0.00 | 0.00 | 0.00 | 0.00 | 0.01 | 0.01 | 0.01 | 0.01 | 0.01 | 0.01 | 0.01 | 0.01 | 0.01 | 0.01 | |||
| Impurities in the measuring gas | 0.00 | 0.00 | 0.00 | 0.00 | 0.00 | 0.01 | 0.01 | 0.01 | 0.01 | 0.01 | 0.03 | 0.03 | 0.03 | 0.03 | 0.03 | |||
| Head correction | 0.02 | 0.02 | 0.02 | 0.02 | 0.02 | 0.03 | 0.03 | 0.03 | 0.03 | 0.03 | 0.03 | 0.03 | 0.03 | 0.03 | 0.03 | |||
| Correction using ab initio data | 0.00 | 0.13 | 0.01 | 0.13 | 0.04 | 0.00 | 0.11 | 0.00 | 0.15 | 0.06 | 0.00 | 0.12 | 0.01 | 0.28 | 0.11 | |||
| Combined standard uncertainty of T DCGT − T 90 | 0.38 | 0.25 | 0.34 | 0.28 | 0.21 | 0.25 | 0.25 | 0.44 | 0.32 | 0.25 | 0.38 | 0.28 | 0.78 | 0.45 | 0.37 | |||
| T DCGT − T 90 | −0.16 | 0.12 | 0.21 | 0.12 | 0.01 | 0.07 | −0.43 | −0.67 | −0.51 | |||||||||
| Weighted mean of (A to C) ((T DCGT − T 90 )A–C ) | 0.12 | 0.06 | −0.56 | |||||||||||||||
| Standard uncertainty u((T DCGT − T 90 )A–C ) | 0.21 | 0.25 | 0.28 | |||||||||||||||
aThese uncertainty estimates are based on recommendations of the Consultative Committee for Thermometry, calibrations and comparisons of pressure balances for determining the effective area, on literature data for the typical thickness of impurity layers on the capacitor plates, and analysis data (mass spectroscopy) for impurity concentrations in the measuring gas. bThis component is based on Monte-Carlo simulations performed with one hundred data sets randomized with the standard deviation of the input quantities.
The relative standard uncertainty of the pressure measurement is dominated by the uncertainty of the calibration of the pressure balance used, whereby the resolution of the balance of 0.1 Pa is included in the type A uncertainty component. Furthermore, the uncertainty of the correction of the pressure difference caused by the gas column (head correction) has been included in table 2. The relative uncertainty of the measurement of capacitance changes of order 1 ppb yields a relative uncertainty of the μ values of 10−9/μ. However, the uncertainty of a single μ value is only partly relevant for the temperature result [see the type B component 'susceptibility measurement (capacitance change)']. This is because several pairs of p and μ are fitted on an isotherm, which results in a type A uncertainty component for the errors of the inductive voltage divider used for balancing the capacitance bridge.
An overview of the results for the differences TDCGT − T90 and their uncertainties is also given in table 2. The uncertainty of the weighted mean value is again estimated by the minimum estimate for the three evaluation methods. The results support impressively the fact that the ITS-90 is thermodynamically correct at 4 K and 14 K. But it seems to be too high by about half a millikelvin at 25 K. The results obtained with the three evaluation methods A to C are graphically compared in figure 1. Remarkably, at all the three measuring temperatures, the differences of T − T90 estimates obtained at different pressures are found to be mutually consistent within the combined standard uncertainty estimates. A comparison of the DCGT results with literature data is shown in figure 2. The agreement between the actual determination of T − T90 with DCGT and the determination published in [25] is excellent for 4 K and 14 K, and in agreement within the expanded combined uncertainty at 25 K (expansion factor two), but not within the standard combined uncertainty. The reason for this cannot be completely clarified, but a list of differences between both data points makes clear that we have two almost completely independent setups. The results summarized in [25] are based on data taken in the years 1996 and 2006 with different capacitors, pressure balances and capacitance bridges. The ways for determining the effective compressibility of the measuring capacitors are the main difference. In contrast to the setup used for this new experimental campaign, the compressibility of the old capacitors have been determined with reference to a measurement at the triple point of argon (see [7]) and assuming that κeff is independent of temperature for the range below 84 K (possible changes have been included in the uncertainty budget). Furthermore, the ITS-90 reference used in this work (carried by thermometer No. 229074) is not the same as used in the previous work (No. 229075), but both thermometers have taken part in the Key Comparison EURAMET.T-K1 [25], and the difference T90(229074) − T90(229075) amounts to about 0.2 mK at 25 K. Applying this difference as a correction would bring both results into agreement within their standard uncertainties. Nevertheless, the authors believe that an agreement within the expanded combined uncertainty is perfectly satisfiable in view of the huge difference of the setups and the improvements made since 1996.
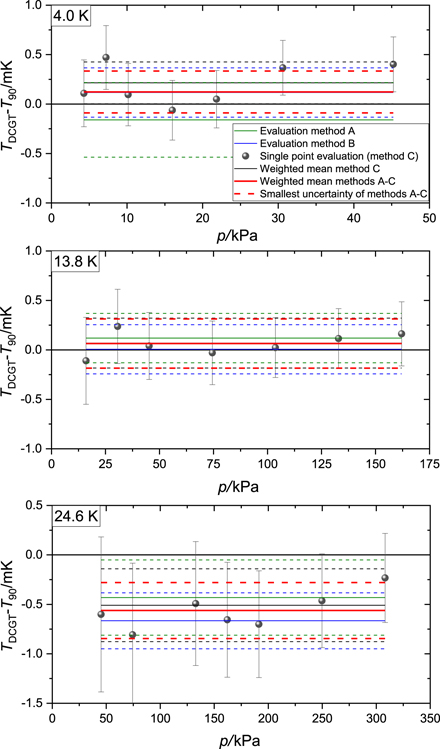
Figure 1. Comparison of the DCGT results obtained with the three evaluation methods A to C explained in section 3. The dots show the differences T − T90 resulting from the seven data pairs (p, μ) on the corresponding isotherm applying the working equation and theoretical ab initio values for the virial coefficients two to four. The bars represent the confidence intervals corresponding to the standard uncertainty estimates. The colours of the horizontal lines are as follows for the methods: red: A, blue: B, and black: C. The dashed lines give the standard confidence intervals.
Download figure:
Standard image High-resolution image
Figure 2. Comparison of the DCGT results listed in table 2 with literature data. The DCGT results obtained with three methods of analysis are shown as follows: red half-filled squares: A, red half-filled stars: B, red half-filled circles: C, filled red circles: weighted mean of A to C. The bars represent the confidence intervals corresponding to the standard uncertainty estimates. Recently published estimates for the difference T − T90 between thermodynamic temperature, T, and temperature on the ITS-90, T90, are shown as follows: black line: Fischer et al 2011 [4]; black dots: Gaiser et al 2017 [7]; half black triangle: Rourke 2020 [27]; half black diamonds: Gao et al 2020 [8]; half black stars: Ripa et al 2021 [28].
Download figure:
Standard image High-resolution image
4. Summary and conclusions
New data is presented for the difference between the thermodynamic temperature measured with DCGT, TDCGT, and the temperature on the ITS-90, T90, at 4 K, 14 K, and 25 K. This data shows that the ITS-90 is thermodynamically correct at 4 K and 14 K, but too high by about half a millikelvin at 25 K. The experiments performed verify that DCGT can be applied for practical primary thermometry. The measurement of only one isotherm with seven data pairs of pressure and dielectric constant in one day yields a temperature value with an uncertainty of order of a few tenths of a millikelvin. Furthermore, the use of recent ab initio values for the virial coefficients of helium as the measuring gas can reduce the efforts significantly. Even one data pair can yield a thermodynamic temperature value of uncertainty less than a factor of two larger compared to the uncertainty of the usually used fit evaluation. For 4 K and 25 K, the achieved final uncertainty for T is still larger than the realization uncertainty of T90. Thereby, in the case of 14 K, both uncertainties are comparable (see table 1).
Acknowledgments
This project 18SIB02 Real-K has received funding from the EMPIR programme co-financed by the Participating States and from the European Union's Horizon 2020 Research and Innovation programme.