
Abstract
X-ray computed tomography (XCT) can be used to measure the internal and external surfaces of an object non-destructively and with micron-level spatial resolution. XCT is therefore an appealing method for measuring and characterising the internal surface roughness of additively manufactured parts that cannot be accessed by traditional tactile and optical surface roughness instruments. In this work, an additively manufactured aluminium spherical surface roughness sample is designed, fabricated and its surface roughness measured via a focus variation microscope, the sample is then XCT scanned when embedded in varying thicknesses of surrounding material. A quantitative and qualitative comparison between the optical and XCT surface roughness measurements is made; the results show that the Sa of the XCT-based surface roughness measurements increases as a function of surrounding material thickness.
Export citation and abstract BibTeX RIS

Original content from this work may be used under the terms of the Creative Commons Attribution 4.0 licence. Any further distribution of this work must maintain attribution to the author(s) and the title of the work, journal citation and DOI.
1. Introduction
Additive manufacturing (AM) is capable of fabricating objects with a high degree of geometric complexity and with intricate internal structures, examples of such features include structural lattices and cooling channels. The surface texture of these internal features needs to be controlled for a number of reasons: the rough outer layer of a lattice structure may not be load-bearing and hence adds unnecessary, non-functional weight to AM components [1], rough surfaces act as stress concentrators and may initiate cracks that cause mechanical failure [2], and rough channel walls inhibit fluid flow and may lead to surface particles being dislodged causing blockages or damage downstream [3]. In order to control the surface texture of an additively manufactured surface, the surface must first be measured; the measurement of internal, inaccessible surfaces is a major challenge in the development of AM. Presently, AM researchers need to cut open samples to gain access to internal features in order to measure the surface roughness. Although this may be acceptable for lab-based developmental work, it is not an acceptable solution for manufacturing industries who need to non-destructively verify internal surfaces for all parts entering service. Therefore, a non-destructive technique for measuring internal surface roughness of AM parts is required. A promising technology for solving this measurement problem is x-ray computed tomography (XCT). XCT is a non-destructive, x-ray based scanning technique that generates a volumetric image (CT volume) of the scanned object. The CT volume reveals both the external and internal structure of the scanned object with micron-level spatial resolution. Image processing algorithms can be used to extract the surface of the object from the CT volume such that surface roughness measurements can be evaluated.
Using XCT to measure AM surface roughness has been considered in previous work. In early work by Kerckhofs et al [4, 5] the roughness of lattice structures was studied, the authors used cross-sectional 2D XCT images to extract roughness profiles from sub-millimeter scale AM struts. This approach unfortunately does not make full use of the 3D surface data available from XCT. Subsequent work by Thompson et al [6] compared a number of optical surface measurement techniques alongside XCT for the measurement of nominally flat AM samples. The results presented by Thompson et al showed that XCT is capable of capturing the complex surface topography of AM components, particularly deep recesses, overhanging and re-entrant features, all of which are measured poorly by optical methods. However, the lower resolution of XCT and the presence of XCT image artifacts in the XCT data inevitably led to discrepancies in the surface texture parameters evaluated from the optical and XCT data sets. Townsend et al [7] investigated the data processing workflow for extracting surfaces from XCT data, alongside the repeatability of XCT-based surface roughness measurements; the external surface of an AM aluminium cube was considered for this task. The authors developed a machined, calibrated reference object made of a similar material to the considered AM object, the calibrated dimensions of the reference object were used to minimise systematic surface determination and voxel size errors in the XCT based surface roughness measurement.
The limitation of the above reviewed work is that the majority of studies focus on the measurement of external, accessible AM surface roughness, and thus the key attribute of XCT—the ability to measure inaccessible internal surfaces—has not been fully exploited. Thompson et al did consider the measurement of an internal flat surface [8], but further investigations are required on non-planar surfaces, and on how the amount of material surrounding the internal surface influences the XCT-based surface roughness measurements, this being the focus of the present work.
In this work a dismountable aluminium spherical sample is designed, fabricated, and reference surface roughness measurements are made using an optical focus variation instrument. The spherical sample is then XCT scanned whilst embedded in increasing thicknesses of surrounding material and the surface roughness measurements compared to the optical results. The main contribution of this work is to study, for the first time, the influence of surrounding material thickness on XCT-based internal surface roughness measurements of metal AM samples.
2. Method
In this section the design of the reference sample used in this work is described (section 2.1), the reference optical surface roughness measurements are described (section 2.2) and the XCT scanning and data processing steps are described (sections 2.3 and 2.4).
2.1. Dismountable aluminium spherical roughness sample
Given that planar AM surfaces have been considered in previous work, in this work a non-planar surface is considered. A spherical form is chosen as it presents surface normals ranging from 0 to 90°, see figure 1. It is known that the surface normal influences AM surface roughness, see [9, 10]; the proposed design can therefore be used to further investigate the influence of surface normal on surface roughness. For example, the surface roughness could be analysed over a discrete range of surface normals, this information could be used to locally adapt subsequent surface modification processes. Undertaking such an investigation is out of scope of the present work, but illustrates the versatility of this particular sample design.
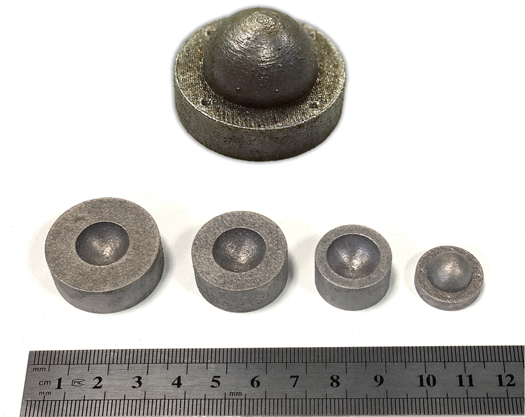
Figure 1. The top image shows the spherical AM surface, not shown to scale. The bottom image shows the spherical caps of different diameters alongside the spherical surface.
Download figure:
Standard image High-resolution imageThe roughness sample is chosen to be fabricated from aluminium to facilitate XCT scanning. Higher density materials such as titanium, steel and Inconel are more challenging to XCT scan with sufficient resolution since higher x-ray powers are required to penetrate such materials. A higher x-ray power leads to a larger x-ray focal spot size which leads to lower spatial resolution—assuming the sampling resolution (voxel size) is smaller than the focal spot size.
The size of the roughness sample is chosen to be small enough such that it can be XCT scanned with a sampling resolution of 10 μm, for the XCT system used in this work this condition requires the sample to be smaller than 20 mm, however, it is good practice not to use the entire field of view when XCT scanning due to Feldkamp artifacts [11], so we select the sphere to have a diameter of 12 mm.
A set of 3 hemispherical caps are used to mimic the spherical surface being embedded in surrounding material. The caps sit on top of the sphere, without touching the spherical surface of interest in order to avoid damaging the surface, the outer diameters of the caps are: 20 mm, 25 mm and 30 mm, see figure 1.
The samples are fabricated with a selective laser melting EOS M 290 metal printer with aluminium (AlSi10Mg) stock powder and the manufacturer's recommended fabrication settings. The samples have been wire cut from the base plate and loose powder has been removed by blowing the sample with compressed air, no further post processing of the surfaces has been conducted.
2.2. Reference optical surface roughness measurements
Reference optical measurements of the AM sample are conducted using an Alicona InfiniteFocus (Alicona Imaging GmbH, Austria) which is based on the focus variation measurement principle [12]. Based on our experience, this instrument is well-suited for the measurement of non-planar surfaces, hence its use in this work. A 10× objective magnification is used to measure the sample, giving an estimated vertical resolution of 0.5 μm and an estimated lateral resolution of 10 μm. A coaxial light and a ring light are used to illuminate the surface. Lateral stitching is used to extend the measurement area to 12 mm by 12 mm in order to measure the entire sphere.
2.3. XCT surface roughness measurements
The XCT surface roughness measurements are conducted using a Nikon XT H 225 ST (Nikon X-Tek Systems Ltd, UK) with the stationary reflection x-ray target installed. The x-ray acceleration voltage is set to 150 kV and the filament current is set to 65 μA, giving a focal spot size of approximately 10 μm. The x-ray acceleration voltage was chosen to achieve sufficient x-ray transmission through the object, and the current was chosen to achieve a bright enough x-ray image whilst keeping the detector exposure time short enough to minimise the scan time. The x-ray spectrum is filtered using a piece of aluminium 0.1 mm in thickness, this absorbs low energy x-rays hence making the subsequent x-ray attenuation more linear. The detector exposure time is set to 2 s, with a digital gain of 18 dB. A total of 1080 projections are acquired, giving an angular sampling interval of 0.33°, each projection is acquired twice and averaged to reduce measurement noise. The geometric magnification of the scan is selected to give a spatial sampling resolution (voxel size) of 10 μm in order to match the lateral sampling resolution of the optical measurements. These scan settings are selected to minimise scan time in order to minimise x-ray focal spot drift which can reduce the spatial resolution of the data.
The spherical roughness sample is XCT scanned 4 times, once with no surrounding material, once with 20 mm of surrounding material, once with 25 mm surrounding material, and once with 30 mm of surrounding material. The scan settings are unchanged for all scans. It is worth noting that for all the XCT scans there was sufficient x-ray penetration of the sample, and that based on the authors' experience, the settings chosen were in no way sub-optimal for any of the scan scenarios. The x-ray projections are reconstructed using Nikon's CT Pro software, a ramp filter is used for the filtering step in the filtered-backprojection reconstruction algorithm; this filter was chosen in order to avoid attenuating high spatial frequencies as per other backprojection filters which may influence the XCT-based surface roughness measurements.
After reconstructing the data, the volumetric CT data is converted to a point cloud surface representation using VGSTUDIO MAX 3.4 (Volume Graphics GmbH, Germany). The advanced surface determination method is used to extract the surface of the sample from the CT volume data, a local surface search distance of 4 voxels is chosen and a user-selected isosurface is used as the starting point of the search. The determined surface is extracted as a point cloud using the grid-based approach available in VGSTUDIO, with no simplification or refinement of the surface in order to preserve the approximately regular spacing of the surface points.
2.4. Data processing and surface roughness analysis
The data output from the XCT analysis software is an unstructured  point cloud, this data needs to be aligned with the optical surface measurement and interpolated such that there is a unique
  coordinate for each
  coordinate, where the
  coordinates are on a regularly spaced grid. The XCT point cloud data is aligned to the optical surface measurement data in GOM Inspect (GOM GmbH, Germany) using an iterative best-fit algorithm after a rough manual alignment. The aligned point cloud is then cropped to an 8 mm by 8 mm region around the crown of the sphere and interpolated onto a regular
  grid in Python 3. The aligned, interpolated data is then imported to TalyMap Platinum 7.2 (Taylor Hobson, UK) for subsequent roughness analysis.
All surface roughness analysis is undertaken in TalyMap Platinum 7.2. A sphere is fitted to the surface and subtracted to remove the nominal form of the surface. A Gaussian filter is then applied with a cutoff wavelength of 2.5 mm to remove any remaining geometric form and waviness. A short wavelength Gaussian filter with a cutoff wavelength of 0.05 mm is used to remove short wavelength noise from the surface measurement; the cutoff wavelength is selected as 5 times the lateral sampling interval (0.01 mm) based on the assumption that 5 sampng points are required to correctly sample a given wavelength, and any wavelengths shorter than this are therefore noise. A selection of areal height parameters of each surface are evaluated: Sa, Sq, Ssk and Sku [13]. The entire data processing workflow is illustrated in figure 2.

Figure 2. A flow diagram illustrating the various steps in the XCT data processing workflow. The first image is an x-ray projection, representing the data-acquisition step; followed by a volume rendering of the reconstructed CT volume, a cutting plane is used to reveal the spherical surface underneath the cap; next is the extracted spherical surface; followed by the cropped, aligned and interpolated surface; and finally, the scale-limited surface after form removal and short and long wavelength filtering.
Download figure:
Standard image High-resolution image3. Results
The scale-limited optical and XCT-based surface measurements are shown in figure 3. A visual inspection of the data shows that the data-sets are well aligned and the larger scale surface features are visible in both the optical and XCT-based measurements. It is clear that the surface measured with 30 mm of surrounding material is visibly noisier than the surface scanned with no surrounding material, notice the speckle noise pattern in the lower right-hand corner of figure 3(E) compared to figure 3(B).
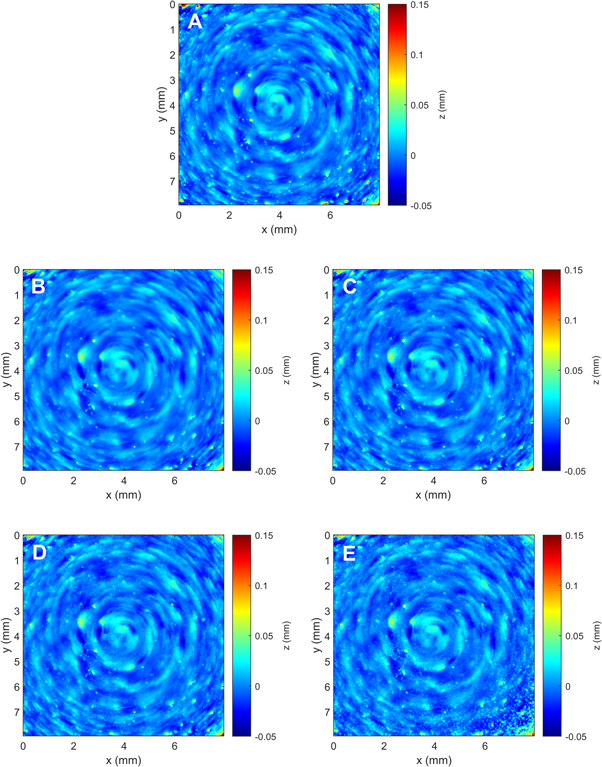
Figure 3. (A) Reference optical surface measurement. (B) XCT measurement with no surrounding material. (C) XCT measurement with 20 mm surrounding material. (D) XCT measurement with 25 mm surrounding material. (E) XCT measurement with 30 mm of surrounding material.
Download figure:
Standard image High-resolution imageFigure 4 shows line profiles evaluated across the center of each surface measurement. It is clear that the optical and un-surrounded XCT measurement are in closest agreement, whilst the profile becomes noisier as the surrounding material thickness increases.
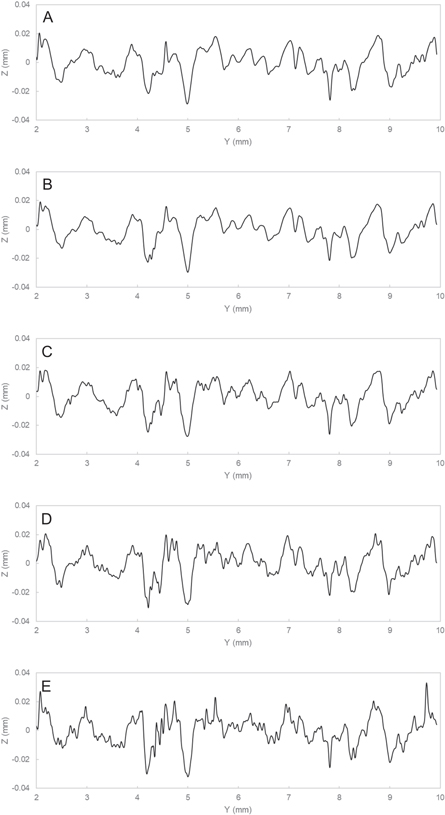
Figure 4. Line profiles from the surface measurements in figure 2. (A) Reference optical surface measurement. (B) XCT measurement with no surrounding material. (C) XCT measurement with 20 mm surrounding material. (D) XCT measurement with 25 mm surrounding material. (E) XCT measurement with 30 mm of surrounding material.
Download figure:
Standard image High-resolution imageThe agreement between the XCT and optical surface measurements can be quantified by subtracting each XCT surface from the optical surface and calculating the mean of the absolute difference, the results of which are plotted in figure 5. The results confirm that the XCT measurement of the sphere with no surrounding material is in closest agreement with the optical measurement as it has the lowest mean absolute difference, whilst the XCT measurement of the sphere surrounded with 30 mm of material is in least agreement with the optical measurement as it has the largest mean absolute difference. Thus, it can be concluded that the XCT surface measurement with no surrounding material is the most accurate, whilst the measurement accuracy decreases as a function of surrounding material thickness.

Figure 5. A plot of the mean absolute difference between the optical surface measurement and each of the XCT surface measurements. The lower the mean absolute difference the closer the agreement between the two surfaces.
Download figure:
Standard image High-resolution imageFigure 6 shows how the surface parameters change as a function of surrounding material thickness. For example, Sa increases from 8.0 μm to 9.1 μm, a percentage increase of 14%. The parameter Sq, behaves in a similar manner, increasing from 11.0 μm to 12.3 μm, a percentage increase of 12%. The kurtosis of the surface decreases by 46%, indicating that the spikiness of the profile decreases, in-fact the additional low amplitude noise is obscuring the dominant surface spikes, see for example the peak between Y = 4 to 5 mm in figure 4 and how the tip of the peak is changed as a consequence of noise. The skewness of the surface decreases by 31% suggesting that the surface height is becoming more evenly distributed about the mean plane.

Figure 6. Graphs showing how the Sa, Sq, Ssk and Sku of the surface changes as a function of surrounding material thickness with respect to the reference optical surface measurement.
Download figure:
Standard image High-resolution image
An explanation as to why the thickness of material surrounding the surface affects the XCT surface roughness measurements is now given based on classic x-ray physics. A beam of monochromatic x-rays of intensity  falls incident on a material object of thickness
  density
  and linear x-ray attenuation coefficient
  and emerges with intensity
  as governed by the exponential attenuation law:

Note that the linear attenuation coefficient  is a function of x-ray energy
  Lab-based XCT systems use a polychromatic x-ray source, this leads to the mean energy of the x-ray beam changing as it propagates through a material object. The mean energy of the x-ray beam changes because lower-energy x-rays are more easily attenuated than higher-energy x-rays. As the x-ray beam passes through a material object, the lower energy x-rays are preferentially absorbed by photoelectric absorption, or scattered by Compton or Rayleigh interactions, thus the mean energy of the x-ray spectrum increases. Using the x-ray simulation tool SpekCalc [14, 15], we simulate a polychromatic x-ray spectrum with a maximum photon energy of 150 keV and a prefilter of 0.1 mm of aluminium to match the experimental conditions of this work. The mean energy of the x-ray beam is 49.5 keV; after penetrating 20, 25 and 30 mm of aluminium the mean energy is 77.2, 79.9 and 82.2 keV respectively. Using the NIST XCOM database [16], the mass attenuation coefficients
  for aluminium are acquired and found to be 0.375, 0.208, 0.202 and 0.197 cm2 g−1 for the respective x-ray energies. Assuming the density of the aluminium part is 2.67 g and that the incident x-ray intensity is 216 grey values (the maximum intensity in a 16-bit grey value x-ray pjection), the intensity of the x-ray beam after passing through 1.2, 3.2, 3.7 and 4.2 cm of material (sphere diameter + surrounding material thickness) is: 19735, 11046, 8909 and 7187 respectively. What these numbers show is that an increasing material thickness and an increasing mean x-ray energy lead to an x-ray beam of decreasing intensity reaching the detector.
Net us consider the noise in the projection data and how it is influenced by material thickness. The photon noise of a detected x-ray beam is known to obey Poisson statistics [17], such that the detected signal is  If we calculate the signal-to-noise ratio (SNR) of the detected signal in decibels as
  then the SNR is 21.5, 20.2, 19.7 and 19.3 dB respectively. Therefore, we can see that the theory predicts that the SNR of the projection data decreases as surrounding material thickness increases.
The noise in the projection data will propagate through both the reconstruction algorithm and the surface extraction algorithm and will ultimately be superimposed on the extracted point cloud surface. Since surface extraction is based on either looking at local grey value contrast or local grey value gradient, it is elementary to see that the presence of noise will influence the extracted surface. The relationship between grey value noise and the measurement uncertainty due to surface extraction for XCT-based dimensional measurements has been explicitly studied in [18]. The influence of noise on grey value gradient edge detection is covered in introductory texts on image processing [19].
The SNR values evaluated above are correlated with the Sa values evaluated from the surface of the spherical workpiece embedded in increasing thicknesses of surrounding material. We use Pearson's correlation coefficient to quantify the correlation between the values, where a value of 1 indicates perfect positive correlation. The correlation coefficient is found to be −0.96, indicating a strong negative correlation, i.e. as the SNR decreases, the Sa increases; this result shows that the observed increase in Sa can be explained in terms of classic x-ray physics.
To verify this result experimentally, we create a region of interest that brackets the surface of the spherical workpiece in the reconstructed XCT volume data. The modal material grey values and the 68% dispersion of the material grey values are evaluated for each data-set, from which the SNR of the reconstructed data is calculated. The SNRs of the data-sets are found to be: 12.22, 12.15, 10.79 and 10.20 dB for surrounding material thicknesses of 0, 20, 25 and 30 mm respectively. Correlating these values with the Sa values as before gives a correlation coefficient of −0.89, thus indicating a strong negative correlation which verifies the above theory. Note that the theoretical SNRs are evaluated in the projection domain, whereas the experimental SNRs are evaluated in the reconstruction domain, this explains the difference in magnitude between the two sets of values. This concludes the x-ray physics-based explanation of why the thickness of material surrounding a surface influences XCT surface roughness measurements.
Looking at the results in figure 6, and considering only the Sa and Sq parameters, one would be tempted to conclude that the measurements conducted with 30 mm surrounding material lead to the most accurate surface roughness measurements. This is an incorrect conclusion as can be seen from figure 5, clearly the XCT surface measurement with no surrounding material most closely resembles the reference optical measurement, further evidence for this is provided by comparing the line profiles in figures 4(A) and (B).
It is to be expected that the XCT measurement leads to an underestimation of Sa and Sq compared to the optical measurements, this is due to the lower resolution of the XCT data. Although the lateral resolution of the XCT and optical data have been matched, the vertical resolution of the optical measurement is significantly higher and cannot be matched by the XCT data. The lower resolution of the XCT data will have a smoothing effect on the surface measurement result, hence leading to a lower Sa and Sq.
4. Discussion and conclusions
The results show that XCT based surface roughness measurements change as a function of surrounding material thickness. This means that if two identical surfaces are measured in a single XCT scan, with one surface located deep within the component and hence surrounded by more material, and the other surface located elsewhere in the component and surrounded by less material, then the two surfaces will be measured as having significantly different roughness parameters. This result indicates that XCT based surface roughness measurements are highly sensitive to the measurement conditions. Other influence factors such as the density of the material and the presence of artifacts in the XCT data are also likely to significantly influence XCT-based surface roughness measurements [20, 21] and need to be studied in future work. As a consequence of this sensitivity to the measurement conditions, the combined expanded uncertainty of XCT surface roughness measurements is likely to be very high.
In this work, no attempt was made to reduce the measurement noise of the XCT data. This was done in order to isolate the influence of surrounding material thickness on the surface roughness measurements. In order to compensate the increase in noise due to the increase in surrounding material thickness, the number of projection averages could be increased, additionally, more angular projections could be acquired, both of these changes in the scan conditions will lead to longer XCT scan times which in turn will lead to increased temporal drifts, such as focal spot drift and thermal expansion [22]. An entirely different approach to handling the increased noise is to smooth the grey values of the XCT volume prior to extracting the surface using image processing filters, as with all smoothing operations, this will lead to some loss of fine detail. The influence of such pre-processing steps should be considered in future work, some initial results on the subject are given in [23].
Only a spherical form has been considered in this work, other geometric forms should be considered in future work to check if the trends observed in this work can be generalised. As the field of XCT surface metrology continues to develop, reference objects with more realistic internal surface geometries should be studied, such as lattice structures and cooling channels. By developing a catalogue of calibrated reference samples fabricated from different materials and with different internal structures, it will be possible to better characterise the accuracy of XCT-based surface roughness measurements.
The problem of measuring the internal surface roughness of large complex objects fabricated from high density materials, such as nickel-based alloys, is a challenging one indeed. High-density materials require high-energy x-rays to achieve sufficient x-ray transmission. High-energy x-ray sources have large focal spot sizes, this is to prevent the focused electron beam burning and destroying the x-ray target, a small focal spot size is required for high-resolution x-ray images, thus there is a technical conflict between x-ray energy and focal spot size. One way to overcome this is to use detectors with smaller pixel sizes [24]. Alternatively, more intelligent scan strategies could be used whereby only regions of a part are scanned, and those regions are chosen based on minimising x-ray path lengths in order to mitigate the need for high-energy x-rays [25]. Such research directions should be considered in future work.
To conclude, it has been shown that XCT-based internal surface roughness measurements are influenced by surrounding material thickness. As the surrounding material thickness increases, the extracted XCT surfaces become noisier which in turn influences the evaluated surface roughness parameters. This result highlights the sensitivity of XCT based surface roughness measurements to the measurement conditions.
Data availability statement
The data that support the findings of this study are available upon reasonable request from the authors.