

Abstract
Waspaloy is one of the nickel-based alloys and its application is mostly positioned in the aerospace industry owing to its strength retaining capacity at higher temperature, better corrosion resistance, and toughness. Multi-response optimization technique, response surface methodology (RSM) was adopted to optimize the electrical discharge machining parameters during machining of Waspaloy. Various control factors such as peak current, voltage, duty cycle, and flushing pressure were selected with three levels. The material removal rate (MRR) and surface roughness (SR) were selected as response parameters for investigating the machining characteristics. A central composite design with five center points was used for experimental design. The best optimal set of control parameters were identified for the higher MRR and lower Sr The experiments have been validated by using analysis of variance and a confirmation test was conducted. From RSM, the optimum machining conditions for drilling the hole, namely, voltage: 125 V, flushing pressure: 0.8 kg cm−2, and peak current: 22 A and duty cycle of 20% have been identified. Further, this investigation highlights the formation and the effect of the recast layer by using scanning electron microscopy.
Export citation and abstract BibTeX RIS
1. Introduction
Aviation turbine has a huge demand for Waspaloy owing to its high-temperature strength, heat, and corrosion resistance. Nickel-oriented superalloys are the chief elements in the fields of rocket engines, gas turbines, aircraft, naval applications, spacecrafts, nuclear reactors, petro-chemical production, dental prostheses, and orthopedic applications [1–3]. It has creep resistance and fatigue resistance in oxidizing condition. It is available in the form of forged, rolled, and extruded which makes the priority factor for choosing as the fabrication material for aerospace industries. The intermetallic compound precipitations in face-centered cubic matrix are the primary cause for their high strength. The ultimate elongation resistance of the Waspaloy is superior to the Nimonic. At 21 °C, the ultimate strength of the Nimonic alloy is 745 MPa [4]. A dislocation faces restriction due to the hiked volume with respect to the fraction of the precipitates. This resulted in the corresponding enhancement in the hardness of the specified alloy. However, with regard to machine results, this material proved to be hard under a higher volume of tool wear and rough surface finish at a given room temperature [5]. This is the reason why a majority of nickel-oriented superalloys are often termed as 'complicated to machine' materials [6]. When the alloy undergoes machining, a high amount of tool wear was noticed. Similarly, periodic tool replacement occurs when a specific type of alloy undergoes machining, making the appearance of the adhesion wear. These specifications ultimately affect the company's net productivity [3]. This type of alloys exhibits poor machinability which makes it difficult to machine, creating the challenge to machine the superalloy with aggressive cutting conditions by the use of cubic boron nitride and ceramic tools [7, 8].
An unconventional machining process such as electrical discharge machining (EDM) is the best and appropriate for machining electrically carrying materials [9]. EDM is the suitable process for complicated-to-machine hard material and high strength materials [9, 10]. It has a great utility in the aero industry due to the capability of machining more complex shapes and also to machine the hard material [11–13]. EDM is otherwise called a reproductive shaping process where a pre-shaped tool electrode is made use of. This tool electrode, in the process, fixes the localized area where the spark erosion is expected to occur. The components produced thus are found to have the replica of the electrodes [14, 15]. The distilled water and kerosene are generally used as dielectrics. Copper (Cu), brass, graphite, silver tungsten, copper–tungsten alloy, and copper-infiltrated graphite electrode are used [16].
The selection of process parameters is more important to investigate the machining characteristics. The process parameters should be chosen to get an overall machining behavior. The best possible set of process parameters is still a challenging one for researchers as well as for companies. Li et al carried out an experiment by selecting three materials such as Cu, Cu–Tungsten, and graphite used as electrodes with assorted parameters such as peak current, pulse-on time, polarity, and flushing pressure. The responses were material removal rate (MRR), relative wear ratio, and surface roughness (SR). The results revealed that peak current provides a larger effect on the response. Copper electrode helped to achieve a good surface finish. The eroded particles are easily removed from the tungsten carbide workpiece by high flushing pressure [17]. Metal matrix composite machining using EDM was carried out by Gopalakrishnan et al in finding out the significance of control parameters such as pulse current, gap voltage, and pulse time. By applying response surface methodology (RSM), the mathematical model was included by getting less error percentage [18]. Kuppan et al concluded that the cause of duty cycle, peak current, electrode speed, and spark on time when machining Inconel 718 and found that peak current was the most foremost factor in MRR. The RSM-developed model and optimized set of process parameters are validated [19]. Mohanty et al studied that during machining of Inconel 718, three electrodes such as copper, graphite, and brass were used to analyze the response parameters MRR, tool wear rate (TWR), and Sr In addition, as a consequence of the formation of enormous thermal energy, radial overcut was also observed [20]. Further, Mohanty et al demonstrated the effect during machining Inconel 82. In this demonstration, it was observed that there was an effect of pulse, duty factor, and peak current, on MRR and Sr As a result, it was found that this peak current exercised a higher level of MRR contribution and SR [21]. Hastelloy X is a nickel-based superalloy in which machining was carried out by Kang et al to analyze the effect of pulse-on time on MRR. A higher amount of MRR could be identified with the simultaneous increase in pulse time. Furthermore, an increased volume of carbon deposits was noticed on the tool surface [22]. Hascalik et al carried out an EDM experiment in titanium alloy (Ti-6A1-IV) and analyzed the effect of a response. The results proved the increase in MRR, electrode wear rate (EWR), SR, and white layer thickness with an increase in both pulse duration and pulse current [23]. Caydas et al concluded that pulse current was identified as the most important factor to affect the white layer thickness and also pointed out the EWR during EDM of titanium alloy. Pulse current, gap voltage, and pulse-on time are the parameters considered, whereas EWR and material removal rate are the responses (MRR), and the Taguchi method is used to schedule, perform, and analyze experiments to evaluate the best parameter settings. Within the experimental area, it is discovered that the rate of electrode wear decreases significantly [24]. Pellicer et al looked at how EDM parameters and electrode geometry affected aspect micro-accuracy in tool steel for fabrication. Using different formed copper electrodes, pulse current, open voltage, pulse time, and pulse pause time were varied and investigated in H13 hot work tool steel [25]. Researchers investigated the effects of EDM parameters such as pulse current, duty factor, sensitivity regulation, gap control, and flushing pressure on MRR and SR using RSM. During EDM of Inconel 718 using a tubular copper electrode, MRR was primarily influenced by peak current followed by pulse-on time. Lower discharge current, sensitivity control, medium flushing pressure, and gap control were considered to be appropriate for achieving a good surface finish [26]. Marichamy et al attempted to study the machining properties of alpha-beta brass when machining it. The machinability of—brass is investigated using EDM process parameters such as voltage, current, flushing pressure, and pulse-on time. As a consequence, the most important parameter that influences MRR, EWR, and SR is current, which is followed by gap voltage [27]. EDM was used on Inconel 625 and Inconel 718 by Dhanabalan et al The pulse-on time, rather than current, was found to be the most important factor affecting the MRR and EWR. The MRR value increased as the peak current increased [28]. The MRR and surface finish were found to be significantly influenced by discharge energy by Lin et al [29]. MRR and SR also increased as discharge energy increased, i.e., high peak current and short pulse length.
The existing literature review reveals that an investigational effect of machining parameters on responses related to EDM of Wasp alloy is very limited. The objectives of the investigational exploration are (i) to investigate the metal erosion behavior under various control factors such as voltage, peak current, duty factor, and flushing pressure and analyze their effects on responses, namely, MRR and SR; (ii) to find the significant factor in affecting MRR and SR using analysis of variance (ANOVA); (iii) to determine the best optimal solution using desirability approach; and (iv) to analyze the recast layer formation using scanning electron microscope (SEM).
2. Methods and materials
2.1. Die sinking EDM
The EDM machine used for the present work is ECOWIN MIC-640L CNC—Taiwan and the work plan is shown in figure 1. The electrical discharge drilled workpiece, tool used, and the mechanism is shown in figure 2. The drill size is 10 mm diameter and 4 mm depth. The worktable dimension is 1000 × 600 mm. The work tank dimension is 1500 × 940 × 520 mm. The maximum power capacity is 60 A. It is a 32-bit PC-based control system. It has a computer numerical control system in which three axes digital control, 3d orbit function, and multi-cave moving sparking features are incorporated. The side flushing was used for removing the eroded material. The dielectric fluid, paraffin, has good arcing stability enabling it to attain more MRR and low electrode tool wear.
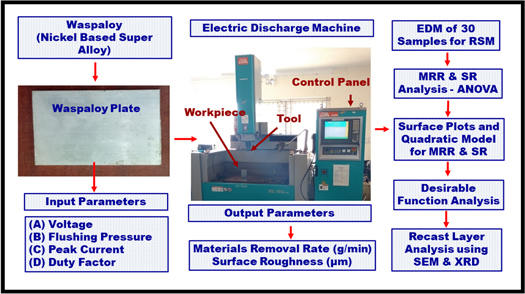
Figure 1. EDM setup for machining Waspaloy and complete work plan.
Download figure:
Standard image High-resolution image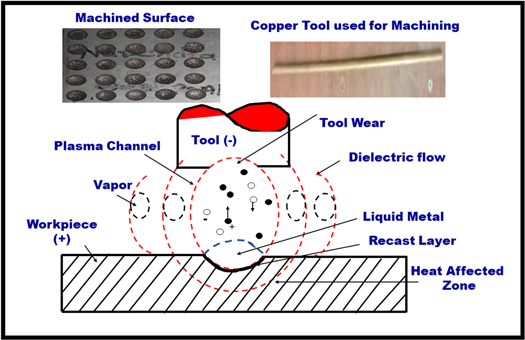
Figure 2. Mechanism of EDM, copper tool, and machined Waspaloy.
Download figure:
Standard image High-resolution image2.2. Input and output parameter selection
The process parameters were classified as electrode based, electrical based, and non-electrical. The control parameters were selected based on the previous research investigations. The input process parameters with corresponding factor symbols inside the bracket and three designated levels are the following: (i) −1(low), (ii) 0 (medium), and (iii) +1(high) were considered and are listed in table 1.
Table 1. Process parameters and their levels.
| Symbol | Parameters | Unit | Low | Medium | High |
|---|---|---|---|---|---|
| −1 | 0 | 1 | |||
| A | Voltage | V | 100 | 125 | 150 |
| B | Flushing pressure | kg/sq.cm | 0.2 | 0.4 | 0.8 |
| C | Peak current | A | 18 | 22 | 26 |
| D | Duty factor | 20% | 60% | 80% |
The following output parameters were calculated for experimental investigation:
Material removal rate (MRR): The MRR was computed from the weight loss of the workpiece divided by the duration of the machining. Similarly, the TWR was computed from the weight loss of the electrode divided by the duration of the machining. The workpiece and tool electrode were weighed before and after each experiment using a precision balance (Essae–Teraoka) with a precision of 0.0001 g to determine the MRR as given in equation (1).

where Win is the initial weight of the workpiece in gram; Wfn is the weight of the workpiece in gram after machining; and t is the duration of machining in a minute.
Surface Roughness (SR): The SR (Ra) was measured with a portable stylus type profilometer, Talysurf (Taylor Hobson, Surtronic 3+). The roughness value is measured in μm.
2.3. Work material and electrode
The Waspaloy (Cr: 21%, Co: 15%, Mo: 5%, Ti: 3.25%, Fe: 2%, Al: 1.6%, Si: 0.75%, Mn: 1%, Cu: 0.5%, C: 0.1%, Zr: 0.12%, B: 0.1%, and Ni remaining) was considered as a work material for the present work. The density of the Wasp alloy is 8.2 g/c.c. The hardness of the material is C 42 in the Rockwell machine. The ultimate tensile strength of the material is 1320 MPa, 0.2% yield strength is 905 MPa, and rupture strength of the material for 100 h is 623 MPa. The common electrode, copper, which has good corrosion resistant and electrical conductivity, was used in the consideration of achieving a good surface finish, as found in the investigation of Lin et al for machining the Waspaloy [17]. A copper tool of 10 mm diameter was used to perform the machining process. The investigation was carried out in 30 experimental factors by using central composite design with specified levels. Table 2 illustrates the findings of the experiments.
Table 2. Experimental layout and observations.
| Exp. no. | A | B | C | D | MRR | SR |
|---|---|---|---|---|---|---|
| V | kg cm−2 | A | % | g min−1 | μm | |
| 1 | 100 | 0.4 | 18 | 80 | 0.0038 | 7.21 |
| 2 | 150 | 0.4 | 26 | 80 | 0.0242 | 12.32 |
| 3 | 125 | 0.6 | 22 | 60 | 0.0405 | 15.32 |
| 4 | 125 | 0.6 | 22 | 60 | 0.0405 | 15.32 |
| 5 | 125 | 0.4 | 22 | 60 | 0.0229 | 15.32 |
| 6 | 150 | 0.8 | 18 | 20 | 0.0296 | 8.32 |
| 7 | 100 | 0.8 | 26 | 80 | 0.0518 | 12.98 |
| 8 | 100 | 0.4 | 26 | 80 | 0.0242 | 13.21 |
| 9 | 125 | 0.6 | 22 | 80 | 0.0460 | 12.65 |
| 10 | 100 | 0.4 | 18 | 20 | 0.0112 | 6.43 |
| 11 | 150 | 0.6 | 22 | 60 | 0.0429 | 15.32 |
| 12 | 150 | 0.4 | 26 | 80 | 0.0318 | 13.99 |
| 13 | 125 | 0.6 | 22 | 60 | 0.0405 | 15.32 |
| 14 | 125 | 0.6 | 26 | 60 | 0.0401 | 17.12 |
| 15 | 100 | 0.8 | 18 | 80 | 0.0106 | 9.34 |
| 16 | 125 | 0.6 | 22 | 60 | 0.0405 | 15.32 |
| 17 | 125 | 0.6 | 22 | 60 | 0.0394 | 15.32 |
| 18 | 150 | 0.4 | 18 | 80 | 0.0145 | 6.98 |
| 19 | 150 | 0.8 | 26 | 20 | 0.0684 | 12.92 |
| 20 | 150 | 0.4 | 18 | 20 | 0.0110 | 7.12 |
| 21 | 100 | 0.8 | 26 | 20 | 0.0616 | 12.45 |
| 22 | 150 | 0.8 | 18 | 80 | 0.0101 | 8.93 |
| 23 | 125 | 0.8 | 22 | 60 | 0.0610 | 15.28 |
| 24 | 125 | 0.6 | 22 | 60 | 0.0405 | 14.98 |
| 25 | 150 | 0.4 | 26 | 20 | 0.0170 | 12.12 |
| 26 | 125 | 0.6 | 22 | 60 | 0.0405 | 15.32 |
| 27 | 100 | 0.8 | 18 | 20 | 0.0267 | 6.52 |
| 28 | 100 | 0.4 | 26 | 20 | 0.0153 | 11.99 |
| 29 | 125 | 0.6 | 22 | 20 | 0.0498 | 12.98 |
| 30 | 100 | 0.6 | 22 | 60 | 0.0401 | 15.32 |
3. Results and discussions
The software, Minitab 17, was used for analyzing the experimental data. The two quadratic models were obtained using RSM for the MRR and Sr The general equation for MRR and SR in the coded units is as follows:
The summary of ANOVA is presented in tables 3 and 4. There is a statistical significance with regard to the model adopted for both MRR and SR having four input parameters based on tables 3 and 4. This was further validated when the experiment is done using ANOVA [30, 31]. Nevertheless, when the R2 value is prone to 1, there is more probability of the fitness of the model. Of the factors which govern the MRR, peak current is the most considerable in the series of duty factor, flushing pressure, and voltage. The validity of the fitness of the model was achieved by using R2 value (97.91%) and the adjusted value (95.68%). With regard to SR, duty factor comes to the fore as the influencing parameter and peak current, voltage, and flushing pressure following it. The corresponding R2 value and adjusted value of SR were found to be 98.73% and 96.62%, respectively. All these observations and findings prove the fact that the regression model makes a correlation between the factors and MRR.
Table 3. Analysis of variance for MRR.
| Source | DF | Adj SS | Adj MS | F-value | P-value |
|---|---|---|---|---|---|
| Model | 15 | 0.0008117 | 0.000541 | 43.77 | 0.000 |
| Linear | 4 | 0.000493 | 0.000123 | 9.97 | 0.000 |
| Voltage | 1 | 0.000002 | 0.000002 | 0.16 | 0.699 |
| Flushing pressure | 1 | 0.000049 | 0.000049 | 3.97 | 0.066 |
| Peak current | 1 | 0.000412 | 0.000412 | 33.30 | 0.000 |
| Duty factor | 1 | 0.00096 | 0.00096 | 7.74 | 0.000 |
| Square | 4 | 0.001518 | 0.000379 | 30.69 | 0.000 |
| Volt*Volt | 1 | 0.000006 | 0.000006 | 0.46 | 0.510 |
| Flushpres*Flushpres | 1 | 0.000001 | 0.000001 | 0.10 | 0.755 |
| PeakCurrent*PeakCur | 1 | 0.000520 | 0.000520 | 42.10 | 0.000 |
| Dutyfact*Dutyfact | 1 | 0.000082 | 0.000082 | 6.60 | 0.022 |
| 2-Way interaction | 6 | 0.001283 | 0.000214 | 17.29 | 0.000 |
| Volt* Flushpres | 1 | 0.000014 | 0.000014 | 1.14 | 0.306 |
| Volt* PeakCurrent | 1 | 0.000007 | 0.000007 | 0.60 | 0.451 |
| Volt* Dutyfact | 1 | 0.000003 | 0.000003 | 0.21 | 0.654 |
| Flushpres*PeakcurrentC | 1 | 0.000866 | 0.000866 | 70.05 | 0.000 |
| Flushpres*Dutyfact | 1 | 0.000230 | 0.000230 | 18.61 | 0.001 |
| Current*Dutyfact | 1 | 0.000161 | 0.000161 | 13.05 | 0.003 |
| Error | 14 | 0.000173 | 0.000012 | ||
| Lack of fit | 9 | 0.000172 | 0.000019 | 99.22 | 0.000 |
| Pure error | 5 | 0.000001 | 0.000000 | ||
| Total | 29 | 0.008290 | |||
| Model summary | % | ||||
| R2- value | 97.91 | ||||
| Adjusted R2 value | 95.68 |
Table 4. Analysis of variance for Sr.
| Source | DF | Adj SS | Adj MS | F-value | P-value |
|---|---|---|---|---|---|
| Model | 15 | 305.704 | 20.3803 | 56.32 | 0.000 |
| Linear | 4 | 26.953 | 6.7382 | 18.62 | 0.000 |
| Voltage | 1 | 0.5232 | 0.5232 | 1.45 | 0.249 |
| Flushing Pressure | 1 | 0.297 | 0.2973 | 0.82 | 0.380 |
| Peak Current | 1 | 5.238 | 5.2378 | 14.47 | 0.002 |
| Duty factor | 1 | 9.280 | 9.2804 | 25.64 | 0.000 |
| Square | 4 | 134.849 | 33.7123 | 93.15 | 0.000 |
| Volt*Volt | 1 | 0.000006 | 0.000006 | 0.46 | 0.510 |
| Flushpres*Flushpres | 1 | 0.245 | 0.2448 | 0.68 | 0.425 |
| PeakCurrent*PeakCur | 1 | 3.727 | 3.7272 | 10.30 | 0.006 |
| Dutyfact*Dutyfact | 1 | 14.988 | 14.9884 | 41.42 | 0.000 |
| 2-Way Interaction | 6 | 2.150 | 0.3583 | 0.99 | 0.469 |
| Volt* Flushpres | 1 | 0.326 | 0.3264 | 0.90 | 0.358 |
| Volt* Peakcurrent | 1 | 0.015 | 0.0151 | 0.04 | 0.841 |
| Volt* Dutyfact | 1 | 0.760 | 0.7599 | 2.10 | 0.169 |
| Flushpress*PeakCurr | 1 | 0.752 | 0.7524 | 2.08 | 0.171 |
| Flushpress *Dutyfact | 1 | 0.036 | 0.0364 | 0.10 | 0.756 |
| peakcurre*Dutyfact | 1 | 0.047 | 0.0466 | 0.13 | 0.725 |
| Error | 14 | 5.067 | 0.3619 | ||
| Lack of fit | 9 | 4.974 | 0.5527 | 29.88 | 0.001 |
| Pure error | 5 | 0.092 | 0.0185 | ||
| Total | 29 | 310.771 | |||
| Model summary | % | ||||
| R2- value | 98.37 | ||||
| Adjusted R2 value | 96.62 |
Figures 3(a)–(f) indicates the significance of voltage, flushing pressure, peak current, and duty factor on MRR. The MRR increases with an increase in peak current from 18 A to 22 A and then decreases from 22 A to 26 A. The increase in MRR is due to the prominent role of peak current which produces high thermal energy which is used to melt the materials and removed them from the base material. If the pulse duration is increased, more electrical discharge energy and a higher peak current density can be achieved. Within a single discharge cycle, the electrical discharge energy performed into the machining gap increases as the pulse-on time increases. As a result, as the pulse length increases, the MRR improves at first. The plasma channel, on the other hand, can expand with the pulse length, widening the discharging contact zone and lowering the peak current density. The plasma channel's energy melts the materials, but it is insufficient to produce a high dielectric exploding pressure that can flush the molten material away from the machined surface. MRR decreases as a result of this [32]. The effect of peak current and voltage on the MRR is depicted in figure 3(b). The voltage has less influence compared to the peak current. It is evident from figure 3(c). That MRR increases with an increase in both the voltage and duty cycle up to 125 V and starts to decreases with further increase in both the voltage and duty cycle. As a consequence of the increase in the spark on duration, i.e., high duty cycle, the plasma zone enlarges which erodes the work material. The carbon produced as a result of decomposition sticks to the electrode surfaces which prevents further erosion of particles and this reaction reduces the erosion efficiency [33]. During pulse-on time and pulse-off time, the spark starts to melt the material and ejection of molten metal by flushing takes place, respectively. If pulse off time is too low compared to pulse on time, the duration for erosion would be less which decreases MRR and leads to the formation of recast layer [34]. The effect of MRR with respect to flushing pressure and duty factor is shown in figure 3C. As the pulse-on time is raised, the same heating flux is applied for a longer period of time. As the fusion channel expands, the amount of heat that is conducted through the workpiece increases, causing an increase in the MRR [35]. The MRR is maximum at the combination of high duty factor and high flushing pressure. The flushing pressure helps to remove the deposited carbon at the tool surface which enhances the MRR subsequently. The interaction effect between flushing pressure and voltage is shown in figure 3(f). It can be derived that the significant element of the voltage toward MRR is less, while high flushing pressure is the limit where the maximum MRR is attained.
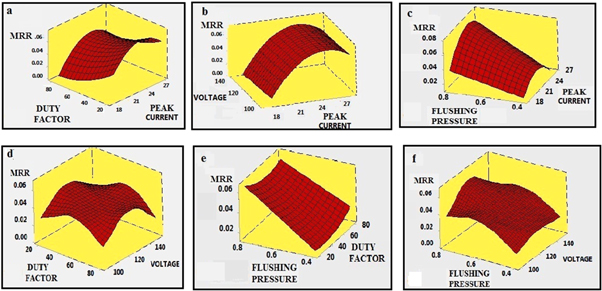
Figure 3. Surface plot of (a) effect of peak current and duty factor on MRR. (b) Effect of peak current and voltage on MRR. (c) Effect of peak current and flushing pressure on MRR. (d) Effect of voltage and duty factor on MRR. (e) Effect of flushing pressure and duty factor on MRR. (f) Effect of flushing pressure and voltage on MRR.
Download figure:
Standard image High-resolution imageThe effect of voltage, flushing pressure, peak current, and duty factor on SR is shown in figures 4(a)–(f). It can be seen from figure 4(a) and can be derived that SR has been increased with an increase in both duty factor and the peak current. Meanwhile, maximum SR is attained when the peak current and duty factor are high. The high duty factor and peak current produce abundant heat energy which forms a crater on the top layer of the material [36, 37]. Low gap voltage values may cause an increase in MRR. The use of extremely low values, on the other hand, has an arcing tendency. Furthermore, higher gap voltage values will result in lower metal removal rates. The increase in peak current is thought to cause an increase in discharge heat energy at the point where the discharge occurs. A pool of molten metal is formed and overheated at this stage. As the molten metal evaporates, gas bubbles form, which erupts when the discharge occurs, ejecting the molten metal liquid. Repeated discharges can leave craters and pockmarks on the surface, raising the roughness [38]. From figure 4(b), it is evident that irrespective of the flushing intensity, there is an increase in SR with an increase in peak current. There is a steady increase in the MRR with an increase in peak current and voltage. The length of spark triggered increases as the pulse-on time increases. Flushing becomes inadequate as the pulse rate rises over time. Since the pulse-on time is too long, debris accumulated in the machined surface as a result of improper flushing can obstruct energy transfer, resulting in an irregular surface [39].

Figure 4. Surface plot of (a) Effect of peak current and duty factor on Sr (b) Effect of peak current and voltage on Sr (c) Effect of peak current and flushing pressure on Sr (d) Effect of voltage and duty factor on Sr (e) Effect of flushing pressure and duty factor on Sr (f) Effect of flushing pressure and voltage on Sr.
Download figure:
Standard image High-resolution imageFrom figure 4(c), it could be observed that the change in voltage has not much effect on MRR which is evident from figure 4(c). The SR increases from 18 A to 22 A and then starts to decrease as shown in figure 4(d). The variation in voltage provides no effect on Sr Initially, SR increases slightly with an increase in voltage and then declines as shown in figure 4(e). This may be due to the carbon deposition in the tool surface and the less ejection of molten material in the less provided pulse off time. With the increase in both the flushing pressure and voltage, SR increases as shown in figure 4(f).
4. Multi-response optimization
4.1. Desirability function
In this experimental investigation, MRR and SR are the responses that are the objective functions to be optimized using Minitab 17. Optimization has two chief objectives, namely, minimizing the SR and maximizing the MRR. The desirability approach is adopted to solve the conflict of many response optimizations. This function is combined with RSM for ratifying the flaws seen in the contrasting responses. The desirability approach was suggested by Derringer and Suich to optimize the several types of problems in responses [40].
The problem can be structured as given below.
Maximum MRR and Minimum SR
Subject to, 100 V ≤ A ≥ 150 V; 0.2 kg cm−2 ≤ B ≥ 0.8 kg cm−2; 18 A ≤ C ≥ 26 A; 20% ≤ D ≥ 80%
The optimized process parameters and the optimum value of MRR and SR is given in table 5. Validation of the experiment is the final step of the investigation. The observed value is in close agreement with the predicted optimum value. It is done by prediction and verification using the optimal parameters. The confirmation test is tabulated in table 5.
Table 5. Optimized process parameters and optimum value of MRR and Sr.
| Optimized Value of parameters | ||||||||
|---|---|---|---|---|---|---|---|---|
| Response | Voltage | Flushing pressure | Peak current | Duty factor | Experimental value | Predicted value | % error | Response |
| MRR g min−1 | 100 | 0.8 | 22 | 20 | 0.0612 | 0.0671 | 8.7 | MRR |
| SR μm | 100 | 0.8 | 22 | 20 | 10.42 | 11.0671 | 5.8 | SR |
5. Recast layer
To make the material melt, evaporate and ionized, a large amount of thermal energy is produced in a concentrated area. A great volume of the melted material undergoes flushing by dielectric and the rest of the portion undergoes instant quenching before being recast on the surface finishing. The layer thus formed out of recasting, becomes unique and independent of the type of dielectric used in flushing and ionization. The recast layer is found to be unsuitable due to its finishing rough surface, being brittle and hard [41]. This surface reduces the fatigue strength of the material which affects the reliability of the component [42]. Due to recast layer formation, the dimensional accuracy could not be achieved. As a result, the rough surface finish was obtained. Due to the hard and brittle nature of the recast layer, fatigue strength is affected. The recast layer could not be prevented but can be controlled.
As the process involved repeated heat and cooling cycle of the electrolyte, an exclusive heat-affected zone (HAZ) is created under the recast layer. This HAZ gets affected due to the conduction of heat on the surface. Yet, this heat is cooled down or melted by way of plasma sparks at the time of active cycles. With the investigation carried out under a white optical microscope, the undesirable layer formed which is defined as a white layer. To be brief, the quenching cycle and persistent heat formation necessitated the construction of HAZ [43].
The topography of the drilled surface was examined by QUANTA 250 FEG. An energy-dispersive x-ray spectrometer was used to prove the chemical composition of the machined surface.
Figure 5(a) shows that less uniformity of the white layer thickness. Its thickness was found to be around 20 μm. HAZ is just below the recast layer. Small pores were visible. Better surface quality with even thickness distribution of recast layer can be observed. From figure 5b, it is observed that the thinner recast layer is a copper electrode with positive polarity. A thinner recast layer is formed when voltage and current are lowered. Figure 5(c) shows that many globules like particles are formed due to repeated spark and quench. All the globules are the same size. The high-temperature spark makes the metal melt and form in globules shape. It is uniform in size which is clearly evident from figure 5(d).
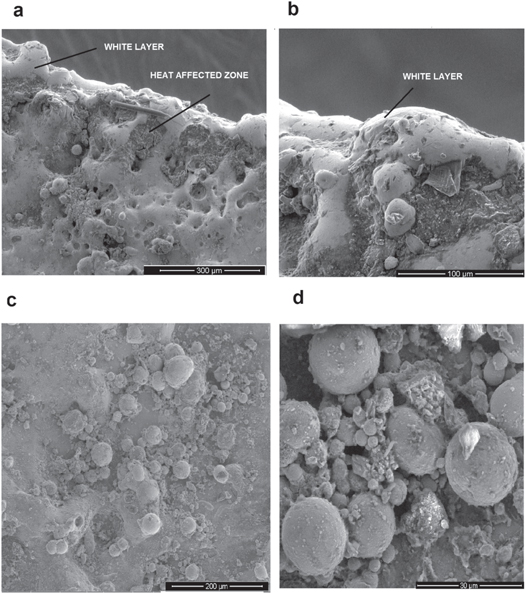
Figure 5 (a)–(d). Cross-sectional image of electric discharge machined surface. (a) Recast layer formation at magnification 160×. (b) Recast layer formation at magnification 600×. (c) Surface of blind hole machined by EDM magnified at 500×. (d) Surface of blind hole machined by EDM magnified at 2000×.
Download figure:
Standard image High-resolution imageThere is a general problem of carbon deposition on the surface of machined workpiece from the dielectric material. Due to this phenomenon, from the results of Energy Dispersive Spectroscopy (EDAX) analysis which is shown in figure 6, it is evident that the presence of carbon is more. The reason is surface saturation with carbon independent of tool material in the presence of hydrocarbon-based dielectric liquid, namely, paraffin. The carbides are trapped in surfaces. From the EDAX analysis, all other elements of Wasp alloy are also ensured.
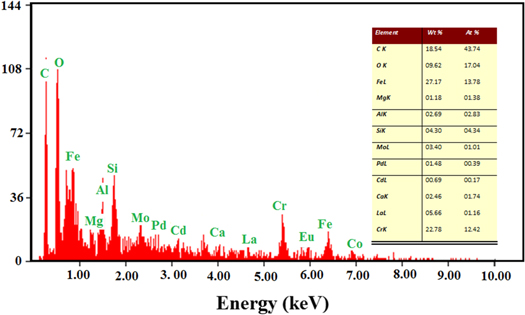
Figure 6. EDAX of surface of blind hole machined by EDM.
Download figure:
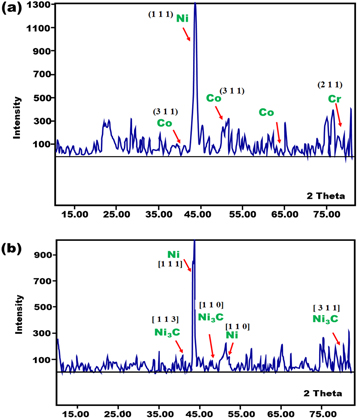
Standard image High-resolution imageFigures 7(a) and (b) shows x-ray diffraction (XRD) analysis of waspaloy-machined plate piece before and after machining process, respectively. Analysis confirms the presence of nickel, chromium, and cobalt in the specimen which is shown in figure 7(a). Figure 7(b) shows the presence of Ni3C which indicates the existence of carbon in the recast surface owing to the decomposed carbon formed as a result of the reaction. Though electrical discharges deplete materials from both the tool electrode and the workpiece, carbon from the dielectric fluid can be deposited on the tool electrode's surface, preventing erosion. Carbon deposition on the electrode surface is more likely when the pulse length is longer, the pulse current is lower, and the pulse off time is shorter. As a consequence, MRR decreases and SR increases [44].
Figure 7. (a) XRD analysis of the specimen before machining. (b) XRD analysis of the specimen before machining after machining.
Download figure:
Standard image High-resolution image
6. Conclusions
Analyzing the experimental investigation derived the conclusion part as follows:
- The electric erosion behavior of super hard Wasp alloy was analyzed and the peak current was the most considerable parameter which affects MRR. Duty factor was the most influential factor for the Sr.
- The material characterization was successfully done by using SEM with EDAX analysis. The thinner recast layer with a thickness of 20 μm is formed at the combination of lower voltage and peak current.
- The multi-objective optimization was done successfully by using the desirability approach. The best possible machining conditions for machining with maximum MRR and minimum SR were identified with peak current: 22 A, voltage: 100 V, flushing pressure: 0.8 kg cm−2, and duty factor: 20%.
- The prediction was validated with experimental results and the error percentage between predictions and experimental for MRR and SR were 8.7% and 5.8%, respectively.
- The developed mathematical model based on RSM could be precisely used to forecast the responses such as MRR and SR, for the machining of Waspaloy.
- The machined surface was subjected to XRD which reveals the formation of Ni3C due to the decomposition of dielectric fluid.
- In future, using a different dielectric, recast layer formation could be investigated. Another set of process parameter could be considered for machining with various electrodes to analyze MRR and Sr.
Data availability statement
All data that support the findings of this study are included within the article (and any supplementary files).