

Abstract
Reliable electrochemical testing protocols assessing the catalytic performance of novel materials, such as the rotating disk electrode method to determine the oxygen reduction reaction activity, play an essential role in the knowledge-based design of tailored electrocatalysts. However, these techniques are unable to accurately predict the performance of the developed electrocatalysts in membrane electrode assemblies (MEAs) which are ultimately used in full fuel cell measurements. Half-cell tests of gas diffusion electrodes have been shown to be a good compromise, with economical use of electrocatalysts while also mimicking the three-phase boundary in MEA during the presence of humidified reactant gas. In this review, we aim for a bird's eye view of the set-ups already reported, how the testing protocols differ and how the protocols can be unified for a more consistent performance evaluation.
Export citation and abstract BibTeX RIS

Original content from this work may be used under the terms of the Creative Commons Attribution 4.0 license. Any further distribution of this work must maintain attribution to the author(s) and the title of the work, journal citation and DOI.
1. Introduction
For decades now, proton exchange membrane fuel cells (PEMFC) have been regarded as the future in electromobility and an electrocatalyst for PEMFC, which meets both activity and durability targets, the holy grail of electrochemical research in fuel cells. The bottleneck in a successful commercialisation of any electrocatalyst has been the performance degradation while testing full fuel cell systems. The following technical targets for 2020 have been set for polymer electrolyte membrane fuel cells by the U.S. Department of Energy (DOE) [1]: for electrocatalysts, platinum group metal (PGM) loading of 0.125 mgPGM cm−2, mass activity (MA) of 0.44 A mgPGM −1 at 0.9 ViR-free, loss in initial activity less than 40% during durability testing, loss in performance at 0.8 A cm−2 less than 30 mV, stable support with less than 40% MA loss, performance loss at 1.5 A cm−2 less than 30 mV; and for membrane electrode assemblies (MEAs), a start-up/shut down durability of 5000 cycles, durability with cycling at 5000 h and performance of 300 mA cm−2 at 0.8 V. There have been multiple reports of electrocatalysts which exceeded these targets for initial MA and these results even led to their commercialisation as in the case of platinum-cobalt catalysts in the Toyota Mirai [2]. There have been reports of oxygen reduction reaction (ORR) catalysts screened using benchtop methods like rotating disk electrode (RDE) [3–8], channel flow dual electrode [9] and the new floating electrode technique [10], which attested them to fulfil the MA targets. The RDE method has been known to suffer from reactant mass transport limitations, hence rendering the potential window and rates of reactions quite different from the full cell MEA tests. Very few to no catalysts have been able to reach stringent durability targets for the final leap to a commercially competitive viable fuel cell vehicle. One of the major drawbacks of the above-mentioned benchtop methods is that they study the ORR half-cell behaviour in aqueous electrolyte environments and are not able to mimic the more complex behaviour of the said electrocatalysts in the three-phase boundary of the MEA utilized in full cell tests. In this context, the gas diffusion electrode (GDE) half-cell set-up seems to be a better compromise which can evaluate the ORR of electrocatalysts in the presence of gas diffusion layer (GDL) and the three-phase boundary of catalyst-ionomer-carbon support. These set-ups are more economically viable and able to predict more accurately the activity of the electrocatalyst without having to test full fuel cells.
In the following review, four recently reported GDE half-cell set-ups are compared with respect to their specific design and features. Focus will be on the preparation of GDE including the commercial Pt electrocatalysts for ink preparation, ionomer for binding as well as proton transport, GDL made of carbon paper with microporous layer (MPL) and solvent ratios. The structure and morphology of the various electrodes and their effect on the measured electrochemical values will also be discussed. Figure 1 shows a schematic illustration of the procedures involved in electrode preparation for testing of electrocatalysts in GDE half-cells, starting from the Pt/C (carbon supported platinum) and formation of ink and coating on GDL to the testing in half-cell set-ups with or without Nafion membrane. In the subsequent subsections, the experimental conditions for electrochemical measurements will be highlighted, such as the effect of electrolyte concentration, pre-treatment for cleaning the surface of the electrocalysts, determination of electrochemically active surface area (ECSA) using either hydrogen underpotential deposition (Hupd) or carbon monoxide (CO) stripping method, iR-compensation for ohmic voltage drop and measurement of ORR and the subsequent analysis of specific activity (SA). We will also touch upon the subject of durability testing using half-cell set-ups and how combining the knowledge from different set-ups and research groups is essential for successful benchmarking.

Figure 1. Schematic illustration of the procedure used for electrocatalyst layer preparation and GDE testing in half-cells.
Download figure:
Standard image High-resolution image2. Gas diffusion half-cell set-ups for ORR: cell designs
In this review, four set-ups in half-cell configuration were selected, which are depicted in figure 2 and detailed in table 1. The first of the designs mentioned here was published by Inaba et al [11] and studied under different experimental conditions. The cell is a very compact system, that consists of a stainless-steel current collector and flow field, and an electrolyte container (made of polytetrafluorethylene (PTFE)—4 ml) that fits in the stainless-steel body. The PTFE container is used to insert the counter and reference electrodes in well-defined and constant distance from each other. This set-up can be used with or without an ionomer membrane, separating the catalyst layer from a liquid electrolyte. In this work, the authors mentioned that a tight contact between the membrane and GDE is feasible due to the small exposure area (∅ 3 mm) and avoids the hot-pressing of the membrane against the GDE. Both the electrolyte and GDE compartments can be individually purged with gas. The heating system consisted of an aluminium box placed on top of a heating plate using a thermocouple to control the temperature, in which the GDE cell and the gas humidifier were inserted. To prevent the cell from being heated directly, a styrene foam plate was placed under the cell. This set-up should allow for a precise temperature control at 60 °C with small fluctuations to simulate testing conditions for high temperature polymer membrane electrolyte fuel cell tests. For temperatures above 60 °C, the PTFE electrolyte container is replaced with polyether ether ketone (PEEK). Since the electrical cables are also inserted in the aluminium box, it is important to note that it would be necessary to adapt the connectors with temperature resistant materials, if high temperatures above 100 °C are applied.
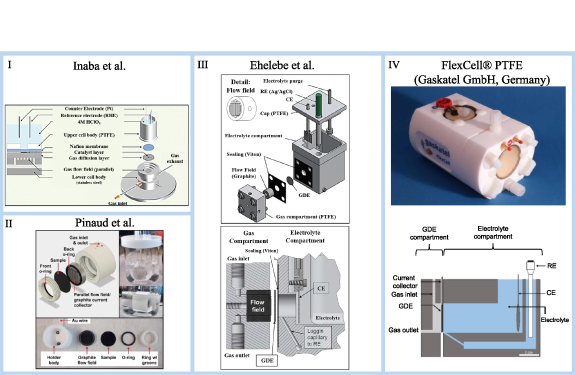
Figure 2. Half-cell set-up developed by: (I) Inaba et al, adapted from [11] with permission of The Royal Society of Chemistry. (II) Pinaud et al, reproduced from [12]. [© 2017 THE ELECTROCHEMICAL SOCIETY.]. All rights reserved. (III) Ehelebe et al, adapted from [13]. [© 2019 THE ELECTROCHEMICAL SOCIETY]. CC BY 4.0. (IV) top: FlexCell® PTFE, [14] Copyright 2021 © gaskatel; (IV) bottom: FlexCell®, adapted from [15]. CC BY 4.0.
Download figure:
Standard image High-resolution imageTable 1. Overview on the specific features of the four half-cell set-ups.
| GDE half-cell set-up | Inaba et al [11] | Pinaud et al [12] | Ehelebe et al [13] | FlexCell® (Gaskatel, Germany) [14] |
|---|---|---|---|---|
| Working electrode | GDE | GDE | GDE | GDE or flat electrodes |
| WE geometric area | 0.0706 cm2 (∅ 3 mm) | 1.91 cm2 (∅ 15.6 mm) | 2 cm2 | 3 cm2 |
| Flow field | Yes, stainless steel | Yes, graphite | Yes, graphite | No, only gas inlet/outlet from the GDE back |
| Current collector | Stainless steel | Graphite | Graphite | Two gold pins |
| Electrolyte compartment material/volume | PTFE or PEEK—4 ml | Glass—50 ml | PTFE—250 ml | PP or PTFE—40 ml |
| Counter electrode | Pt mesh | Pt mesh | Mixed metal oxide sheet of Ir/Ta on Ti | Pt spiral |
| Reference electrode | RHE | Hg/Hg2SO4 (0.5 M H2SO4 filling solution) | Ag/AgCl | Hydroflex® Hydrogen RE |
| Heating system | Cell inserted inside an Al box with a heating plate | None, but a heating system can be adapted | None, but a heating system can be adapted | Integrated heating system |
| Operating temperature | Up to 60 °C (with PTFE electrolyte compartment) or 150 °C (with PEEK electrolyte compartment) | 20 °C | 20 °C | Up to 70 °C (PP as electrolyte compartment) or up to 150 °C (PTFE) |
| Proton exchange membrane | Yes, Nafion membrane or similar | None, but it can be used | None, but it can be used | It can be used |
| Gas purging | Electrolyte compartment and flow field can be purged individually | Electrolyte compartment and flow field can be purged individually | Electrolyte compartment and flow field can be purged individually | Electrolyte and GDE compartment can be purged individually |
| Approximated costs (set-up + electrodes) | € 800 | € 900 | € 1.000 | € 1200–1700 |
In 2017, Pinaud et al [12] also developed a half-cell system which consisted of a round mount body made of PTFE with a gas inlet and outlet, a graphite flow field and a current collector. These mentioned parts are assembled and inserted in a glass container filled with electrolyte (50 ml) with counter and reference electrodes covered by a PTFE cap. In this published work the authors did not use an ionomer membrane, but its use is still a possibility. The electrolyte and the GDE compartments can be purged individually and, although the authors do not use any type of heating system, one could easily be adapted to the described cell.
In 2019, Ehelebe et al [13] developed a modified half-cell system based on Pinaud's first set-up. Unlike the cell made by Pinaud et al [12], the system developed by Ehelebe et al [13] fixes the GDE compartment (graphite flow field and current collector) to the electrolyte compartment (250 ml PTFE container). Once again, the authors did not use any ionomer membrane but, as before, the possibility exists to use one. The heating system used by Inaba et al [11] can also be adapted to Ehelebe's half-cell system to allow for measurements at slightly elevated temperatures.
Competing with the in-house developed set-ups described above, there are also two commercial set-ups produced by Gaskatel GmbH, called FlexCell® polypropylene (PP) and FlexCell® PTFE, which are cells with electrolyte compartments made of PP and PTFE, respectively [14, 15]. The cells in PP and PTFE can be used up to temperatures of 70 °C and 150 °C, respectively. The cells do not have a flow field and the current collector consists of two gold pins, but a metallic mesh could be placed behind the GDE and used as the current collector. The set-up has a gas inlet and outlet in the GDE compartment, and the electrolyte compartment can also be purged individually. It is worth mentioning here that in this cell the reference electrode compartment connects to a Luggin mimicking channel that reaches the GDE and significantly reduces the potential drop. Both FlexCell® systems have an integrated heating system that allows heating both the electrolyte and the GDE. In addition, the systems can be used with all types of flat electrodes.
An overview and comparison of the features of these four individual GDE half-cell set-ups is shown in table 1. While their design appears rather similar, they still differ in the probed GDE area, the reference electrode and the placement and the materials utilized in the hardware. The latter is, of course, mostly driven by the operation temperatures that will be used.
3. Fabrication of GDEs and their structural morphologies
There are multiple variables to be considered during the fabrication process of the GDE which are to be used as working electrodes in the half-cell set-up. In order to coat the catalyst powder onto the GDL, a highly viscous ink needs to be formulated, sonicated and spread homogeneously onto a support structure. Different procedures are available for the coating ranging from hand-painting and dry-spraying via inkjet-printing towards automated airbrush set-ups. The factors which affect the formation of ink in the more routine RDE tests (against which we want to compare the new half-cell approaches), like ratio of isopropanol (IPA): water, amount of liquid ionomer present, temperature, catalyst loading, weight % of Pt on carbon support, sonication duration, catalyst deposition and drying method, geometric area of working electrode; are expected to severely affect the GDE half-cell measurements as well. In addition to these factors, other parameters, such as Nafion membrane type and thickness, type of GDL used and with/without subsequent hot pressing, which are traditionally associated with MEA fabrication, have also to be considered.
A higher weight percentage of Pt on the high surface area carbon support (like Vulcan XC72R) is usually chosen, as it has been found empirically that a more homogenous ink film will be obtained with higher noble metal content and lower carbon content. Commercial Pt/C catalysts like HiSPEC 4000 (40 wt %), HISPEC 3000 (20 wt %), Tanaka Kikinzoku Kogyo (TKK) (46.0 wt% TEC10E50E and 50.6 wt% TEC10E50E-HT) have been tested and an optimum ink recipe formulated based on the results of numerous empirical studies. A 1:3 (v:v) mixture of IPA:H2O (ultra-pure water with resistivity >18.2 MΩ) is used as the desired solvent for the ink. 1 wt% of total solids in IPA:H2O is usually used where the solid part consists of Nafion ionomer (5%–10% Nafion dispersion of D520 or D1021) and Pt/C in a gravimetric ratio of about 0.7. An ultrasonic bath or a horn sonicator or a combination of both can be used to homogenise the ink, preferably in an ice bath to prevent heating of the catalyst during the process. Ehelebe et al [13] used a horn sonicator for 20 min, while Inaba et al [11] preferred a protocol using an ultrasonic bath for 15 min and horn sonicator for 1 min [11–13, 16, 17].
Another important variable to be considered in the process is the GDL with MPL used for the fabrication of the GDE by applying the ink, mimicking the catalyst coated layer (CCL) configuration in MEAs. Sigracet 39 BC (325 μm thick), Sigracet 29 BC, Freudenberg H23C8 (230 μm thick) and Freudenberg H23C2 have all been used for the preparation of GDE by different groups. Nafion membrane N117 has been widely adopted as the preferred ionomer membrane, with the one exception of Pinaud et al [12] who used a perfluorosulfonic acid-based membrane of 17 μm, from Johnson-Matthey. A pre-treatment step is employed for such membranes, and following typical protocols reported in the literature, the membranes were treated in various storage/rinsing steps in the presence of 5 wt% H2O2, 8 wt % H2SO4 or ultra-pure water (18.2 Ω) at elevated temperature of around 80 °C. In an approach alternative to the GDE one described above, in which the ink is coated onto the GDL, so-called catalyst coated membranes (CCMs) can be achieved by applying the ink on the membrane instead. CCL-based GDEs can be tested with or without the membrane, while for the CCM-based catalysts there is no way around the additional hot-pressing step to join it to a GDL for testing.
The exact nature of the catalyst films formed on the surface of the working electrode has a considerable effect on the ORR activity measured for the respective electrocatalyst. There are multiple methods reported for application of the catalyst ink on the MPL coated side of the GDL. Ehelebe et al [13] reported the use of an ultrasonic spray-coater with a deposition rate of ∼6 μgPt cm−2 per cycle on Freudenberg H23C8 GDL at 85 °C. The Pt loading of the GDEs was measured by weighing the samples before and after the deposition which is similar to procedure followed for MEA preparation.
Inaba et al [11] utilized a TR-30-K1 nebulizer from Meinhart on a circular piece (∅ = 20 mm) of Sigracet 39 BC. The spray area was delimited to a circular area of ∅ = 3 mm at the centre of the GDL using a paper mask. In order to determine the ECSA, catalyst layers were prepared using the drop cast method similar to those used on glassy carbon tips in RDE. Aliquots of the catalyst ink was pipetted on the centre of the GDL to achieve the targeted catalyst loading of 5–55 μgPt cm−2 and dried at 100 °C. Sievers et al [17] furthermore opted for an unsupported Pt electrocatalyst utilizing thin film (TF) deposition on a magnetron electrode equipped with a planar target of 99.95% Pt. The platinum loadings of the sputtered Pt TFs were estimated by inductively coupled plasma mass spectrometry measurements. A Dektak 3ST profilometer was used to measure the film thickness. Corresponding to the Pt loadings of 11.7 μgPt cm−2, 16.2 μgPt cm−2, 29.4 μgPt cm−2 and 66.2 μgPt cm−2, the films had a thickness of 15 nm, 20 nm, 37 nm and 83 nm, respectively.
Instead of preparing GDEs in-house like in the previous studies, Pinaud et al [12] tested commercial GDEs purchased from Fuel Cells Etc with catalyst layer loading of 0.3 mg cm−2 Pt (40 wt% HiSpec 4000) supported on a Sigracet 29BC GDL. Circular samples of 20 mm diameter, delimited to ∅ = 15.6 mm, 1.91 cm2 exposed area by the O-ring, were used for half-cell tests. In order to mimic MEA testing, an ionomer membrane was hot-pressed directly on the GDE at 160 °C and 250 psi for 5 min. Ehelebe et al [13] conducted the GDE test without a Nafion membrane, which meant that the catalyst was exposed directly to the electrolyte, whereas Inaba et al [11], Alinejad et al [16] and Sievers et al [17] preferred testing GDEs with a membrane, albeit with no hot-pressing step involved. Samples with membranes needed to be pre-hydrated before testing for better ion transport. Water management, required to allow for reproducible testing, is the key difference between the testing protocols of the GDE- and CCM-based catalysts. GDEs without membranes allow for direct removal of water into the electrolytes. In case of CCMs, a membrane acts as a barrier for water transport. Additionally, proton transport across the membrane drags water electro-osmotically from the electrolyte to the catalyst. In order to prevent flooding of the catalyst layer, this water must be expelled through both the MPL and GDL. This makes it more complex to maintain constant conditions throughout the CCM test runs.
One of the major challenges of RDE testing has been the difficulty in studying those TFs formed on the tips in every detail. In GDE set-ups, it is by far less complex to characterize the catalyst layer formed on the surface of the GDL. The structure of these catalyst layers determines the surface activity and area. As shown in figure 3(C) and Ehelebe et al [13] performed an interesting study regarding catalyst morphology versus GDE loading. Different Pt loadings (from 0.02 to 0.4 mgPtcm−2) were prepared and the thickness of the catalyst film measured at different points on the GDE cross-section using scanning electron microscopy (SEM). The cross-sectional analysis revealed that the catalyst layer thickness is not directly proportional to the applied loading. It is moreover demonstrated that the catalyst layers are slightly more uniform at higher loadings. The average thickness obtained for the loadings 0.02 and 0.4 mgPt cm−2 was 1.59 ± 0.56 µm and 12.43 ± 2.64 µm, respectively. Sievers et al [17] also performed SEM measurements of Pt TFs, both top view as well as cross-section view (figures 3(E) and (F)), showing small Pt domains agglomerated into cauliflower-like structures (50 nm–150 nm size). The cross-section showed a porous top-surface layer and a denser attachment to the MPL of the GDE. X-ray diffraction patterns of Pt TFs deposited on GDL also exhibited broad diffraction peaks of the typical Pt facets (111), (200) and (220) crystal structure and an average crystallite size of ∼7 nm estimated by the Scherrer equation. Alinejad et al [16] also reported studies of identical location transmission electron microscopy (IL-TEM) in the GDE cell to analyse the degradation mechanism leading to the loss in active surface area with repeated load-cycles. A gold finder grid with a thin catalyst layer was sandwiched between the GDL and Nafion membrane. An accelerated degradation test protocol was performed and the difference in the IL-TEM was studied. Migration, coalescence and particle detachment were observed as consequence of the accelerated degradation test as seen in figures 3(A) and (B).

Figure 3. IL-TEM micrograph of Pt HiSPEC3000 catalysts (A) before and (B) after 1200 load-cycle treatments at 60 °C. Reproduced from [16]. © IOP Publishing Ltd. CC BY 3.0. SEM images of GDE with loadings of 0.02 mgPt cm−2 (C) and with 0.4 mgPt cm−2 (D) from a focused ion beam (FIB) cross-section at 54° tilt angle. Reproduced from [13]. [© 2019 THE ELECTROCHEMICAL SOCIETY]. CC BY 4.0. SEM micrographs of Pt thin films on GDE: top view (E) and cross-section view (F). Reproduced from [17]. CC BY 4.0.
Download figure:
Standard image High-resolution imageIL-TEM mentioned above can study localized degradation, but in order to analyse the whole catalyst layer, small angle x-ray Scattering (SAXS) has been found to be more appropriate as demonstrated by Schröder et al [18]. Particle size distributions of 1–2 nm, 2–3 nm and 4–5 nm Pt/C Tanaka catalysts were analysed after an accelerated stress test (AST). It was found that their degradation depended not only on the initial particle size, but also on the thickness of the catalyst films of the GDE with smaller nanoparticle size and thinner films showing more degradation. Particle coalescence and Ostwald ripening were found to be the main contributors to the degradation mechanism with only small indications of particle loss for the nanoparticles with larger initial size distribution.
4. Electrochemical measurements
4.1. Effect of electrolyte concentration
Two issues are to be addressed while deciding the electrolyte concentration: conductivity and contamination of catalytic surfaces. RDE is usually performed in 0.1 M or occasionally, in 0.5 M HClO4, where the current densities are usually lower. Perchloric acid is favoured over sulphuric acid, as it does not show (strong) specific anion adsorption and thus does not severely affect the RDE results [19, 20]. However, in GDE half-cell measurements the current densities are much higher and hence, the H+ concentration in dilute HClO4 becomes a limiting factor. For GDE half-cell measurements, HClO4 concentration as high as 1 M to 4 M has been reported. Higher concentration of the electrolyte leads to a reduced resistance between the working electrode and the reference electrode, hence, ensuring sufficiently high proton transport. Pinaud et al [12] studied the trends in resistance and found that ORR activity was higher in the lower concentrations and follows the trend 0.5 > 1.0 > 2.5 > 5.0 M HClO4 for a GDE with 0.3 mg cm−2 Pt loading. Resistance rises sharply after j = 500 mA cm−2, due to proton transport limitations. The decrease in activity with increasing concentration is likely caused by adsorbed impurities and perchlorate anions on the Pt sites which can penetrate the ionomers next to the Pt catalyst surface. Hydrogen adsorption/desorption and Pt oxidation/reduction features were shifted in the cyclic voltammograms (CVs) under inert gas, suggesting that the surface of the Pt is poisoned with increasing concentration. 1.0 M HClO4 is believed to balance the requirements of H+ transport, impurity and adsorption effects. Although perchloric acid is widely used as a non-adsorbing electrolyte, it is proven to inhibit ORR on Pt at high concentrations [21]. The specific adsorption of perchlorate anions on Pt facets in acidic media is highest in Pt {111} and lowest in Pt {100}. To eliminate specific adsorption effects on the electrocatalytic properties of Pt, TFMSA (trifluoromethanesulfonic acid or triflic acid) is recommended as HClO4 substitute.
Sievers et al [17] compared the ORR activities of Pt TFs with and without a Nafion membrane and found that the polarization curve in 1 M HClO4 resembled the curve in 4 M HClO4 in presence of Nafion membrane. These results reiterate that specific anion adsorption on the Pt sites inhibits the rate of oxygen reduction at the higher electrolyte concentrations. For GDE half-cell tests in the absence of ionomer membranes, a concentration of 1 M HClO4 is preferred. In addition, an increase in the geometric activity over the full potential window was observed in the presence of the Nafion membrane. No significant differences were seen in the kinetic region (up to 0.8 VRHE) while the mass transport region (0.3–0.8 VRHE) was slightly enhanced in presence of the membrane due to enhanced H+ transport and reduced flooding of the catalyst layer. At higher current densities, oxygen transport in the ionomer layer is critical for the performance of supported catalysts. Although unsupported catalysts like Pt TFs studied here are free of ionomers, the degree of wetting influences the oxygen transport in the catalyst layer.
4.2. Pre-treatment and determination of ECSA
GDE half-cell tests will require a conditioning step to clean the surface. The protocol for pre-treatment of the catalyst surface closely reflects the one used in RDE experiments. Repeated CVs in an inert atmosphere (like N2 or Ar) are necessary to clean the Pt surface, essentially between hydrogen and oxygen evolution in an aqueous electrolyte. Typically, >50 cycles at 100–500 mV s−1 in a potential range of 0.05–1.2 VRHE, are needed to achieve an electrochemically clean surface. However, an argument can be made about reducing the potential window to 1.1–0.1 VRHE to protect the integrity of the GDE carbon from extreme potentials avoiding significant carbon corrosion. Pt surface changes like roughening, dissolution and redeposition due to cycling between oxide formation and reduction are also a factor to be considered, while conditioning repeatedly back and forth at high potentials [22]. Inaba et al [11] also suggested to add a second pre-treatment step in O2 following the same protocols as in the inert atmosphere. In their work, Ar-purged pre-conditioning was seen to be insufficient to clean the GDE surface completely and like in MEA, potential cycling in O2/air was needed to fully activate the catalytic sites as shown in figure 4(A). Half-cell measurements with GDEs and CCMs are found to be less sensitive to contamination as compared to RDE measurements. Pinaud et al [12] speculated this to be due to the larger geometric area of 1.91 cm2 which is tested for GDEs compared to 0.196 cm2 glassy carbon electrodes used in RDE measurements. Catalyst loading was also assumed to have an impact as 0.3 mg cm−2 loading used in this study was significantly higher than 0.010–0.020 mg cm−2 generally used for RDE tests. In contrast to their work, it must be kept in mind that Inaba et al [11] performed their GDE measurements at smaller sample sizes of 3 mm diameter and low loading of 0.005 mgPtcm−2 more neatly resembling the RDE test situation, so that the overall effect of sensitivity to contamination is unknown.

Figure 4. (A) Impact of pre-conditioning [11-SI], (B) pre-treatment CVs (inset) and hydrogen desorption charge integration for ECSA [12]; (C) representative CO stripping voltammogram measured [11]; (D) CO oxidation charges with different catalyst loadings [11]; (E) influence of different methods of uncompensated resistance (Ru) determination on ORR [13]; (F) comparison of RDE vs GDE measurements in oxygen and air [13]; (G) influence of Pt loading on catalyst activity. Reproduced from [17]. CC BY 4.0; (H) polarization curves of identical GDEs with and without an ionomer membrane [12]. (A), (C) and (D) reproduced from [11] with permission of The Royal Society of Chemistry. (B) and (H) reproduced from [12]. [© 2017 THE ELECTROCHEMICAL SOCIETY.]. All rights reserved. (E) and (F) reproduced from [13]. [© 2019 THE ELECTROCHEMICAL SOCIETY]. CC BY 4.0.
Download figure:
Standard image High-resolution imageAn accurate ECSA measurement of the catalyst is an important step in the determination of the overall activity of a catalyst towards ORR. ECSA varies according to the Pt loading, geometric area exposed and quality of the TF and is necessary for normalising the values of the current obtained by the exact amount of active Pt sites exposed for electrocatalysis. Traditionally, and similar to RDE, it is measured by collecting the CVs from 0.05 to 1.2 VRHE in inert gas like Ar or N2 at a specific scan rate (usually, 100 mV s−1) or an average value of several scan rates (figure 4(B)). The Hupd region is then integrated and the characteristic charge of 210 μC cm−2 for polycrystalline Pt can be used to calculate the ECSA. However, the integration of the Hupd region results in overestimation of the surface area from the hydrogen evolution current in test cells with convective gas purging. Shutting off the gas flow during cycling helps in cancelling out this effect. The ECSA measurements in Pt HiSPEC 4000 used in these GDEs were about 60–70 m2 g−1 which showed a low Pt utilization of ∼50%. The Pt/Nafion ratio and carbon surface area make a significant impact on the fraction of Pt sites, which can be addressed electrochemically, hence altering the ECSA values significantly. Ehlebe et al [13] found that the ECSA derived from three different scan rates between 50 and 200 mV s−1 were comparable. For the different loadings of 11.7 μgPt cm−2, 16.2 μgPt cm−2, 29.4 μgPt cm−2 and 66.2 μgPt cm−2, ECSA between 42 m2 gPt −1 and 60 m2 gPt −1 were correspondingly observed with catalyst utilizations between 70% and 100%. No catalyst degradation during electrochemical measurements is observed as the ECSA before and after ORR were not significantly different.
An alternative to ECSA determination from the Hupd region can be CO adsorption on the Pt surface and its controlled stripping, as described in the following paragraphs. As reported by Rudi et al [23], CO stripping usually gives a larger ECSA value as the CO molecules have better access to a larger number of surface sites due to larger surface coverages compared to atomic hydrogen. In the set-up used by Inaba et al [11], the size of the exposed area (3 mm in diameter) is quite small. Consequently, when spray coating is used to apply the catalyst ink it is rather difficult to control the absolute amount of deposited catalyst. To accurately determine the ECSA, a calibration curve obtained by using the drop-cast method on GDL is therefore required. The ECSA of the catalyst was determined by conducting CO stripping voltammetry (figures 4(C) and (D)). For this, the working electrode was held at a lower potential like 0.05 or 0.1 V during a CO purge through the test cell followed by an inert gas purge. Then the WE was scanned from the lower potential to a higher potential like 1.2 V to obtain the CO oxidation charge. A fixed conversion coefficient of 390 μC cmPt −2 was used to calculate the ECSA from the stoichiometrically adsorbed CO on the Pt. A linear calibration curve was obtained for the CO oxidation charge vs the various Pt loadings and the slope was used to calculate the ECSA. At 60 °C, the CO stripping charge is reduced as the CO equilibrium coverage on Pt decreases when the temperature is increased. Under this protocol, Pt/C 46.5 wt% from TKK showed 81 m2 gPt −1 while Pt TF with 16.2 μgPt cm−2 showed 20 m2 gPt −1. There is also a decrease in ECSA observed for higher Pt loadings due to decreasing Pt utilization. Increasing the loading/film thickness leads to a lower Pt utilization due to the lack of long-range porosity for higher loadings in these sputtered Pt TFs. In RDE, the CO-stripping charge is usually larger than that of the Hupd charge. The differences between the ECSA values are considered to be due to reduced interfacial capacitance of CO-covered nanoparticle surfaces, resulting in smaller capacitance corrections [23]. However, if this difference in the CO-stripping charge and Hupd charge holds true for GDE half-cell testing as well remains still to be studied.
4.3. iR-compensation and measurement of ORR
In a typical ORR activity estimation using the RDE approach, the resistance is initially measured at open circuit potential and compensated for the iR drop. This works very well for a maximum ORR current of 6 mA cm−2 at 1600 rpm. However, when it comes to GDE this approach results in an over-compensation of the iR drop. Pinaud et al [12] has demonstrated this by comparing the ORR polarization curves (iR corrected) based on the resistance obtained at each current step by current perturbation versus the resistance measured at open circuit potential. The huge error (over-compensation) observed when using the conventional method in GDE is attributed to the decrease in resistance with increase in current. This would result from the significant temperature increase at the electrode's surface. They also emphasized that especially at high currents (∼1.5 mA cm−2), even a ±1% hypothetical error in the resistance can cause a substantial deviation of around 25 mV from the actual potential. As an example, Pinaud et al [12] observed ∼25 °C rise in the electrolyte temperature near the electrode surface during the polarization measurements by galvanostatic steps with 30 s time per current step. The significant heat evolution during ORR induced localized increase in temperature and the subsequent decrease in resistance. The stepping time for current was reduced to 10 s to minimize localized heating. Similarly, Ehelebe et al [13] have opted to increase the electrolyte volume to 250 ml, so that the excess electrolyte can act as a heat sink and reservoir. In this way, the increase in temperature of the electrolyte can be kept below 4 °C during the polarization measurements.
Therefore, it is vital to measure the resistance between the working and reference electrode as correctly as possible to extract the true kinetic parameters from the ORR curves without many errors. This resistance is the sum of the contribution from the ohmic resistance of the cell components, namely, electrolyte, catalyst layer, MPL, GDL, flow fields, plus the contact resistance A 10 mV deviation in potential can arise from 10 mΩ of uncompensated resistance at 1 A current. Therefore, it is important and strongly advised to keep the total resistance as low as possible while designing the GDE setup. Consequently, the relative positioning of the electrodes plays a crucial role in reducing the final resistance. The GDE half-cell design by Pinaud et al [12] yielded a very low resistance of between 0.5 and 1.5 Ω. This was achieved by placing the Pt counter electrode facing the working electrode and keeping the tip of the Luggin capillary to the side. To avoid the shielding error, the minimum distance between the tip of the Luggin capillary and the surface of the working electrode should be two times the tip diameter of the Luggin capillary. In contrast, in the cell design by Ehelebe et al [13], the opening of the Luggin capillary is kept 1 mm away from the working electrode giving rise to a minimum uncompensated resistance (Ru) of 0.5 Ω in 1 M HClO4. The counter electrode is placed parallel to the working electrode to ensure a homogenous electric filed and at the same time the electric field is also undisturbed by the design of the Luggin capillary. A similar design was also adopted in the Gaskatel Flexcell by drilling a Haber Luggin capillary at a fixed distance from the working electrode.
Apart from reducing the solution resistance, it is equally important to measure the resistance as precisely as possible. Several methods are adopted to measure the cell resistance. Ehelebe et al [13] have made a comparison of the polarization curves corrected for the solution resistance determined from different methods as shown in figure 4(E). It is evident from the polarization plots that the determination of ORR activity is significantly influenced by the accuracy of iR corrections at currents higher than 200 mA (j > 100 mA cm−2). They performed ORR in galvanostatic steps with integrated on-line current-interrupt measurement at every recorded polarization data point (from −0.1 mA to −4.0 A) to evaluate the uncompensated resistance. The employed protocol performed well for currents up till a maximum of 4 A, under ambient conditions (101 kPa, 20 °C).
The use of constant current polarization measurements in GDE half-cell, similar to MEA testing was first proposed by Pinaud et al [12]. In GDE half-cell experiments, CVs are not ideal in evaluating the ORR activity. They pointed out that CV measurements are challenging because the changing magnitude of the iR correction results change in the scan rate after iR correction. This in turn leads to a slower scan rate at high current regime than the set value. The considerable effect of iR drop on the actual scan rate in potentiodynamic experiments cannot bring useful results even after corrections using computational methods. This often-underestimated problem with iR drops is well detailed by Oeßner et al [24]. The second reason CV measurements are challenging in a GDE half-cell is due to the high currents at relatively lower overpotentials achieved from the transport of gaseous O2 to the catalyst site instead of the dissolved O2 present in the electrolyte. For these reasons, they used constant current polarization measurements to evaluate ORR activity. In their testing protocol, the potential was held at 0.1 VRHE for 5 min in Ar to pre-reduce the Pt surface, followed by at OCV for 2 min in O2 and then current density was stepped from 0 to 1750 mA cm−2 in various steps with 10 s hold using a staircase galvano electrochemical impedance spectroscopy (SGEIS) technique in O2 with impedance measurement (f = 50–0.5 kHz) at each step. The GDE was tested both with (to mimic a bonded MEA) and without a membrane hot pressed to the catalyst side. Identical performance was observed at low currents as represented in figure 4(H). However at high currents >750 mA cm−2, the increased flooding in the GDE with membrane resulted into performance loss compared to GDE without membrane. A comparison on a GDE with 0.3 mg cm−2 Pt/C (40 wt%) on Sigracet 29BC MPL/GDL yielded similar results for the constant current ORR polarization and for constant potential polarization.
Inaba et al [11] for instance employed linear sweep voltammetry (LSV, anodic scan with scan rate of 50 mV s−1 or 100 mV s−1) with positive feedback at a certain frequency to determine ORR activity. The solution resistance was online recorded using a superimposed AC signal (5 mV, 5 kHz) and compensated via an analogue positive feedback scheme. Here still the challenge of change in resistance with increase in the current density persists which could lead to errors and overcompensation of the voltage measurements. The corrections for the non-faradaic currents were carried out by measuring the CV in Ar purged electrolyte at similar scan rate and then subtracting the resulting non-faradaic background from the ORR polarization curves. Under non-humidified conditions (at ambient temperature), the ORR polarization curve reaches current densities of up to 0.5 A cmgeo −2. ORR reaches its maximum at around 0.2–0.3 VRHE corresponding to the potential where Hupd on Pt sets in. Whereas under humidified condition, the ORR current reported to increase by a factor of two. Sievers et al [17] also tested the ORR activity with a similar protocol utilizing LSV for Pt TF catalyst on the GDE with varying Pt loadings, as shown in figure 4(G).
4.4. Data analysis using SA and Tafel plots
The above authors believe that GDE half-cell measurements provide a more realistic performance of a catalyst and how it will perform in a real fuel cell test. In RDE measurements, the activity is mostly evaluated at 0.9 VRHE, whereas in GDE half-cell measurements real fuel cell operating potential ranges (0.6–0.8 V) can be reached for catalyst evaluation (figure 4(F)). Tafel analysis by Pinaud et al [12] on GDE without membrane showed Tafel slopes of −74 mV decade−1 and −133 mV decade−1 in the low and high current density regimes, respectively. The transition in the slope values results from the change in the rate limiting step and the concentration of surface intermediates. The transition between low and high current range was observed at 0.83 V in their study. Ehelebe et al [13] reported a Tafel slope of 53 mV decade−1 at low current densities (0.84 VRHE) and a higher Tafel slope of 100 mV decade−1 at higher current densities (<0.8 VRHE). This can be translated into specific current density and mass-specific current density of around 20 mA cmPt −2 or 10 mA mgPt −1, respectively, at a potential of 0.7 VRHE for RDE, whereas in air purged GDE, at 0.75 V vs. RHE current densities values of 5 mA cmPt −2 or 2.5 mA mgPt −1 are observed, respectively. Similarly, Inaba et al [11] showed a Tafel slope of around 70 mV decade−1 for GDE with membrane in the low current region (down to −0.8 VRHE) without any mass transport corrections. They have reported an SA of 25.9 mA cmPt −2 at 0.65 VRHE at 25 °C.
The polarization curves reported by Inaba et al [11] and Sievers et al [17], show severe mass transport limitation at a potential lower than 0.75 VRHE compared to the reports by Pinaud et al [12] and Ehelebe et al [13]. This could be due to the difference in the GDE design or the difference in measurement techniques used for the performance evaluations, as mentioned in the above section. Ehelebe et al [13] compared the performances of the same catalyst tested with their GDE half-cell to the polarization data obtained by Pinaud et al [12] and showed comparable results. This hints towards the possibility of using GDE half-cell testing in future for catalyst performance evaluation, leaving room for further development in this field.
5. Accelerated testing for durability
Long-term stability of novel catalysts cannot be addressed in realistic year-long testing but is commonly studied by using ASTs. Different protocols for durability testing in PEMFC have been proposed by DOE, Fuel Cell commercialisation Conference of Japan (FCCJ), etc. Durability tests also must be adapted for the GDE half-cell approach with testing strategies that are optimal for applying realistic FC conditions as well as reducing the time period for testing the performance loss. This has been tackled by Alinejad et al [16] by using the protocols put forward by the FCCJ which simulate load-cycle and start-up/shutdown conditions of a fuel cell and adapted them for the GDE half-cell set-up. Three different AST protocols were tested in the half-cell: firstly, by simulating the load cycles, where the electrode potential was modulated with a square wave and stepped between 0.6 and 1.0 VRHE with a holding time of 3 s at each voltage for 9000 potential cycles; secondly, by simulating start-up/shutdown conditions where the electrode potential was cycled with a scan rate of 0.5 V s−1 between 1.0 and 1.5 VRHE for 9000 potential cycles; and thirdly by mixing the above two protocols with 500 potential cycles of the load-cycling protocol followed by 10 potential cycles of the start-up/shutdown protocol, repeated overall 18 times. It is shown that the protocol to simulate load-cycle conditions is suitable for evaluation of the degradation behaviour of the electrocatalyst, whereas the protocol for simulating start-up/shutdown conditions leads to corrosion of the carbon in the catalyst support as well as the GDL. A combination of the two protocols is proposed as currently the best alternative method for degradation evaluation. In order to study the ECSA as a function of temperature and initial size distribution for the whole catalyst layer, a combination of GDE half-cell testing and SAXS measurements were used by Schröder et al [18]. A simulated load-cycle protocol was applied similar to the one reported by Alinejad et al [16], with potential steps between 0.6 and 1.0 VRHE in O2 atmosphere at 25 °C and 50 °C. Irrespective of the initial nanoparticle size, an end-of-treatment size of around 6 nm was observed after the AST. As expected, the ECSA was higher for the smaller nanoparticles and correspondingly, also shows the highest loss due to degradation. Such a combinatorial study of GDE-SAXS has been found to be a straightforward way of mechanistic study in conjunction with electrochemical measurements.
6. Challenges linked to benchmarking electrocatalysts in RDE, GDE half-cells and MEA measurements and future opportunities
Novel and tailored electrocatalysts need solid routines for benchmarking their performance, and an ORR activity determined in a model approach, i.e. RDE, GDE half-cell, should strictly reflect its performance in the latter device. Best practice protocols and benchmarking has been extensively done for the RDE method with model Pt electrocatalysts to eliminate uncertainties and errors in performance measurements among various research groups [22, 25–28]. The greatest disadvantage of RDE has been the low diffusion and solubility of O2 in aqueous electrolytes due to which activities are measured at the kinetic region (0.9 or 0.85 VRHE). In MEAs, the electrocatalysts applied on porous GDLs enable improved diffusion of O2. The better oxygen transport in the gas phase through these pores enables to measure activities in the working potential of 0.6–0.8 VRHE. In contrast to only minute amounts of catalyst material in RDE, benchmarking in MEA tests requires considerably higher amounts of electrocatalysts and expensive test benches which are economically not viable for early-stage catalyst development. There have been major discrepancies in the activity measurements in going from RDE testing to MEA testing. As discussed by Pan et al [29], floating electrode technique introduced by Zalitis et al [10] provides ECSA and SA values comparable to MEA. A functionalized porous membrane situated close to gas channels is used to deposit a low amount of electrocatalyst. However, transport-limited behaviour was seen for higher catalyst loadings due to the lack of convective gas flow [11, 12]. Only recently, GDE half-cells have been introduced as a technique to bridge this gap and have been proven to have clear advantages. They ensure economical use of Pt catalysts at the testing stages similar to RDE, while also mimicking the three-phase boundary like in MEAs. GDE half-cell tests exhibits comparable oxygen mass transport to the electrode as a fuel cell device, in contrast to the limited mass transport in RDEs. Realistic operational conditions in the GDE set-ups are more akin to MEA testing than RDEs without the hassle of full-cell tests. Figure 5 shows a schematic illustration for the set ups used in RDE, half-cell and full fuel cell for the electrochemical analysis of thin films on glassy carbon, GDEs and MEAs, respectively. Inaba et al [11] compared the ECSA and the ORR SA for various techniques at different Pt loadings and temperatures and noted that at 0.9 VRHE, these values were similar to those obtained from MEA measurements.

Figure 5. Schematic illustration of RDE set up for electrochemical analysis of thin films on glassy carbon, half-cell set up for gas diffusion electrodes and full fuel cells for membrane electrode assemblies.
Download figure:
Standard image High-resolution image
Attempts at benchmarking a GDE half-cell set up have been done by Inaba et al [11]. However, multiple cell designs exist, e.g. from Pinaud et al [12] and Ehlebe et al [13] who used a different protocol for testing and hence rendering comparisons between the techniques difficult. All the GDE set-ups showed higher current densities for ORR which were significantly better than those which can be obtained in RDE. However, for comparison between GDE and MEA testing conditions, either thermodynamic or kinetic corrections or both, have to be applied because of the differences in the testing conditions (temperature and O2 partial pressure). A relatively good agreement has been found in the ECSA and SA between the GDE and MEA results.
In the future, there will be the need for a common best practice method. Numerous research groups using the above testing methods should team up, discuss and find a common ground to reproducibly and reliably carry out catalyst evaluation: on (a) catalyst ink preparation, (b) types of GDL and membrane used, (c) procedure of coating on GDL or membrane, (d) catalyst loading to be used, (e) electrolyte and the concentration, (f) pre-treatment protocols in inert gas and/or oxygen, (g) consistent ECSA measurements in either Hupd method or CO stripping method (h) temperatures, scan rates, gas pressure or flow rates, (i) protocol for ORR measurement by LSV or SGEIS and (j) how to calculate activity and performance in comparison to MEA. Also, degradation testing has only been reported by Alinejad et al [16] and Schröder et al [18] following an AST protocol. Such degradation testing has also to be done in other GDE set-ups to judge the performance, not only of the electrocatalysts but the set-ups as well (joint round-robin tests are advised here). Moreover, potential for application exists in using these set-ups for reactions other than ORR like in electrochemical CO2 reduction, hydrogen evolution reaction, etc. These studies have a unique opportunity for mechanistic analysis where the combination with other techniques like gas chromatography–mass spectrometry has the potential to give valuable insights.
Data availability statement
No new data were created or analysed in this study.
Acknowledgments
This work was supported by the German Research Foundation DFG Project ID RO 2454/19-1. We would also like to thank the Equal Opportunities Department of University of Bayreuth and the Bavarian Gender Equality Grant 2019-20 (for Women in Academia) for funding and support.
Conflict of interests
The authors declare that there is no conflict of interests.