
Abstract
In this research, we explore the impacts of cross-modal correspondence between sound frequency and color lightness on consumers’ shopping behavior. Compared to previous studies that relied on a stable single-stage information environment, our study is based on a two-stage (i.e., elimination and choice stages) cognitive model to account for the dynamic cross-modal correspondence effect on shopping behavior. After conducting two laboratory experiments and one field experiment, we find that although consumers tend to pay more attention to light (vs. dark) products in the high (vs. low)-frequency sound condition in the elimination stage, this effect is less salient at the choice stage. We further find that consumer involvement acts as a moderator. Specifically, the correspondence effect is attenuated for highly involved consumers.


Notes
Because of the log-normal distribution of the click-through rate and conversion rate, we followed Chesnes et al. (2017) and presented the median treatment effects.
The eye tracker could monitor participants’ gaze throughout the experiment and capture eye fixations according to a specified criterion. If participants’ eyes moved too quickly (i.e., less than 0.175 seconds in one area), their attention would not be recorded. In addition, participants were free to gaze anywhere on the page in the experiment, or even not look at the screen.
There was no “end” button on the screen, but participants could control their own eyes and would move their own eyes when they felt uninterested in the images in studies 1 and 2.
Following Hagtvedt and Brasel (2016), visual attention was measured by the total fixation duration in seconds within the area of interest (AIO). We used 0.175 s as the fixation floor. Thus, a fixation was measured when participants’ eyes stayed at AIO corresponding to a hat for at least 0.175 s. The total fixation time was used for measuring participants’ visual attention towards hats at the first stage (M = 1.56, SD = 0.83) and at the second stage (M = 4.18, SD = 1.52).
References
Agarwal, A., Hosanagar, K., & Smith, M. D. (2011). Location, location, location: an analysis of profitability of position in online advertising markets. Journal of Marketing Research, 48(6), 1057–1073.
Andrews, J. C., Durvasula, S., & Akhter, S. H. (1990). A framework for conceptualizing and measuring the involvement construct in advertising research. Journal of Advertising, 19, 27–40.
Beach, L. R., & Terence, R. M. (1987). Image theory: Principles, goals, and plans in decision making. Acta Psychologica, 66(12), 201–220.
Bettman, J. R., & Park, C. W. (1980). Effects of prior knowledge and experience and phase of the choice process on consumer decision processes: A protocol analysis. Journal of Consumer Research, 7(3), 234–248.
Bettman, J. R., Luce, M. F., & Payne, J. W. (1998). Constructive consumer choice processes. Journal of Consumer Research, 25(3), 187–217.
Chesnes, M., Dai, W., & Jin, G. Z. (2017). Banning foreign pharmacies from sponsored search: The online consumer response. Marketing Science, 36(6), 879–907.
Chung, S., Kramer, T., & Wong, E. M. (2018). Do touch interface users feel more engaged? The impact of input device type on online shoppers’ engagement, affect, and purchase decisions. Psychology & Marketing, 35(11), 795–806.
Dijksterhuis, A. (2004). Think different: The merits of unconscious thought in preference development and decision making. Journal of Personality and Social Psychology, 87(5), 586–598.
Dijksterhuis, A., & Nordgren, L. F. (2006). A theory of unconscious thought. Perspectives on Psychological Science, 1(2), 95–109.
Evans, K. K., & Treisman, A. (2010). Natural cross-modal mappings between visual and auditory features. Journal of Vision, 10(1), 1–12.
Ge, X., Häubl, G., & Elrod, T. (2012). What to say when: Influencing consumer choice by delaying the presentation of favorable information. Journal of Consumer Research, 38(6), 1004–1021.
Gilbride, T. J., & Allenby, G. M. (2006). Estimating heterogeneous EBA and economic screening rule choice models. Marketing Science, 25(5), 494–509.
Hagtvedt, H., & Brasel, S. A. (2016). Cross-modal communication: Sound frequency influences consumer responses to color lightness. Journal of Marketing Research, 53(4), 551–562.
Hecht, D., & Reiner, M. (2009). Sensory dominance in combinations of audio, visual and haptic stimuli. Experimental Brain Research, 193(2), 307–314.
Hung, S. M., Styles, S. J., & Hsieh, P. J. (2017). Can a word sound like a shape before you have seen it? Sound-shape mapping prior to conscious awareness. Psychological Science, 28(3), 263–275.
Iordanescu, L., Grabowecky, M., Franconeri, S., Theeuwes, J., & Suzuki, S. (2010). Characteristic sounds make you look at target objects more quickly. Attention, Perception, & Psychophysics, 72(7), 1736–1741.
Janiszewski, C., Kuo, A., & Tavassoli, N. T. (2013). The influence of selective attention and inattention to products on subsequent choice. Journal of Consumer Research, 39(6), 1258–1274.
Klapetek, A., Ngo, M. K., & Charles, S. (2012). Does crossmodal correspondence modulate the facilitatory effect of auditory cues on visual search? Attention, Perception, & Psychophysics, 74(6), 1154–1167.
Krishna, A. (2012). An integrative review of sensory marketing: Engaging the senses to affect perception, judgment, and behavior. Journal of Consumer Psychology, 22(3), 332–351.
Krishna, A., & Schwarz, N. (2014). Sensory marketing, embodiment, and grounded cognition: A review and introduction. Journal of Consumer Psychology, 24(2), 159–168.
Kumar, A., & Tan, Y. (2015). The demand effects of joint product advertising in online videos. Management Science, 61(8), 1921–1937.
Lee, L., & Ariely, D. (2006). Shopping goals, goal concreteness, and conditional promotions. Journal of Consumer Research, 33(1), 60–70.
Ludwig, V. U., Adachi, I., & Matsuzawa, T. (2011). Visuoauditory mappings between high luminance and high pitch are shared by chimpanzees (pan troglodytes) and humans. Proceedings of the National Academy of Sciences, 108(51), 20661–20665.
Marks, L. E. (1987). On cross-modal similarity: Auditory–visual interactions in speeded discrimination. Journal of Experimental Psychology: Human Perception and Performance, 13(3), 384–394.
Melara, R. D. (1989). Dimensional interaction between color and pitch. Journal of Experimental Psychology. Human Perception & Performance, 15(1), 69–79.
Owens, A., & Efros, A. A. (2018). Audio-visual scene analysis with self-supervised multisensory features. In V. Ferrari, M. Hebert, C. Sminchisescu, & Y. Weiss (Eds.), Computer Vision – ECCV 2018. ECCV 2018. Lecture Notes in Computer Science (Vol. 11210).
Payne, J. W. (1976). Task complexity and contingent processing in decision making: An information search and protocol analysis. Organizational Behavior and Human Performance, 16(8), 252–271.
Payne, J. W., Bettman, J. R., & Johnson, E. J. (1988). Adaptive strategy selection in decision making. Journal of Experimental Psychology: Learning, Memory, and Cognition, 14(7), 534–552.
Petty, R. E., Cacioppo, J. T., & Schumann, D. (1983). Central and peripheral routes to advertising effectiveness: The moderating role of involvement. Journal of Consumer Research, 10(2), 135–146.
Puccinelli, N. M., Goodstein, R. C., Grewal, D., Price, R., Raghubir, P., & Stewart, D. (2009). Customer experience management in retailing: Understanding the buying process. Journal of Retailing, 85(1), 15–30.
Puccinelli, N. M., Chandrashekaran, R., Grewal, D., & Suri, R. (2013). Are men seduced by red? The effect of red versus black prices on price perceptions. Journal of Retailing, 89(2), 115–125.
Roberts, J. H., & James, M. L. (1991). Development and testing of a model of consideration set composition. Journal of Marketing Research, 28(11), 429–440.
Shen, H., & Sengupta, J. (2014). The cross-modal effect of attention on preferences: Facilitation versus impairment. Journal of Consumer Research, 40(5), 885–903.
Shiv, B., & Fedorikhin, A. (1999). Heart and mind in conflict: The interplay of affect and cognition in consumer decision making. Journal of Consumer Research, 26(3), 278–292.
Song, Y., Chee, W., Yang, S., & Luo, X. (2018). The effectiveness of contextual competitive targeting in conjunction with promotional incentives. International Journal of Electronic Commerce, 22(3), 349–385.
Spence, C. (2011). Crossmodal correspondences: A tutorial review. Attention, Perception, & Psychophysics, 73(4), 971–995.
Spence, C. (2012). Managing sensory expectations concerning products and brands: Capitalizing on the potential of sound and shape symbolism. Journal of Consumer Psychology, 22(1), 37–54.
Steinhart, Y., Mazursky, D., & Kamins, M. A. (2013). The process by which product availability triggers purchase. Marketing Letters, 24(3), 217–228.
Suri, R., & Monroe, K. (2003). The effects of time constraints on consumers’ judgments of prices and products. Journal of Consumer Research, 30(1), 92–104.
Tavassoli, N. T., & Lee, Y. H. (2003). The differential interaction of auditory and visual advertising elements with Chinese and English. Journal of Marketing Research, 40(4), 468–480.
Taylor, S., & Todd, P. (1995). An integrated model of waste managient behavior: A test of household recycling and composting intentions. Environment and Behavior, 27, 603–630.
van Zee, E. H., Paluchowski, T. F., & Beach, L. R. (1992). The effects of screening and task partitioning upon evaluations of decision options. Journal of Behavioral Decision Making, 5, 1–23.
Yang, S., & Xiong, G. (2019). Try it on! Contingency effects of virtual fitting rooms. Journal of Management Information Systems, 36(3), 789–822.
Yang, S., Song, Y. P., & Pancras, J. (2017). Matching exactly or semantically? An examination of the effectiveness of synonym-based matching strategy in Chinese paid search market. Journal of Electronic Commerce Research, 18(1), 32–51.
Zaichkowsky, J. L. (1985). Measuring the involvement construct. Journal of Consumer Research, 12(3), 341–352.
Acknowledgements
We acknowledge the financial supports from the National Natural Science Foundation of China (no. 71972035, 71702052, 71602026), Hunan Science Foundation (2018JJ3086), the Fundamental Research Funds for the Central Universities, and DHU Distinguished Young Professor Program. We are most grateful to Tao Li for his helpful discussions in conceptualization and research design.
Funding
The authors were supported by the National Natural Science Foundation of China (no. 71972035, 71702052, 71602026), Hunan Science Foundation (2018JJ3086), the Fundamental Research Funds for the Central Universities, and DHU Distinguished Young Professor Program.
Author information
Authors and Affiliations
Corresponding authors
Additional information
Publisher’s note
Springer Nature remains neutral with regard to jurisdictional claims in published maps and institutional affiliations.
Appendices
Appendix 1. Laboratory experiment design for study 1
Procedures:
-
1)
Briefly explain that the objective of the laboratory experiment is to understand consumer online shopping behavior and inform participants that they will be compensated with gift certificates valued at 20 CNY for a convenience store in the university.
-
2)
Ask participants whether they have an initial preferred shade of red. If yes, ask them to indicate their preferred shade from the following five different levels of red lightness.

-
3)
Participants are then seated at the eye-tracker computer. The guide mentions the following to the participants: “Imagine you are going to buy a new hat and find some hats at an online store. Please keep your eyes on the screen.”Footnote 2
-
4)
Lead the participants to go to the online store website. Tell the participants that the store website will display two available hats to them quickly. Use the following screen that was captured from the website as an example.Footnote 3

-
5)
(Elimination stage) The website will show two red hats for 10 s where one is light (100% value) and the other is dark (60% value). The order of the two red hats is randomized. Each hat was priced at approximately 68 CNY (approximately $9.81) and introduced simply without any brand information. Participants will be exposed to either a high-frequency tone (approximately 1800 Hz) or a low-frequency (approximately 120 Hz) tone of “Turkey in the Straw” at a predetermined volume displayed by the research assistant on his mobile phone.
-
6)
(Choice stage) Show the participants the following screen as an example. Tell the participants that they are going to consider whether to make a purchase and remind them to keep their eyes on the screen. The screen will be displayed for 30 s (there was no “end” button on the screen). Participants will still be exposed to either the high-frequency or the low-frequency tone.
-
7)
Instruct them to fill in their perceived sound frequency and background information:
-
Perceived sound frequency, gender, age, monthly living expenses, online shopping frequency
-


-
8)
End of the session. Thank the subjects for their participation.
Appendix 2. Laboratory experiment design for study 2
Procedures:
-
1)
Briefly explain that the objective of the laboratory experiment is to understand consumer online shopping behavior.
-
2)
Ask participants whether they have an initial preferred shade of blue. If yes, ask them to indicate their preferred shade of blue from the following five different shades of blue.

-
3)
Participants in the condition of low involvement were instructed that “Imagine you are going to buy a new T-shirt and find some T-shirts at an online store.” Participants in the condition of high involvement were instructed to “Imagine that our Business and Management School is going to launch some T-shirts to the students at our school. The school has posted the T-shirts to its online store. You are going to buy a new T-shirt from the online store.”
-
4)
Lead the participants to go to the online store website. Tell the participants that the store website will display two available T-shirts to them quickly. Use the following screen that was captured from the website as an example.


-
5)
(Elimination stage) The website will show two blue T-shirts for 10 s where one is light (100% value) and the other is dark (60% value). The order of the two blue T-shirts is randomized. Participants will be exposed to either a high-frequency tone (approximately 1800 Hz) or a low-frequency (approximately 120 Hz) tone of “Turkey in the Straw” at a predetermined volume displayed by the research assistant on his mobile phone.
-
6)
Participants were asked whether they would like to click on the light/dark blue T-shirt to obtain more information and instruct them to fill in their click intention on each T-shirt (1 = extremely unlikely, and 7 = extremely likely).
-
7)
(Choice stage) Show the participants the following screen as an example. Tell the participants that they are to consider whether to make a purchase. The screen will be displayed for 30 s (there was no “end” button on the screen). Participants will still be exposed to either the high-frequency or the low-frequency tone.

-
8)
Instruct the subjects to fill in their purchase intention on each T-shirt (1 = extremely unlikely, and 7 = extremely likely).
-
9)
Instruct them to fill in their perceived sound frequency and background information, including perceived sound frequency, involvement, gender, age, monthly living expenses, and online shopping frequency.
-
10)
End of the session. Thank the subjects for their participation.
Appendix 3. Results of models with correlated error terms in laboratory studies
To estimate the cross-modal effects on participants’ visual attention in study 1, we specify the model below:
where Yitr represents participant i’s visual attention ratio (i.e., the ratio of the fixation time to total exposure time) on hat r (0 for the light red hat and 1 for the dark red hat) on stage t (0 for the elimination stage and 1 for the choice stage). The Correspondenceir represents the correspondence of background music and product color that was displayed for consumer i (1 for correspondence (i.e., high-frequency music with the light red hat or the low-frequency music with the dark red hat) and 0 for non-correspondence (i.e., the other combinations of color and sound)). In the model, we also include controls for participant i’s initial color preference (Preferencei), gender (Genderi), age (Agei), living expenses (Expensei) and online shopping frequency (Frequencyi).
Given that a participant’s attention levels at the two stages are not independent, we follow previous literature (Agarwal et al., 2011) and correlate the error terms of the models for participant i’s attention ratio at the two stages as follows:
where \( {\varepsilon}_{irt}^{ARES} \) represents the error term of participant i’s attention ratio at the elimination stage, and \( {\varepsilon}_{irt}^{ARCS} \) represents the error term of participant i’s attention ratio at the choice stage.
Table 3 shows the results of the models with correlated error terms. The results indicate that the audiovisual cross-modal correspondence effects for the attention ratio are significant at both the elimination stage (0.136, p < 0.001) and the choice stage (0.027, p < 0.001). Moreover, the coefficient of correspondence for the attention ratio was significantly greater at the elimination stage than that at the choice stage (χ2(1) = 94.92, p < 0.001). These findings imply that compared to the elimination stage, the cross-modal correspondence effect on consumers’ visual attention is attenuated at the choice stage.
Similarly, we estimate the cross-modal effects on participants’ visual attention and the moderating effect of involvement in study 2 with correlated error terms as follows:
where Yirt represents participant i’s intention on T-shirt r (0 for the light blue T-shirt and 1 for the dark blue T-shirt) on stage t (click intention at the elimination stage and purchase intention at the choice stage). The Correspondenceir represents the correspondence of background music and product color that was displayed for consumer i (1 for correspondence (i.e., high-frequency music with the light blue T-shirt or the low-frequency music with the dark blue T-shirt), and 0 for noncorrespondence (i.e., the other combinations of color and sound)). Involvementi represents consumer i’s perception of personal relevance related to product categories or shopping tasks (1 for high involvement and 0 for low involvement). In the model, we also include controls for participant i’s initial color preference (Preferencei), gender (Genderi), age (Agei), living expenses (Expensei) and online shopping frequency (Frequencyi).
Given that a participant’s intentions at the two stages are not independent, we correlate the error terms of the models for participant i’s intention at the two stages as follows:
where \( {\varepsilon}_{it}^{IES} \) represents the error term of participant i’s click intention at the elimination stage, and \( {\varepsilon}_{it}^{ICS} \) represents the error term of participant i’s purchase intention at the choice stage.
Table 4 shows the results of the models with correlated error terms. The results indicate that the audiovisual cross-modal correspondence effect for intention is significant at the elimination stage (2.917, p < 0.001) and at the choice stage (0.733, p < 0.01). In addition, the coefficient of correspondence for intention at the elimination stage was significantly greater than that at the choice stage (χ2(1) = 49.880, p < 0.001). Moreover, the results also indicate that the moderating effects of involvement are negative at both the elimination stage (−2.328, p < 0.001) and at the choice stage (−0.511, p < 0.1), which provides more evidence for the robustness of our results.
Appendix 4. Measures of main variables
All measures were reported on a 1–7 scale (1 = extremely disagree, 7 = extremely agree).
Construct | Item | Source |
Visual attentionFootnote 4 | Visual attention was measured by the total fixation duration in s within the area of interest (AIO). | Hagtvedt and Brasel (2016) |
Click intention (α = 0.89) | 1. I feel like clicking the item now. 2. I would like to click on the item as soon as possible. 3. I would like to click on the item right away. | |
Purchase intention (α = 0.88) | 1. I feel like buying this item now. 2. I would like to buy the item as soon as possible. 3. I would like to buy the item right away. | |
Consumer involvement (α = 0.87) | 1. I perceive this item as very important. 2. I perceive this item as very significant. 3. I perceive this item as very valuable. 4. This item matters a lot to me. 5. This item means a lot to me. | Zaichkowsky (1985) |
Appendix 5. Experimental design of field study 3

Platforms used to conduct the field experiment. a The control platform. b The treatment platform. Note: Music was played only for PC customers. We thus collected data only from PC customers. In addition, there is no music stop/pause button on the platforms during the whole experimental period

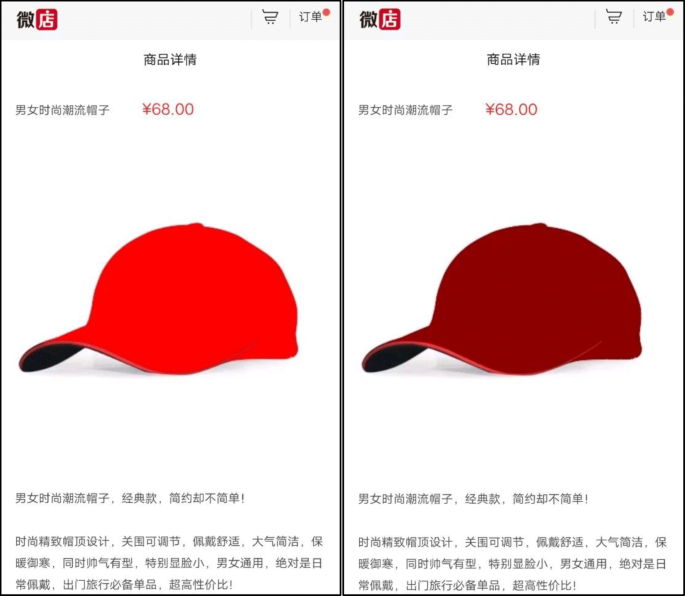
Pages used to display products in elimination and choice stages. a The elimination stage. b The choice stage. Note: All products (with a product picture, the price, and a description) at the platform would be exposed to consumers when they visited the platform (the elimination stage). If a consumer was interested in a product, she/he would click on the product and be led to the landing page of the product’s page to learn about the details (e.g., size information, materials) of the product (the choice stage). Both platforms display the product pictures on the left and details of the product on the right and bottom of the page. If the consumers took an action to purchase, a conversion was recorded
Appendix 6. Differences in prices, pre-treatment clicks, and pre-treatment conversions of treated and control products
There were 16 and 13 products at the control and treatment platforms, respectively. There are no significant differences in product prices, pre-treatment clicks, and pre-treatment conversions between the products at the two platforms (ps > 0.1).
Analysis | Product type | Mean | St. Dev. | p-value (t-value) |
Price | Treated | 9.888 | 3.665 | 0.221 (1.278) |
Control | 13.438 | 9.460 | ||
Clicks | Treated | 55.500 | 74.437 | 0.785 (0.276) |
Control | 64.538 | 101.805 | ||
Conversions | Treated | 6.375 | 9.946 | 0.300 (1.058) |
Control | 3.077 | 5.766 |
Appendix 7. Robustness checks in field study 3
We note that both the click-through rate (mean: 0.070; Std.: 0.115) and conversion rate (mean: 0.049; Std.: 0.135) have a relatively high SD-vs-value ratio. This could be because the utility of the individual choice in clicking on a product or converting it to a sale follows an independent and identically distributed (i.i.d.) extreme value distribution rather than a normal distribution (Agarwal et al., 2011). To address this issue, we checked the robustness of the cross-modal correspondence effects in some alternative specifications (see Table 3). Column (1) followed Agarwal et al.’s (2011) approach and used a logit model to check the robustness of our results. In Column (2), we modeled the logarithm of the dependent variables, and in Column (3), we used the standardized values of dependent variables in the model. The results of Columns (1)-(3) were similar to those in Table 2; thus, our results are robust.
Rights and permissions
About this article

Cite this article
Yang, S., Chang, X., Chen, S. et al. Does music really work? The two-stage audiovisual cross-modal correspondence effect on consumers’ shopping behavior. Mark Lett 33, 251–276 (2022). https://doi.org/10.1007/s11002-021-09582-8
Accepted:
Published:
Issue Date:
DOI: https://doi.org/10.1007/s11002-021-09582-8