Article

Effects of Dam Construction in the Wang River on Sediment Regimes in the Chao Phraya River Basin

by
Warit Charoenlerkthawin
1,2,
Matharit Namsai
1,3,
Komkrit Bidorn
2,
Chaipant Rukvichai
1,
Balamurugan Panneerselvam
4 and
Butsawan Bidorn
1,2,*
1
Department of Water Resources Engineering, Chulalongkorn University, Bangkok 10330, Thailand
2
WISE Research Unit, Chulalongkorn University, Bangkok 10330, Thailand
3
The Royal Irrigation Department, Bangkok 10300, Thailand
4
Department of Civil Engineering, M. Kumarasamy College of Engineering, Karur, Tamilnadu 639113, India
*
Author to whom correspondence should be addressed.
Water 2021, 13(16), 2146; https://doi.org/10.3390/w13162146
Submission received: 28 June 2021 / Revised: 2 August 2021 / Accepted: 2 August 2021 / Published: 4 August 2021
(This article belongs to the Section Water Erosion and Sediment Transport)

Abstract

:
The Wang River is one of the major tributaries of the Chao Phraya River (CPR) system in Thailand as the key riverine sediment source supplying the Chao Phraya Delta that has experienced severe shoreline retreat in the past six decades. Historical and observed river flow and sediment data measured during 1929–2019 were used to assess the variation in total sediment load along the Wang River and evaluate the effects of three major dam constructions on sediment supplied from the Wang River to the CPR. Results indicated that sediment loads increased toward downstream. Variation in long-term total sediment load (TSL) along the river suggested that construction of the Kiew Lom Dam in 1972 did not cause a reduction in sediment yield in the Wang River Basin because it impounded less than 20% of the average annual runoff, while the Mae Chang and Kiew Koh Ma Dams caused downstream sediment reduction. These three dams are located in the upper and middle river basins, and their effects on sediment load in the Wang River are ameliorated by additional sediment supplied from the lower basin. Results confirmed that construction of these three major dams in the Wang River did not greatly impact sediment supply from the Wang River to the CPR system. The dam site and sediment load variation along the river are the primary factors controlling the impact of the dam construction.

1. Introduction

During the past several decades, changes in riverine sediment flux have been reported due to human activities such as deforestation, damming, water diversion, and sand mining [1,2,3,4,5]. Modification of riverine transport patterns directly affects sediment load carried to coastal oceans. Dams are one of the common structures widely used in water management systems worldwide. Dam construction disturbs river flow regimes, resulting in a change in sediment transport processes [6,7,8,9,10,11,12,13,14,15,16,17,18,19,20,21,22,23,24,25,26,27,28,29,30,31,32]. Different degrees in sediment reduction due to damming were observed in many major rivers around the world. For example, construction of the Three Gorges Dam in the Yangtze River [11,12,13,14,15,16,17,18], the High Aswan Dam in the Nile River [19,20,21], the Hoa Binh Dam in the Red River [22,23,24,25], and many dams in the Mekong River such as the Manwan Dam [26,27,28,29,30,31,32] has caused sediment reduction of 60%, 98%, 61–70%, and 40–96%, respectively. Dams impound sediment behind the structure and alter river flow and sediment loads downstream; differences in geological setting and hydrological conditions, including dam location, may cause different impacts on sediment load in a river. Regarding the adverse effects of damming on sediment supply to coastal environments, it has been questioned whether a dam is still a proper tool for serving sustainable water management. Therefore, understanding changes in sediment transport regimes responding to damming is crucial to develop sustainable water and coastal management [33,34,35,36,37,38,39,40,41,42,43].
The Chao Phraya River Basin (Figure 1), the largest in Thailand, has delivered fluvial sediments into the Gulf of Thailand forming the Chao Phraya Delta at a progradation rate of 1.5 km2/y during the past 2000 years [33]. However, the Chao Phraya Delta has undergone severe shoreline retreat, with an average recession rate of over 7 m/y during the last six decades [41]. Many studies have suggested that construction of major dams in the CPR tributaries (the Bhumibol and Sirikit Dams in the Ping and Nan Rivers, respectively) has caused a 75–85% reduction in sediment yield to the Chao Phraya Delta and is responsible for delta shoreline recession [44,45,46,47]. Recently, Namsai et al. [5] reported that construction of the Bhumibol Dam caused only about a 5% reduction in sediment supplied from the Ping tributary to the CPR. The Wang River is one of four major CPR tributaries that supplies water and sediment to the Chao Phraya Delta. Construction of three large dams as the Kiew Lom Dam in 1972, Mae Chang Dam in 1979, and Kiew Koh Ma Dam in 2008 on the Wang River deviated sediment loads to the CPR by some degree.
Rivers are complicated nonlinear dynamic systems [48] and changes in geological and hydrological features along each river basin influence sediment characteristics. River sediment data are vital for water resources management and environmental impact evaluation. In Thailand, sediment data collected in most rivers are insufficient for water resources planning and assessment of the anthropologic impact, especially the effects of dam construction on fluvial sediment loads. Moreover, sediment characteristics along the Wang River have not been studied and documented. Therefore, the objectives of this study were to (1) examine sediment characteristics of the Wang River based on river observations, (2) evaluate the temporal variation of sediment loads along the Wang River, and (3) systematically assess the impacts of three major dams (Kiew Lom, Mae Chang, and Kiew Koh Ma) on sediment supply from the Wang River to the CPR system.

2. Materials and Methods
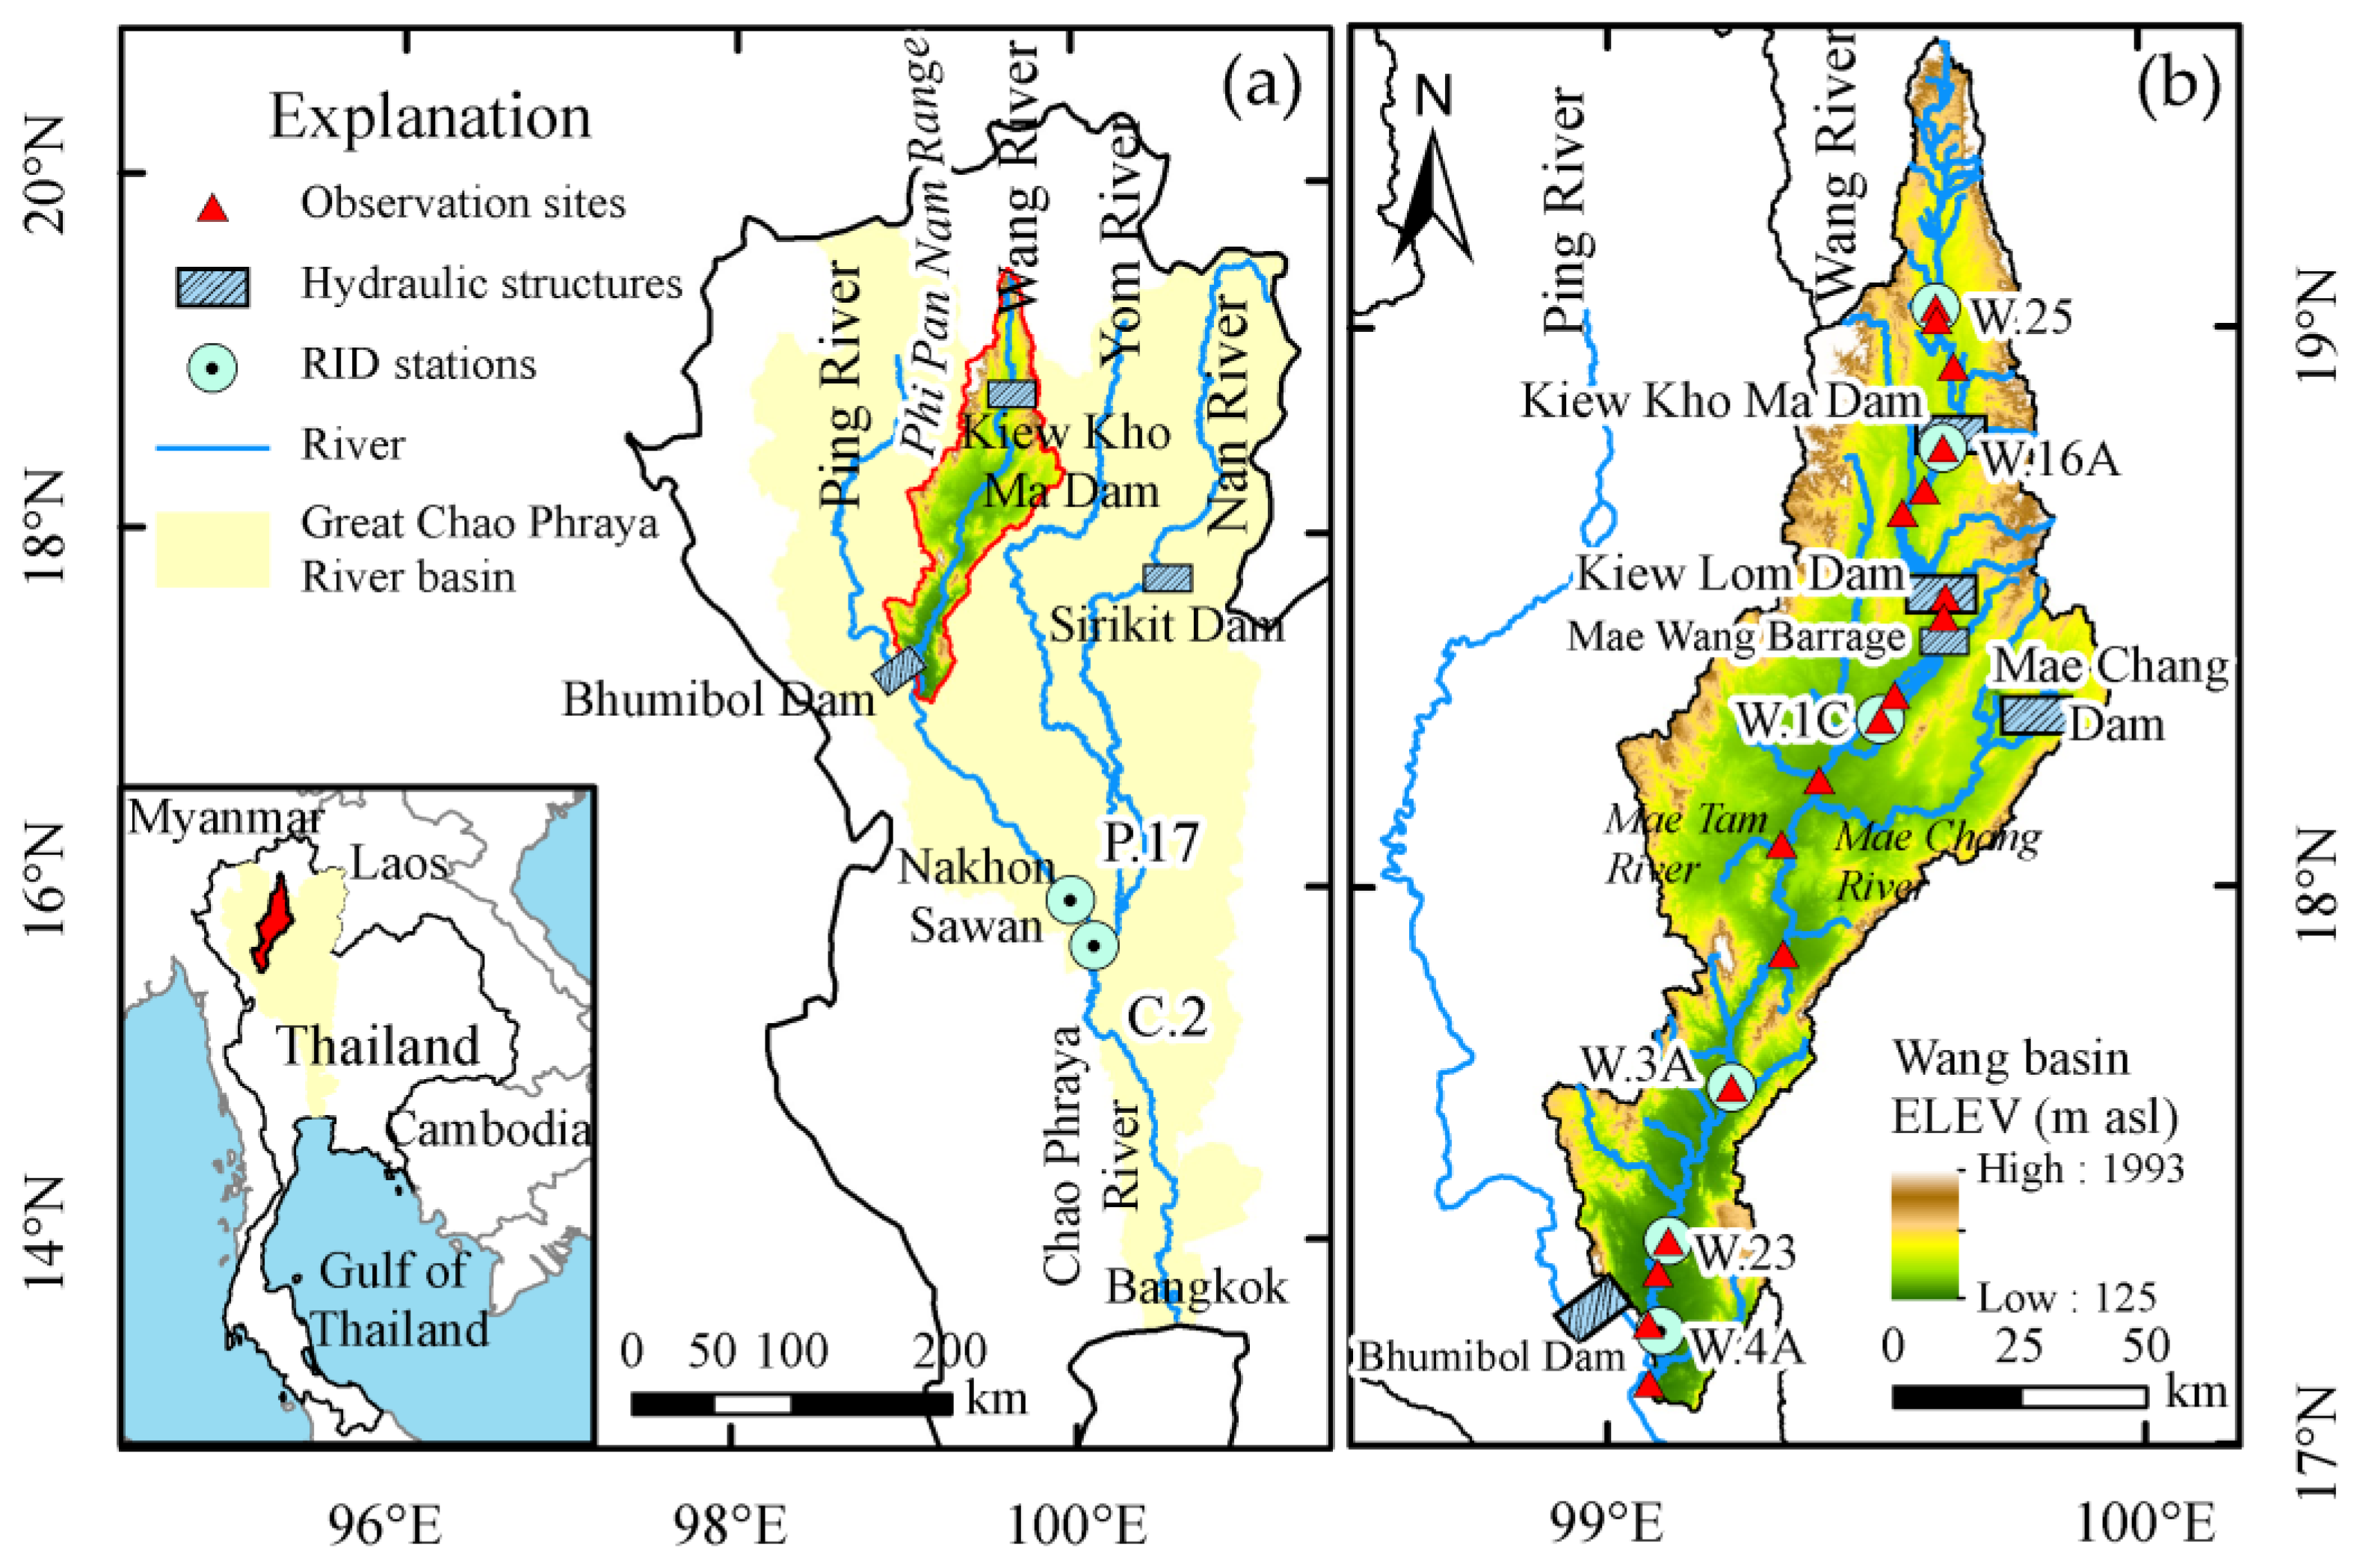
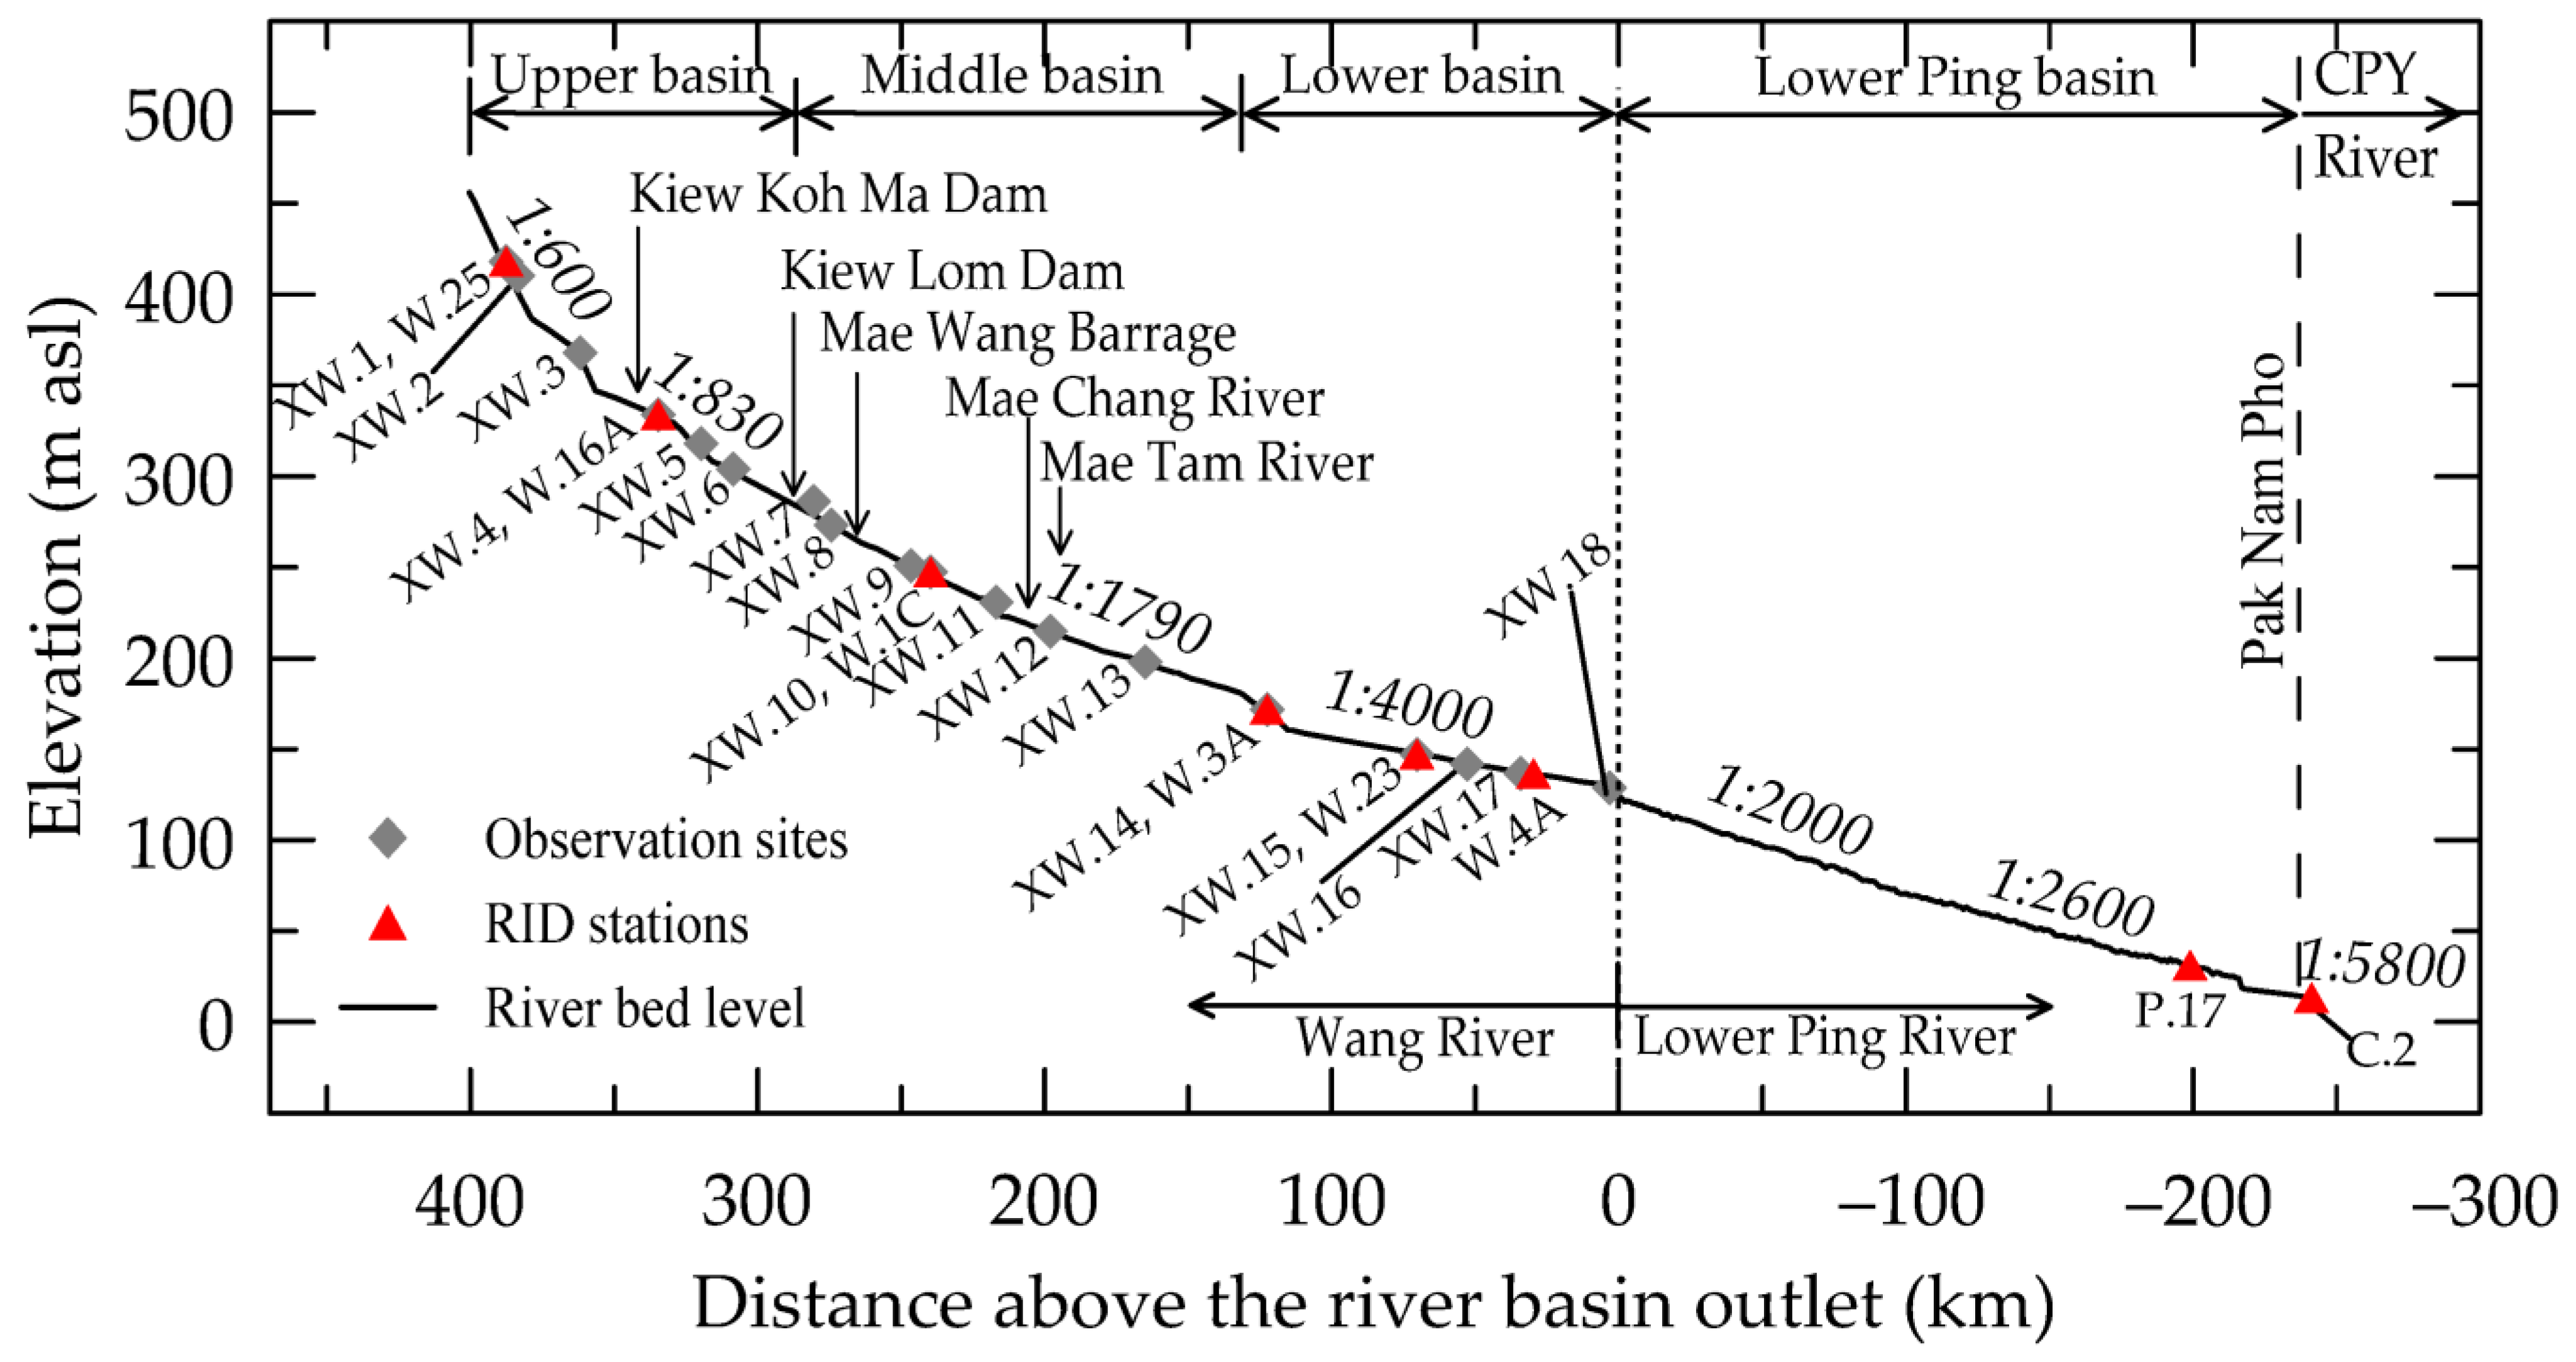
2.1. Study Area

The Wang River Basin is one of the four river basins forming the Chao Phraya River system (Figure 1) with a drainage area of approximately 10,800 km2. The Wang River originates in the northmost mountain range of Thailand, Phi Pan Nam Range, and drains southward before traversing lowland areas in the middle north, merging with the Ping River 30 km downstream of Bhumibol Dam [49]. The Ping River then merges with the Nan River forming the Chao Phraya River at Nakhon Sawan [34,50,51]. The gradient of the river varies from 1:600 to 1:4000, as shown in Figure 2, with a mainstream length of approximately 460 km [51].
The Wang River can be divided into upper, middle, and lower basins. The upper basin is dominated by mountainous features [49]. The mainstream channel of this portion is 20–60 m wide and 1.5–3 m deep, while the river slope ranges between 1:600 and 1:830. The middle basin is characterized by highland areas with a river gradient of 1:1790. The river width varies between 60 and 150 m with the depth between 5 and 10 m. The lower basin comprises a lowland area with a slope of about 1:4000. Similar to the middle basin, the width and depth of the river range between 60 and 150 m and 5 and 10 m, respectively.
The Wang River Basin is located in a tropical monsoon region. The northeast monsoon influences the climate from November to mid-March causing the dry season, while the wet season is dominated by the southwest monsoon from mid-May to September [49]. Average annual rainfall is 1100 mm, and almost 90% occurs during the wet season [49]. Average annual runoff is 1800 million cubic meters per year (MCM/y), as 16% of the Ping River annual runoff [49,50,51]. More than 94 small dams and reservoirs have been constructed in the Wang River Basin for irrigation, hydropower generation, flood mitigation, and fisheries [49]. The three large dams with storage of more than 100 × 106 m3 as the Kiew Lom (1972), Mae Chang (1979), and Kiew Koh Ma (2008) were constructed in the upper and middle basins (Figure 1b).

2.2. Variability and Trend Analysis on River Discharges and Sediment Loads

To study the variability of river flow and sediment load along the Wang River, historical daily river discharge (Qw) and daily suspended sediment (Qs) data between 1929 and 2019 were obtained from the Royal Irrigation Department (RID). Daily streamflow and sediment data were collected at eight hydrological stations (W.25, W.16A, W.1C, W.3A, W.23, W.4A, P.17, and C.2 in Figure 1b). Stations W.25 and W.16A are in the upper Wang River Basin, while Station W.1C is in the middle basin. Stations W.3A, W.23, and W.4A are in the lower basin. In this study, data recorded at Stations P.17 (200 km downstream from the Wang–Ping confluence) and C.2 (5 km downstream from the confluence of the Chao Phraya River) were used to assess the effects of the three major dams on sediment supplied from the Wang to the CPR. Details of river discharge and suspended sediment data at each station are summarized in Table 1. Since bedload data are not available, the total sediment load in the Wang River system was analyzed using the sediment rating curves and bed to suspended sediment ratios from the river survey data described in Namsai et al. [5].
Long-term trends of streamflow and sediment data along the Wang River were studied using a non-parametric statistical method, the Mann–Kendall (MK) test [52,53], that has been broadly used to identify significance of trends in hydro-meteorological time series with skewness and missing data [4,5,40,54,55,56,57,58]. For a given the time series of X(x1, x2, …, xn), the MK statistic, S, is defined as Equation (1).
S = i = 1 n 1 j = i + 1 n s g n ( X j X i )
where the Xj are the sequential data values, n is the length of the dataset, and sgn(θ) can be obtained from Equation (2).
s g n ( θ ) = {   1 , i f   θ > 0   0 , i f   θ = 0 1 , i f   θ < 0
The statistic S is approximately normally distributed when n ≥ 8, with the mean and the variance as follows:
E [ S ] = 0
V ( S ) = n ( n 1 ) ( 2 n + 5 ) i = 1 n t i i ( i 1 ) ( 2 i + 5 ) 18
where ti is the number of ties of extent i.
The standardized test statistic (Z) of the MK test and the corresponding p-value (p) for the one-tailed test are, respectively, given by:
Z = { S 1 V ( S ) , i f   S > 0   0 , i f   S = 0 S + 1 V ( S ) , i f   S < 0
p = 0.5 Φ ( | Z | )
( Φ | Z | ) = 1 2 π 0 | Z | e t 2 2 d t
Positive and negative Z values indicate an upward and downward trend, respectively. At the significance level of 0.05, if p ≤ 0.05, the existing trend is considered to be statistically significant [58]. A plot between cumulative the river discharge and cumulative the sediment load (double mass curve, DMC) is extensively used to detect the significant influence of human activities on the hydrological regime [14,16,40,59]. Therefore, DMC plots of river discharge and TSL data covering pre- and post-dam construction were used to evaluate the impacts of the Kiew Lom Dam, Mae Chang Dam, and Kiew Koh Ma Dam on sediment loads in the Wang and Chao Phraya Rivers.

2.3. River Discharge and Sediment Observation

Bedload (BL) data are mostly unavailable in Thailand, and suspended sediment load (SSL) data recorded at hydrological stations were insufficient to analyze dynamic sediment processes and evaluate the impact of damming in the Wang River Basin. Therefore, hydrographic surveys were carried out twice in 2019 (during wet and dry seasons) at 18 sites along the Wang River (XW.1–XW.18 in Figure 2). The XW.1–XW.4 and XW.5–XW.13 were located in the upper and middle reaches. The remaining five sites (XW.14–XW.18) were operated along the lower reach of the Wang River. Observation parameters consisted of streamflow (Q), river flow area (A), suspended sediment concentration (C), bedload transport rates (Qb), and bed material. An acoustic Doppler current profiling system (ADCP), Sontek River Surveyor M9 (M9), was used to measure streamflow and river flow area with an accuracy of ±0.25 cm/s for river velocity measurement and 1% for water depth measurement. Resolution of the flow velocity and water depth measurement was 0.001 m/s and 0.001 m, respectively.
To evaluate suspended sediment discharge along the river, a depth-integrating suspended-sediment sampler, US D-49, was used to assemble water samples at each observation site. In contrast, a US DH-48 was used to obtain samples only when the river section was shallow enough for the investigator to wade across. For suspended sediment sampling, the river was split into 5–11 sections with equal-width increments. Depth-integrated samples in vertical were collected at the center of each increment by lowering the device to reach the river bed then immediately raising to the surface to collect water sample at about 90% of the sampler volume [60]. Water samples were sent to the soil laboratory to analyze sediment concentration described in Namsai et al. [5]. The SSL (Qs) at each river section was estimated from the product between the suspended sediment concentration and the corresponding discharge (Qw).
To measure bedload (Qb) along the Wang River, a standard Helley–Smith (U.S. BL-84) sampler, which is pressure different sampler [61], was used. The sediment samples were taken at the locations corresponding to the suspended sediment sampling with a sampling period of between 1 and 3 min. The samples were sent to a soil laboratory to dried at 105 °C and weighed in a soil laboratory. To determine sediment grain size distribution, each dried sample was sieved and weighed using a standard test method of soil particle-size analysis (ASTM D422). Bedload transport rate (Qb) was then estimated, as described in Namsai et al. [5,62,63,64]. In this study, bed materials were collected at the left, middle, and right locations of a river cross-section. At each sampling location, about 1–2 kg of surface bed material with a sampling depth of about 20 cm was taken using a Van Veen grab. Each sample was kept in a plastic bag and sealed. All samples were then delivered to a soil laboratory for analyzing grain size distribution using the same procedures as the bedload sample analysis.

3. Results

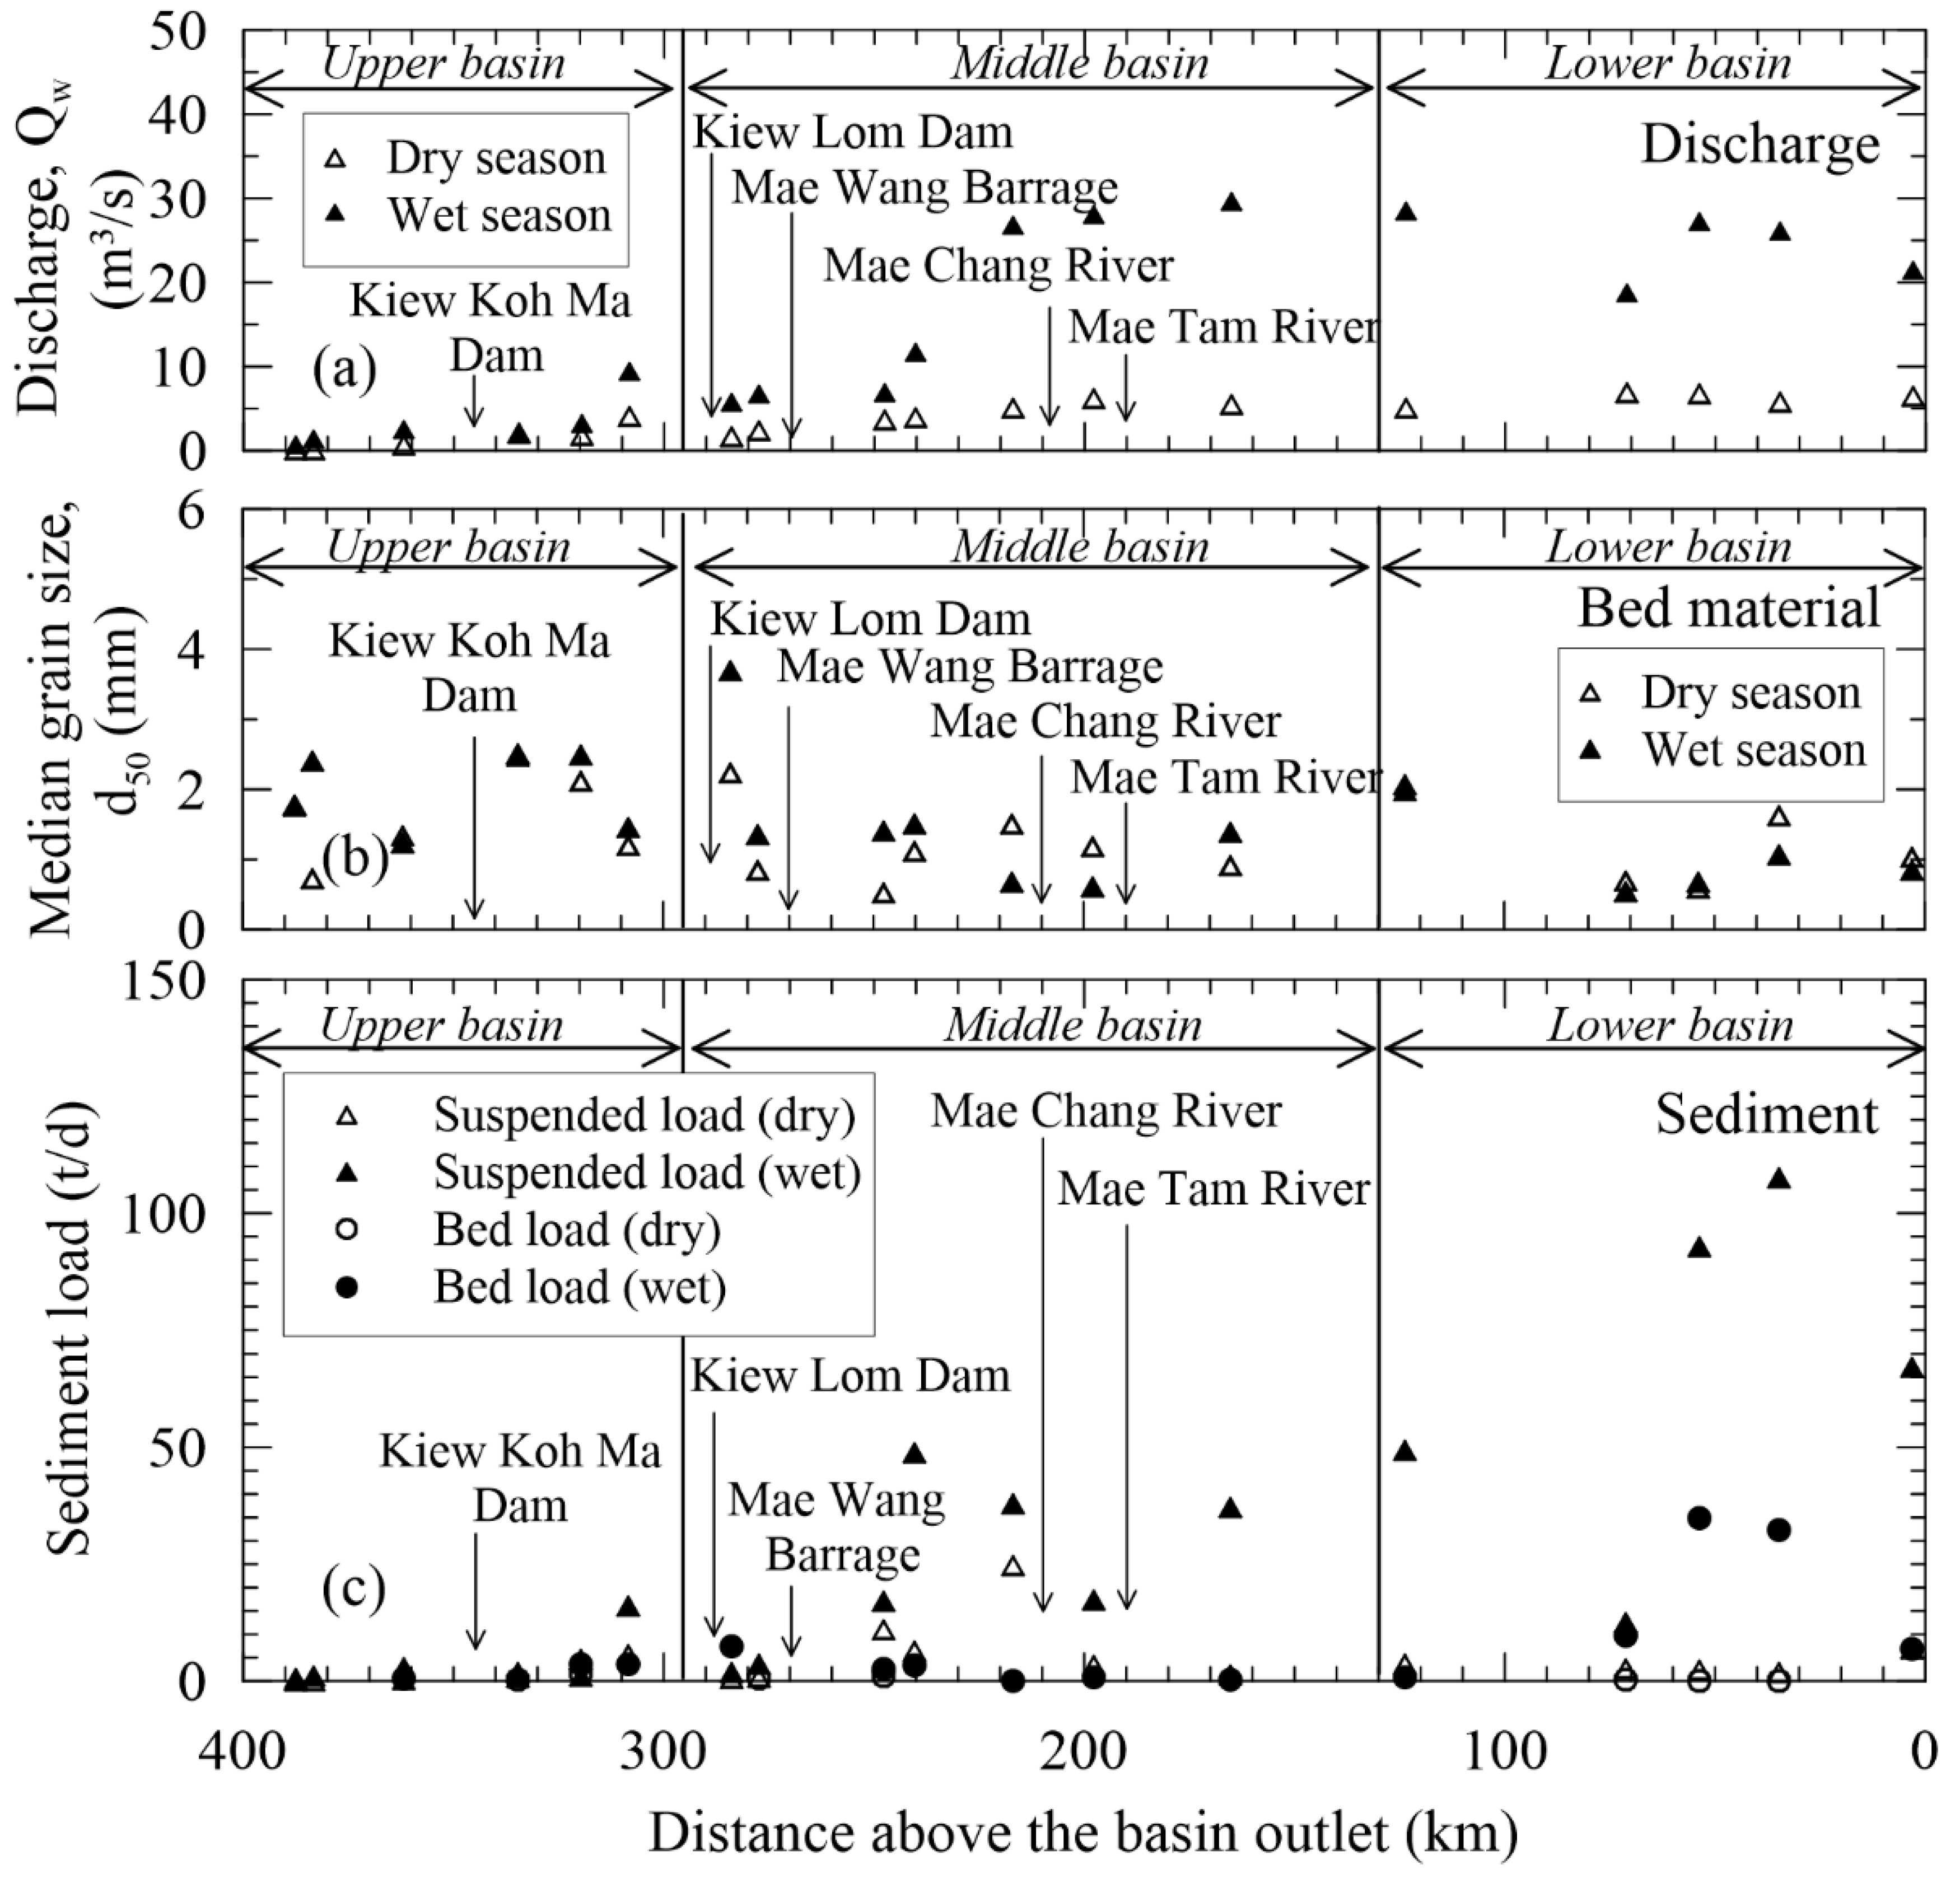
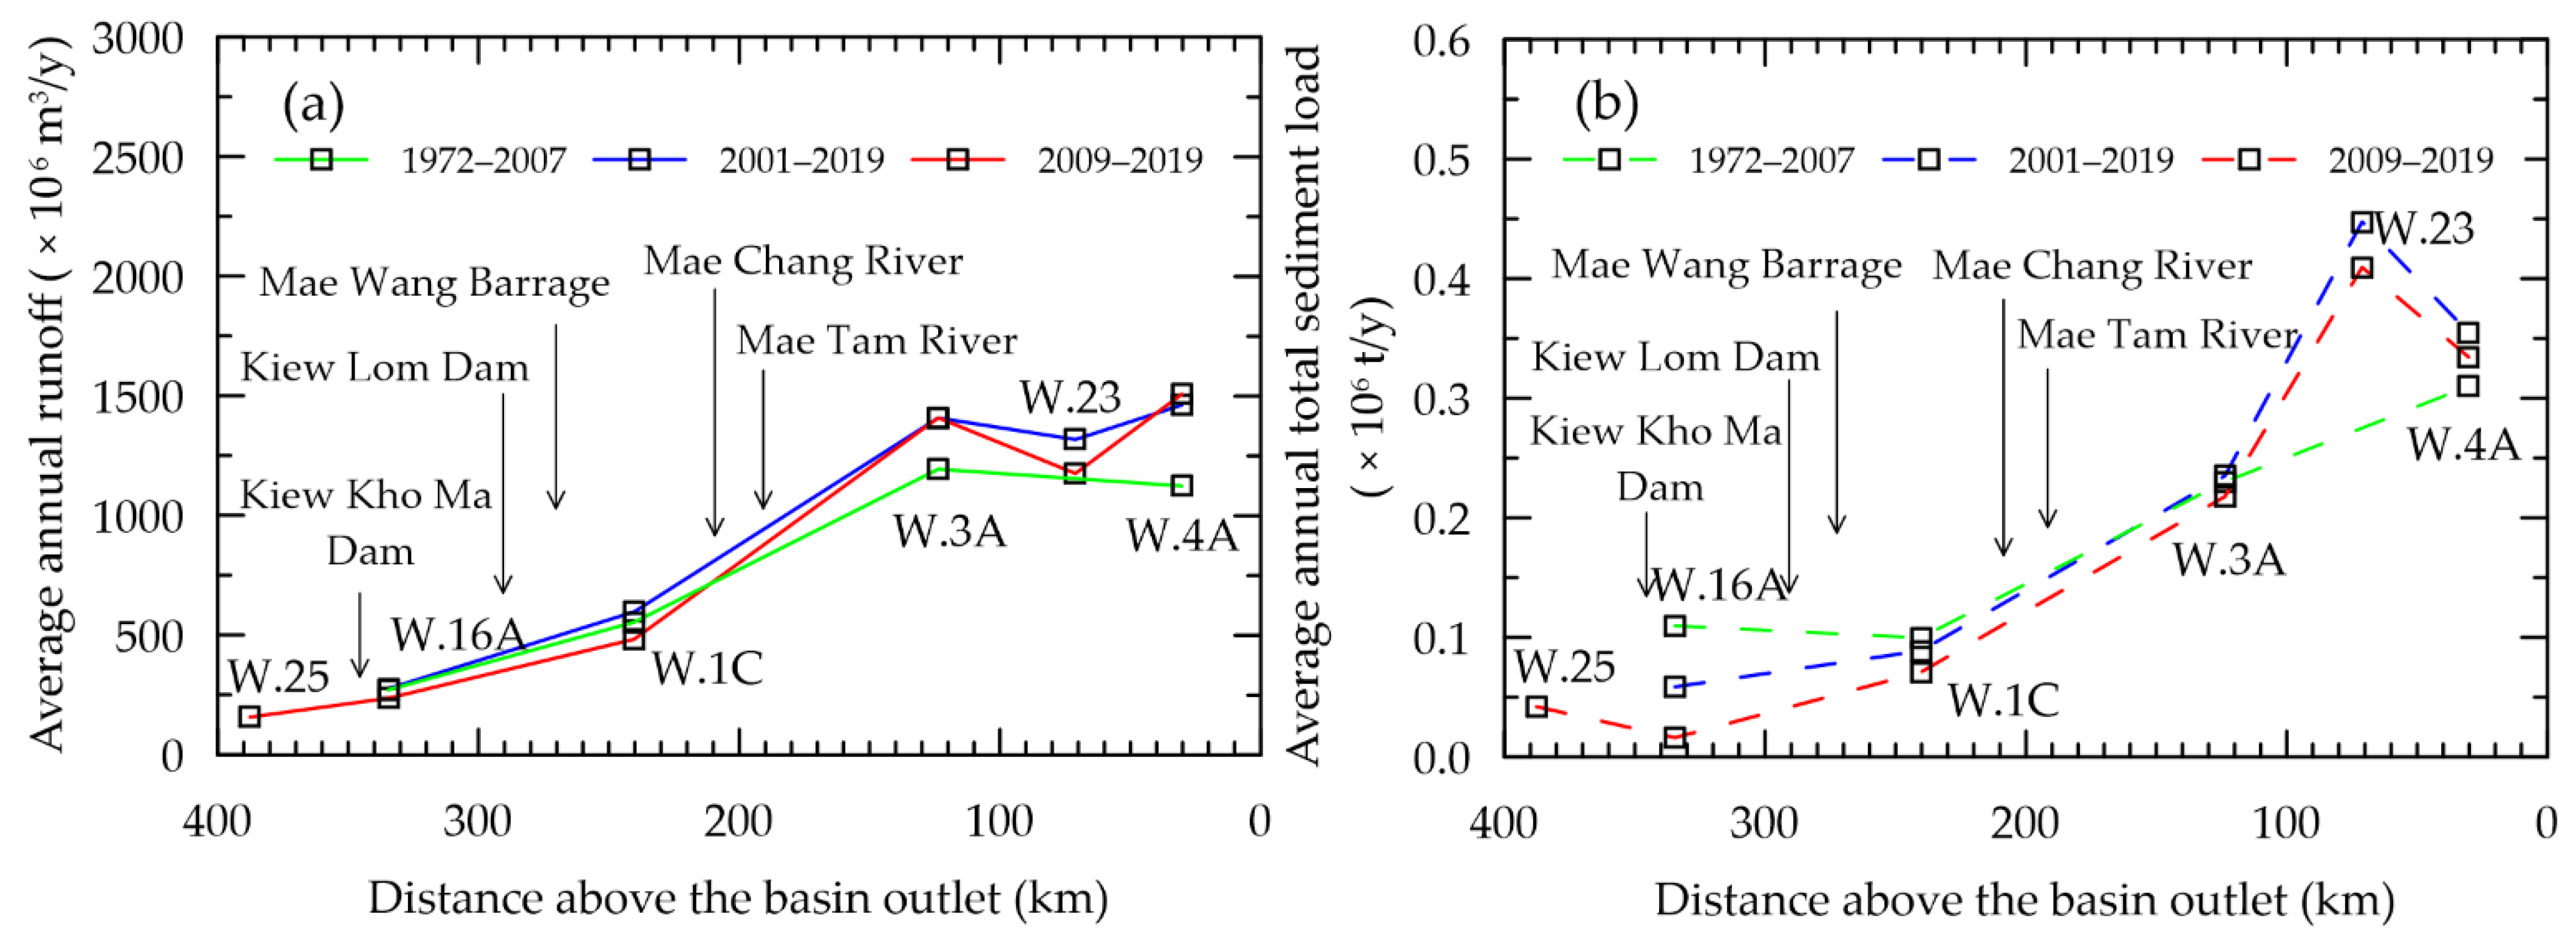
3.1. River Flow and Sediment Characteristics along the Wang River

Table 2 shows river flow and sediment data measured during both dry and wet seasons at 18 locations (XW.1–XW.18 in Figure 2) along the Wang River, while Figure 3 illustrates variations of streamflow, bedload, and suspended sediment load, including bed material at each observation site. Based on the observed data, river flow and sediment characteristics of the Wang River can be summarized for the upper reach (XW.1–XW.6), the middle reach (XW.7–XW.13), and the lower reach (XW.14–XW.18) as follows.
In the dry season of 2019, streamflow in the upper Wang River Basin was 0.1–0.7 m3/s and 1.8–4.1 m3/s upstream and downstream of the Kiew Koh Ma Dam, respectively. In the middle basin, river flow ranged from 1.7 m3/s at the upper part to 6.2 m3/s in the lower part of the basin, while river flow in the lower basin increased to 5–7 m3/s (Figure 3a). In the upper reach, the river channel upstream from the Kiew Koh Ma Dam was characterized by coarse to very coarse sand with d50 of 0.73–1.78 mm, while the bed material downstream from the dam was composed of very coarse sand to pebbles. The middle and lower reaches were mainly composed of coarse sand to very coarse sand with d50 ranging between 0.5 and 2 mm (Figure 3b). In the upper basin, SSL values observed upstream and downstream from the Kiew Koh Ma Dam were 0.1–0.4 t/d and 1.7–5.7 t/d, respectively (Table 2). The middle basin yielded SSL of 0.63–0.88 t/d upstream from the Kiew Lom Dam and 6–25 t/d downstream of the dam. At the mid-point of the middle basin, the SSL increased to 25 t/d before reducing to lower than 3.5 t/d at the sub-basin outlet (Figure 3c). The SSL along the lower reach was lower than 3.5 t/d except near the outlet of the basin, when SSL increased to 7 t/d. Bedload transport in the Wang River was very low (less than 0.3 t/d) during the dry season. In the upper and middle reaches, bed loads of 0.4–1.6 t/d and 0.5–1.2 t/d were recorded downstream of the Kiew Koh Ma and Kiew Lom Dams, respectively. Proportions between BL and SSL in the upper, middle, and lower basins were 0–0.35, 0–0.60, and 0–0.1, respectively.
During the wet season of 2019, river flow in the upper basin tended to increase toward downstream with a flow rate of 0.4–9.2 m3/s. In the middle reach, river flow also increased from 5.5 m3/s downstream of the Kiew Lom Dam to about 30 m3/s at the basin outlet (XW.13) (Figure 3a). However, river discharge in the lower basin fluctuated in a narrow range of 18–28 m3/s. Bed material along the river during the wet season was generally similar in type to the dry season. The SSL in the upper basin ranged between 0.5 and 16.14 t/d, while SSL in the middle reach increased from 1.76 t/d downstream from the Kiew Lom Dam to 37 t/d at the end of the middle basin (Figure 3c). The SSL fluctuated between 12 t/d and 108 t/d along the lower basin. Opposite to the dry season, BL was observed along the Wang River in the wet season. In the upper reach, the BL ranged 0–0.64 t/d upstream from the Kiew Koh Ma Dam and 0–3.6 t/d downstream from the dam. Along the middle reach, the BL fluctuated between 0 and 7.3 t/d, and maximum BL was found downstream from the Kiew Lom Dam. The BL in the lower basin varied from 0.9 to 35 t/d but decreased to less than 7 t/d at the outlet of the basin. During the wet season, the BL to SSL ratio in the upper and middle basins varied between 0 and 3.6 and 0 and 4.2, respectively. The ratio reduced to 0–0.78 in the lower basin.

3.2. Historical River Flow and Sediment Loads

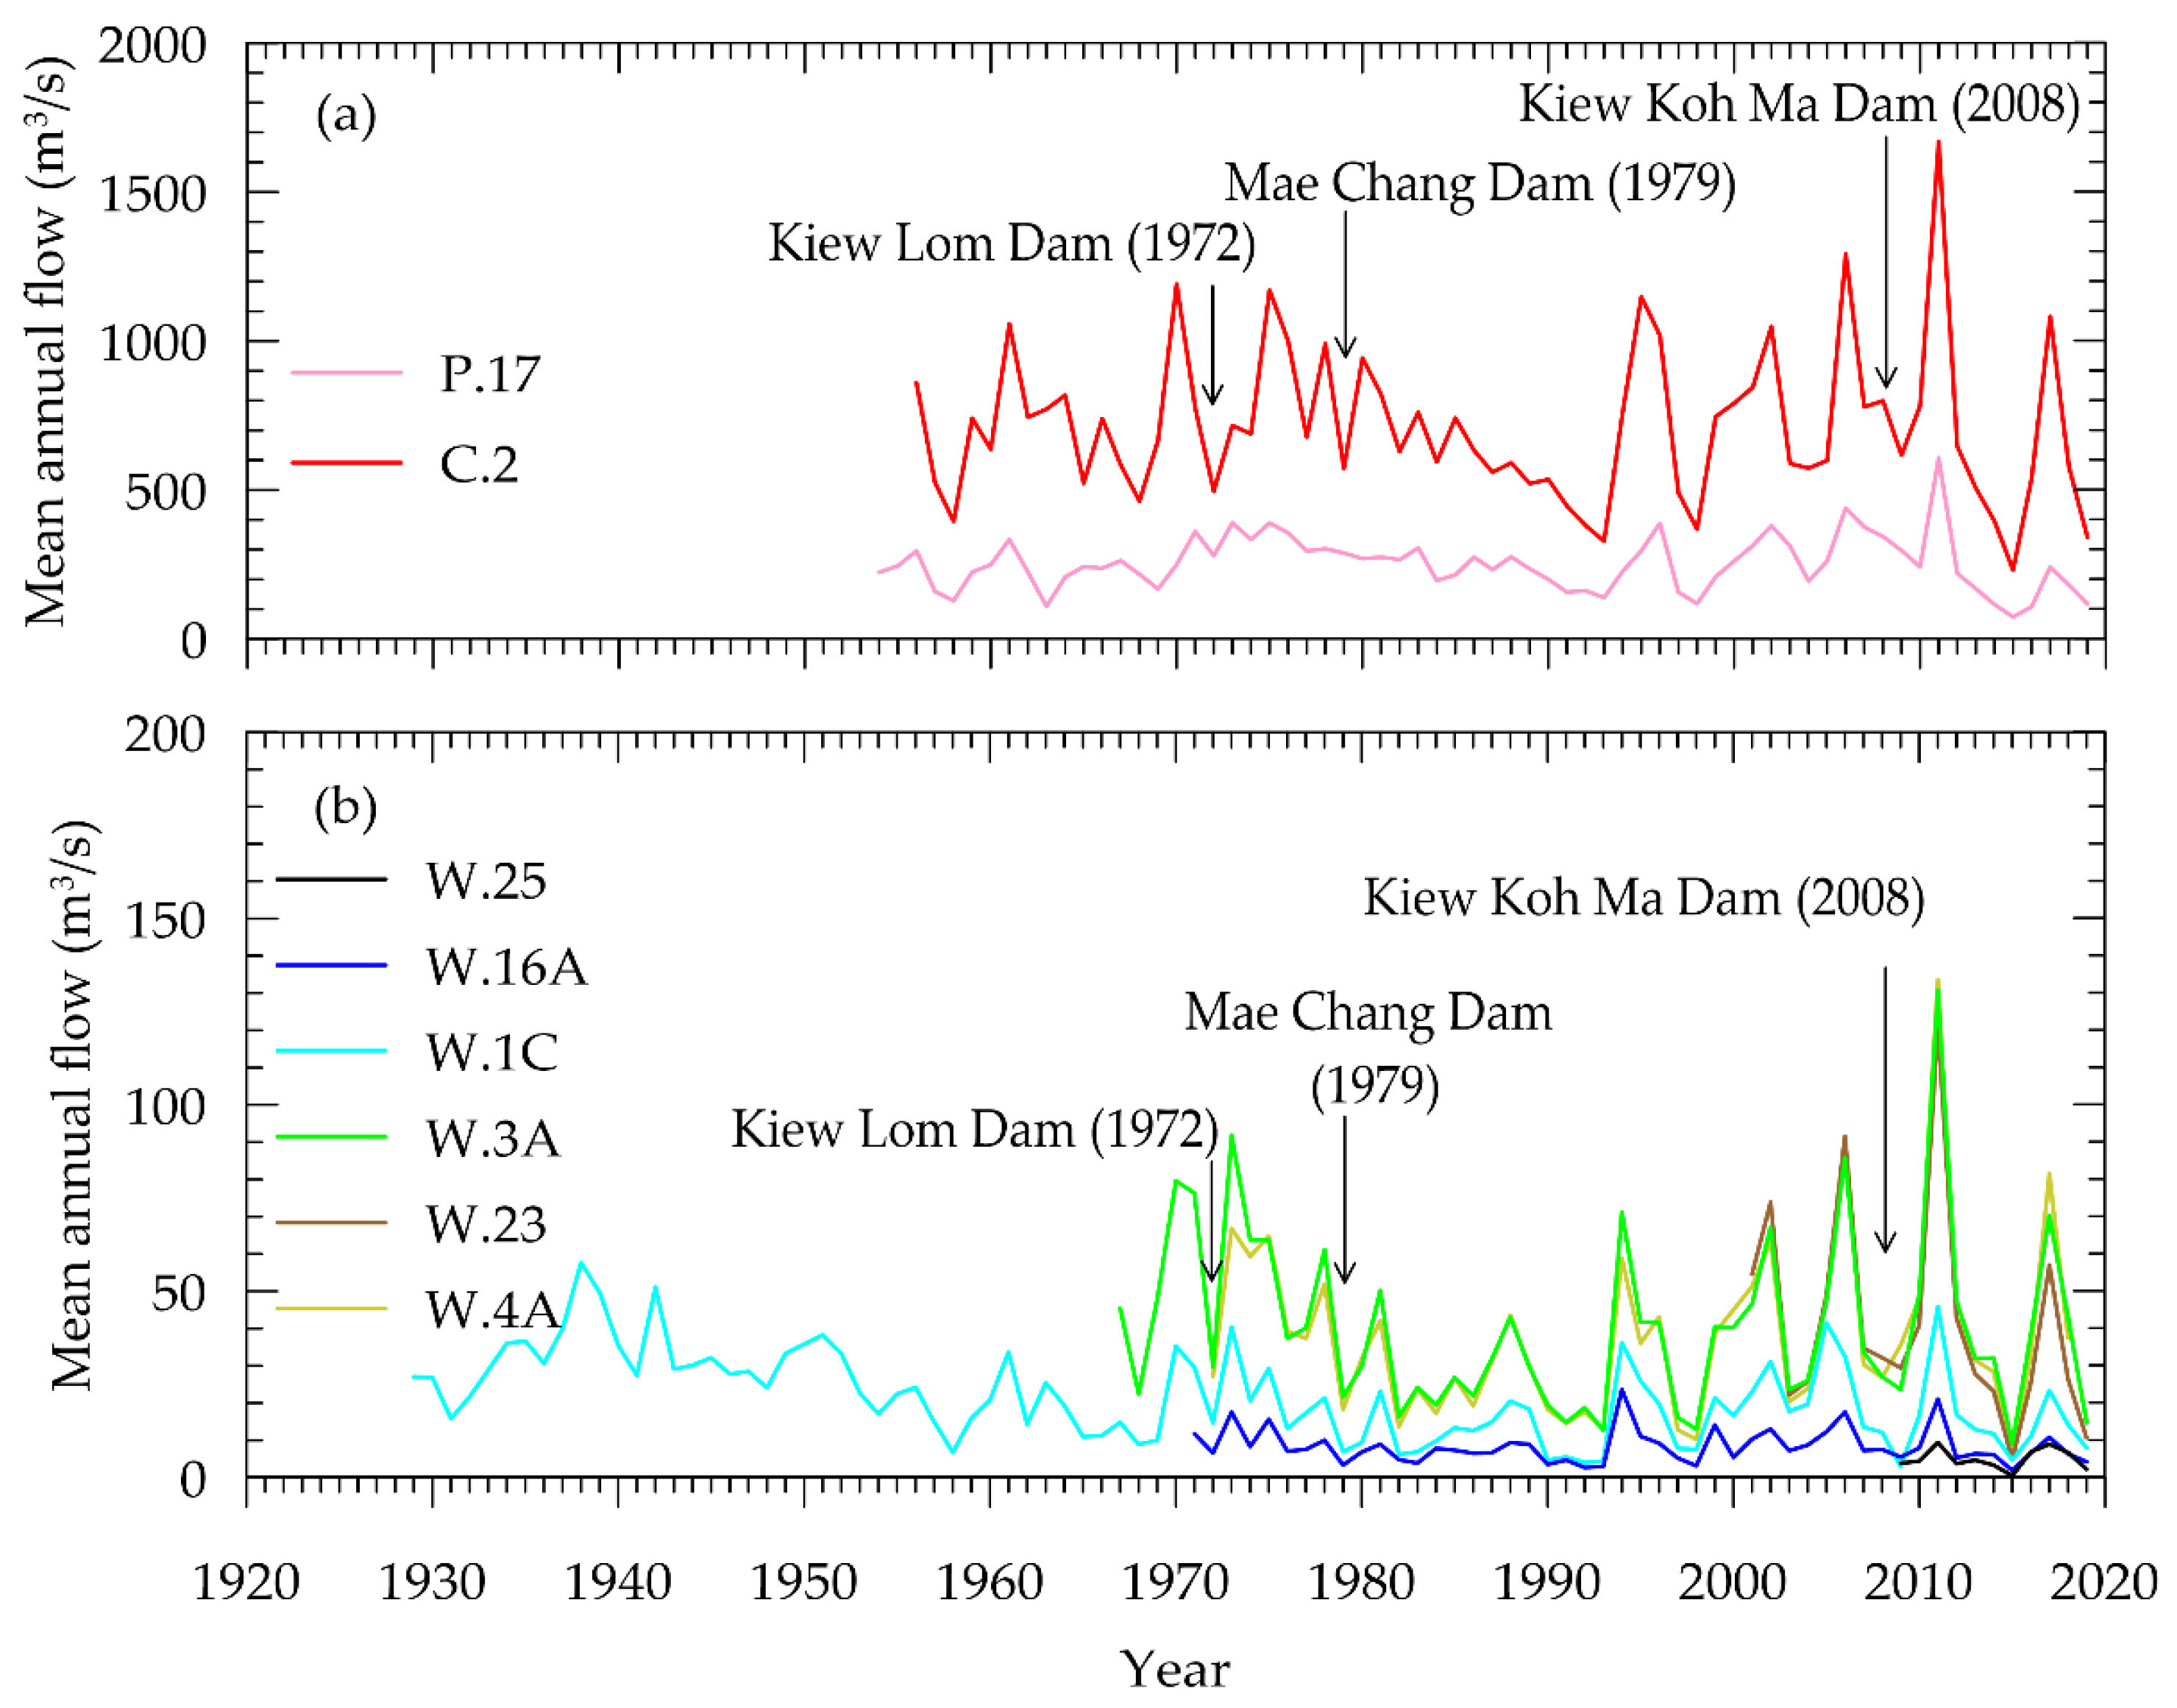
3.2.1. Historical River Flow along the Wang River

Time series of annual river discharge observed at Stations W.25, W.16A, W.1C, W.3A, W.23, and W.4A from 1929 to 2019 are illustrated in Figure 4. Based on daily river discharge data analysis, basic statistical parameters representing river flow characteristics along the Wang River are summarized in Table 1. Average streamflow along the Wang River varied from 5 m3/s (in the upper river basin) to about 43 m3/s (in the lower river basin), and river flow tended to increase toward downstream. Average discharge measured 30 km upstream from the river basin outlet (W.4A) as flow from the Wang River accounted for 15% of the flow in the Ping River at P.17 on average.
River discharge measurement at W.25 and W.16A indicated that river flow in the upper river basin increased toward downstream with average discharge of 5 and 8 m3/s at W.25 and W.16A, respectively. Based on 50 years of data recorded at W.16A, high river discharges occurred several times (Figure 4) because of tropical storms. Maximum daily river discharge of 510 m3/s occurred at the outlet of this sub-river basin in September 2005 due to typhoon “Damrey” that produced widespread severe flooding in Northern Thailand. However, no statistical trend was observed in river discharge in the upper basin in the past five decades (p-value > 0.05).
Streamflow in the middle river basin measured at W.1C varied between 0 and 820 m3/s with average discharge of about 22 m3/s. Similar to the upper river basin, maximum daily discharge of 820 m3/s was caused by typhoon “Damrey.” Almost a century of data recorded at W.1C indicated that river flow in this sub-basin statistically decreased (p-value < 0.0001). In the lower river basin, records of river flow along the lower reach (W.3A, W.23, and W.4A) showed that average discharge in the lower basin was double that of the middle basin. River discharge ranged between 0 and 2800 m3/s. Based on average and maximum discharge, river flow in the lower basin likely decreased toward downstream (Table 1) as the river cross-section was smaller in the downstream direction. Maximum discharge along the lower reach occurred during major tropical storms; however, increasing or decreasing trends were not found in river runoff of the lower basin.
Results in Table 1 showed that average discharge at P.17 located in the Ping River (200 km downstream from the confluence of the Wang and Ping Rivers) varied by 0–2350 m3/s, while discharge at C.2 located 5 km after the Ping River merged with the Nan River forming the CPR ranged between 15 and 5450 m3/s. With average discharges at P.17 of 252 m3/s and at C.2 of 711 m3/s, the Ping River runoff supplied about 35% of the CPR flow with no statistical trend in river flow volume during the past five decades.

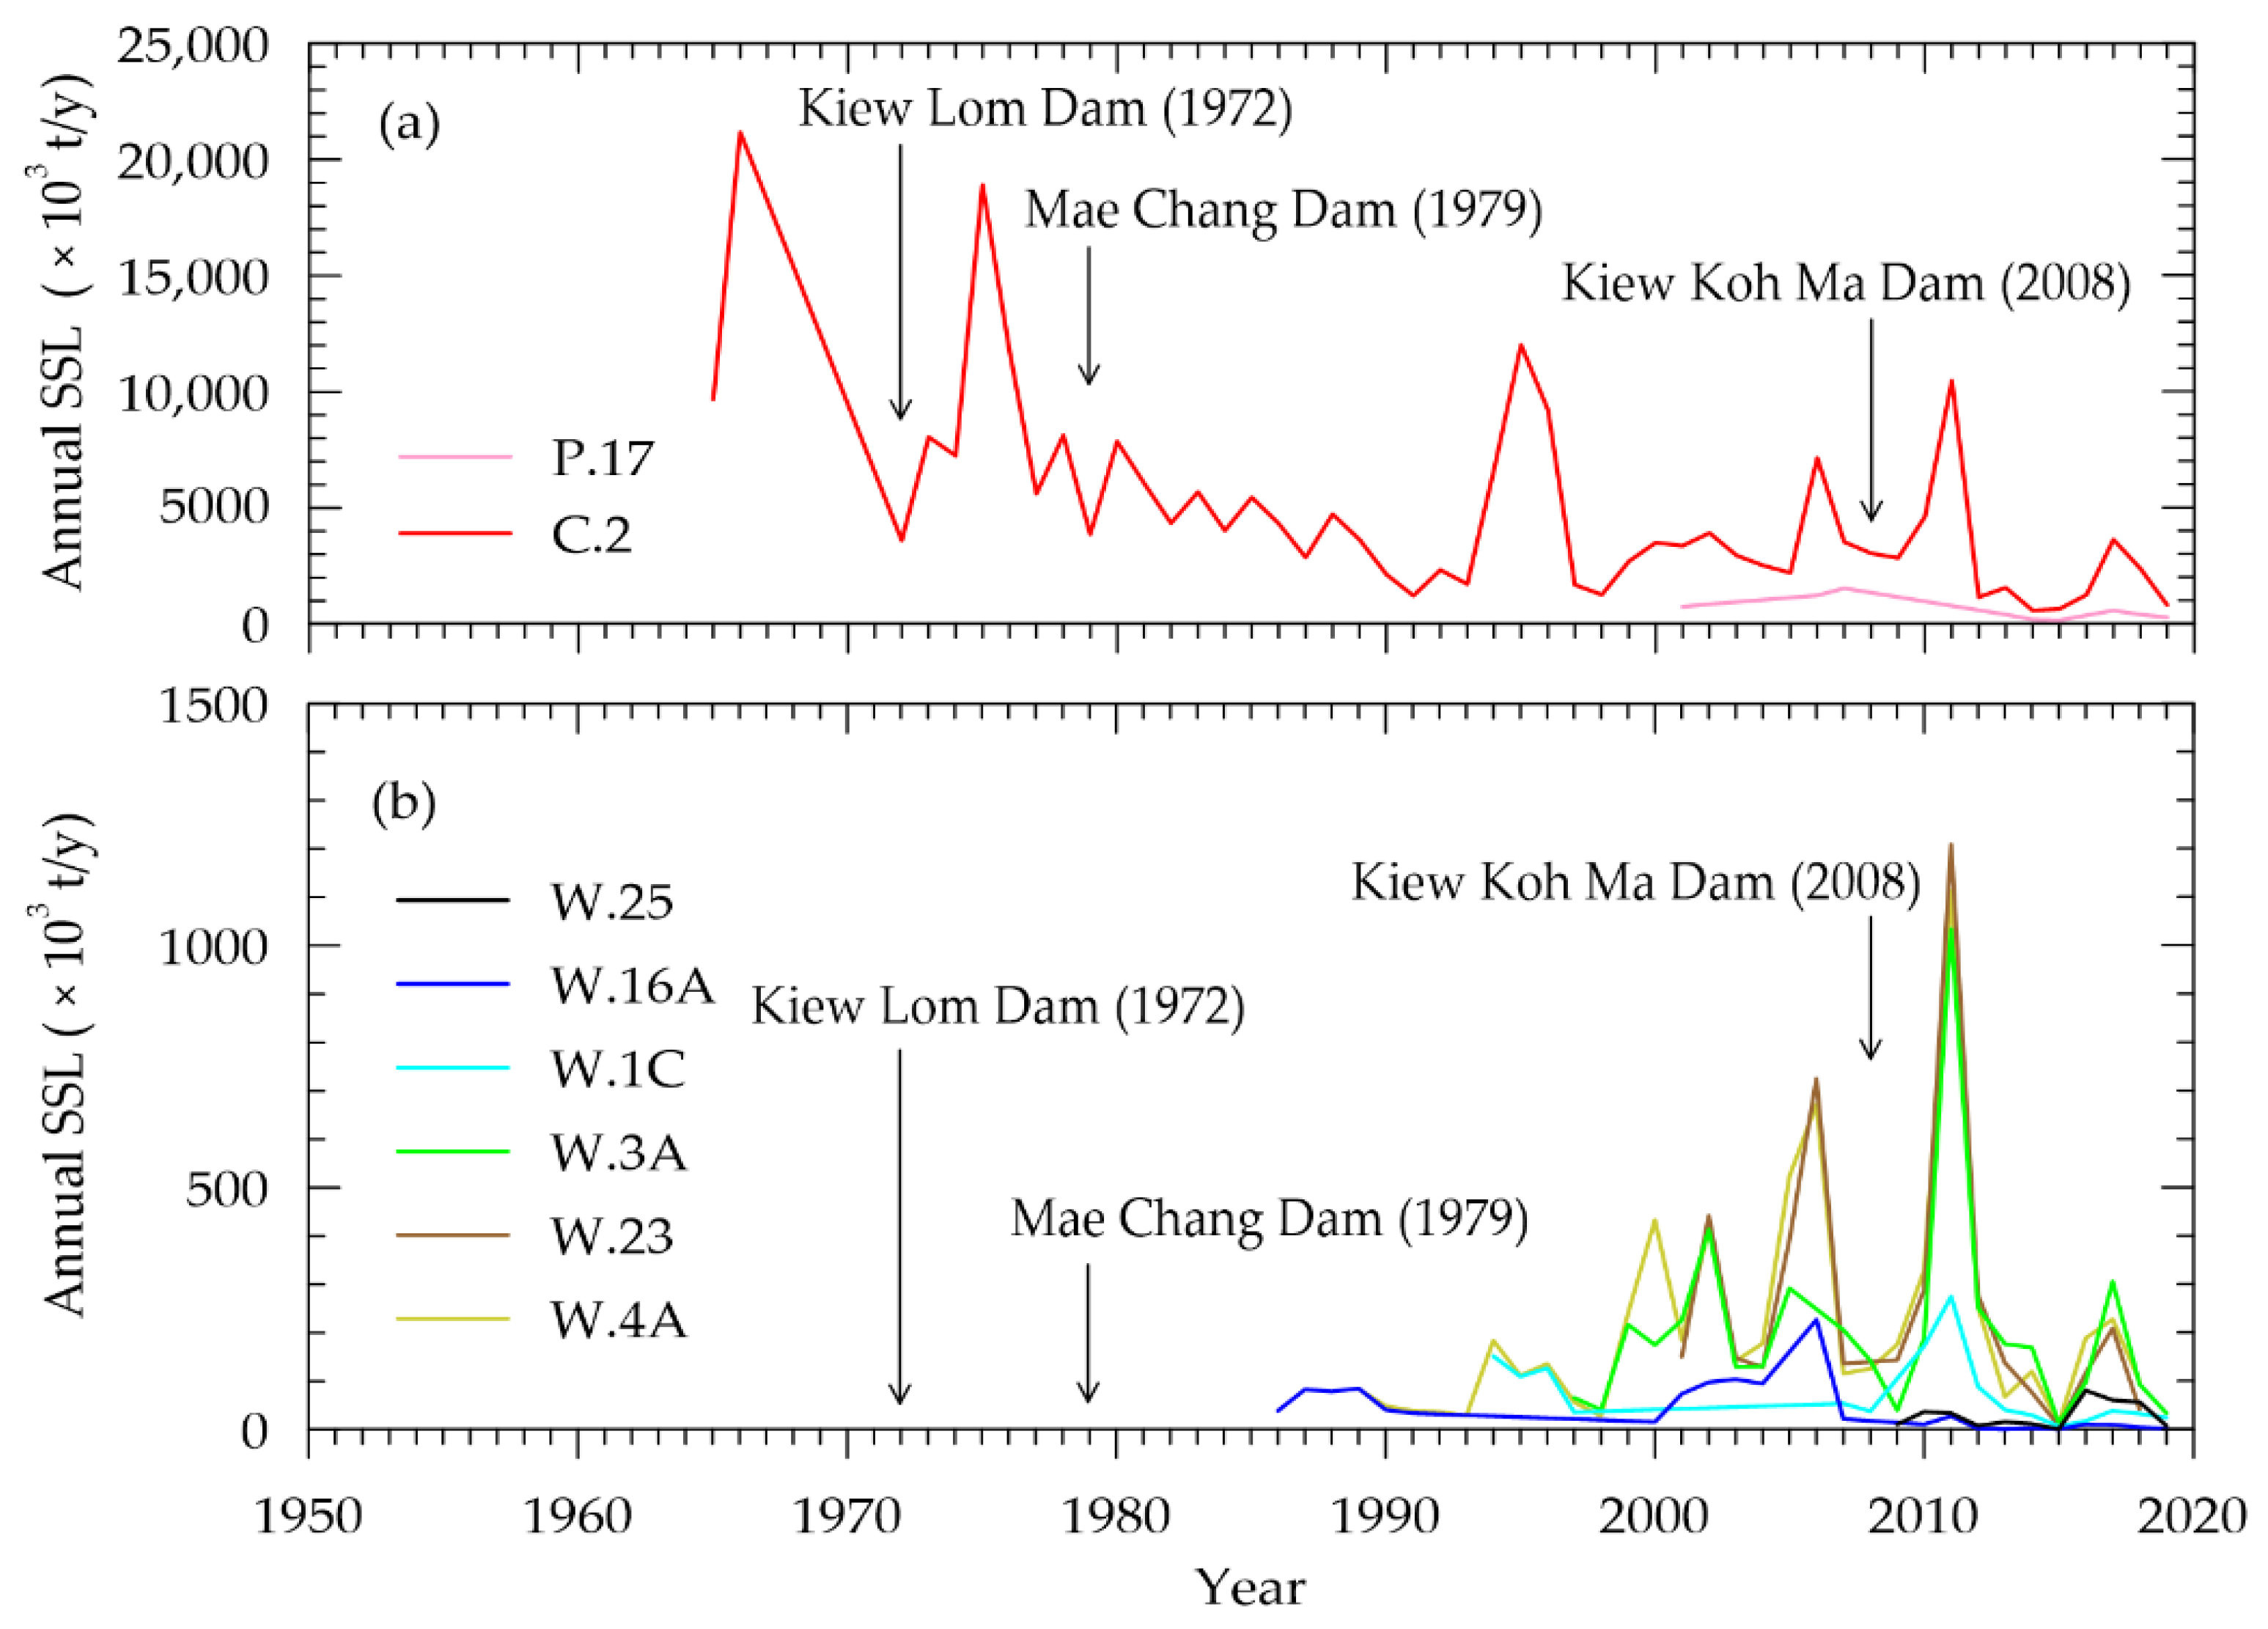
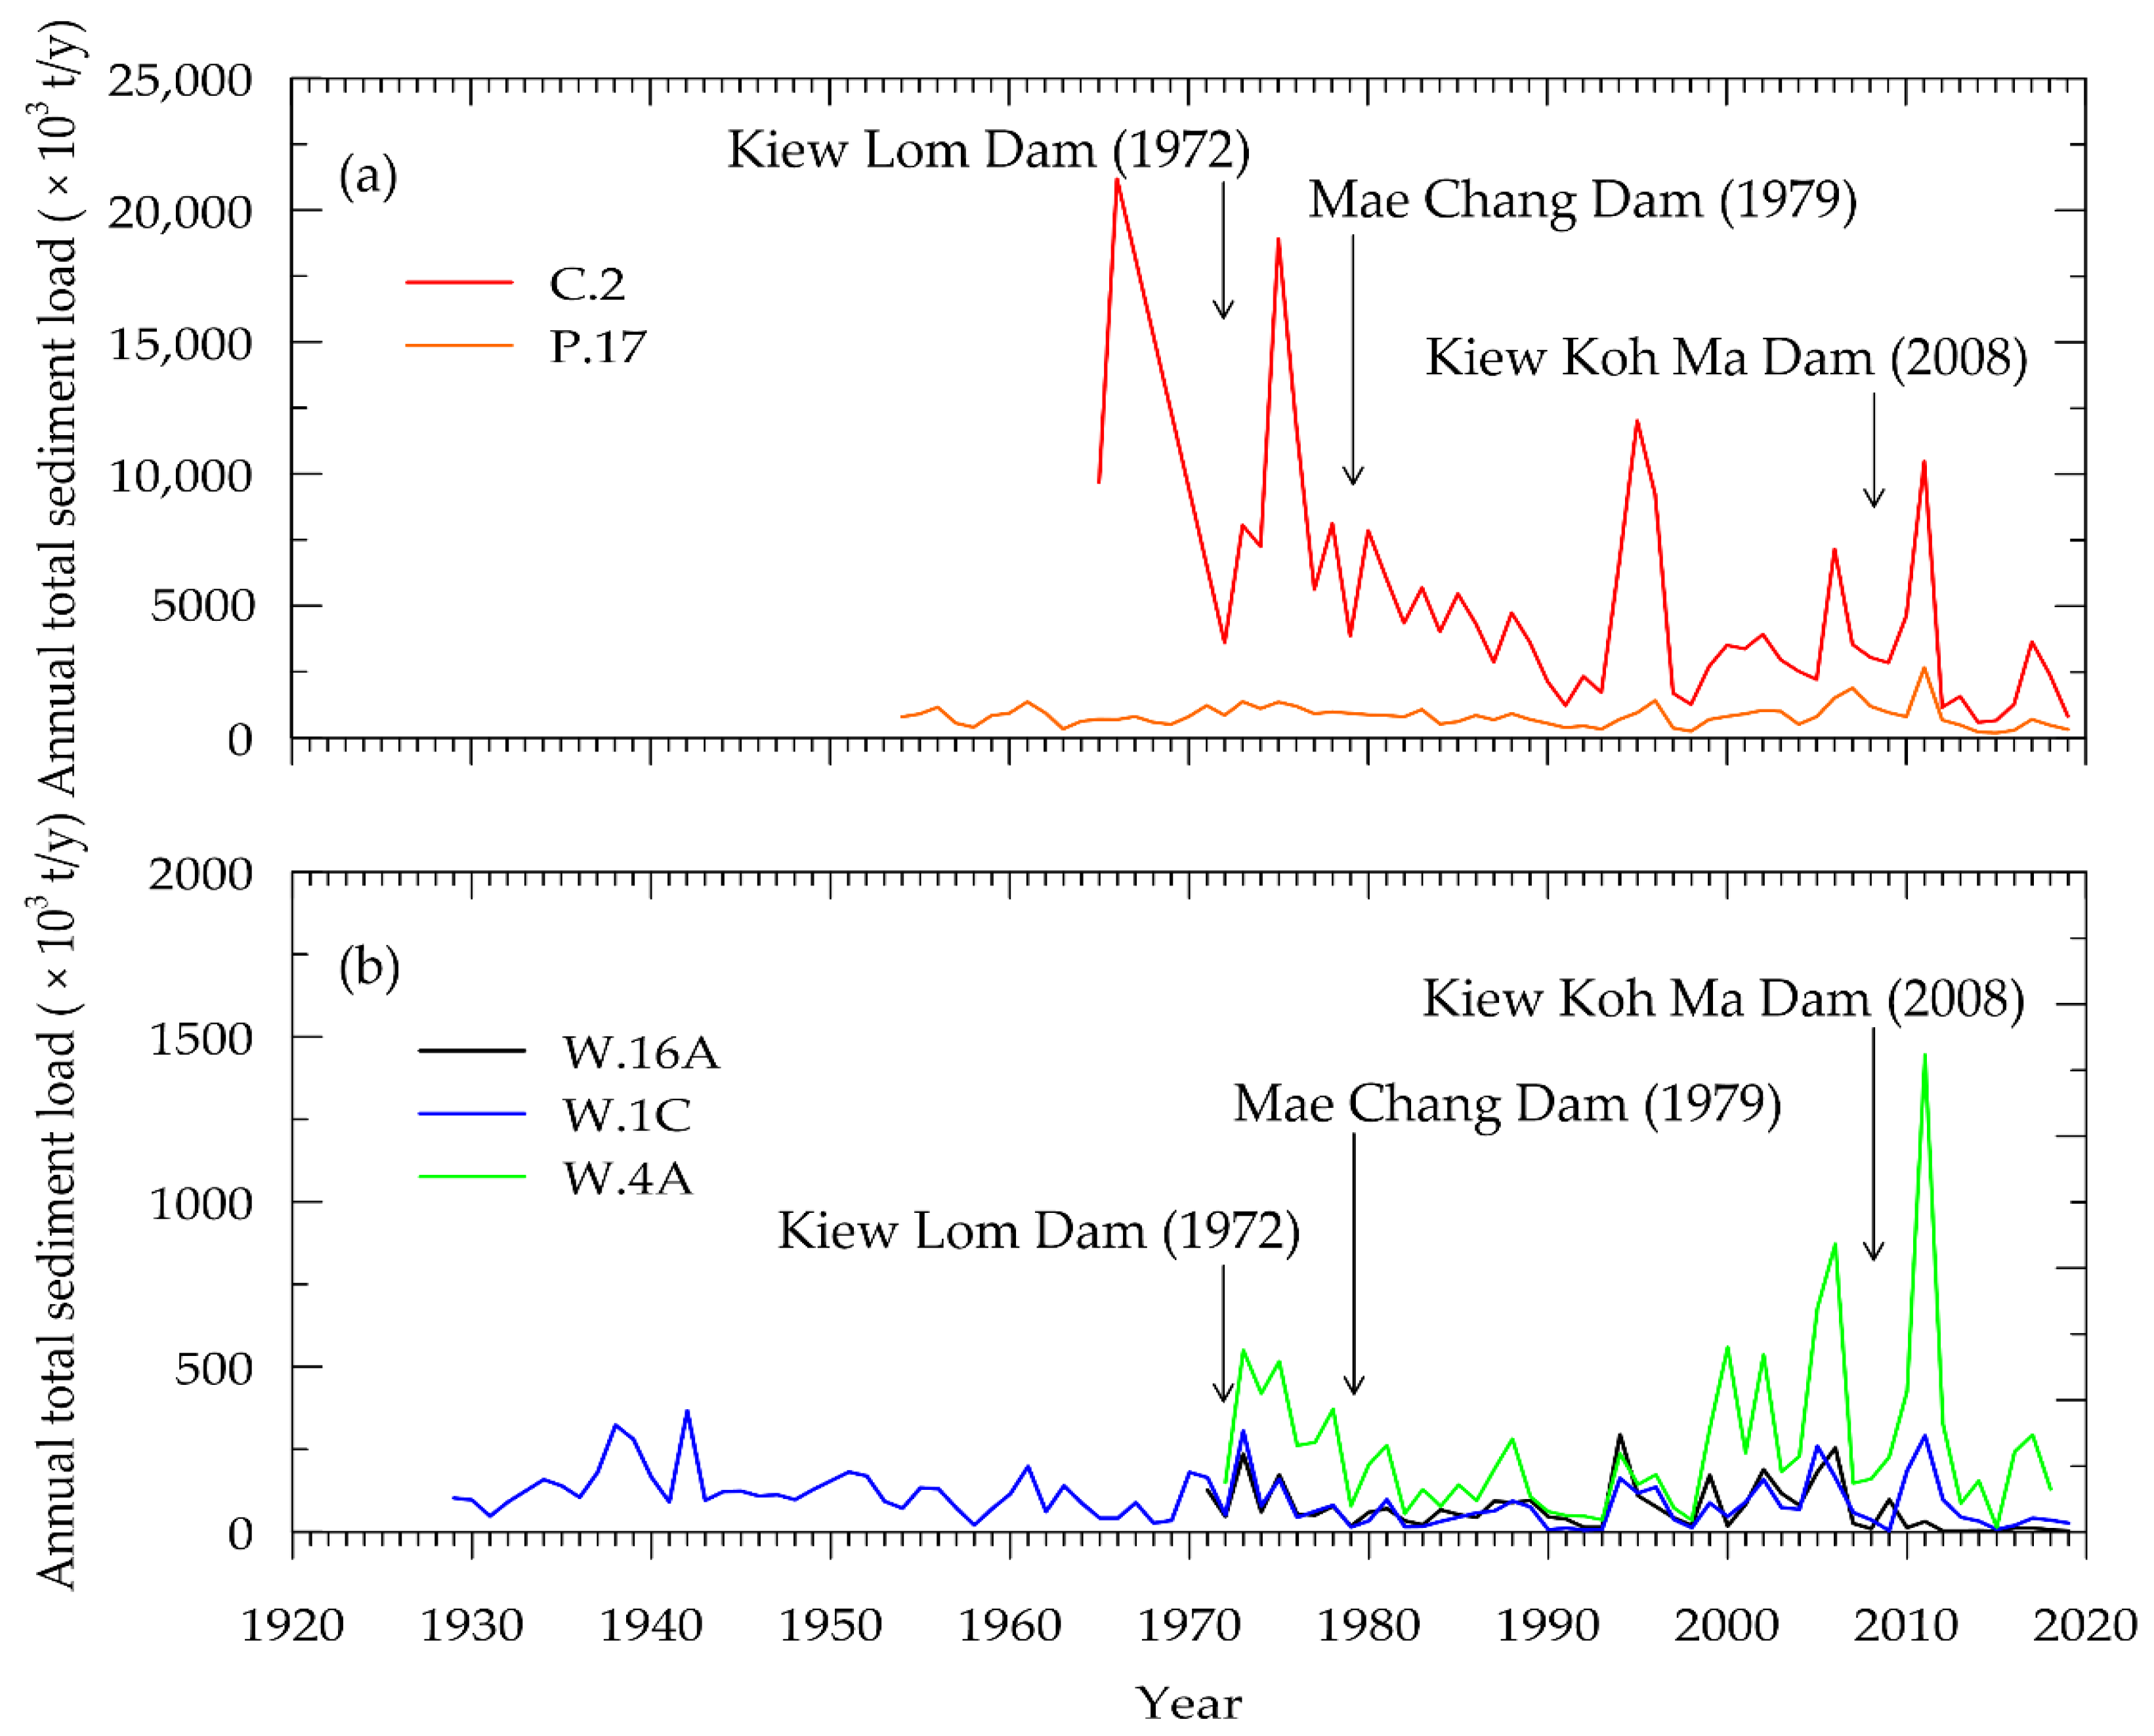
3.2.2. Historical Suspended Sediment Loads along the Wang River

Time series of annual SSL at each hydrological station observed from 1965 to 2019 are presented in Figure 5, and results from the basic statistical analysis of daily SSL data are summarized in Table 1. Analysis of daily sediment data indicated that suspended sediment load increased toward downstream. In the upper reach, the SSL varied between 0 and 47,554 t/d with an average SSL of 80 and 140 t/d at W.25 and W.16A, respectively. Maximum SSL of 47,554 t/d occurred near the sub-basin outlet (W.16A) during the Thailand Great Flood of 2011. MK analysis on sediment data at W.16A from 1986 to 2019 indicated that the SSL of the upper basin had a statistically decreasing trend (p-value = 0.0036; Table 1). Between 1986 and 2007, the upper basin yielded annual SSL of 16,000–220,000 t/y with an average of 100,000 t/y. However, annual SSL plummeted to 1000–28,000 t/y after the Kiew Koh Ma Dam became operational in 2008.
In the middle Wang River Basin, average SSL observed at W.1C ranged from 0 to 24,245 t/d between 1994 and 2019, while average SSL of the sub-basin was 213 t/d. Results from the trend analysis showed a significantly decreasing trend in SSL in the middle basin (p-value = 0.012; Table 1). Annual sediment data available at W.1C in the middle basin yielded 36,000–152,000 t/y of suspended sediment load before construction of the Kiew Koh Ma Dam (Figure 5b). Annual SSL reduced to 7000–89,000 t/y after dam construction, except in 2010 and 2011, when SSL levels were greater than 152,000 t/y due to severe floods.
Analysis of sediment data measured at W.3A, W.23, and W.4A showed that daily SSL along the lower Wang River Basin varied between 0 and 87,782 t/d, with an average of 2.6–3.4 times greater than that in the middle basin. Highest daily SSL was found at W.3A (124 km from the river outlet) during the Great Flood of 2011; however, the flood caused maximum annual SSL recorded at each hydrological station. Results from the MK analysis indicated no increasing or decreasing trends in SSL in the lower basin. Table 1 shows that average SSL at the outlet of the Wang River (582 t/d at W.4A) accounted for about 33% of the average SSL of the Ping River (1753 t/d) and about 4% of the CPY (13,705 t/d).

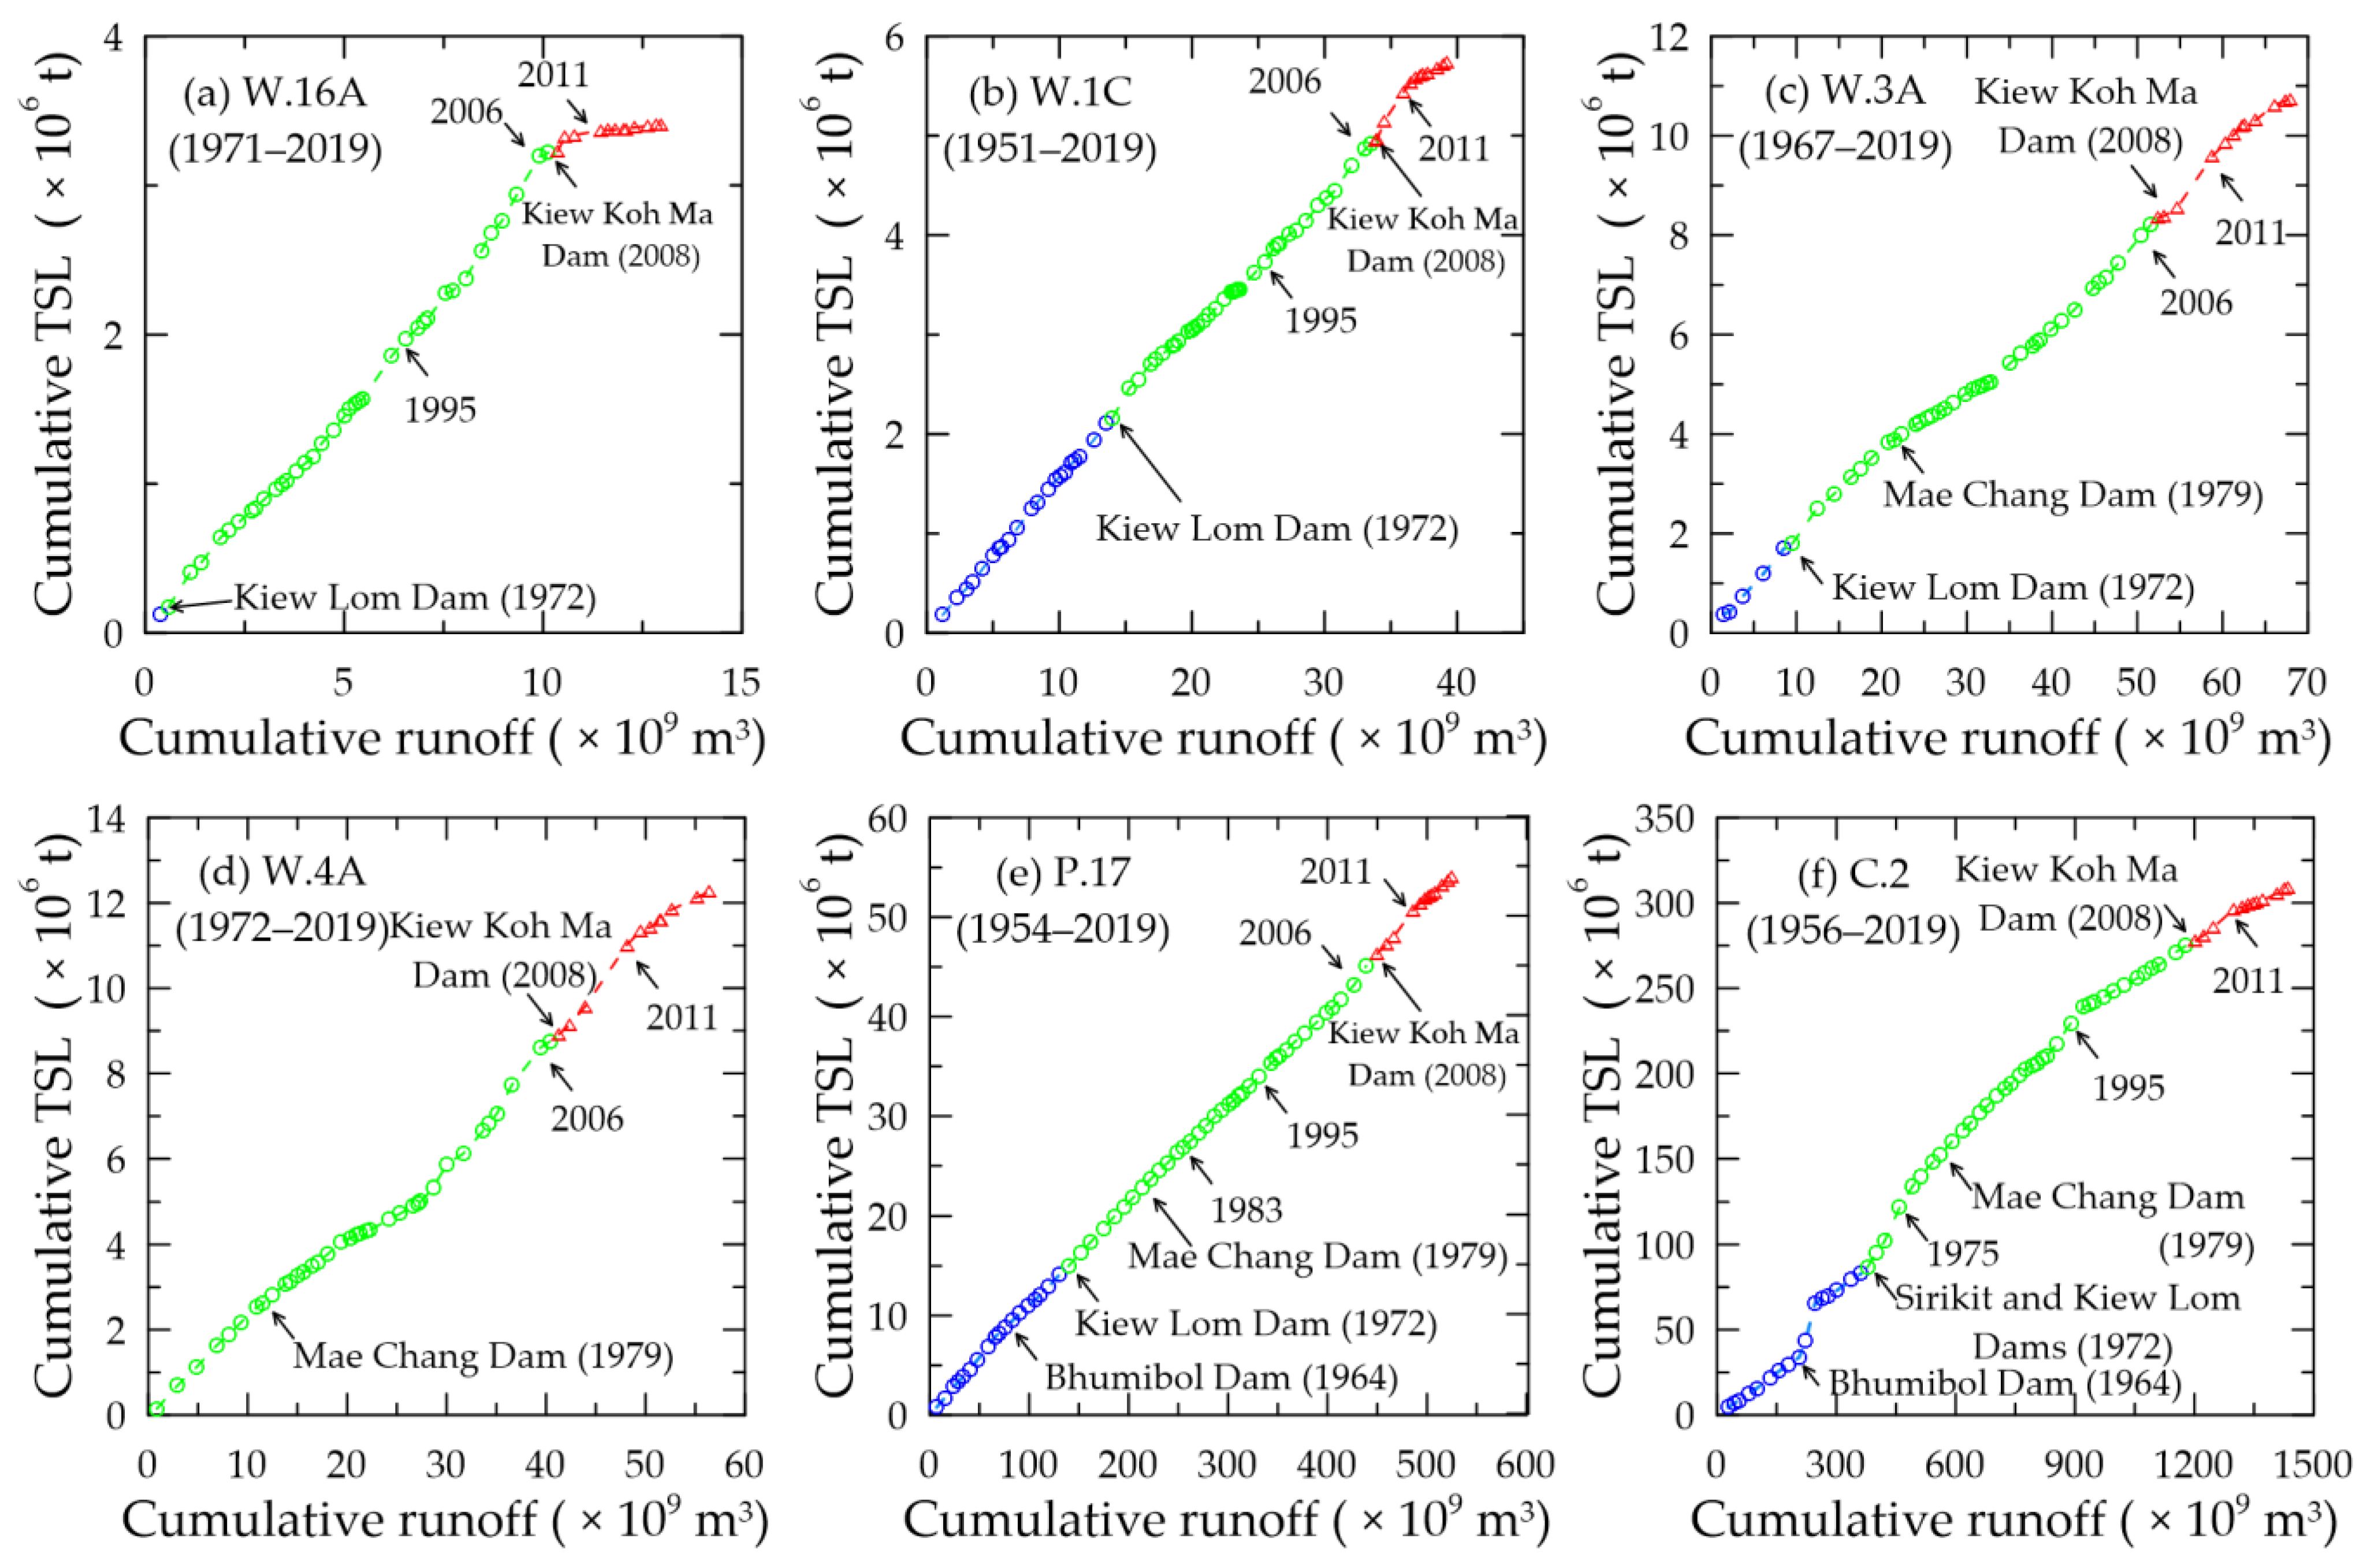
3.2.3. Relationship between River Flow and Suspended Sediment Load

The relationship between daily SSL (Qs) and daily streamflow (Qw) observed at each hydrological station was plotted, as shown in Figure S1. The plots indicated that daily SSL measured at most hydrological stations along the Wang River had a strong correlation with daily streamflow (coefficient of determination R2 at greater than 0.82). However, the SSL measured at W.16A and C.2 had poor correlation with the daily discharge after 2008 and 1972, respectively (see Figure S1b,h). Relationships between daily streamflow and SSL analyzed by the linear regression method are presented as Equations (8)–(16):
Station   W . 25   Q s = 2.881 Q w 1.559   R 2 = 0.89
Station   W . 16 A   ( before   2008 )   Q s = 3.701 Q w 1.489   R 2   =   0.92
Station   W . 16 A   ( after   2008 )   Q s = 0.699 Q w 1.384   R 2 = 0.57
Station   W . 1 C   Q s = 0.991 Q w 1.565   R 2   =   0.82
Station   W . 3 A   Q s = 0.419 Q w 1.663   R 2 = 0.85
Station   W . 23   Q s = 0.847 Q w 1.574   R 2   =   0.90
Station   W . 4 Q s = 1.663 Q w 1.444   R 2   =   0.90
Station   C . 2   ( from   1965   to   1971 )   Q s = 0.026 Q w 2.099   R 2 = 0.89
Station   C . 2   ( from   1972   to   2019 )   Q s = 1.221 Q w 1.316   R 2 = 0.63
where Qs represents daily SSL (t/d), and Qw represents daily streamflow (m3/s).

3.2.4. Variability of Sediment Loads along the Wang River

The summation of SSL and BL represents the total sediment load (TSL) transported along the river. TSL at each hydrological station was estimated to evaluate the variability of sediment load along the Wang River, including the effects of damming on sediment loads supplied to the CPY River system. Measured SSL data were discontinuous and only available for a few recent decades in some locations. Therefore, Equations (8)–(16) were used to estimate missing SSL data at each hydrological station (pre- and post-construction of the three major dams). The BL at each station along the Wang River was approximated using the BL/SSL ratios observed at the corresponding sites (XW.1 for W.25, XW.10 for W.16A, XW.14 for W.1C, XW.15 for W.23, and XW.17 for W.4A), while BL values at P.17 and C.2 were calculated using the BL/SSL ratio studied by Namsai et al. [5] and Bidorn et al. [35], respectively. Time series and a statistical summary of estimated annual TSL along the Wang River Basin between 1929 and 2019 are presented in Figure S2 and Table 3, respectively. Based on river flow and sediment load averaged over the same time periods (1972–2007, 2001–2019, and 2009–2019), variations in average river flow and total sediment load along the Wang River were plotted, as shown in Figure 6a,b, respectively. Results indicated that streamflow along the Wang River at each time period generally increased toward downstream but slightly fluctuated along the lower reach. Average TSL tended to increase downstream and ranged 0.001–0.036 × 10⁶ t/y along the upper and middle reaches. The TSL increased in the lower reach (0.01–2.14 × 10⁶ t/y), while maximum TSL value occurred at the mid-point of the basin with an average of 0.45 × 10⁶ t/y (Table 3). Results from the trend analysis revealed that TSL at the Wang River outlet (W.4A) showed no increasing or decreasing trend, although a statistically significant decreasing trend was found at the upper, middle, and lower reaches.

3.3. Effect of Large Dam Constructions on Sediment Loads in the Wang River

To evaluate the effects of dam construction on sediment load in the Wang River and sediment supply from the Wang River to the Chao Phraya River, double mass curves (DMC) of cumulative annual river runoff and cumulative total sediment load at six stations were plotted, as shown in Figure 7. This study focused on assessing the influences of construction of the Kiew Lom, Mae Chang, and Kiew Koh Ma Dams in 1972, 1979, and 2008, respectively. The DMC of Station W.16A (Figure 7a) located in the upper basin downstream from the Kiew Koh Ma Dam revealed a decline in slope in 2008 when the Kiew Koh Ma Dam became operational. Figure 7b shows the DMC of W.1C located in the middle reach downstream of the Kiew Lom Dam. After the Kiew Lom Dam construction in 1972, an increase in the DMC slope occurred in 1973 due to the tropical depression “Louise.” However, a change in the DMC slope due to construction of the Kiew Koh Ma Dam in 2008 was not observed. In the lower basin, a decrease in slope of the DMC at W.3A (Figure 7c) indicated the effect of the construction of the Mae Chang Dam in 1979. However, the Mae Chang Dam only slightly affected the DMC slope of W.4A (Figure 7d) located at the end of the Wang River. Figure 7e shows that the construction of the three major dams in the Wang River caused an insignificant change in the slope of the DMC at P.17. Similarly, the slope of the DMC at C.2 (Figure 7f) showed no obvious change after the construction of the dams in 1972, 1979, and 2008.

4. Discussion

4.1. Sediment Characteristics

The Wang River Basin is a dendritic drainage basin. River gradient in the upper and middle Wang River reaches is characterized as mountainous (1:600–1:1800), while the lower basin is considered as a floodplain (1:4000) [49]. Based on the observed sediment data, the upper reaches of the Wang River (1:600–1:830) are characterized by coarse sand to pebbles, with pebble beds found mainly near the dams. The middle and lower reaches, where the river gradient is milder than 1:1700, are composed of coarse to very coarse sand. Results from historical sediment data analysis revealed that SSL along the river was strongly correlated with river runoff. The SSL in the upper basin was lower than in the lower basin due to a smaller river cross-section. Sediment loads generally tended to increase further downstream (Table 1) because of the larger drainage area, but observed data in this study (Table 2) indicated that SSL decreased downstream of the Kiew Koh Ma Dam (XW.4) and Kiew Lom Dam (XW.7 and XW.8). Sediment loads increased drastically in the lower basin with extra sediment supplied from the Mae Chang and Mae Tam Rivers that are major tributaries of the Wang River (Figure 6b). In the lower basin, river discharge was relatively persistent but both historical and observed sediment data indicated that SSL increased in the middle of the lower reach due to sediment supplied from several streams. The SSL near the outlet of the Wang River noticeably declined because of reduction in the cross-section of the river.
The Wang River is one of four major tributaries (Ping, Wang, Yom, and Nan) forming the Chao Phraya River but sediment processes in this system have never been systematically studied and documented. Generally, about 10–20% of the total sediment load is transported as bedload in non-mountainous rivers, with 20–30% for mountainous rivers [64]. In Thailand, the RID conventionally estimated BL as 30% of SSL or 23% of TSL in water resources planning and design [65]. The Wang River Basin is characterized by both mountainous areas and floodplains. Results from this study revealed that BL in the upper and middle reaches with mountainous features accounted for 0–80% of the TSL (Table 2), while 0–45% of the TSL in the lower basin (non-mountainous river) was transported as BL. BL was higher than SSL at XW.5 (78%) and XW.7 (80%), downstream of the Kiew Koh Ma and Kiew Lom Dams, respectively. In the lower reach, sediment transport as BL at more than 40% of TSL was found at XW.15 (W.23), where sediment was supplied from several streams.
Results from this study revealed that sediment characteristics of the Wang River differed from general rivers. The Wang has a small river basin situated between the Ping and Yom River Basins (Figure 1a). Sediment characteristics were also different from these two rivers. The mountainous Ping River Basin is 3.2 times larger than the Wang River Basin but BL transport in the upper reaches accounted for less than 4% of the TSL [5], while BL in the middle and lower reaches with a river gradient of about 1:2700 varied between 30 and 98% of the TSL [5]. BL values higher than 80% of the TSL were found downstream from the Bhumibol Dam and were influenced by dam operation [5]. Similarly, BL at 78–80% of the TSL was found downstream of the Kiew Koh Ma and Kiew Lom Dams. The Yom River at 2.2 times greater than the Wang River drainage area, comprises non- and mountainous river reaches. Unlike the lower reach of the Wang River, Namsai et al. [40] reported that sediment transport in the Yom lower reach, with a gradient less than 1:9000, was mostly suspended load and BL was less than 5% of the TSL. Our results revealed that sediment characteristics of each river were unique and area specific. Systematic and continuous observations are required to obtain reliable sediment data for effective and sustainable planning and design of water resources projects.

4.2. Sediment Dynamics

To evaluate the effect of sediment variation in the Wang River on the Chao Phraya River, long-term TSL data were used covering pre- and post-construction of the major dams. Figure 8 illustrates the variation of TSL at W.16A, W.1C, W.4A, P.17, and C.2 between 1929 and 2019. Data at W.16A during the past five decades revealed that TSL in the upper basin after operation of the Kiew Lom Dam varied from 0.001 to 0.29 × 10⁶ t/y with an average of 0.07 × 10⁶ t/y. Results from the MK analysis in Table 3 indicated a statistically declining trend (p-value = 0.002) in TSL in the upper basin. Meanwhile, 90-year TSL data at W.1C covering pre- and post-construction of the Kiew Lom and Kiew Koh Ma Dams revealed that the middle basin yielded 0.003–0.36 × 10⁶ t/y with an average of 0.10 × 10⁶ t/y. The MK analysis of TSL in the middle basin also showed a decreasing trend. Based on the sediment data analysis, average TSL at W.1C in the middle basin from 1929 to 1971 (before Kiew Lom Dam construction in the upper basin) averaged 0.12 × 10⁶ t/y. This reduced to 0.08 × 10⁶ t/y between 1972 and 2007 (after Kiew Lom Dam operation and before Kiew Koh Ma Dam construction) and decreased to 0.07 × 10⁶ t/y between 2008 and 2019 after the construction of the Kiew Koh Ma Dam upstream from the Kiew Lom Dam.
However, average TSL at W.3A in the lower basin between 1967 and 2019 was 0.2 × 10⁶ t/y with a range of 0.01–1.03 × 10⁶ t/y. Unlike the upper and middle basins, TSL at W.3A showed no increasing or decreasing trend. Similarly, no statistical trend was observed in the 1972 to 2019 sediment data near the outlet of the lower basin at W.4A. The TSL at W.4A varied between 0.01 × 10⁶ and 1.44 × 10⁶ t/y with an average of 0.26 × 10⁶ t/y. In 1979, construction of the Mae Chang Dam in the Mae Chang tributary in the middle basin was completed. Based on the sediment load analysis, average TSL at W.3A between 1967 and 1978 (11 years before Mae Chang Dam construction) was 0.3 × 10⁶ t/y, and at W.4A, the TSL was 0.33 × 10⁶ t/y. Between 1979 and 2007 (28 years after dam construction), TSL values at W.3A and W.4A reduced to 0.15 × 10⁶ t/y and 0.21 × 10⁶ t/y, respectively. After the Kiew Koh Ma Dam became operational in 2008, the average TSL at W.3A increased to 0.21 × 10⁶ t/y, and at W.4A, TSL increased to 0.32 × 10⁶ t/y. The increase in TSL found at W.4A indicated that the effects of damming were outweighed by other factors such as extreme climate (the Great Flood of 2011 shown in Figure 8), additional sediment supplied from the tributaries, and human activities in the lower basin that were reflected in the steeper slope of the DMC (Figure 7c,d).
Comparison between the TSL at W.4A and P.17 indicated that the Wang River contributed sediment load to the Ping River at about 30% on average, and this increased to 36% over the past 25 years. Results also showed that the Wang River supplied 50–87% of the TSL in the lower reach of the Ping River during high-water years. This result supported a study by Namsai et al. [5] who found that sediment load in the Ping River noticeably increased downstream after the confluence of the Ping and Wang Rivers. Comparing bed material size between the Wang and Ping Rivers, 150 km of the Ping River downstream from the confluence had a similar size of 0.81–0.85 mm to bed material at the Wang River outlet (0.84 mm). However, comparison of the TSL between the Wang River and CPR revealed that the TSL of the Wang River accounted for only 1–30% of the TSL in the CPR, at 10% on average. The Wang River had the second highest sediment yield per basin area (24 t/y/km2) compared to the Ping River (23.8 t/y/km2) [5], Yom River (14.5 t/y/km2) [40], and Nan River (43.6 t/y/km2) [42], and smaller contribution of sediment may cause reduced effects on the CPR sediment regime. Therefore, variation in sediment load in the Wang River due to climate change and/or human activities was likely not a major factor dominating sediment variation in the CPR.

4.3. Effect of Major Dam Construction on Sediment Supplied to the Chao Phraya River

Impacts of large dam construction on significant reduction in riverine sediment supply from many rivers to the ocean have been intensively reported during the past decades [7,47,66,67,68,69,70,71]. In Thailand, many studies suggested a 75–85% sediment reduction in the CPR system due to the Bhumibol Dam in the Ping River and the Sirikit Dam in the Nan River, resulting in severe coastal erosion in the upper Gulf of Thailand. However, a systematic sediment study by Namsai et al. [5] suggested that the Bhumibol Dam with a maximum storage of 13,462 × 106 m3 caused only a 5% sediment reduction to the CPR system. Even though construction of the Bhumibol Dam slightly reduced sediment load in the CPR system, the large dams on the Wang River, which has an obvious difference on sediment characteristics from the Ping River, may disturb sediment regime in a different degree.
The Kiew Lom Dam as one of the older dams in Thailand was constructed in the upper reach 290 km from the Wang River outlet. The dam was completed in the same year as the Sirikit Dam on the Nan River as key components of the Great Chao Phraya Project [42]. The DMC of TSL at W.1C (Figure 7b) showed no obvious change in slope after 1972, except for a shift due to a flood in 1973. River runoff upstream of the dam (W.16A) ranged 60–740 × 106 m3/y with an average of 265 × 106 m3/y and reservoir storage of only 112 × 106 m3. Thus, less than 20% of the inflow can be impounded every year. Therefore, about 80% of the suspended sediment was still transported downstream from the dam almost every year, resulting in an insignificant change in the sediment load downstream.
In 1979, the Mae Chang Dam was commissioned on the Mae Chang River to supply water to the Mae Moh Power Plant, the largest lignite power plant in Thailand. The Mae Chang Dam is situated 90 km upstream from the Mae Chang River outlet that merges with the middle reach of the Wang River 210 km upstream from the Wang River outlet. The dam has a reservoir capacity of 108.5 × 10⁶ m3 and caused an abrupt decrease in slope of the DMC at W.1C (Figure 7b). However, the effect of dam construction reduced downstream as seen in the DMC at W.4A (Figure 7d). The impact of the dam on sediment load in the lower basin was likely outweighed by other factors such as sediment supplied from ten major tributaries in the lower Wang River basin and the expansion of the agricultural area since 1994 [49].
Because the Kiew Lom Dam could only store about 19% of the river runoff, the Kiew Koh Ma Dam was constructed and completed in 2008 to enhance the water resource capacity in the Wang River Basin. The dam was built 345 km upstream of the Wang River outlet with a reservoir capacity of 172 × 106 m3 [72]. Construction of the Kiew Koh Ma Dam had an obvious effect on the slope of the DMC at W.16A (Figure 7a). However, changes in slope of the DMC at W.1C, W.3A, and W.4A, including P.17 and C.2 were not seen. The dam directly affected sediment load in the upper reach. The river runoff upstream of the dam (W.25) varied between 15 × 106 and 300 × 106 m3/y with an average of 160 × 106 m3/y, and the dam captured more than 50% of the annual river runoff, causing rapid sediment reduction downstream. However, because the Kiew Koh Ma Dam is located in the uppermost reaches of the river basin, sediment supplied from the downstream river basin compensated for the impact of the dam. Sediment load in the Wang River accounted for about 10% of the CPR, while the effect of construction of the Kiew Koh Ma Dam on the CPR system was diminished by sediment supplied from other major rivers such as the Nan River [5].
Based on the drainage areas, these three dams accounted for 28% of the total drainage area of the Wang River Basin. The reservoirs of the three dams captured about 20% of the average annual runoff of the Wang River [49], and sediment load noticeably increased in the lower basin. Since the Wang River only contributes about 10% of sediment load to the CPR, construction of the dams in the Wang River Basin did not result in a considerable change in sediment loads to the CPR Basin. Similar to the Ping River Basin, the sediment in the lower basin increased remarkedly downstream of the Bhumibol Dam. Although the drainage area of the dam accounted for 77% of the total drainage area of the Ping River Basin, it caused only 5% of sediment reduction in the CPR [5]. In contrast, the sediment load in the Yom River reduced dramatically at the basin outlet, although there is no large reservoir in the Yom River basin. This study reveals that damming may not be the primary human activity causing the sediment load reduction in a river basin. The impact of a dam likely depends on dam location and basin characteristics, especially variation of sediment load along a river. If a dam site is located in a basin with low sediment load upstream and high sediment load downstream, the effect of dam construction on sediment load would be less than that with a high sediment load upstream and a low sediment load downstream.
As environmental impacts due to damming have been widely mentioned during the recent years, construction of large reservoirs as a large-scale water resource became controversial in water management. Because of a rapid increase in water demand for national development, water shortage is now one of the critical issues in many countries worldwide due to insufficient water supply. A dam can still be an effective tool to provide water security with a proper site selection to meet the recent United Nations Sustainable Development Goals in a region where water resources are limited (http://sustainabledevelopment.un.org/focussdgs.html) (accessed on 18 July 2021).

5. Conclusions

Sediment characteristics and variation in sediment loads in the Wang River Basin, one of the four major river basins of the Chao Phraya River system were examined. Systematic river flow and sediment data measured in 2019 were combined with historical data recorded from 1929 to 2019 to evaluate the construction impact of three major dams with reservoir capacity > 100 × 106 m3 on sediment supplied to the Chao Phraya River system. Results revealed that the upper and middle reaches behaved as a mountainous river system characterized by very coarse sand to pebbles (0.5 < d50 < 3.7 mm). Sediment along the upper and middle reaches was mainly transported in suspension (BL < 20% of the total sediment load) except near the dams (BL > 75% of the total sediment load). The lower reach comprised a floodplain of coarse to very coarse sand (0.5 < d50 <2.5 mm), and sediment was primarily transported as suspended solid (BL < 40% of the total load). Based on historical river flow and sediment data during the past 90 years, daily suspended sediment load along the Wang River had a strong correlation with daily river discharge (R2 > 0.80).
Results from long-term total sediment load analysis suggested that average total sediment load in the upper basin increased from 40,000 t/y upstream of the Kiew Koh Ma Dam to 70,000 t/y downstream of the dam, with a slight increase to 100,000 t/y in the middle basin. The sediment load noticeably rose to more than 200,000 t/y in the lower basin. The maximum sediment load of 450,000 t/y occurred in the middle portion of the lower basin mainly due to more sediment being supplied from the Mae Tam and Mae Chang tributaries. Based on the analysis results, sediment load supplied from the Wang River accounted for 30% and 10% of the sediment load in the Ping River and CPR. The major large dams, such as the Kiew Lom, Mae Chang, and Kiew Koh Ma Dams, were constructed on the upper and middle basins. The effect of dam impoundment on sediment load supplied to the CPR system was counteracted by additional sediment yielded from the lower basin. The results also indicated that the effects of dam on sediment reduction depended on the location of the dam and the variation of sediment in the river basin.

Supplementary Materials

The following are available online at https://www.mdpi.com/article/10.3390/w13162146/s1: Figure S1: Sediment rating curves at eight RID hydrological stations: (a) W.25; (b) W.16A; (c) W.1C; (d) W.3A; (e) W.23; (f) W.4A; (g) P.17; (h) C.2.; Figure S2: Time series of total sediment load at RID hydrological stations: (a) P.17 and C.2; (b) W.25, W.16A, W.1C, W.3A, W.23 and W.4A.

Author Contributions

Conceptualization, W.C., M.N. and B.B.; methodology, W.C., K.B. and M.N.; formal analysis, W.C. and B.B.; investigation, B.B., W.C., K.B. and C.R.; writing—original draft preparation, W.C.; writing—review and editing, B.B., B.P. and C.R.; supervision, B.P. and C.R.; project administration, B.B.; funding acquisition, B.B. All authors have read and agreed to the published version of the manuscript.

Funding

This research was funded Office of the Higher Education Policy, Science, Research and Innovation National Council (NRCT) by Human Resource Development and Management Unit and Funding for the Development of Higher Education Institutions Research and Innovation Creation, grant number B05F630024.

Institutional Review Board Statement

Not applicable.

Informed Consent Statement

Not applicable.

Data Availability Statement

The data presented in this study is available on request from the corresponding author.

Acknowledgments

The authors acknowledge the support of the RID for providing the river datasets used in this study. The authors also acknowledge the support of the 100th Anniversary Chulalongkorn University Fund for Doctoral Scholarship, the 90th Anniversary Chulalongkorn University Fund (Ratchadaphiseksomphot Endowment Fund: GCUGR1125633037D) and Research Assistant Scholarship (GCUGE17). We thank four anonymous reviewers and an academic editor who provided many insightful comments.

Conflicts of Interest

The authors declare no conflict of interest.

References

  1. Syvitski, J.P.M.; Vörösmarty, C.J.; Kettner, A.J.; Green, P. Impact of humans on the flux of terrestrial sediment to the global coastal ocean. Science 2005, 308, 376–380. [Google Scholar] [CrossRef] [PubMed]
  2. Tessler, Z.D.; Vörösmarty, C.J.; Grossberg, M.; Gladkova, I.; Aizenman, H.; Syvitski, J.P.M.; Georgiou, E.F. Profiling risk and sustainability in coastal deltas of the world. Science 2015, 349, 638–643. [Google Scholar] [CrossRef] [Green Version]
  3. Mikhailov, V.N.; Mikhailova, M.V. Impact of local water management and hydraulic-engineering projects on river deltas. Water Resour. 2015, 42, 275–284. [Google Scholar] [CrossRef]
  4. Jiang, C.; Zhang, L.; Li, D.; Li, F. Water discharge and sediment load changes in China: Change patterns, causes, and implications. Water 2015, 7, 5849–5875. [Google Scholar] [CrossRef] [Green Version]
  5. Namsai, M.; Charoenlerkthawin, W.; Sirapojanakul, S.; Burnett, W.C.; Bidorn, B. Did the construction of the Bhumibol Dam cause a dramatic reduction in sediment supply to the Chao Phraya River? Water 2021, 13, 386. [Google Scholar] [CrossRef]
  6. Brandt, S.A. Classification of geomorphological effects downstream of dams. Catena 2000, 40, 375–401. [Google Scholar] [CrossRef]
  7. Liu, S.W.; Zhang, X.F.; Xu, Q.X.; Liu, D.C.; Yuan, J.; Wang, M.L. Variation and driving factors of water discharge and sediment load in different regions of the Jinsha River Basin in China in the past 50 years. Water 2019, 11, 1109. [Google Scholar] [CrossRef] [Green Version]
  8. Huang, F.; Luo, X.; Liu, W. Stability analysis of hydrodynamic pressure landslides with different permeability coefficients affected by reservoir water level fluctuations and rainstorms. Water 2017, 9, 450. [Google Scholar] [CrossRef] [Green Version]
  9. Reisenbüchler, M.; Bui, M.D.; Rutschmann, P. Reservoir sediment management using artificial neural networks: A case study of the lower section of the Alpine Saalach River. Water 2021, 13, 818. [Google Scholar] [CrossRef]
  10. He, Y.; Gui, Z.; Su, C.; Chen, X.; Chen, D.; Lin, K.; Bai, X. Response of sediment load to hydrological change in the upstream part of the Lancang-Mekong river over the past 50 years. Water 2018, 10, 888. [Google Scholar] [CrossRef] [Green Version]
  11. Wang, H.; Yang, Z.; Wang, Y.; Saito, Y.; Liu, J.P. Reconstruction of sediment flux from the Changjiang (Yangtze River) to the sea since the 1860s. J. Hydrol. 2008, 349, 318–332. [Google Scholar] [CrossRef]
  12. Yang, Z.S.; Wang, H.J.; Saito, Y.; Milliman, J.D.; Xu, K.; Qiao, S.; Shi, G. Dam impacts on the Changjiang (Yangtze) River sediment discharge to the sea: The past 55 years and after the Three Gorges Dam. Water Resour. Res. 2006, 42, W04407. [Google Scholar] [CrossRef]
  13. Liu, C.; Sui, J.; Wang, Z.Y. Sediment load reduction in Chinese rivers. Int. J. Sediment. Res. 2008, 23, 44–55. [Google Scholar] [CrossRef]
  14. Li, Q.; Yu, M.; Lu, G.; Cai, T.; Bai, X.; Xia, Z. Impacts of the Gezhouba and Three Gorges Reservoirs on the sediment regime in the Yangtze River, China. J. Hydrol. 2011, 403, 224–233. [Google Scholar] [CrossRef]
  15. Guo, L.; Su, N.; Zhu, C.; He, Q. How have the river discharges and sediment loads changed in the Changjiang River Basin downstream of the Three Gorges Dam? J. Hydrol. 2018, 560, 259–274. [Google Scholar] [CrossRef] [Green Version]
  16. Yang, H.F.; Yang, S.L.; Xu, K.H.; Milliman, J.D.; Wang, H.; Yang, Z.; Chen, Z.; Zhang, C.Y. Human impacts on sediment in the Yangtze River: A review and new perspectives. Glob. Planet. Chang. 2018, 162, 8–17. [Google Scholar] [CrossRef]
  17. Dai, Z.; Mei, X.; Darby, S.E.; Lou, Y.; Li, W. Fluvial sediment transfer in the Changjiang (Yangtze) river-estuary depositional system. J. Hydrol. 2018, 566, 719–734. [Google Scholar] [CrossRef] [Green Version]
  18. Guo, C.; Jin, Z.; Guo, L.; Lu, J.; Ren, S.; Zhou, Y. On the cumulative dam impact in the upper Changjiang River: Streamflow and sediment load changes. Catena 2020, 184, 104250. [Google Scholar] [CrossRef]
  19. Walling, D.E.; Fang, D. Recent trends in the suspended sediment loads of the world’s rivers. Glob. Planet. Chang. 2003, 39, 111–126. [Google Scholar] [CrossRef]
  20. Milliman, J.D.; Meade, R.H. World-wide delivery of river sediment to the oceans. J. Geol. 1983, 91, 1–21. [Google Scholar] [CrossRef]
  21. Shalash, S. Effects of sedimentation on the storage capacity of the High Aswan Dam reservoir. Hydrobiologia 1982, 91, 623–639. [Google Scholar] [CrossRef]
  22. Lu, X.X.; Oeurng, C.; Le, T.P.Q.; Thuy, D.T. Sediment budget as affected by construction of a sequence of dams in the lower Red River, Viet Nam. Geomorphology 2015, 248, 125–133. [Google Scholar] [CrossRef]
  23. Vinh, V.D.; Ouillon, S.; Thanh, T.D.; Chu, L.V. Impact of the Hoa Binh dam (Vietnam) on water and sediment budgets in the Red River basin and delta. Hydrol. Earth Syst. Sci. 2014, 18, 3987–4005. [Google Scholar] [CrossRef] [Green Version]
  24. Le, T.P.Q.; Garnier, J.; Gilles, B.; Sylvain, T.; Van Minh, C. The changing flow regime and sediment load of the Red River, Viet Nam. J. Hydrol. 2007, 334, 199–214. [Google Scholar] [CrossRef]
  25. Ve, N.D.; Fan, D.; Van Vuong, B.; Lan, T.D. Sediment budget and morphological change in the Red River Delta under increasing human interferences. Mar. Geol. 2021, 431, 106379. [Google Scholar] [CrossRef]
  26. Lu, X.X.; Siew, R.Y. Water discharge and sediment flux changes over the past decades in the Lower Mekong River: Possible impacts of the Chinese dams. Hydrol. Earth Syst. Sci. 2006, 10, 181–195. [Google Scholar] [CrossRef] [Green Version]
  27. Fu, K.D.; He, D.M.; Lu, X.X. Sedimentation in the Manwan reservoir in the Upper Mekong and its downstream impacts. Quat. Int. 2008, 186, 91–99. [Google Scholar] [CrossRef]
  28. Liu, C.; He, Y.; Walling, D.E.; Wang, J. Changes in the sediment load of the Lancang–Mekong River over the period 1965–2003. Sci. China Technol. Sci. 2013, 56, 843–852. [Google Scholar] [CrossRef]
  29. Kondolf, G.M.; Rubin, Z.K.; Minear, J.T. Dams on the Mekong: Cumulative sediment starvation. Water Resour. Res. 2014, 50, 5158–5169. [Google Scholar] [CrossRef]
  30. Kondolf, G.M.; Schmitt, R.J.; Carling, P.; Darby, S.; Arias, M.; Bizzi, S.; Castelletti, A.; Cochrane, T.A.; Gibson, S.; Kummu, M.; et al. Changing sediment budget of the Mekong: Cumulative threats and management strategies for a large river basin. Sci. Total Environ. 2018, 625, 114–134. [Google Scholar] [CrossRef] [Green Version]
  31. Schmitt, R.J.; Bizzi, S.; Castelletti, A.; Opperman, J.J.; Kondolf, G.M. Planning dam portfolios for low sediment trapping shows limits for sustainable hydropower in the Mekong. Sci. Adv. 2019, 5, eaaw2175. [Google Scholar] [CrossRef] [Green Version]
  32. Binh, V.D.; Kantoush, S.; Sumi, T. Changes to long-term discharge and sediment loads in the Vietnamese Mekong Delta caused by upstream dams. Geomorphology 2020, 353, 107011. [Google Scholar] [CrossRef]
  33. Tanabe, S.; Saito, Y.; Sato, Y.; Suzuki, Y.; Sinsakul, S.; Tiyapairach, S.; Chaimanee, N. Stratigraphy and Holocene evolution of the mud–dominated Chao Phraya delta, Thailand. Quat. Sci. Rev. 2003, 22, 789–807. [Google Scholar] [CrossRef]
  34. Bidorn, B.; Kish, S.A.; Donoghue, J.F.; Bidorn, K.; Mama, R. Sediment transport characteristic of the Ping River Basin, Thailand. Procedia Eng. 2016, 154, 557–564. [Google Scholar] [CrossRef] [Green Version]
  35. Bidorn, B.; Kish, S.A.; Donoghue, J.F.; Huang, W.; Bidorn, K. Variability of the total sediment supply of the Chao Phraya River, Thailand. River Sedimentation. In Proceedings of the 13th International Symposium on River Sedimentation, Stuttgart, Germany, 19–22 September 2016; CRC Press: Stuttgart, Germany, 2016. [Google Scholar]
  36. Bidorn, B.; Rukvichai, C. Impacts of coastal development on the shoreline change of the Eastern Gulf of Thailand. In IOP Conf. Series: Earth and Environmental Science, Proceedings of the 5th International Conference on Coastal and Ocean Engineering (ICCOE 2018), Shanghai, China, 27–29 April 2018; IOP Publishing Ltd.: Shanghai, China, 2018; Volume 171, p. 012007. [Google Scholar]
  37. Namsai, M.; Mama, R.; Sirapojanakul, S.; Chanyotha, S.; Phanomphongphaisan, N.; Bidorn, B. The characteristics of sediment transport in the upper and middle Yom River, Thailand. In Proceedings of the THA 2019 International Conference on Water Management and Climate Change towards Asia’s Water–Energy–Food Nexus and SDGs, Bangkok, Thailand, 23–25 January 2019; Water Resources System Research Unit, Chulalongkorn University: Bangkok, Thailand, 2019; pp. 346–352. [Google Scholar]
  38. Phanomphongphaisarn, N.; Bidorn, B. Effectiveness and impacts of long jetty at the Southern Coast of Thailand. Eng. J. 2020, 24, 1–17. [Google Scholar] [CrossRef]
  39. Bidorn, B.; Phanomphongphaisarn, N.; Rukvichai, C.; Kongsawadworakul, P. Evolution of mangrove muddy coast in the Western Coast of the Upper Gulf of Thailand over the past six decades. In Estuaries and Coastal Zones in Times of Global Change; Springer Water; Nguyen, K., Guillou, S., Gourbesville, P., Thiébot, J., Eds.; Springer: Singapore, 2020; pp. 429–442. [Google Scholar]
  40. Namsai, M.; Bidorn, B.; Chanyotha, S.; Mama, R.; Phanomphongphaisarn, N. Sediment dynamics and temporal variation of runoff in the Yom River, Thailand. Int. J. Sediment. Res. 2020, 35, 365–376. [Google Scholar] [CrossRef]
  41. Bidorn, B.; Sok, K.; Bidorn, K.; Burnett, W.C. An analysis of the factors responsible for the shoreline retreat of the Chao Phraya Delta (Thailand). Sci. Total Environ. 2021, 769, 145253. [Google Scholar] [CrossRef]
  42. Bidorn, B.; Kish, S.A.; Donoghue, J.F.; Bidorn, K.; Mama, R. Change in sediment characteristics and sediment load of the Nan River due to large dam construction. In Proceedings of the 37th IAHR World Congress 2017, Kuala Lumpur, Malaysia, 13–18 August 2017; IAHR: Kuala Lumpur, Malaysia, 2017; pp. 403–412. [Google Scholar]
  43. Vongvissessomjai, S. Chao Phraya Delta: Paddy field irrigation areas in tidal deposits. In Proceedings of the 56th International Executive Council of ICID, Beijing, China, 10−18 September 2005; Available online: https://www.rid.go.th/thaicid/_5_article/2549/10_1ChaoPhraYaDelta.pdf (accessed on 13 April 2021).
  44. Winterwerp, J.C.; Borst, W.G.; De Vries, M.B. Pilot study on the erosion and rehabilitation of a mangrove mud coast. J. Coast. Res. 2005, 21, 223–230. [Google Scholar] [CrossRef]
  45. Uehara, K.; Sojisuporn, P.; Saito, Y.; Jarupongsakul, T. Erosion and accretion processes in a muddy dissipative coast, the Chao Phraya River delta, Thailand. Earth Surf. Process. Landf. 2010, 35, 1701–1711. [Google Scholar] [CrossRef]
  46. Gupta, H.; Kao, S.J.; Dai, M. The role of mega dams in reducing sediment fluxes: A case study of large Asian rivers. J. Hydrol. 2012, 464–465, 447–458. [Google Scholar] [CrossRef]
  47. Milliman, J.D.; Farnsworth, K.L. River Discharge to the Coastal Ocean: A Global Synthesis; Cambridge University Press: New York, NY, USA, 2011; pp. 1–382. [Google Scholar]
  48. Wang, Y.; Rhoads, B.L.; Wang, D.; Wu, J.; Zhang, X. Impacts of large dams on the complexity of suspended sediment dynamics in the Yangtze River. J. Hydrol. 2018, 558, 184–195. [Google Scholar] [CrossRef]
  49. Hydro and Agro Informatics Institute (HAII). Report on Data Collection and Analysis: Database Development Project and Flood and Drought Modeling of 25 River Basins (Wang River Basin); Hydro and Agro Infomatics Institute (HAII): Bangkok, Thailand, 2012. (In Thai) [Google Scholar]
  50. Hydro and Agro Informatics Institute (HAII). Report on Data Collection and Analysis: Database Development Project and Flood and Drought Modeling of 25 River Basins (Ping River Basin); Hydro and Agro Infomatics Institute (HAII): Bangkok, Thailand, 2012. (In Thai) [Google Scholar]
  51. Office of Natural Resources and Environmental Policy and Planning. Developing Watershed Management Organizations in Pilot Sub-Basins of the Ping River Basin; Final Report; Office of Natural Resources and Environmental Policy and Planning, Ministry of Natural Resources and Environment: Bangkok, Thailand, 2005.
  52. Mann, H.B. Nonparametric tests against trend. Econometrica 1945, 13, 245–259. [Google Scholar] [CrossRef]
  53. Kendall, M.G. Rank Correlation Methods, 4th ed.; Charles Griffin: London, UK, 1975. [Google Scholar]
  54. Shi, H.; Hu, C.; Wang, Y.; Liu, C.; Li, H. Analyses of trends and causes for variations in runoff and sediment load of the Yellow River. Int. J. Sediment Res. 2017, 32, 171–179. [Google Scholar] [CrossRef]
  55. Yue, X.; Mu, X.; Zhao, G.; Shao, H.; Gao, P. Dynamic changes of sediment load in the middle reaches of the Yellow River basin, China and implications for eco-restoration. Ecol. Eng. 2014, 73, 64–72. [Google Scholar] [CrossRef]
  56. Zhang, S.; Lu, X.X.; Higgitt, D.L.; Chen, C.T.A.; Han, J.; Sun, H. Recent changes of water discharge and sediment load in the Zhujiang (Pearl River) Basin, China. Glob. Planet. Chang. 2008, 60, 365–380. [Google Scholar] [CrossRef]
  57. Mama, R.; Jung, K.; Bidorn, B.; Namsai, M.; Feng, M. The local observed trends and variability in rainfall indices over the past century of the Yom River Basin, Thailand. J. Korean Soc. Hazard Mitig. 2018, 18, 41–55. [Google Scholar] [CrossRef]
  58. Yue, S.; Wang, C. The Mann–Kendall test modified by effective sample size to detect trend in serially correlated hydrological series. Water Resour. Manag. 2004, 18, 201–218. [Google Scholar] [CrossRef]
  59. Li, Z.; Xu, X.; Yu, B.; Xu, C.; Liu, M.; Wang, K. Quantifying the impacts of climate and human activities on water and sediment discharge in a karst region of Southwest China. J. Hydrol. 2016, 542, 836–849. [Google Scholar] [CrossRef]
  60. Edwards, T.K.; Glysson, G.D.; Guy, H.P.; Norman, V.W. Field Methods for Measurement of Fluvial Sediment; US Geological Survey: Denver, CO, USA, 1999; pp. 1–89.
  61. Helley, E.J.; Smith, W. Development and Calibration of a Pressure-Difference Bedload Sampler; US Department of the Interior, Geological Survey, Water Resources Division: Menlo Park, CA, USA, 1971; pp. 1–18.
  62. Rachlewicz, G.; Zwoliński, Z.; Kociuba, W.; Stawska, M. Field testing of three bedload samplers’ efficiency in a gravel-bed river, Spitsbergen. Geomorphology 2017, 287, 90–100. [Google Scholar] [CrossRef]
  63. Lemma, H.; Nyssen, J.; Frankl, A.; Poesen, J.; Adgo, E.; Billi, P. Bedload transport measurements in the Gilgel Abay River, Lake Tana Basin, Ethiopia. J. Hydrol. 2019, 577, 123968. [Google Scholar] [CrossRef]
  64. Turowski, J.M.; Rickenmann, D.; Dadson, S.J. The partitioning of the total sediment load of a river into suspended load and bedload: A review of empirical data. Sedimentology 2010, 57, 1126–1146. [Google Scholar] [CrossRef]
  65. Royal Irrigation Department (RID). The Relation between Suspended Sediment and Drainage Area in 25 River Basins; Royal Irrigation Department: Bangkok, Thailand, 2012. (In Thai)
  66. Panda, D.K.; Kumar, A.; Mohanty, S. Recent trends in sediment load of tropical (Peninsular) river basins of India. Glob. Planet. Chang. 2011, 75, 108–118. [Google Scholar] [CrossRef]
  67. Walling, D.E. Human impact on land–ocean sediment transfer by the world’s rivers. Geomorphology 2006, 79, 192–216. [Google Scholar] [CrossRef]
  68. Wu, C.; Ji, C.; Shi, B.; Wang, Y.; Gao, J.; Yang, Y.; Mu, J. The impact of climate change and human activities on streamflow and sediment load in the Pearl River basin. Int. J. Sediment Res. 2019, 34, 307–321. [Google Scholar] [CrossRef]
  69. Zuliziana, S.; Tanuma, K.; Yoshimura, C.; Saavedra, O.C. Distributed model of hydrological and sediment transport processes in large river basins in Southeast Asia. Hydrol. Earth Syst. Sci. Discuss. 2015, 12, 6755–6797. [Google Scholar]
  70. Li, D.; Lu, X.X.; Yang, X.; Chen, L.; Lin, L. Sediment load responses to climate variation and cascade reservoirs in the Yangtze River: A case study of the Jinsha River. Geomorphology 2018, 322, 41–52. [Google Scholar] [CrossRef]
  71. Guo, L.P.; Mu, X.M.; Hu, J.M.; Gao, P.; Zhang, Y.F.; Liao, K.T.; Bai, H.; Chen, X.L.; Song, Y.J.; Jin, N. Assessing impacts of climate change and human activities on streamflow and sediment discharge in the Ganjiang River Basin (1964–2013). Water 2019, 11, 1679. [Google Scholar] [CrossRef] [Green Version]
  72. Royal Irrigation Department (RID). Report on Study of Dam Break of Kiew Koh Ma Dam; Royal Irrigation Department: Bangkok, Thailand, 2010. (In Thai)
Figure 1. Map of the Chao Phraya River Basin, Thailand: (a) Wang River Basin and location of dams in the Chao Phraya River system; (b) locations of hydrological stations operated by the Royal Irrigation Department (RID) and observation sites in this study.
Water 13 02146 g001
Figure 2. Longitudinal profile of the Wang River showing locations of RID hydrological stations (red triangles) and observation sites (grey diamonds). The zero mark on the x-axis represents the Wang River outlet.
Water 13 02146 g002
Figure 3. Observations along the Wang River during 2019: (a) river discharge; (b) median size bed material (d50); (c) suspended sediment load and bedload.
Water 13 02146 g003
Figure 4. Time series of annual runoff at the RID hydrological stations between 1929 and 2019: (a) P.17 and C.2; (b) W.25, W.16A, W.1C, W.3A, W.23, and W.4A.
Water 13 02146 g004
Figure 5. Time series data of annual total sediment load at the RID hydrological stations between 1965 and 2019: (a) P.17 and C.2; (b) W.25, W.16A, W.1C, W.3A, W.23, and W.4A.
Water 13 02146 g005
Figure 6. Plots of (a) average annual river runoff and (b) annual total sediment load along the Wang River.
Water 13 02146 g006
Figure 7. Plots showing cumulative annual runoff and total sediment load of the Wang River: (a) W.16A; (b) W.1C; (c) W.3A; (d) W.4A; (e) P.17; (f) C.2; blue, green, and red points represent data during pre-construction of the Kiew Lom Dam, pre-construction of the Kiew Koh Ma Dam, and post-construction of the Kiew Koh Ma Dam, respectively.
Water 13 02146 g007
Figure 8. Time series of total sediment load at the RID hydrological stations: (a) P.17 and C.2; (b) W.16A, W.1C, and W.4A.
Water 13 02146 g008
Table 1. Summary of available data and statistics of streamflow and suspended sediment at RID hydrological stations on the Wang River, Ping River, and Chao Phraya River (CPR) (significance accepted at p-value < 0.05).
Station1 Dist.DrainageDataPeriodMax.Ave.Min.4 p-Value5 Trend
(River)(km)(km2)
W.253887622 Qw (m3/s)2009–20191865~00.879Decreasing
(Wang) 3 Qs (t/d)2009–201914,32581~00.879Decreasing
W.16A3351392Qw (m3/s)1971–20195108~00.425Decreasing
(Wang) Qs (t/d)1986–201947,554140~00.0036Decreasing
W.1C2413478Qw (m3/s)1929–201982022~0<0.0001Decreasing
(Wang) Qs (t/d)1994–201924,245213~00.012Decreasing
W.3A1248985Qw (m3/s)1967–2019281442~00.247Decreasing
(Wang) Qs (t/d)1997–201987,782554~00.540Decreasing
W.23719930Qw (m3/s)2001–2019134242~00.093Decreasing
(Wang) Qs (t/d)2001–201983,457726~00.068Decreasing
W.4A3010,493Qw (m3/s)1972–2019107440~00.581Decreasing
(Wang) Qs (t/d)1989–200037,150582~00.101Decreasing
P.17–20045,297Qw (m3/s)1954–20192351252~00.507Decreasing
(Ping) Qs (t/d)2001–201932,902175390.127Decreasing
C.2–242109,973Qw (m3/s)1956–20195450711150.316Decreasing
(CPY) Qs (t/d)1965–2019493,80513,7052360.001Decreasing
1 Distance from the Wang River outlet: + sign is distance from the outlet toward upstream; – sign is distance from the outlet toward downstream; 2 Qw is river discharge (m3/s); 3 Qs is suspended sediment load (t/d); 4 p-value; 5 trend refer to the Mann–Kendall test; statistically significant trend is marked as bold text.
Table 2. Observed streamflow and sediment data along the Wang River 2019.
SiteDist.
(km)
1 A
(m2)
2 V
(m/s)
3 Qw
(m3/s)
4 Qs
(t/d)
5 Qb
(t/d)
6 Qt
(t/d)
Qb/QsQb/Qtd50
(mm)
Dry season
XW.1387.62.80.050.10.1100.11001.78
XW.2383.413.90.010.10.0800.08000.73
XW.3361.97.00.100.70.400.40001.33
XW.4334.613.40.162.11.70.402.100.240.192.47
XW.5319.67.90.231.84.591.616.200.350.262.11
XW.6308.430.70.134.15.705.70001.20
XW.7284.038.60.041.70.6300.63002.24
XW.8277.53.30.792.30.880.561.440.640.390.85
XW.9247.610.50.353.711.011.1512.160.100.100.53
XW.10240.357.50.073.96.4406.44001.12
XW.11217.0232.60.025.124.74024.74001.50
XW.12197.833.60.186.23.2203.22001.19
XW.13165.280.50.075.51.2401.24000.92
XW.14123.749.30.105.13.5303.53002.07
XW.1571.128.00.256.92.620.262.880.100.090.69
XW.1653.821.40.316.72.320.112.430.050.050.60
XW.1734.715.40.385.81.70.071.770.040.041.63
XW.183.145.70.146.56.8606.86001.03
Wet season
XW.1387.63.40.220.80.480.390.870.810.451.77
XW.2383.411.50.101.10.9400.94002.40
XW.3361.911.30.202.22.950.643.590.220.181.24
XW.4334.612.60.131.60.9200.92002.50
XW.5319.613.50.222.90.983.564.543.630.782.50
XW.6308.424.00.389.216.143.6419.780.230.181.46
XW.7284.020.00.275.41.767.349.104.170.813.70
XW.8277.545.60.146.43.7103.71001.35
XW.9247.68.10.826.617.042.6519.690.160.141.41
XW.10240.332.80.3511.448.763.4352.190.070.071.52
XW.11217.0229.10.1226.537.790.0437.830.0010.0010.68
XW.12197.875.70.3727.817.290.8518.140.050.050.61
XW.13165.2132.70.2229.337.220.2637.480.010.011.40
XW.14123.772.80.3928.249.450.8850.330.020.011.98
XW.1571.144.70.4118.412.49.6522.050.780.450.54
XW.1653.850.70.5326.992.7334.97127.70.380.270.69
XW.1734.743.60.5925.8107.6632.28139.940.300.231.07
XW.183.167.30.3221.267.236.8274.050.100.090.84
1 A is flow area; 2 V is flow velocity; 3 Qw is river discharge; 4 Qs is suspended sediment load; 5 Qb is bedload; 6 Qt is total sediment load. d50 is median grain size of the bed materials.
Table 3. Summary of estimated total sediment load (Qt) at RID hydrological stations on the Wang River and Station C.2 on the Chao Phraya River (significance accepted at p-value < 0.05).
Station1 Dist.
(km)
Drainage
(km2)
PeriodQt (×106 t/y)2 p-Value3 Trend
Max.Ave.Min.
W.25+3887622009–20190.110.040.0010.879Increasing
W.16A+33513921971–20190.290.070.0010.002Decreasing
W.1C+24134781929–20190.360.100.003<0.0001Decreasing
W.3A+12489851967–20191.030.200.010.337Decreasing
W.23+7199302001–20192.140.450.010.023Decreasing
W.4A+3010,4931972–20191.440.260.010.927Increasing
P.17–20045,2971954–20192.660.820.180.128Decreasing
C.2–242109,9731956–201921.814.830.600.003Decreasing
1 Distance from the Wang River outlet: + sign is the distance from the outlet toward upstream, – sign is the distance from the outlet toward downstream; 2 p-value; 3 trend refers to the Mann–Kendall test and significant trend is marked as bold.
Publisher’s Note: MDPI stays neutral with regard to jurisdictional claims in published maps and institutional affiliations.

