Article

Microstructure, Mechanical Properties, and Galvanic Corrosion of 10CrNi3MoV Fabricated by Wire Arc Additive Manufacturing

National Key Lab for Remanufacturing, Beijing 100072, China
*
Authors to whom correspondence should be addressed.
Metals 2021, 11(8), 1235; https://doi.org/10.3390/met11081235
Submission received: 26 May 2021 / Revised: 8 July 2021 / Accepted: 20 July 2021 / Published: 4 August 2021

Abstract

:
Wire arc additive manufacturing (WAAM) technology is widely used in the fields of aerospace, shipbuilding, and automobile industry due to the advantages of fast forming speed, high material utilization and low production cost. WAAM is extremely sensitive to parameters, and different processes and materials produce different deposition effects and properties. Therefore, it is of great significance to study the WAAM formability of various materials. Herein, the microstructure, mechanical properties, and galvanic corrosion behavior of the low-carbon high-strength steel (10CrNi3MoV) fabricated by cold metal transfer (CMT) WAAM technology were investigated. The single-channel multilayer deposition parts were prepared by reciprocating deposition, and the forming parts were divided into six zones by observing the different positions of the structure: matrix, heat-affected zone, remelting zone, initial deposition zone, interlayer zone, and interlayer bonding zone. Electron backscattered diffraction (EBSD) analysis showed that the amount of recrystallization and substructure in the deposition layer had no obvious change, and the texture phenomenon was the most obvious in the initial deposition zone of the pole map reaction. The texture phenomenon gradually weakened with the increase of the deposition layers. The microhardness from the matrix to the deposition stable zone was tested. The hardness of the matrix changed smoothly, that of the heat-affected zone was the largest, and that of the deposition layer was 221–282 HV0.2. The tensile properties were tested in different directions and angles, and the yield strength and tensile strength of the deposited layer were more than 550 MPa and 760 MPa, respectively. The galvanic corrosion behavior between the deposited layer and the matrix was investigated, and the polarization curve showed that the corrosion potential of the deposited layer was lower than that of the matrix, and the corrosion current density of the deposited layer was higher than that of the matrix.

1. Introduction

Flexible and digital manufacturing technologies, such as additive manufacturing (AM), have evolved as the future of modern manufacturing, exhibiting the capability to obtain multi-dimensional components and material functionality improvement [1]. Wire arc additive manufacturing (WAAM) is a branch of AM that has the advantages of fast forming speed, high material utilization rate, and low production cost, which is a good method for manufacturing large parts in aerospace, shipbuilding, automobile industry, and other fields [2]. The technology uses electric arc or plasma arc as the heat source to melt the metal welding wire, and the main forms are gas metal arc welding (GMAW), tungsten arc welding (TIG), plasma arc welding (PAW), etc. [3,4,5]. According to the principle of layer-by-layer accumulation, the three-dimensional metal blanks close to the product shape and size requirements are manufactured from the line-surface-body according to the three-dimensional digital model.
In 2020, the “Additive Manufacturing Trend Report-2020” released by AMFG showed that the global demand for large-scale parts printing equipment is increasing [6]. Laser additive manufacturing, electron beam additive manufacturing, and other technologies have the limitations of high cost, low deposition efficiency, and small forming size. Yanhu Wang et al. [7] explored several common welding materials and manufacturing technologies, including the shield gas, materials engineering, processes, and most concerned commercial interests, which showed that the materials cost of WAAM was about 10 times lower than that of the powder feeding under the same forming weight. With the rapid increase in the demand for various large parts in aerospace, shipbuilding industry, high-precision equipment, and other fields, WAAM with unique advantages has become a research hotspot in many universities and institutions [8,9]. WAAM materials possess strong adaptability, and the manufacture of complex structures and large parts became an important direction based on the past simple thin-walled parts. Yifeng Li et al. [10] successfully manufactured thin-walled parts with curved surface overhanging by using robotic wire and arc additive manufacturing (RWAAM) technology and proposed a practical algorithm, which was verified by a test case. The National Aeronautics and Space Administration (NASA) developed an arc-based liquid engine matrix and sheath process, which solved the difficult problems of traditional casting and forging processes that cannot be achieved [8]. Daniel Oropeza et al. [11] and others studied the manufacturing process of the nano-reinforced aluminum alloy 7075 welding wire that use widely in aerospace, which showed that WAAM produced complex parts with high strength and no cracks. Tianying He et al. [12] successfully manufactured ship propeller brackets using CMT technology. Alireza Vahedi Nemani et al. [13] demonstrated the possibility of manufacturing hull steel plates with WAAM. Ahmet Taşdemir [14] pointed out that WAAM was applied in the production of spherical parts, spherical bows, rudders and marine propellers, and other complex key parts from the point of view of the adaptability of materials and processes. Furthermore, the aluminum alloy WAAM technology has the advantages of light material and good forming effect, gradually replacing the traditional manufacturing process to develop more complex geometric parts [8].
In recent years, there were researches on WAAM process parameters, deposition path, and equipment design, which mainly focused on improving forming accuracy and organization performance, real-time control, and monitoring, and so on. The direct forming parts with a low precision cannot be used basically, which must meet the use conditions through subsequent cutting processing. Some scholars improved accuracy and enhanced microstructure and precision finish through rolling [15,16]. Based on this situation, most scholars were committed to the real-time control of the forming process through monitoring and controlling equipment to improve the performance of the forming parts. Most of the fine equiaxed grains were formed in the WAAM process, which was due to the fast heat dissipation caused by the direct contact between the formed parts and the matrix at the beginning of the deposition. With the increase of the layers, there were the refined grain zone, the transition zone, and the coarse grain zone along the vertical direction of the deposition layer, which resulted in the anisotropy of the WAAM parts. Therefore, many scholars proposed to refine the structure and improve the performance through heat treatment and ultrasonic impact strengthening, which has a great reference value [17,18,19,20].
Most of the studies focused on the mechanical properties (tensile strength and hardness) of different materials manufactured by WAAM, and the mechanical properties of the WAAM-formed parts were generally better than those of castings and inferior to those of forgings [21,22,23,24]. WAAM is very sensitive to the parameters, and the changes of the process and materials produced different deposition effects and properties, so it is of great significance to study the WAAM formability of various materials [25]. In the WAAM process, the formed parts contacted the matrix directly at the beginning of the deposition, which resulted in better heat dissipation to form fine equiaxed grains. With the increase of the layers, the refined grain zone, transition zone, and coarse grain zone appeared along the vertical direction of the deposition layer, which led to the anisotropy of WAAM parts. The microstructure was refined through heat treatment and ultrasonic impact strengthening, and the properties were improved [17,18,19]. Yi-li Dai et al. [22] studied the mechanical properties of the high-strength low-alloy steel prepared by CMT and divided the forming part into four zones: solidification zone, complete austenization zone, partial austenization zone, and tempering zone. The strength of the high-strength steel depended on the average grain size of the formed parts, which varied from 75 μm in the solidification zone to 20 μm in the tempering zone. The tensile strength of the formed part was 564 MPa, the yield strength was 417 MPa, the elongation was 26.5%, the impact toughness was 108 J (20 °C), the fracture was composed of many small dimples, and the fracture type was a kind of ductile fracture. Srinivasan Chandrasekaran et al. [26] employed functionally graded materials (carbon-manganese steel and duplex stainless steel welding wire) to prepare the module, and the strength of the module was 6% higher than that of the previous X50 steel.
The paper aimed to explore the WAAM manufacturing process of 10CrNi3MoV, a new material widely used in the shipbuilding industry, but the research on arc reinforcement manufacturing of 10CrNi3MoV is still very lacking. Most of the research is mainly based on the microstructure and properties of welded joints [27,28,29]. The single-channel multilayer deposition parts were prepared to further understand the characteristics of arc reinforcement manufacturing. The microstructure characteristics of six typical zones were analyzed, and the mechanical properties of different positions of the formed parts were tested. The galvanic corrosion behavior of the material was studied, which provided the basic data for the preparation of the high-performance and complex high-strength steel structure.

2. Materials and Methods

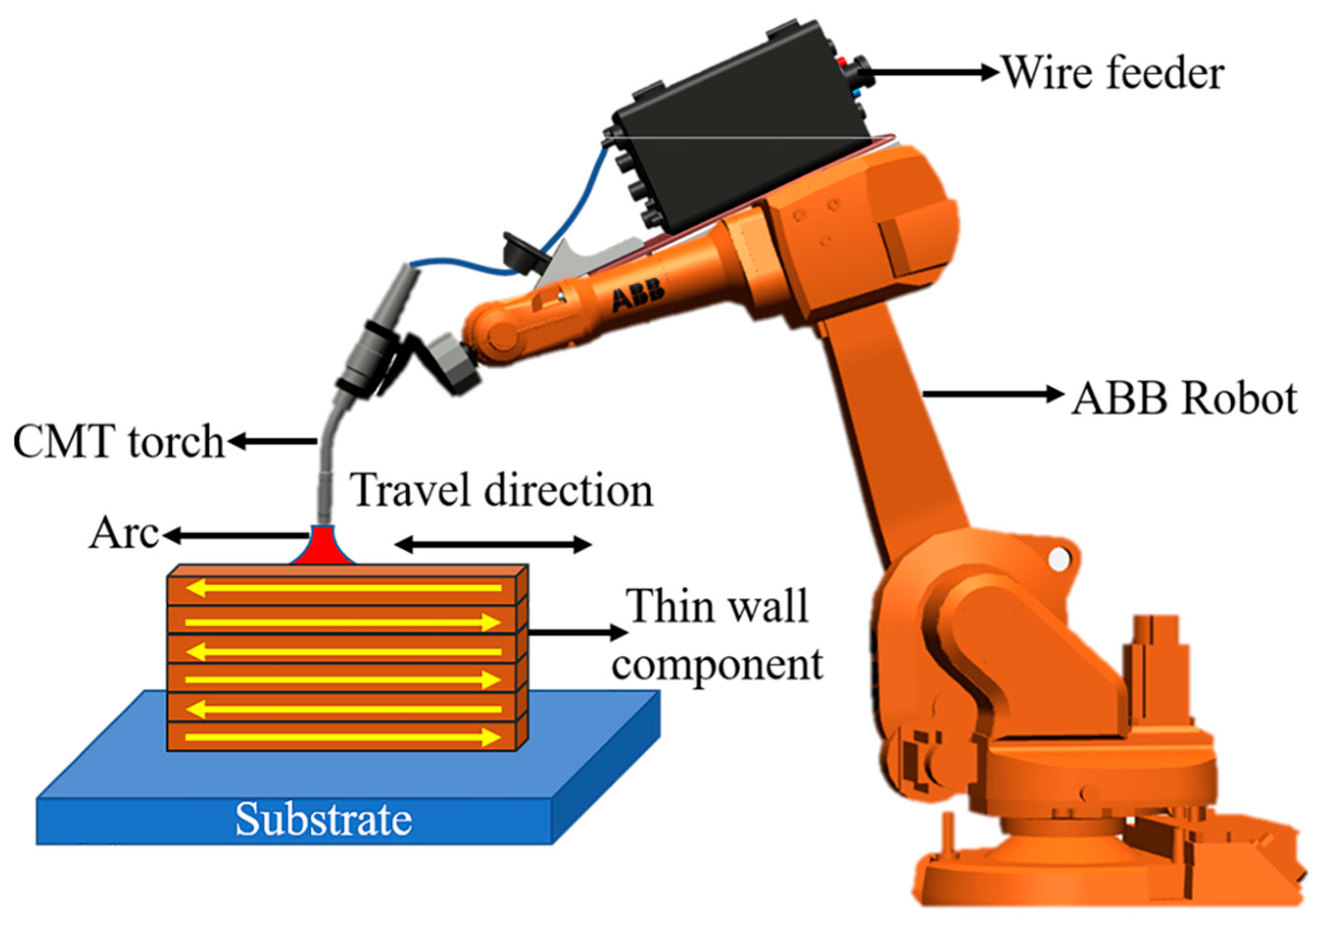
2.1. Materials and Equipment

The 10CrNi3MoV steel plate with a size of 300 × 200 × 25 mm was selected as the matrix, which was processed by rolling and modulating treatment. Before deposition, the surface of the matrix was cleaned of contaminants and oxides with alcohol. The welding wire was a JS590 alloy welding wire that matched the matrix, which was formed by a cold drawing process with a diameter of 1.2 mm. The composition and mechanical properties are shown in Table 1 and Table 2.
The ArcMan-600 arc additive equipment was used as the experiment equipment, which was developed by Nanjing Enigma Automation CO., Ltd. (Nanjing, China). and incorporated the self-developed 3D printing software IungoPNT. The welding equipment adopted a Fronius Advance-5000CMT welding machine and a 6-DOF ABB robot. The building dimensions (Building Dimensions): 400 × 400 × 600 mm, and the layer thickness resolution (Layer thickness resolution): 0.5–0.25 mm.

2.2. Deposition Mode
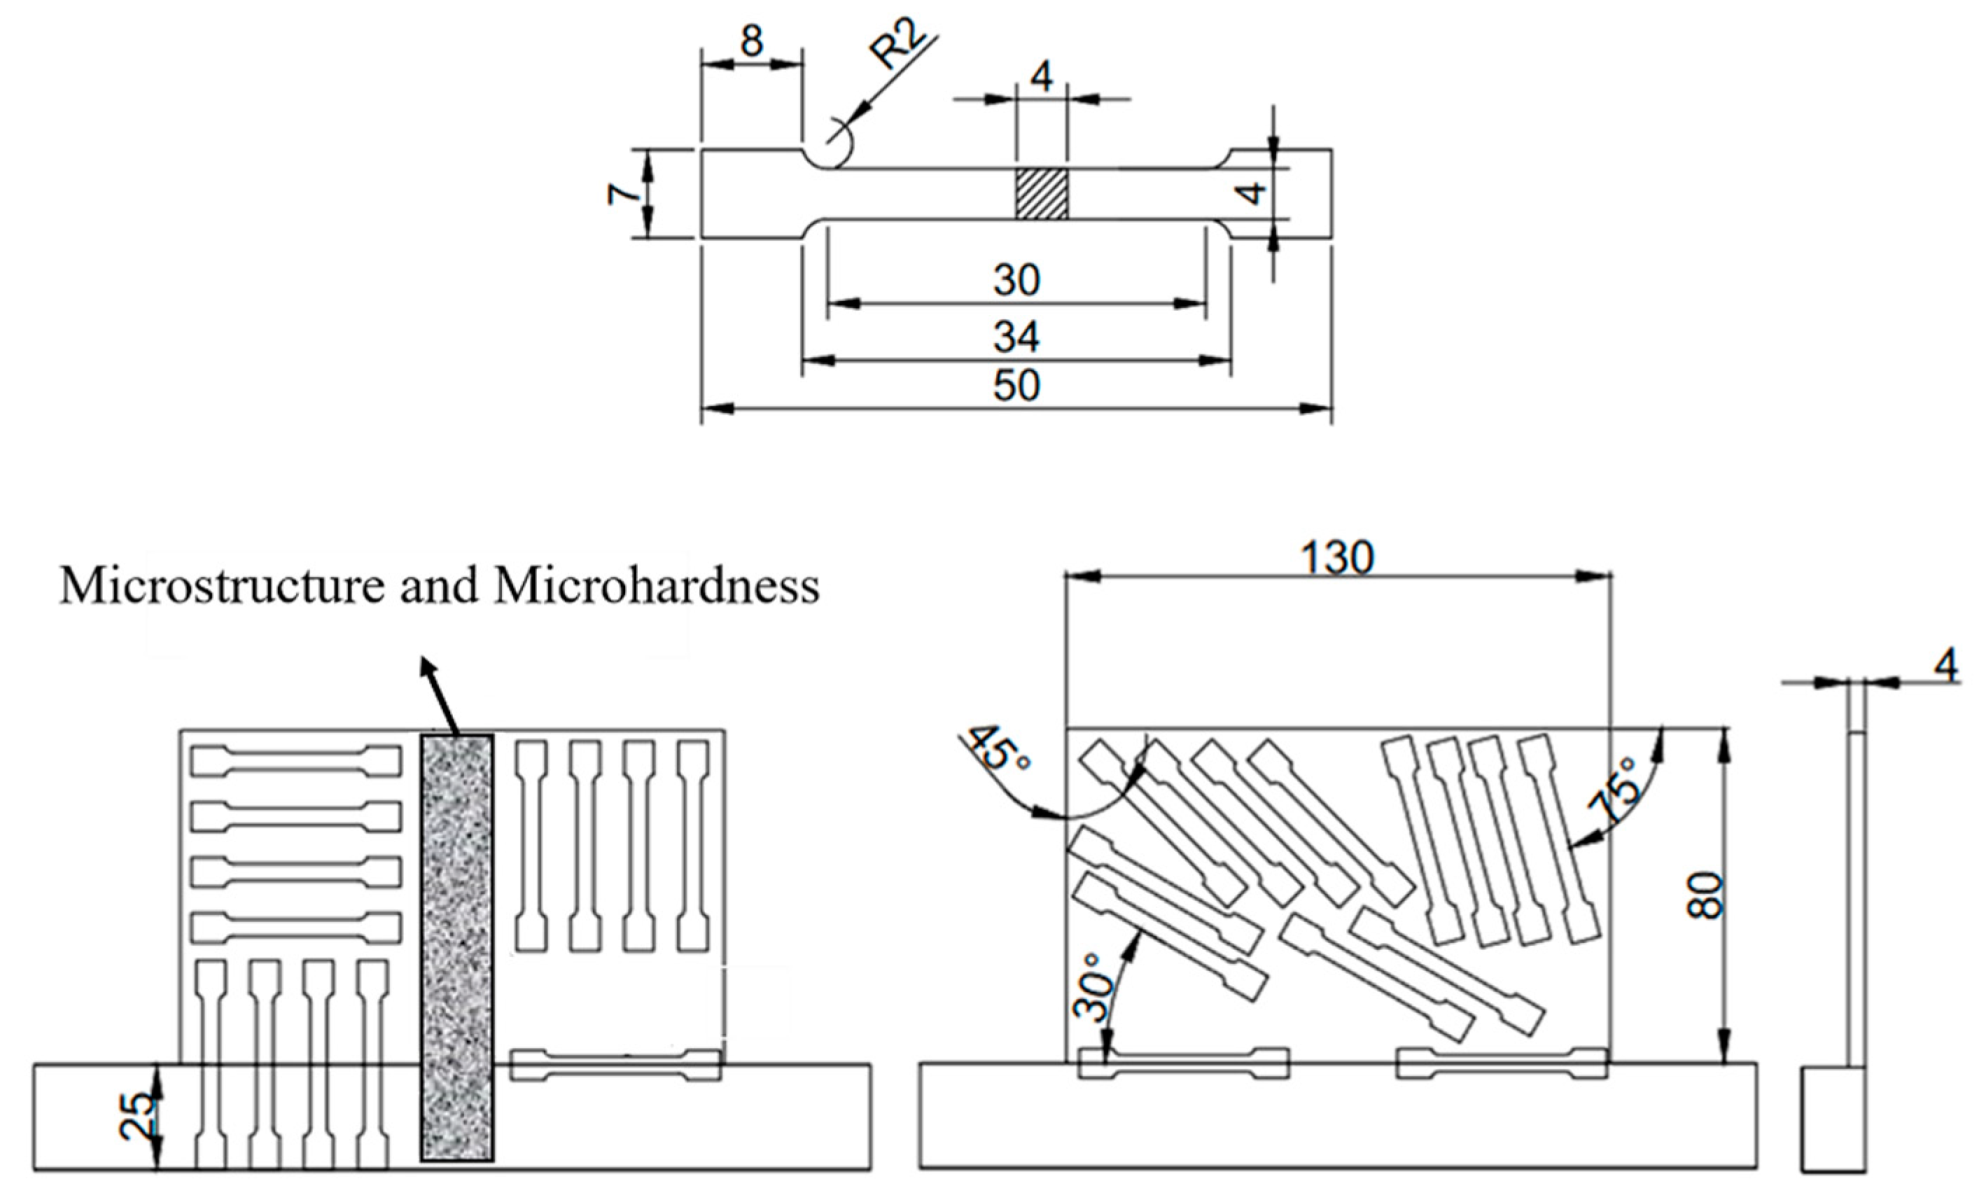
The optimal deposition parameters were selected based on the previous single-layer single-channel experiment results. The welding speed and wire feeding speed were mainly adjusted and controlled in the single-pass single-layer test. When the welding speed was 2 mm/s, and the wire feeding speed was 4 m/min and 5 m/min, the weld bead width was 9.6 mm and 12.4 mm, the residual height was 3.7 mm and 3.9 mm, the penetration depth was 1.4 and 1.8 mm, respectively. Therefore, the wire feeding speed of 4.5 m/min was selected for the single-layer multi-pass test, as shown in Table 3. The reciprocating deposition method was employed to deposit the single-channel multi-layer parts with a deposition length of 150 mm and a deposition height of 95 mm, and the experimental process is shown in Figure 1. The Smart-AS882 infrared thermometer was used to control the interlayer temperature during the deposition process.

2.3. Microstructure

The samples were taken from the middle of the sample by the wire-cut method for tissue analysis and the morphologies of the matrix to the deposited layer were observed. The samples were etched with 4% nitric acid and ethanol solutions after polishing by the metallographic and scanning electron microscope (SEM) samples. The morphologies of different zones were observed by OLS4000 and Gemini 300 scanning electron microscope. OXFORD NordlysMax3 electron backscattered diffraction (EBSD) was used to analyze the structure and grain condition of each part to further analyze the microstructure and grain state, and the sample was polished with argon ion.

2.4. Mechanical Properties

The hardness was measured on the Microhardness Tester HV-1000A micro-Vickers hardness tester according to national standards of the People’s Republic of China (GB/T) 4340.1-2009, the test force was 200 gf and the retention time was 10 s. Two zones were selected from the matrix to the forming stability zone in the test, with a height of 20 mm for each zone, and 40 points were measured (the interval between each point was 0.5 mm). The angles between the heavy tensile specimen and the deposition direction of the tensile test were 0°(level), 30°, 45°, 75°, and 90°(vertical), and the dimensions and locations are shown in Figure 2. The tensile test of the sample was conducted according to the standard GB/T 228.1-2010. The tensile property test at room temperature was carried out by using 100 kN material testing machine (Instron). The displacement control was adopted during the stretching, and the initial strain rate of the sample was 1 mm/min. The fracture morphology was observed by SEM.

2.5. Corrosion Performance

The galvanic corrosion behavior of the combined parts between the matrix and the deposited layer was observed by immersion in 3.5% NaCl solution. Two zones (10 × 10 mm) at the bottom of the matrix and the deposited layer were selected, and the ZAHNER ENNIUM electrochemical workstation was used to measure the open circuit potential (OCP) and polarization curve of the two zones to determine the corrosion current density and corrosion voltage. The optical microscope was employed to observe the morphologies after corrosion.

3. Results and Discussion

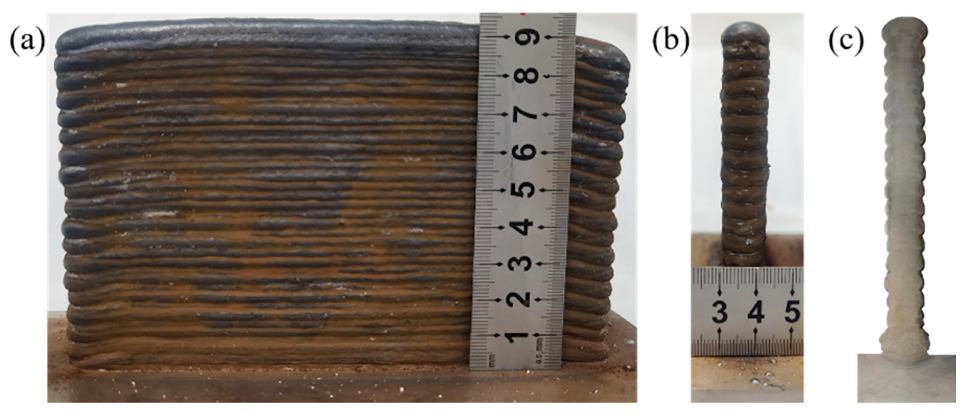
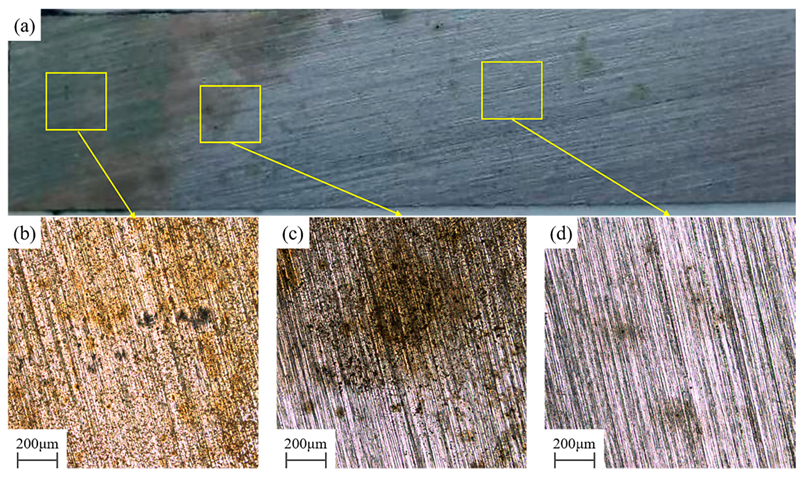
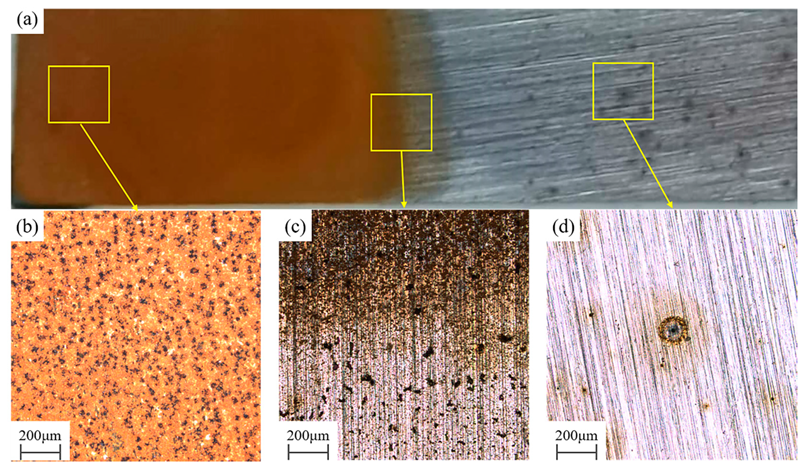
3.1. Macro-Morphology
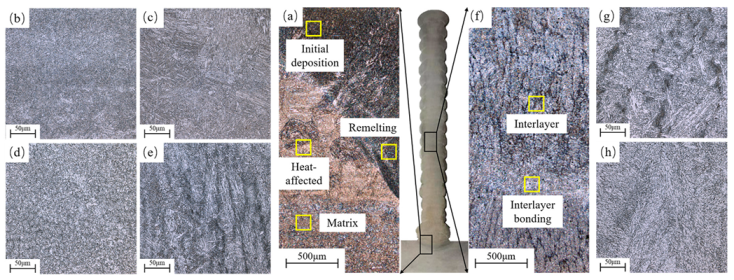
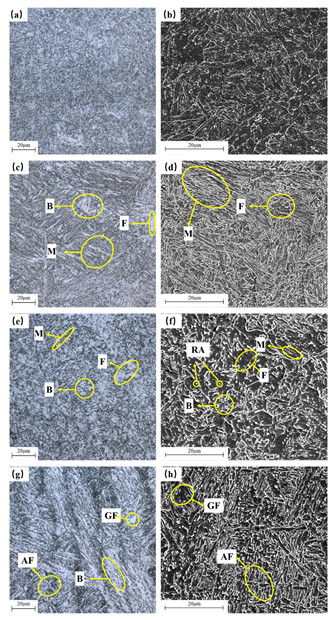
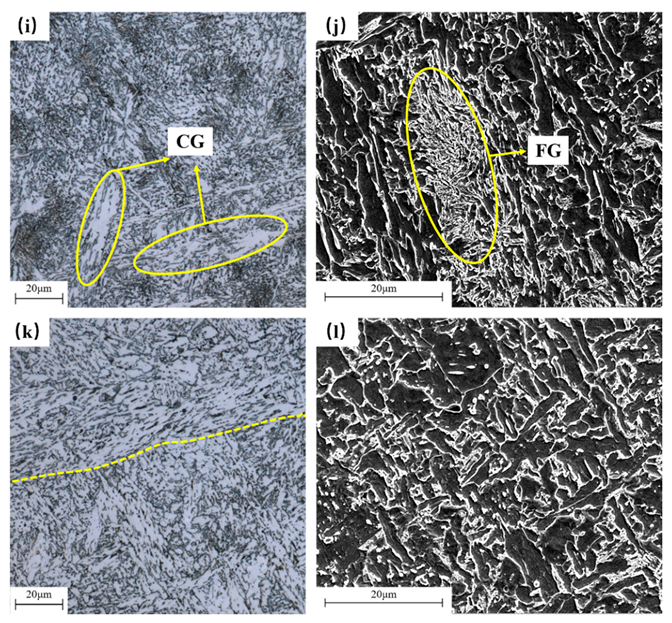
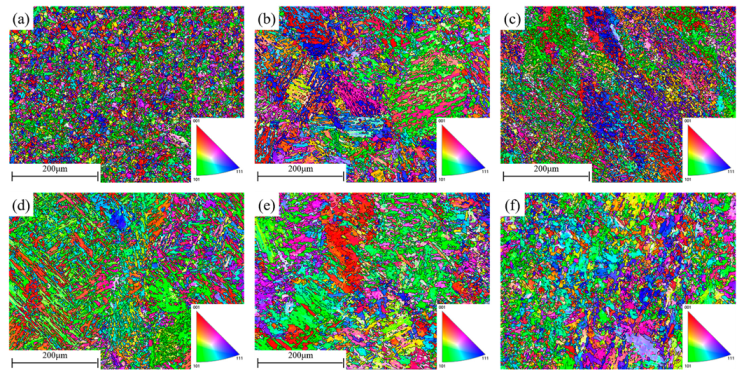
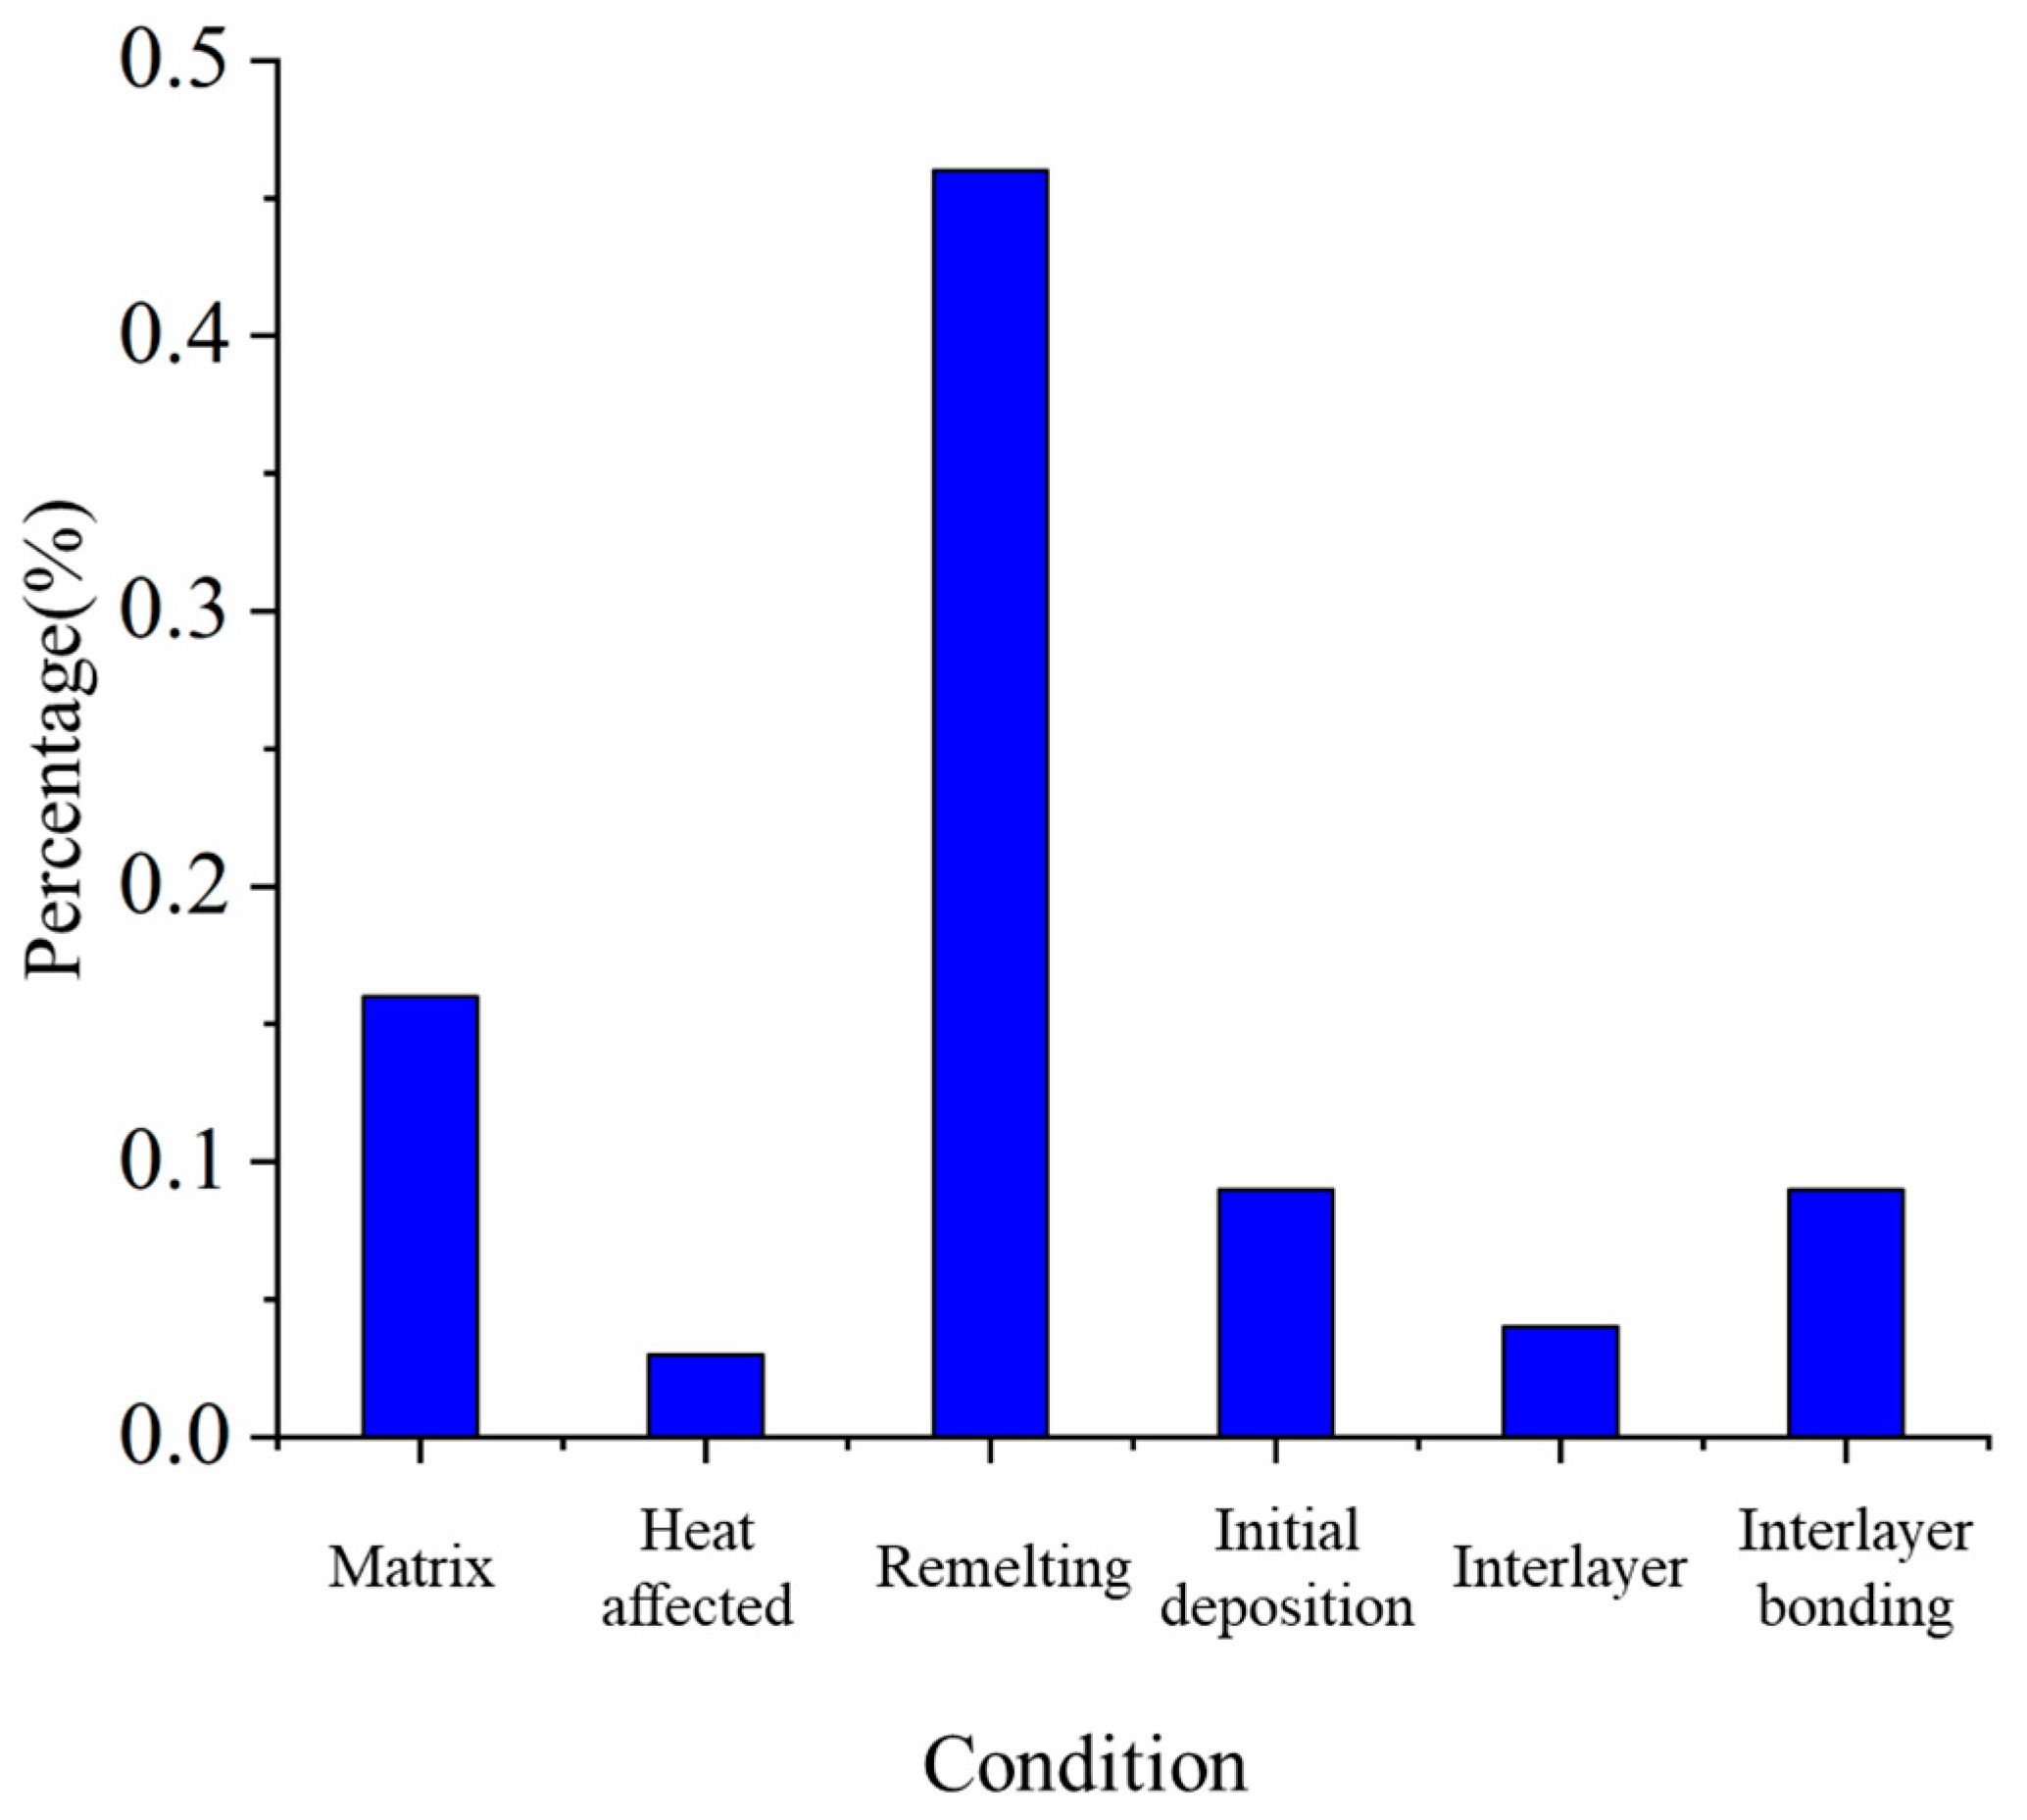
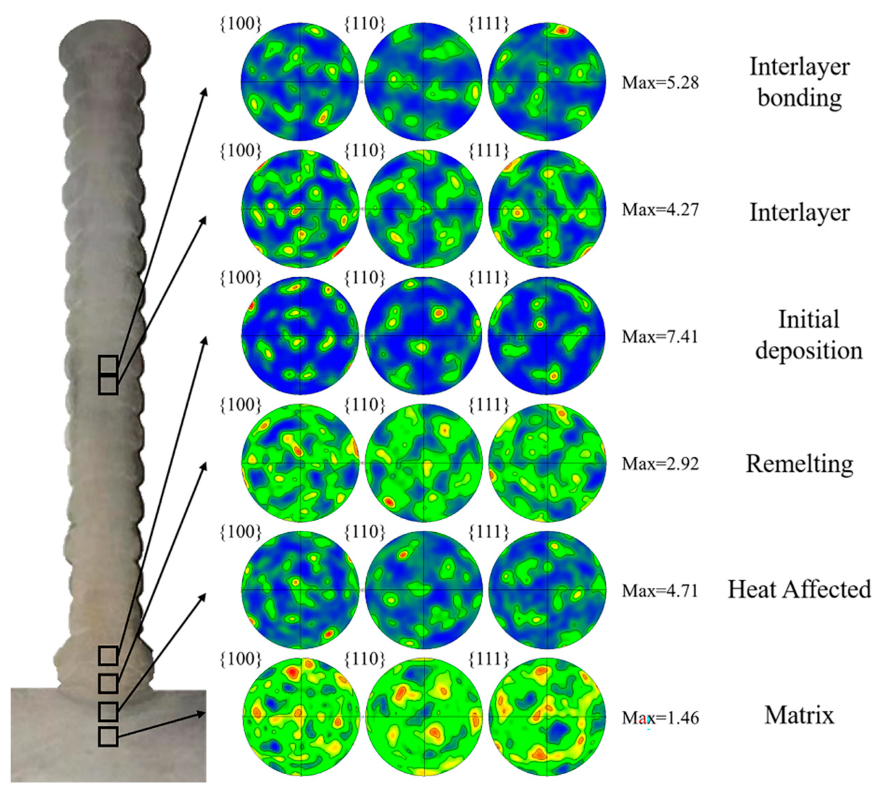
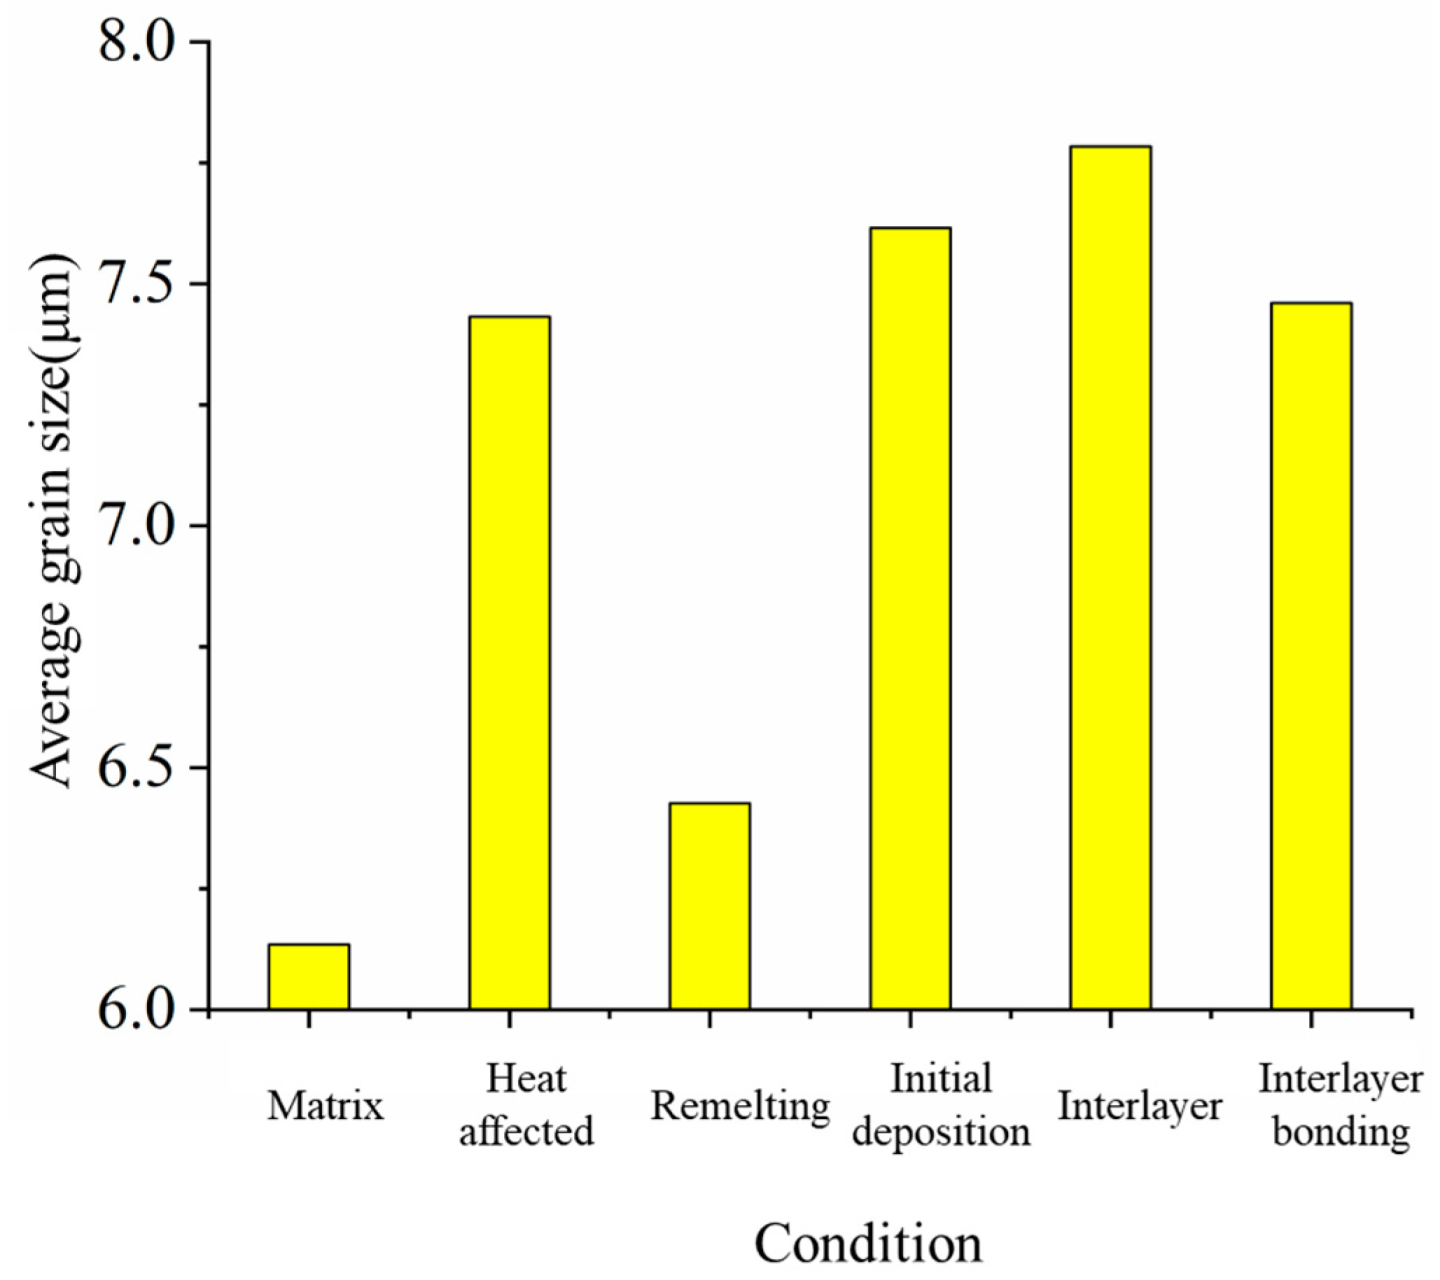
Figure 3 shows the macro-morphologies of the single-layer multi-channel deposition part (10CrNi3MoV) manufactured by cold metal transfer (CMT) arc additive technology. The overall shape was good, and there was no collapse, small spatter, no solidified metal particles produced by welding wire spatter, and no obvious inclusions and pores in the section. There was obvious delamination after slight corrosion, the measured width was about 14 mm, and the calculated layer height was about 2.1 mm.

3.2. Microstructure

The whole heating process is the main reason for the microstructure evolution of the formed part in the deposition process [30]. Yangyang Lei et al. [31] established a three-dimensional transient model to investigate the law that the maximum temperature gradient of the molten pool gradually stabilized after the deposition of the fourth layer. According to the characteristics of the heating process in the wire arc additive manufacturing, the microstructure was divided into six zones, namely matrix, heat affected zone, remelting zone, initial deposition zone, deposition stable zone, interlayer zone, and interlayer bonding zone. The metallographic micrograph is shown in Figure 4.

3.2.1. Matrix

The matrix is 10CrNi3MoV, which is a low-alloy quenched and tempered steel. Figure 5a shows the metallographic microstructure, and Figure 5b shows the SEM microstructure morphology. The matrix was low alloy tempered steel, and the microstructure was basically tempered sorbite (the mixture of ferrite and granular carbide). EBSD analysis showed that there was no obvious grain orientation in the microstructure, but a lot of deformed structures in the structure, as shown in Figure 6a and Figure 7a.

3.2.2. Heat-Affected Zone

Figure 5c,d shows the microstructure of the heat-affected zone, which was mainly composed of coarse lath martensite (M) and a small amount of acicular and massive ferrite. The grain size of the original austenite was larger than that of the base metal, as shown in Figure 5c. The solid phase transformation occurred in the heat-affected zone during the welding process, the microstructure changed from tempered sorbite to lath martensite and was accompanied by overheating effect, leading to the growth of the grain. The black blocks were ferrite and the bright strips were lath martensite in Figure 5d, which further indicated that the heat-affected zone was mainly composed of coarse lath martensite and a small amount of ferrite. EBSD analysis showed that the grain size in the heat-affected zone increased significantly, the grain orientation in some zones is mainly (101), and the number and size of substructures increased significantly, as shown in Figure 6b and Figure 7b.

3.2.3. Remelting Zone

Figure 5e,f shows the microstructure of the remelting zone. The remelting zone melted under the influence of welding heat input in the deposition process. During the air-cooling process, the large cooling rate led to the large undercooling degree, which promoted the rapid transformation of the liquid gold in the molten pool into a fine martensite structure. The remelting zone was a semi-fusion zone between the matrix and the deposited layer. The cooling rate near the matrix was fast, while the cooling rate near the deposited layer was slow. The initial martensite structure was partially transformed into granular bainite (B) under the influence of subsequent thermal cycles, resulting in the relatively uneven grain distribution in the zone. The grain size of the original austenite was smaller than that of the heat-affected zone, as shown in Figure 5e. In Figure 5f, the bright color strips were lath martensite, the black was ferrite, and the bright white particles were retained austenite (RA) and carbide. The EBSD statistical results of the retained austenite content in different zones are shown in Figure 8, which showed that the retained austenite content in the remelting zone was the most than that in other zones, which was consistent with the microscopic observation. EBSD analysis showed that the average grain size of the remelting zone was close to that of the base metal, which was significantly smaller than that of the heat-affected zone, and the grain orientation was mainly (111). Compared with the heat-affected zone, the number of deformed structures increased significantly, while the number and size of substructures decreased, as shown in Figure 6c and Figure 7c.

3.2.4. Initial Deposition Zone

Figure 5g,h shows the microstructure of the initial deposition zone, which was mainly composed of acicular (acicular ferrite, AF) and massive ferrite (granular ferrite, GF), and granular bainite. There was obvious element segregation in the initial deposition zone, which was mainly due to the non-equilibrium solidification of the molten pool. The initial deposition layer was close to the matrix, the cooling rate was very fast, the temperature gradient was large, and a certain degree of component overcooling was formed. The solute was continuously discharged to the side sub-grain boundaries during the grain growth process, and the solid phase diffusion was limited after solidification, which eventually led to the high content of alloying elements in some zones. Acicular ferrite had a certain orientation, as shown in Figure 5g. In Figure 5h, the black lumps were ferrite and the strips of the acicular ferrite, and there were no defects (such as cracks and holes). EBSD analysis showed that the grain orientation of the initial deposition zone was mainly in the direction of (101), and the grain size was not uniform. There was a consistent grain growth direction in some zones caused by the consistent heat dissipation direction, which was consistent with the results obtained from the metallographic structure. Compared with the heat-affected zone, the average grain size of the initial deposition zone was coarser and uneven, and the number and size of the deformed structures increased significantly, as shown in Figure 6d and Figure 7d.

3.2.5. Interlayer Zone

Figure 5i,j shows the microstructure of the interlayer zone. Under the influence of the reciprocating deposition, the coarse-grained (CG) and fine-grained (FG) zones appeared in the interlayer zone, and the microstructure was mainly acicular ferrite, lath ferrite and granular bainite. The inhomogeneous distribution of the microstructure in the interlayer may be due to the inhomogeneous diffusion of the atoms during the cooling and solidification. In Figure 5j, the black block was ferrite and the strip was lath ferrite. EBSD analysis showed that the grain orientation in the interlaminar zone was more uniform, but the average grain size was larger than that in the initial deposition zone, while the number of recrystallization and substructure had no obvious change, as shown in Figure 6e and Figure 8e.

3.2.6. Interlayer Bonding Zone
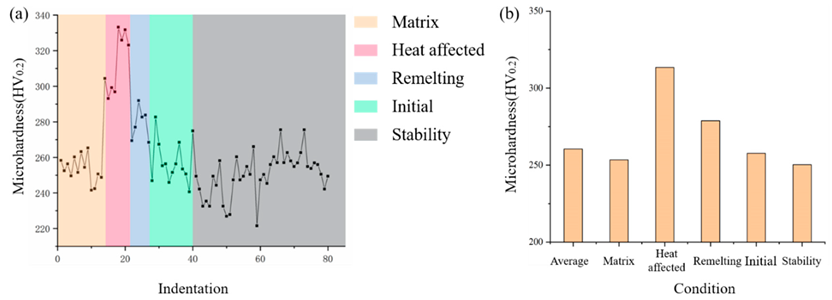
Figure 5k,l shows the microstructure of the interlayer bonding zone. There was a boundary of microstructure in the metallographic diagram, and the basic structure was ferrite and bainite, as shown in Figure 5k. The strip was ferrite in Figure 5l. EBSD analysis shows that the grain orientation of the interlayer bonding zone was more uniform. In addition, the grain size of the interlayer bonding zone was smaller and more homogenized than that of the interlayer zone and the initial deposition zone, while the number of recrystallization and substructure had no obvious change, as shown in Figure 6f and Figure 7f.
Figure 9 shows the pole diagram of different positions, which is helpful to further study the internal relationship between organizations. The maximum density of the initial disposition zone was 7.41, the stable deposited zone was 4.27, and the interlayer bonding zone was 5.28. Compared with the matrix, heat-affected zone and remelting zone, the texture in the initial deposition zone was more obvious. With the increase of the deposition layers, the grain distribution became more uniform, and the texture phenomenon gradually weakened. The texture in the interlayer bonding zone was slightly higher than that in the deposition stable zone. Figure 10 shows the statistical results of the grain size in different zones. The average grain size first increased and then decreased from the matrix to the heat-affected zone and then to the remelting zone. The maximum average grain size in the heat-affected zone was about 7.4 μm, the minimum average grain size of the quenched and tempered steel matrix was about 6.15 μm, and the average grain size of the remelting zone was between the two. The average grain size of the interlayer was about 7.8 μm, the minimum interlayer bonding zone was about 7.5 μm, and the average grain size of the initial deposition zone was between the two. The interlayer bonding zone was equivalent to the “remelting zone” in the deposition process of each layer, and the cooling rate of the interlayer bonding zone was faster than that of the interlayer bonding zone, resulting in the decrease of the grain size in the zone.

3.3. Micro-Hardness

The microhardness distribution from the matrix to the deposition layer is shown in Figure 11a, and the average value of the microhardness in different zones is shown in Figure 11b. The overall hardness of the matrix was roughly 241.5–265.3 HV0.2, with an average of 253.4 HV0.2. The fluctuation of the matrix microhardness was small, which indicated that the microstructure of the matrix was more uniform than that of other parts. The overall hardness of the heat-affected zone increased significantly, with an average value of 313 HV0.2, which was due to a large amount of martensite structure produced by the heat-affected zone. The average hardness of the remelting zone was 278.8 HV0.2, the initial deposition zone was 257.7 HV0.2, and the hardness of the remelting zone was increased by about 8%. According to Section 3.2, due to the remelted zone cools faster than the deposition layer, there was some martensite that did not completely undergo phase transformation, which improved the hardness of the remelted zone to some extent. The average hardness value of the deposition stability zone is 250.3 HV0.2, which was equivalent to that of the initial deposition zone, and the hardness change of the deposition layer was 221–282 HV0.2. There was a periodically changing structure after deposition between the interlayer zone and interlayer bonding zone, and the obvious delamination can also be observed from the macroscopic section, which led to the uneven hardness values. Meanwhile, it can be seen from Figure 5g,i,k that the microhardness of the deposited layer fluctuated greatly which was ascribed to the texture phenomenon and obvious micro-segregation. The change of the microhardness was related to the thermal cycle and cooling rate of different parts, and the microhardness of different positions was affected by the heating of the previous layer [32].

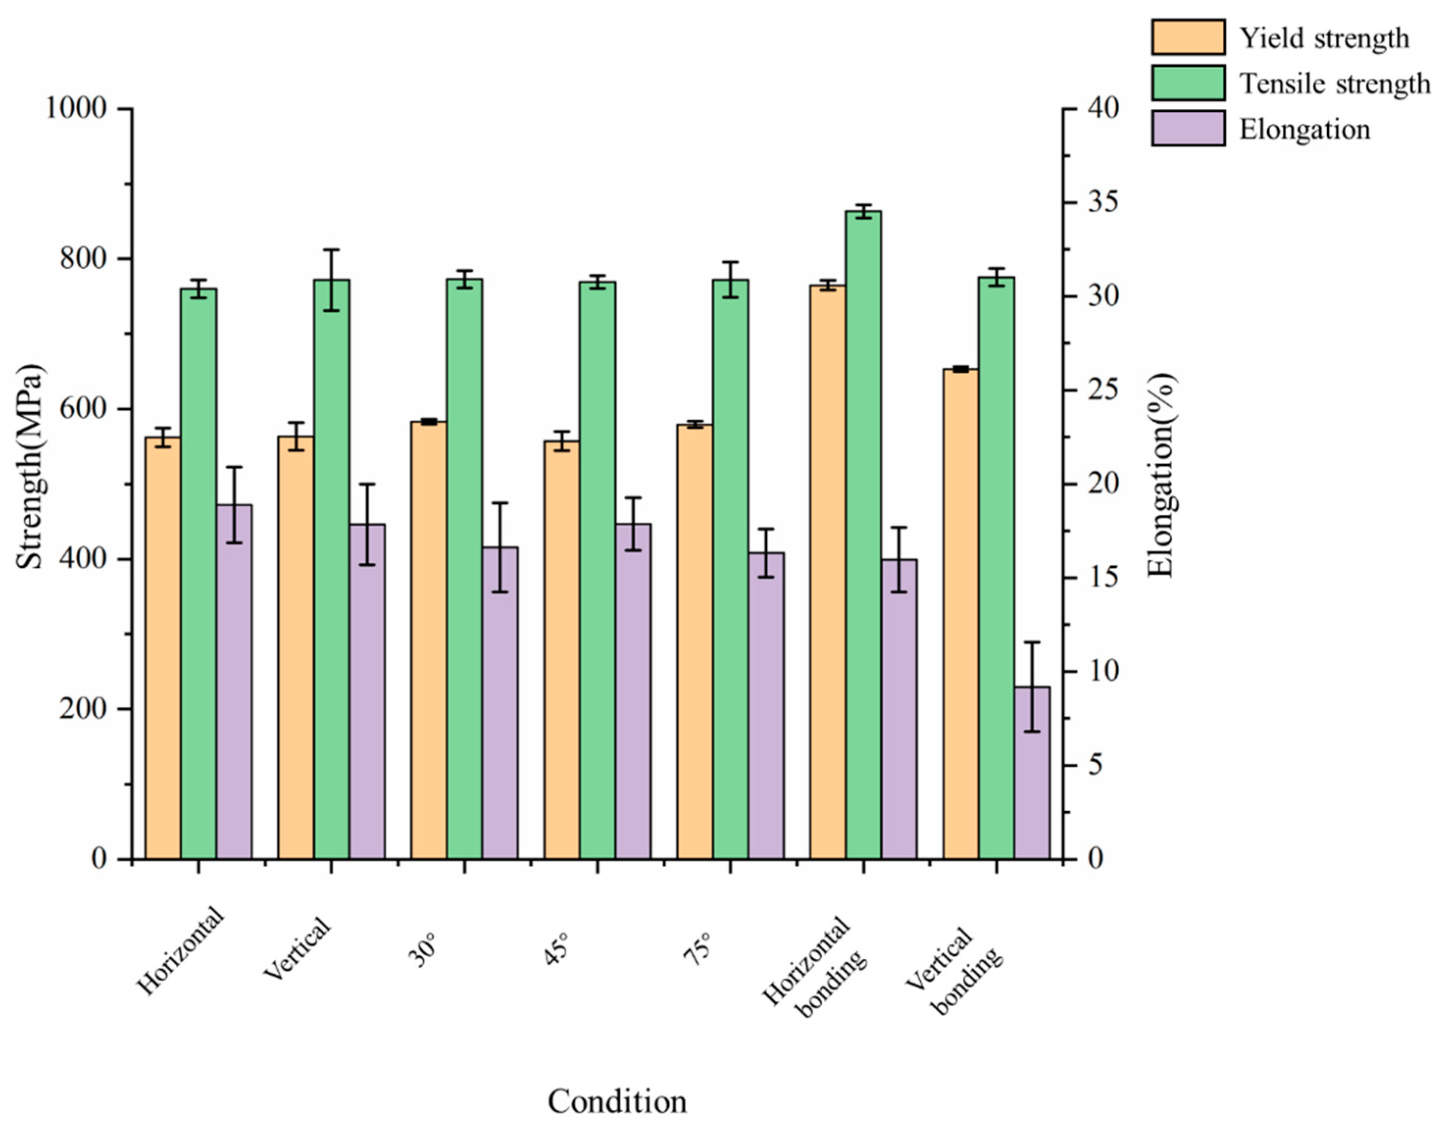
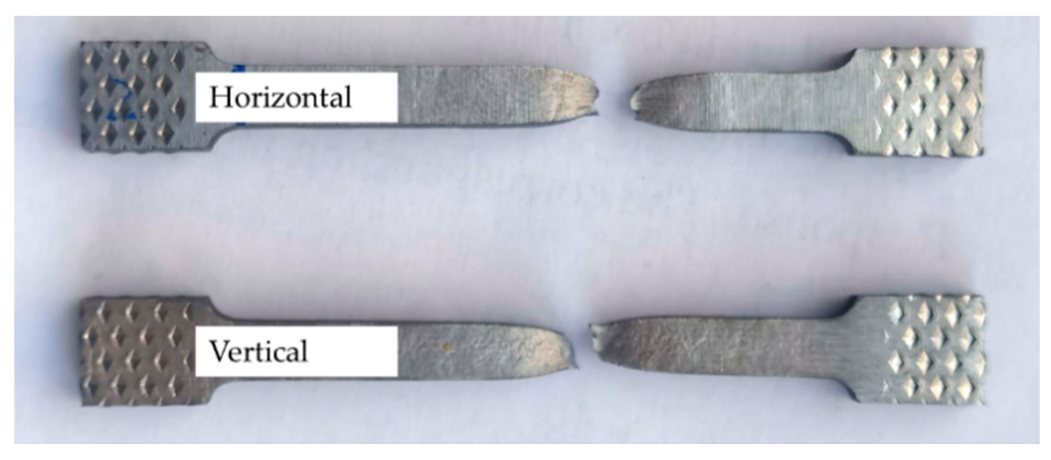
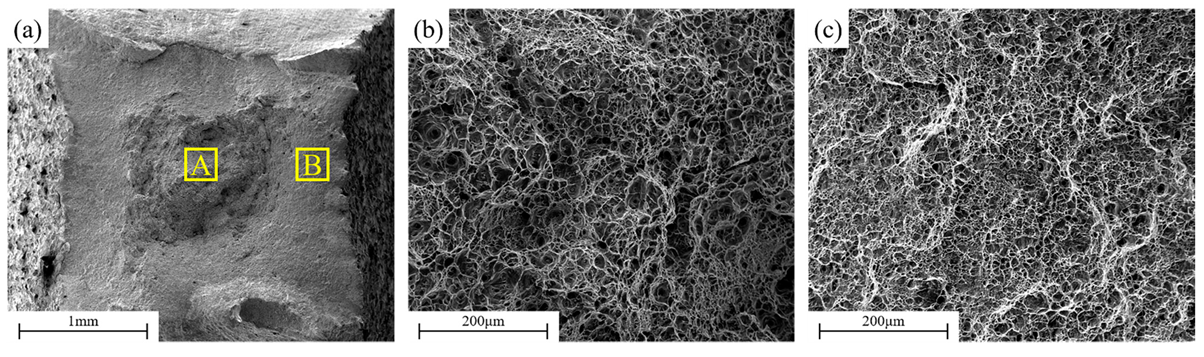
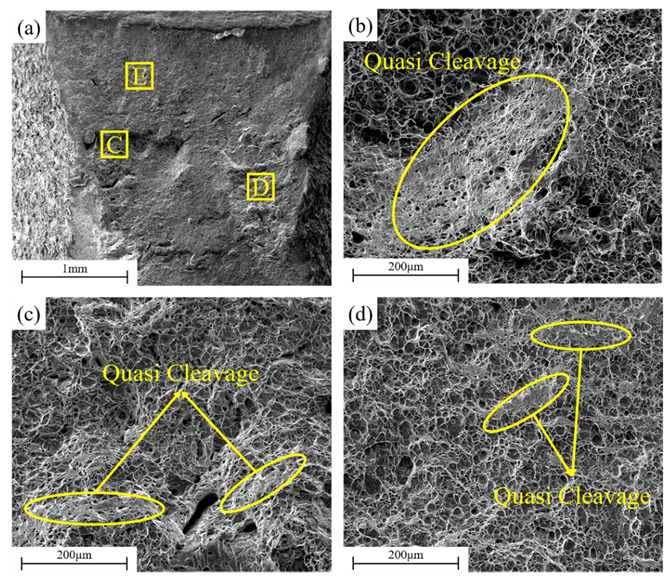
3.4. Tensile Properties and Fracture Surfaces

Figure 12 shows the tensile test results in different orientations. The yield strength and tensile strength in the horizontal position and the vertical position were basically the same, and there were no obvious anisotropic characteristics in the formed part. The yield strength reached 560 MPa, which was 94.9% of the minimum standard of the welding wire, and 81.4% of the matrix. The tensile strength reached 760 MPa, which exceeded the minimum standard of the welding wire (655 MPa) and reached 94.8% of the matrix. The yield strength of the sample in the directions of 30°, 45°, and 75° was more than 550 MPa, the tensile strength was more than 760 MPa. The overall yield strength was more than 93.2% of the minimum standard of the welding wire and reached more than 79.9% of the matrix, the tensile strength was more than the minimum standard of the welding wire and reached 94.8% of the matrix, which indicated that the overall tensile performance of the formed part was excellent. The average elongation of the deposition layer in different directions was 17.5%, which was 89.7% of that of the matrix, reaching the lowest level of that of the welding wire. Based on Section 3.2, the deposition was relatively dense as a whole which was composed of ferrite and bainite, and there was no apparent porosity, inclusions, and other defects. The matrix was modulated steel, which was mainly composed of sorbite. The strength of the deposited layer was lower than that of the matrix, and there was obvious element segregation, resulting in the uneven structure of the deposited layer, which reduced the strength and toughness. This was basically consistent with the microstructure.
The yield strength and tensile strength of the bonding part between the deposition layer and the matrix in the vertical direction were 653.2 MPa and 775.5 MPa, respectively. The tensile strength was equivalent to that of the deposition layer, and the yield strength was higher than that of the deposition layer. The elongation in the vertical direction was low, only about 9% on average, and the toughness was relatively low. The yield strength and tensile strength of the horizontal joint were 764.8 MPa and 863.3 MPa, which was slightly higher than that of the matrix. The elongation after fracture was more than 16%, and the toughness was relatively good. The texture changed greatly from the heat-affected zone to remelting zone and initial deposition zone, resulting in the vertical and horizontal anisotropy of the part. The relationship between hardness and strength is proportional, and the greater the strength is, the greater the hardness generally is. As can be seen from Section 3.4, the microhardness of this zone was obviously higher than that of other zones, and the measured strength was correspondingly higher, indicating that the results of the two were in good agreement. At the same time, the texture phenomenon gradually weakened with the increase of the deposition layers, the tensile sample was basically above the deposition layer, and the anisotropy phenomenon was not obvious, which indicated that the measured values were consistent with the EBSD analysis results.
The fracture morphologies of the horizontal and vertical specimens are shown in Figure 13, Figure 14 and Figure 15, and Figure 13 shows the fracture sample. There were obvious divisions in the horizontal fracture, as shown in Figure 14a. The enlarged zone A showed an obvious ductile fracture morphology with relatively uniform equiaxed dimples, as shown in Figure 14b. Zone B also showed a ductile fracture morphology, but the dimples were relatively shallower than zone A, as shown in Figure 14c, indicating that the central position of the sample had better toughness. There were three obvious characteristic zones in the vertical fracture, as shown in Figure 15a. In addition to ductile fracture, zone C also had the characteristics of the quasi-cleavage fracture, as shown in Figure 15b. The two zones D and E had the characteristics of the quasi-cleavage fracture. Zone D and E were smaller than that of C, and both showed higher ductility. In addition, there were large long strips of deep dimples in zone D, which were characterized by mixed fractures of dimples and sporadic quasi-cleavage, as shown in Figure 15c,d. The results showed that the toughness of the horizontal direction was better than that of the vertical direction, which was consistent with the test results of the tensile experiment.

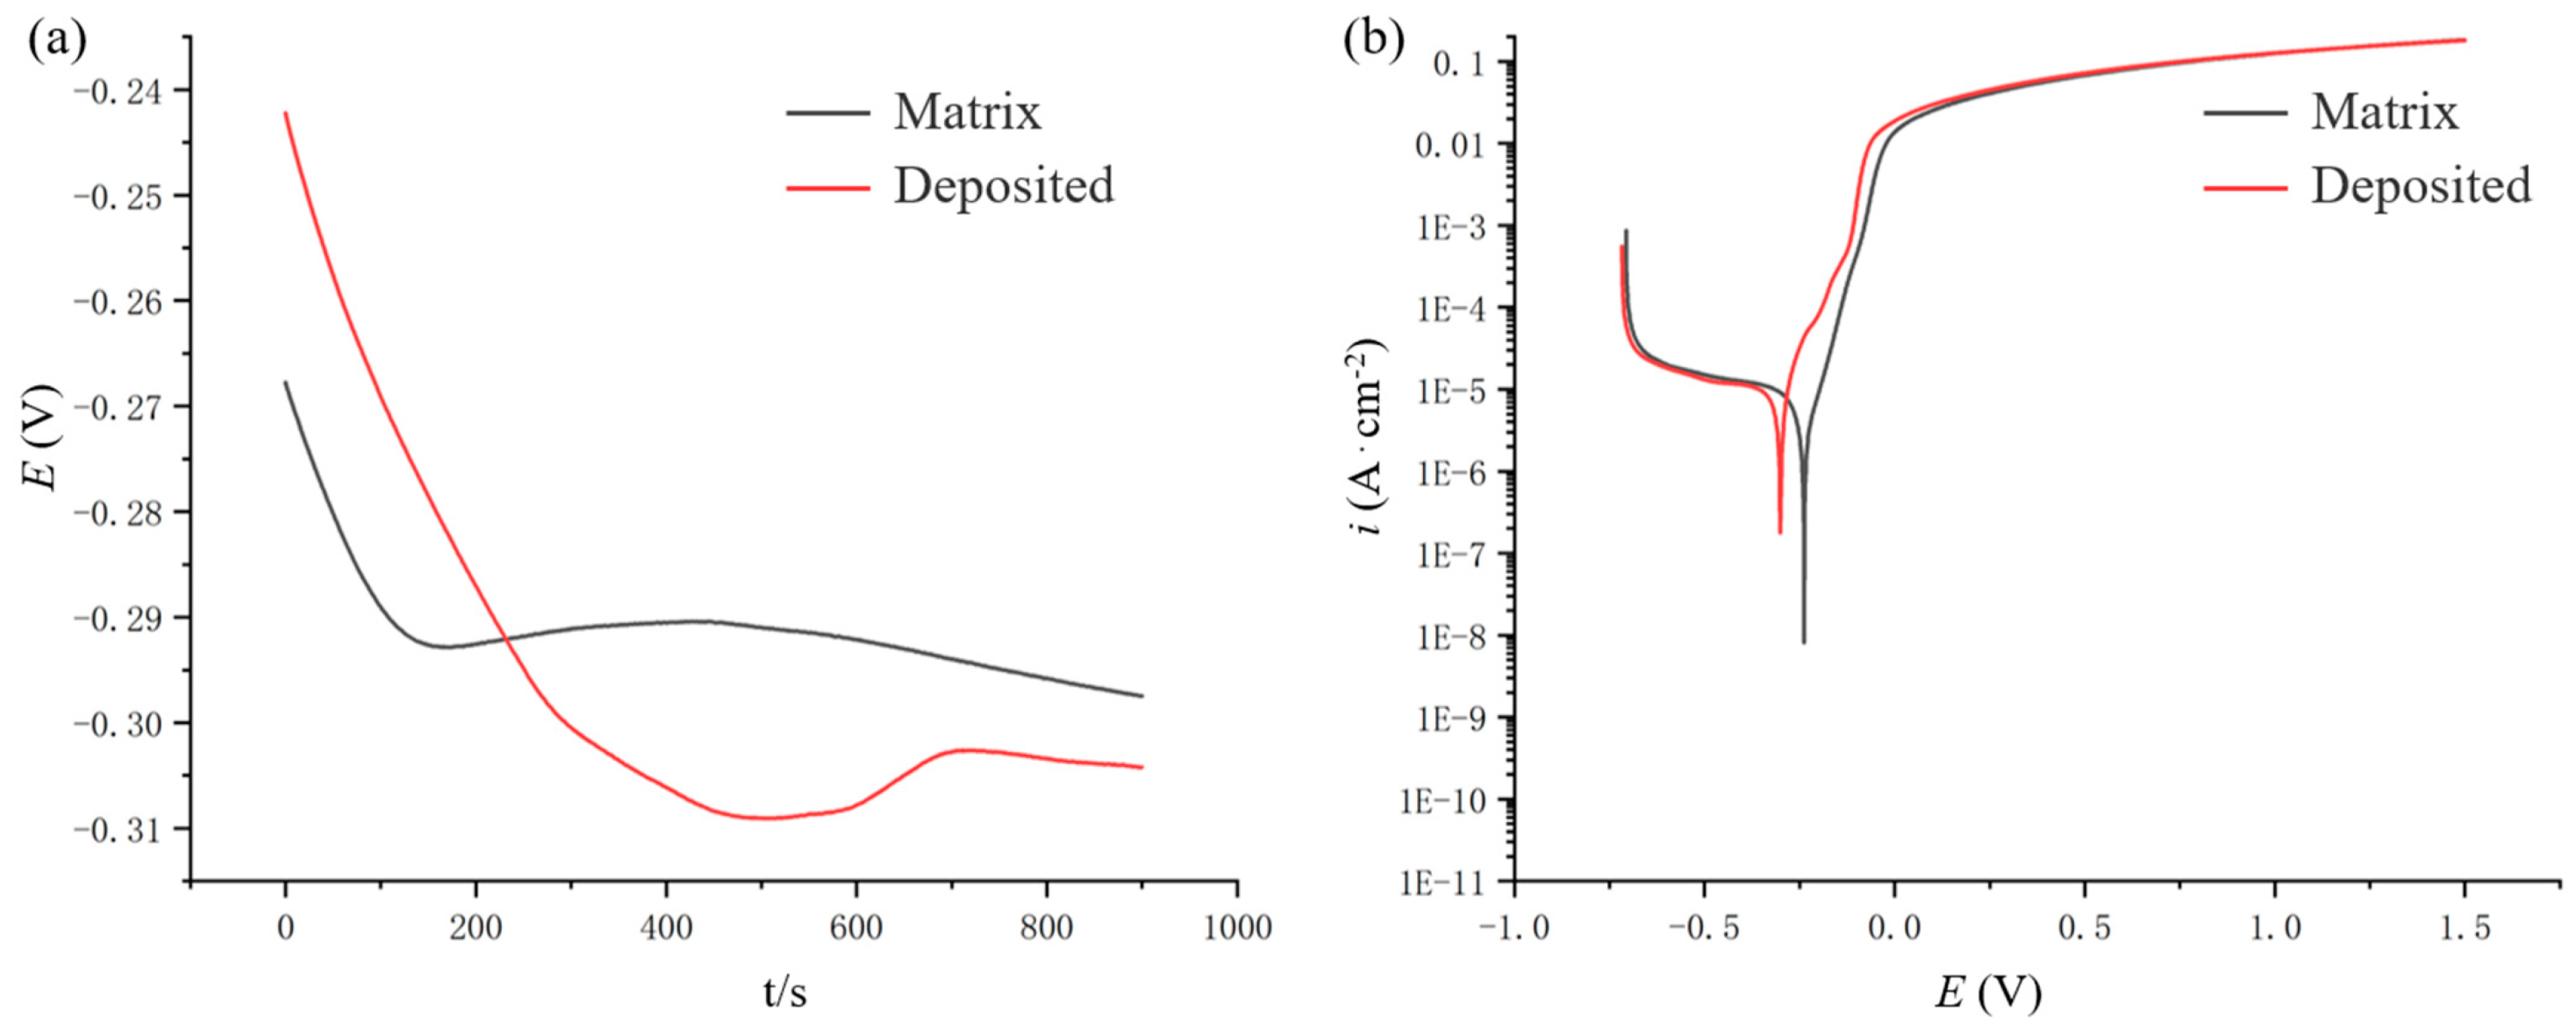
3.5. Corrosion Properties

10CrNi3MoV is a kind of marine steel, and the research on the corrosion characteristics of its formed parts is very important. Compared with the mechanical properties, the corrosion performance largely determines the service life of the parts in the humid and high salt spray environment. WAAM has a unique microstructure, including the type, size and morphology of the constituent phases, and the corrosion mechanism was different from additive manufacturing based on other heat sources [33]. The corrosion characteristics of WAAM parts were studied by immersing the bonding part between the matrix and the deposition layer was immersed in 3.5% NaCl solution. Figure 16 shows the galvanic corrosion after immersing for 1 h, and there was an obvious corrosion phenomenon on one side of the deposition layer. The results of the optical microscope observation are shown in Figure 16b. There were a lot of pitting corrosion pits on the surface, and the overall corrosion was more serious, while only a small amount of pitting corrosion appeared on the matrix, as shown in Figure 16d. As shown in Figure 17, the galvanic corrosion was more obvious after 12 h of immersion, many oxides and pitting corrosion were produced in the deposited layer, while only a small amount of pitting corrosion was produced in the matrix. The direct cause of this phenomenon was related to the corrosion potential of the matrix and the deposited layer. The high heat input and uneven microstructure in the process of arc additive deposition resulted in the lower corrosion performance of the deposited layer than that of the matrix.
The electrochemical properties of the matrix and the deposited layer were measured to further analyze the phenomenon of galvanic corrosion, as shown in Figure 18 and Table 4. The open circuit potential of the matrix was slightly higher than that of the deposited layer by 0.07 V, the corrosion potential of the matrix was higher than that of the deposited layer by 0.08 V, and the corrosion current density of the matrix was lower than that of the deposited layer by 1.99 × 10⁻⁶ A·cm−2. When the matrix and deposited layer were in the same corrosion medium, the corrosion potential of the matrix was lower than that of the deposited layer, which formed a certain potential difference and produced a galvanic corrosion effect. The deposited layer worked as an anode, matrix served as a cathode, the corrosion rate of the anode was higher than that of the cathode. Therefore, the corrosion of the deposition layer was more serious in the same condition. In addition, Ralaton [34] and Birbilis [35] found that grain refinement was positively correlated with the decrease of corrosion current density. As shown in Figure 10, the grain size of the deposition layer was larger than that of the matrix. The density of the grain boundary increased with the grain refinement, the transfer speed of metal ions became slower and the corrosion current density decreased under the action of corrosion passivation, indicating that the corrosion resistance of the matrix was higher than that of the deposited layer. At the same time, the matrix was forged and modulated, the overall structure was more uniform and contained few impurities, while the microstructure of the deposited parts presented many needle-like lamellar structures and element segregations, which was more uneven than the equiaxed grains of the matrix. In combination with Section 3.2, there were different phases in the deposited layer, and the corrosion potential between phases was different to some extent. Therefore, micro-galvanic corrosion occurred between different phases in the corrosive environment, thus accelerating the corrosion rate, thus reducing its corrosion resistance. Many studies showed that the corrosion resistance of the WAAM parts was mainly affected by uneven forming, internal defects and element segregation, and the corrosion resistance was lower than that of similar forgings [36,37,38].

4. Conclusions

In this paper, 10CrNi3MoV parts were fabricated by WAAM based on CMT. The microstructure and mechanical properties of the single-layer multi-channel deposition parts were analyzed, and the galvanic corrosion was investigated. The conclusions are as follows.
1. The 10CrNi3MoV deposit prepared by WAAM was well-formed without collapse. The formed part was divided into six zones by the section observation, namely matrix zone, heat-affected zone, remelting zone, initial deposition zone, interlayer zone and interlayer bonding zone. The microstructure of different zones was obviously different. The matrix was mainly tempered sorbite, the heat-affected zone was mainly lath martensite, the remelting zone was mainly lath martensite, granular bainite and ferrite. The initial deposition zone, interlayer zone and interlayer bonding zone were all ferrite and granular bainite, but there were differences in distribution and morphology. In addition, there were obvious coarse grain and fine grain zones in the interlayer zone and the boundary in the interlayer bonding zone. EBSD analysis showed that the recrystallization and number of substructures had no obvious change, and the texture phenomenon in the initial deposition zone was the most obvious. With the increase of the deposition layers, the texture phenomenon gradually weakened and the average grain size increased in turn: matrix zone, remelting zone, heat-affected zone, interlayer bonding zone, initial deposition zone and interlayer zone.
2. The mechanical properties of the 10CrNi3MoV deposited parts were tested. The hardness of the matrix changed smoothly, and the hardness of the heat-affected zone was the largest. The hardness of the deposited layer was between 221–282 HV0.2. The tensile test of different zones showed that the mechanical properties of the formed parts were good, the yield strength was above 550 MPa, and the tensile strength was above 760 MPa. The observation of the horizontal and vertical fracture showed that the fracture mode was mainly a ductile fracture, and there were scattered quasi cleavage fracture zones in the vertical direction.
3. The results showed that the corrosion performance of the deposited parts was lower than that of the matrix, the corrosion potential of the matrix was higher than that of the deposited layer by 0.08 V, and the corrosion current density of the matrix was lower than that of the deposited layer by 1.99 × 10⁻⁶ A⋅cm−2.

Author Contributions

Conceptualization: S.Z. and X.W.; data curation: Y.Z. and Z.R.; formal analysis: G.T. and W.W.; funding acquisition: G.H. and Z.R.; investigation: G.T.; methodology: G.T. and X.W.; project administration: Q.C. and S.Z.; resources: W.W. and X.W.; supervision: X.W., W.W. and G.H.; writing—original draft: G.T. All authors have read and agreed to the published version of the manuscript.

Funding

This work was supported by the National Key R&D Program of China (No. 2018YFB1105800).

Data Availability Statement

Not applicable.

Conflicts of Interest

The authors declare no conflict of interest.

References

  1. Ojo, O.O.; Taban, E. Microstructure, Mechanical and Corrosion Behavior of Additively Manufactured Steel: A Review (Part 1). Mater. Test. 2020, 62, 503–516. [Google Scholar] [CrossRef]
  2. Liu, J.; Xu, Y.; Ge, Y.; Hou, Z.; Chen, S. Wire and arc additive manufacturing of metal components: A review of recent research developments. Int. J. Adv. Manuf. Technol. 2020, 111, 149–198. [Google Scholar] [CrossRef]
  3. Li, J.L.Z.; Alkahari, M.R.; Rosli, N.A.B.; Hasan, R.; Sudin, M.N.; Ramli, F.R. Review of Wire Arc Additive Manufacturing for 3D Metal Printing. Int. J. Autom. Technol. 2019, 13, 346–353. [Google Scholar] [CrossRef]
  4. Chaudhary, V.; Yadav, N.M.S.K.K.; Mantri, S.A.; Dasari, S.; Jagetia, A.; Ramanujan, R.V.; Banerjee, R. Additive manufacturing of functionally graded Co–Fe and Ni–Fe magnetic materials. J. Alloy. Compd. 2020, 823, 153817. [Google Scholar] [CrossRef]
  5. Anant Pidge, P.; Kumar, H. Additive manufacturing: A review on 3 D printing of metals and study of residual stress, buckling load capacity of strut members. Mater. Today Proc. 2020, 21, 1689–1694. [Google Scholar] [CrossRef]
  6. Victoria, A.; Marina, N. The Additive Manufacturing Landscape 2020-Key Insights and Trends into the Additive Manufacturing Market. 2020. Available online: www.amfg.ai (accessed on 1 August 2021).
  7. Wang, Y.; Chen, X.; Konovalov, S.V. Additive Manufacturing Based on Welding Arc: A low-Cost Method. J. Surf. Investig. X-ray Synchrotron Neutron Tech. 2018, 11, 1317–1328. [Google Scholar] [CrossRef]
  8. Thapliyal, S. Challenges associated with the wire arc additive manufacturing (WAAM) of aluminum alloys. Mater. Res. Express 2019, 6, 112006. [Google Scholar] [CrossRef]
  9. Gradl, P.R.; Protz, C.S. Technology advancements for channel wall nozzle manufacturing in liquid rocket engines. Acta Astronaut. 2020, 174, 148–158. [Google Scholar] [CrossRef]
  10. Li, Y.; Qin, X.; Wu, Q.; Hu, Z.; Shao, T. Fabrication of curved overhanging thin-walled structure with robotic wire and arc additive manufacturing (RWAAM). Ind. Robot Int. J. Robot. Res. Appl. 2019, 47, 102–110. [Google Scholar] [CrossRef]
  11. Oropeza, D.; Hofmann, D.C.; Williams, K.; Firdosy, S.; Bordeenithikasem, P.; Sokoluk, M.; Liese, M.; Liu, J.K.; Li, X.C. Welding and additive manufacturing with nanoparticle-enhanced aluminum 7075 wire. J. Alloy. Compd. 2020, 834, 8. [Google Scholar] [CrossRef]
  12. He, T.; Yu, S.; Shi, Y.; Huang, A. Forming and mechanical properties of wire arc additive manufacture for marine propeller bracket. J. Manuf. Process. 2020, 52, 96–105. [Google Scholar] [CrossRef]
  13. Nemani, A.V.; Ghaffari, M.; Nasiri, A. Comparison of microstructural characteristics and mechanical properties of shipbuilding steel plates fabricated by conventional rolling versus wire arc additive manufacturing. Addit. Manuf. 2020, 32, 101086. [Google Scholar]
  14. Tasdemir, A.; Nohut, S. An overview of wire arc additive manufacturing (WAAM) in shipbuilding industry. Ships Offshore Struct. 2020, 1–18. [Google Scholar] [CrossRef]
  15. Vimal, K.E.K.; Naveen Srinivas, M.; Rajak, S. Wire arc additive manufacturing of aluminium alloys: A review. Mater. Today Proc. 2020, 41, 1139–1145. [Google Scholar] [CrossRef]
  16. Dirisu, P.; Supriyo, G.; Martina, F.; Xu, X.; Williams, S. Wire plus arc additive manufactured functional steel surfaces enhanced by rolling. Int. J. Fatigue 2020, 130, 105237. [Google Scholar] [CrossRef]
  17. Ge, J.; Lin, J.; Chen, Y.; Lei, Y.; Fu, H. Characterization of wire arc additive manufacturing 2Cr13 part: Process stability, microstructural evolution, and tensile properties. J. Alloy. Compd. 2018, 748, 911–921. [Google Scholar] [CrossRef]
  18. Davis, A.E.; Breheny, C.I.; Fellowes, J.; Nwankpa, U.; Martina, F.; Ding, J.; Machry, T.; Prangnell, P.B. Mechanical performance and microstructural characterisation of titanium alloy-alloy composites built by wire-arc additive manufacture. Mater. Sci. Eng. A 2019, 765, 138289. [Google Scholar] [CrossRef]
  19. Caballero, A.; Ding, J.; Ganguly, S.; Williams, S. Wire + Arc Additive Manufacture of 17-4 PH stainless steel: Effect of different processing conditions on microstructure, hardness, and tensile strength. J. Mater. Process. Technol. 2019, 268, 54–62. [Google Scholar] [CrossRef]
  20. He, Z.; Hu, Y.; Qu, H.T. Research on Anisotropy of Titanium Alloy Manufactured by Ultrasonic Impact Treatment and Wire and Arc Additive Manufacture. Aerospace Manuf. Technol. 2016, 11–16, 1674–5108. [Google Scholar]
  21. Jin, W.W.; Zhang, C.Q.; Jin, S.Y.; Tian, Y.T.; Wellmann, D.; Liu, W. Wire Arc Additive Manufacturing of Stainless Steels: A Review. Appl. Sci. 2020, 10, 1563. [Google Scholar] [CrossRef] [Green Version]
  22. Dai, Y.-l.; Yu, S.-f.; Huang, A.-g.; Shi, Y.-s. Microstructure and mechanical properties of high-strength low alloy steel by wire and arc additive manufacturing. Int. J. Miner. Metall. Mater. 2020, 27, 933–942. [Google Scholar] [CrossRef]
  23. Bhujangrao, T.; Veiga, F.; Suarez, A.; Iriondo, E.; Mata, F.G. High-Temperature Mechanical Properties of IN718 Alloy: Comparison of Additive Manufactured and Wrought Samples. Crystals 2020, 10, 689. [Google Scholar] [CrossRef]
  24. Bambach, M.; Sizova, I.; Sydow, B.; Hemes, S.; Meiners, F. Hybrid manufacturing of components from Ti-6Al-4V by metal forming and wire-arc additive manufacturing. J. Mater. Process. Technol. 2020, 282, 8. [Google Scholar] [CrossRef]
  25. Ziółkowski, M.; Dyl, T. Possible Applications of Additive Manufacturing Technologies in Shipbuilding: A Review. Machines 2020, 8, 84. [Google Scholar] [CrossRef]
  26. Chandrasekaran, S.; Hari, S.; Amirthalingam, M. Wire arc additive manufacturing of functionally graded material for marine risers. Mater. Sci. Eng. Struct. Mater. Prop. Microstruct. Process. 2020, 792, 13. [Google Scholar] [CrossRef]
  27. Zhang, S.W.; Wang, Y.D.; Zhu, M.H.; Zhang, Z.J.; Nie, P.L.; Li, Z.G. Relationships among Charpy impact toughness, microstructure and fracture behavior in 10CrNi3MoV steel weld joint. Mater. Lett. 2020, 281, 4. [Google Scholar] [CrossRef]
  28. Ye, C.Q.; Lu, G.Y.; Ni, L.; Liu, Q.S.; Hou, S.; Tong, H.; Yao, Y.Q.; Zhou, J.M. Effects of heat treatment on microstructure and mechanical properties of explosive welded 10CrNi3MoV steel-304L stainless steel. Mater. Lett. 2020, 262, 4. [Google Scholar] [CrossRef]
  29. Peng, K.; Yang, C.L.; Fan, C.L.; Lin, S.B. Thermal processes, microstructure, and mechanical properties near weld toe in double-sided double gas tungsten arc backing welding joint of 10CrNi3MoV steel. Int. J. Adv. Manuf. Technol. 2018, 96, 677–684. [Google Scholar] [CrossRef]
  30. Bourlet, C.; Zimmer-Chevret, S.; Pesci, R.; Bigot, R.; Robineau, A.; Scandella, F. Microstructure and mechanical properties of high strength steel deposits obtained by Wire-Arc Additive Manufacturing. J. Mater. Process. Technol. 2020, 285, 13. [Google Scholar] [CrossRef]
  31. Lei, Y.Y.; Xiong, J.; Li, R. Effect of inter layer idle time on thermal behavior for multi-layer single-pass thin-walled parts in GMAW-based additive manufacturing. Int. J. Adv. Manuf. Technol. 2018, 96, 1355–1365. [Google Scholar] [CrossRef]
  32. Sun, L.; Jiang, F.; Huang, R.; Yuan, D.; Guo, C.; Wang, J. Microstructure and Mechanical Properties of Low-Carbon High-Strength Steel Fabricated by Wire and Arc Additive Manufacturing. Metals 2020, 10, 216. [Google Scholar] [CrossRef] [Green Version]
  33. Yang, J.; Yang, H.; Yu, H.; Wang, Z.; Zeng, X. Corrosion Behavior of Additive Manufactured Ti-6Al-4V Alloy in NaCl Solution. Metall. Mater. Trans. A 2017, 48, 3583–3593. [Google Scholar] [CrossRef]
  34. Ralston, K.D.; Birbilis, N. Effect of Grain Size on Corrosion: A Review. Corrosion 2010, 66, 075005. [Google Scholar] [CrossRef]
  35. Birbilis, N.; Ralston, K.D.; Virtanen, S.; Fraser, H.L.; Davies, C.H.J. Grain character influences on corrosion of ECAPed pure magnesium. Corros. Eng. Sci. Technol. 2010, 45, 224–230. [Google Scholar] [CrossRef]
  36. Wu, B.; Pan, Z.; Li, S.; Cuiuri, D.; Ding, D.; Li, H. The anisotropic corrosion behaviour of wire arc additive manufactured Ti-6Al-4V alloy in 3.5% NaCl solution. Corros. Sci. 2018, 137, 176–183. [Google Scholar] [CrossRef]
  37. Rajesh Kannan, A.; Siva Shanmugam, N.; Rajkumar, V.; Vishnukumar, M. Insight into the microstructural features and corrosion properties of wire arc additive manufactured super duplex stainless steel (ER2594). Mater. Lett. 2020, 270, 127680. [Google Scholar] [CrossRef]
  38. Chen, X.; Li, J.; Cheng, X.; Wang, H.; Huang, Z. Effect of heat treatment on microstructure, mechanical and corrosion properties of austenitic stainless steel 316L using arc additive manufacturing. Mater. Sci. Eng. A 2018, 715, 307–314. [Google Scholar] [CrossRef]
Figure 1. Experimental setup of the CMT-WAAM system used in this study.
Metals 11 01235 g001
Figure 2. Schematic representation of the location and orientation of the tensile test and microstructure and microhardness specimens.
Metals 11 01235 g002
Figure 3. The single-layer multi-channel deposition part: (a) front; (b) flank; (c) profile.
Metals 11 01235 g003
Figure 4. Metallographic micrograph: (a) the junction of the matrix and the deposited part; (b) the matrix; (c) the heat-affected zone; (d) the remelting zone; (e) the initial deposition zone; (f) the deposition stability zone; (g) interlayer zone; (h) interlayer bonding zone.
Metals 11 01235 g004
Figure 5. Microstructure: (a) matrix-OM; (b) matrix-SEM; (c) heat-affected zone-OM; (d) heat-affected zone-SEM; (e) remelting zone-OM; (f) remelting zone-SEM; (g) initial deposition zone-OM; (h) initial deposition zone-SEM; (i) interlayer zone-OM; (j) interlayer zone-SEM; (k) interlayer bonding zone-OM; (l) interlayer bonding zone-SEM.
Metals 11 01235 g005aMetals 11 01235 g005b
Figure 6. IPF X coloring map obtained by EBSD: (a) the matrix; (b) the heat-affected zone; (c) the remelting zone; (d) the initial deposition zone; (e) interlayer zone; (f) interlayer bonding zone.
Metals 11 01235 g006
Figure 7. Recrystallization image obtained by EBSD: (a) the matrix; (b) the heat-affected zone; (c) the remelting zone; (d) the initial deposition zone; (e) interlayer zone; (f) interlayer bonding zone.
Metals 11 01235 g007
Figure 8. Residual austenite content.
Metals 11 01235 g008
Figure 9. Polar diagrams at different positions.
Metals 11 01235 g009
Figure 10. Average grain size.
Metals 11 01235 g010
Figure 11. (a) The microhardness distribution of different samples of 10CrNi3MoV steel arc additive manufacturing; (b) the average value of microhardness in different zones.
Metals 11 01235 g011
Figure 12. Tensile test results of different orientations.
Metals 11 01235 g012
Figure 13. Fracture sample.
Metals 11 01235 g013
Figure 14. Fracture morphology in the horizontal direction: (a) overall morphology; (b) A zone morphology; (c) B zone morphology.
Metals 11 01235 g014
Figure 15. Vertical fracture morphology: (a) overall morphology; (b) C zone morphology; (c) D zone morphology; (d) E zone morphology.
Metals 11 01235 g015
Figure 16. Morphologies after immersing in 3.5% NaCl solution for 1 h: (a) macroscopic image; (b) optical microscope image of the deposited layer; (c) optical microscope image of the junction; (d) optical microscope image of the matrix.
Metals 11 01235 g016
Figure 17. Morphologies after immersing in 3.5% NaCl solution for 12 h: (a) Macroscopic image; (b) Optical microscope image of the deposited layer; (c) Optical microscope image of the junction; (d) Optical microscope image of the matrix.
Metals 11 01235 g017
Figure 18. (a) Open circuit potential (OCP); (b) polarization curve.
Metals 11 01235 g018
Table 1. Chemical composition of the matrix and the wire (weight mass fraction, %).
ElementCSiMnNiCrMoVSP
Matrix0.0810.300.453.811.020.400.0750.0058<0.005
Wire0.0530.711.832.17-0.36-0.0034<0.005
Table 2. Mechanical properties of matrix and wire.
Mechanical PropertiesYield Strength (MPa)Tensile Strength (MPa)Elongation%
Matrix68880219.5
Wire590–745≥655≥16
Table 3. Process parameters.
Parameters.Wire Feed Speed/(m/min)Travel Speed/(mm/s)Layer Cooling Temperature/°CShielding GasShielded Gas Velocity/(L/min)Arc Length CorrectionImpulse Correction
Value4.52Room temperatureAr+2.5%CO215−5%−1.5
Table 4. The electrochemical properties of the matrix and the deposited layer.
StateIcorr (A⋅cm−2)Ecorr (V)
Matrix7.98 × 10−6−0.21
Deposited9.97 × 10−6−0.29
Publisher’s Note: MDPI stays neutral with regard to jurisdictional claims in published maps and institutional affiliations.

