Article

Heterogeneous Distribution of Interlayer Cations and Iron as a Plausible Explanation of the Non-Exfoliation of Commercial Vermiculites Post Alcohol Treatment and Microwave Irradiation

1
Department of Geology and the Institute of Organometallic Chemistry “Enrique Moles”, University of Oviedo, 33005 Oviedo, Spain
2
Laboratory of High-Resolution Transmission Electron Microscopy, Campus de El Cristo, Institute for Scientific and Technological Resources (SCTs), University of Oviedo, 33006 Oviedo, Spain
*
Author to whom correspondence should be addressed.
Minerals 2021, 11(8), 835; https://doi.org/10.3390/min11080835
Submission received: 2 July 2021 / Revised: 27 July 2021 / Accepted: 29 July 2021 / Published: 1 August 2021

Abstract

:
Two commercial vermiculites from China and Libby were treated with different alcohols (methanol, ethanol, propanol and butanol) at room temperature for up to one month and afterwards irradiated with microwaves. The exfoliated and non-exfoliated particles were characterized by X-ray diffraction, high-resolution transmission microscopy, thermal gravimetric analyses and infrared spectroscopy to explain the inconsistencies in relation to potassium distribution and the exfoliation observed in previous investigations. The percentages of the exfoliated and non-exfoliated particles of the investigated vermiculites greatly varied, with no indication of a relationship between the resultant exfoliation and alcohol treatment. The crystallinity and structural order of the phases composing the particles are independent of the success of their exfoliation. The existence of a mosaic structure, the intra-particle mosaic-like intergrowth of the different mineral phases, in the treated and pristine commercial vermiculites could be attributed to the heterogeneous distribution on the nanoscale of interlayer cations as potassium and iron.

1. Introduction

Commercial vermiculite [1] is a micaceous mineral that exfoliates quickly when rapidly heated to elevated temperatures, chemically treated [2,3] or irradiated with microwaves [4,5]. Several studies have revealed that single particles may consist of several zones of mica, true vermiculite and interstratification of both [2,6]. Moreover, Marcos et al. pointed out that these single particles may also consist of interstratification zones of vermiculites with different hydration states [7]. Furthermore, it was found that the greatest exfoliation is achieved in the presence of interstratified mica-vermiculite [1,8]. This could be attributed to the fact that during the ‘thermal shock’, the water molecules of the vermiculite layers hit the mica layers, producing a greater separation between them. Hillier et al. related the exfoliation with the mosaic distribution of the different mineral phases within the vermiculite particles [2]. The lateral phase boundaries between vermiculite and other phases (mica, or vermiculite and chlorite) could prevent the escape of gas from a particle, resulting in exfoliation when the pressure exceeds the bonding forces that hold the layers together. This type of thermal delamination is the oldest, and it is still used today to a greater extent in industry. The water content, type of cations of the interlayer and the interstratifications of a vermiculite are factors that greatly influence its exfoliation [7,9,10].
In addition to water, inorganic or organic compounds can be adsorbed onto the expandable interlayer space [11,12]. Numerous studies on the intercalation of polar organic molecules by clay minerals have been carried out. The adsorption properties of alcohols are the most widely studied [13,14]. Vermiculite soaked in alcohol could be used to improve superficial scald development on ‘Granny Smith’ [15] or to treat colonies against Varroa destructor [16]. In addition, alcohol-treated and exfoliated vermiculite could be a suitable material to prepare polymeric nanocomposites [17,18]. They can be used in different applications, including automotive, from interior and exterior car parts to tyres, sporting goods, packaging, coatings, wires and cables, fuel cells, biomedical materials, and adsorbents [19]. Marcos and Rodríguez stated that alcohol treatment of commercial vermiculites resulted in structural changes (the appearance of phases with a state of hydration of less layers of water and order-disorder) related to the replacement of water by alcohol in a very low percentage [20,21]. In addition, they stated that the water loss of the investigated commercial vermiculites treated with alcohols (methanol, ethanol, propanol and butanol) and subsequent microwave irradiation was the same, as was as their expansibility, despite that some particles did not exfoliate. Later they observed inconsistencies in relation to the potassium content and the non-exfoliation of some commercial vermiculite particles treated with butanol or propanol and subsequent microwave irradiation [21].
Therefore, the aim of the present work is to investigate the aforementioned inconsistencies and to try to explain their causes. For this purpose, new experiments were carried out with alcohol treatment (butanol, propanol, methanol and ethanol) for up to one month, followed by microwave irradiation for 20 s. The results based on different characterization techniques are discussed, from which we could derive that the existence of an intra-particle mosaic-like intergrowth of the different mineral phases in the commercial vermiculites could be attributed to the heterogeneous distribution on a very small scale of interlayer cations as potassium and calcium and others as iron and titanium.

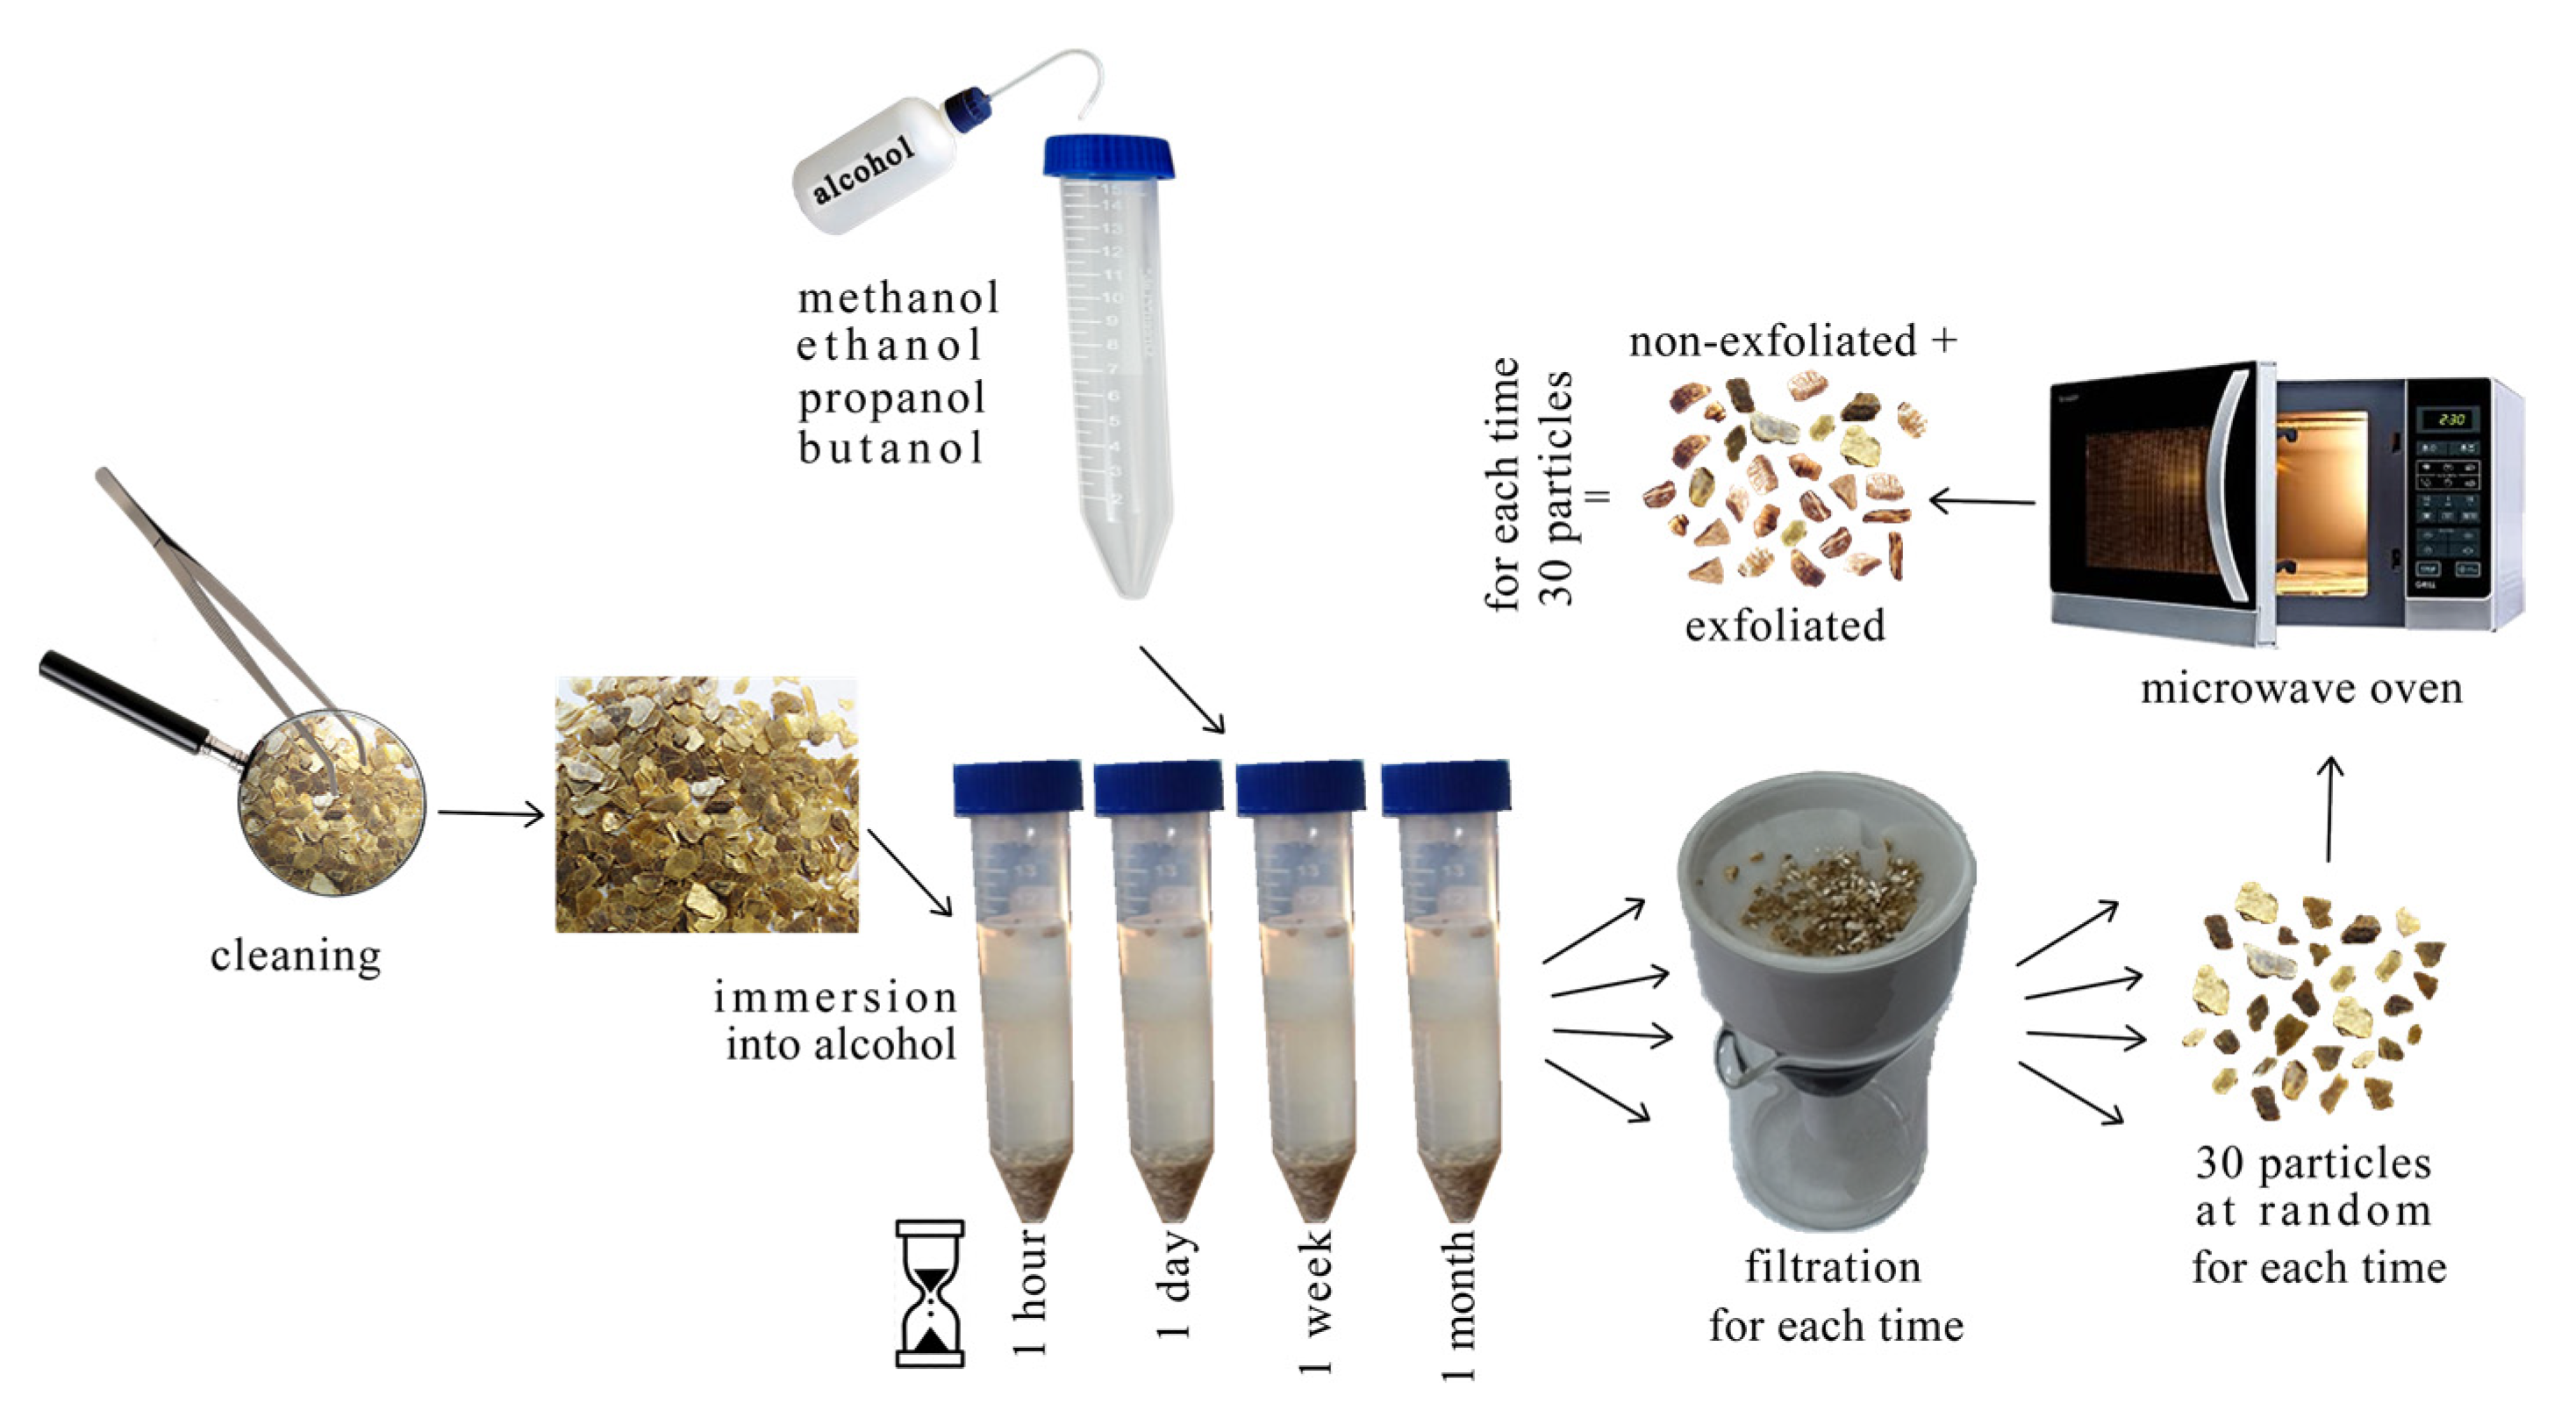
2. Materials and Methods

The vermiculite samples studied are from China (C) and Libby (L). The China sample was supplied by the Vermiculita y Derivados S.A. company of Gijón (Asturias, Spain) and its origin is unknown; the Libby sample was supplied by Montana Bureau of Mines and Geology, Montana Technology University (Butte, MT, USA). The particle dimensions are smaller than 5 mm in diameter and 0.5–1 mm in thickness. The chemical analyses of the samples were previously published [22,23]. The percentage of K2O (5.614 for L and 9.682 for C) is greater than 0.033%, indicating that they are “commercial vermiculite” [24,25].
The methanol (99.8%) and ethanol (99.9%) used were from Baker. The trace impurities (Cu, Fe, Ni) of methanol were <0.1 ppm and heavy metals (as Pb) <0.5 ppm. The trace impurities (Al, Ca, Cu, Zn, Sn, Pb, Mg, B, Ba, Cu, Fe, Ni) of ethanol were up to 1.93 ppm. The propanol (99.5%) used was from Panreac (Barcelona, Spain). The nonvolatile matter = 0.004%, the trace impurities (Cu, Pb, Ni) of propanol were = 0.00002% and Fe = 0.00005%. The butanol (99.8%) used was from Analar NORMAPUR (VWR International, Radnor, PA, USA), with Al, Ca < 0.5 ppm; Ba, Cu, Fe, Pb, Sn, Zn < 0.1 ppm; B, Co, Cr, Cu, Mg, Mn < 0.02 ppm; Cd < 0.05 ppm.
The methodology adopted here is similar to what was described elsewhere using methanol, ethanol, propanol and butanol [20,21] (Figure 1). First, any minerals seen by the naked eye were eliminated from the samples C and L, separately, by hand-picking, and no previous treatment was performed on the vermiculites, in order to preserve their natural characteristics as much as possible. Two steps were done, the first of which was the immersion of each vermiculite, C and L, separately, into one of the above-mentioned alcohols, at room temperature, for 1 h, 1 day, 1 week and 1 month. This was followed by the irradiation step with microwaves for 20 s of vermiculite particles C and L, respectively, treated with alcohol for 1 month after being filtered and dried at room temperature, using a SHARP R64sT (Sharp Electronics Corporation, Montvale, NJ, USA) microwave oven with a frequency of 2.45 GHz and 800 W of energy. The samples were placed in the center of the glass rotating disc of the microwave oven. The resultant samples were then separated according to their exfoliation success and type of treatment (Table 1).
The percentages of exfoliated and non-exfoliated vermiculite particles were calculated by considering the number of exfoliated and non-exfoliated particles after the microwave irradiation of 30 particles previously treated with alcohol.
Only samples treated with alcohol for 1 month and subsequent microwave irradiation (treated samples) were subjected to the below-mentioned characterizations. XRD patterns of the samples, previously ground with an agate mortar, were taken with a PANalytical X’pert Pro (Malvern Panalytical, Malvern, UK) diffractometer. Setting conditions were 40 mA and 45 kV (Cu-Kα radiation; λ = 1.5418 Å), 2θ range of 3–12 degrees (in which the most important phases are reflected), 2θ step scans of 0.007° and a counting time of 1s per step. The standard reference material used was 660a NIST LaB6 with Full Width at Half Maximum (FWHM) of 0.06° for 2θ = 21.36°. Changes in the intensity and position of the basal reflections were used to indicate changes in the structural order and hydration states.
A high-resolution transmission electron microscope with a field emission gun, JEOL-JEM 2100F (JEOL Ltd., Tokyo, Japan), operated at 200 kV with a resolution of 1.9 Å between points and 1.0 Å between lines, was used to obtain high-resolution micrographs and selected area electron diffraction (SAED) patterns with its accompanied CCD camera (Orius, Gatan, Pleasanton, CA, USA). The associated microanalyzer EDX (X-max, Oxford Instruments, Abingdon, UK) was used together with a bright-field detector (EM24541SIOD, JEOL) in STEM mode to obtain elemental mapping of several projections of the samples, for which, INCA software (ETAS S.A.S., Saint-Ouen, France) was used. The measured area in each particle ranged between 5 × 10² and 7 × 10³ nm2.
The infrared spectra were obtained with a Varian 670-IR (Varian Inc., Grenoble, France) equipped with an attenuated total reflectance (ATR) “Golden Gate”, in the range of >600–4000 cm−1, with a resolution of 4 cm−1 using 16 scans for both the sample and the background. The sample was placed on diamond crystal and pressed to ensure the contact between the sample and the crystal. For vermiculites, with planar structure, the ATR FTIR method is considered to be more suitable than the Absorbance FTIR, because the former allows for measuring the samples in their native form without the need to prepare them in pellets. Furthermore, alcohol is adsorbed in the expandable interlayer space perpendicular to (0001) planes. The most obvious bond between the alcohol and the vermiculite might be OH-O, alcoholic OH and O of the surface of the vermiculite [21,26,27,28].
The thermal gravimetric analyses were made between 25 and 1100 °C on the samples. The equipment was a Mettler Toledo Stare System Thermobalance (Mettler Toledo, Columbus, OH, USA) with alumina crucible, a heating rate of 10 °C/min and flowing nitrogen at 50 mL/min. The total mass loss attributed to the water loss was determined gravimetrically by heating the samples in air at 1000 °C.

3. Results

The percentages of the exfoliated and non-exfoliated particles of vermiculites from China and Libby after treatment with alcohol and subsequent microwave irradiation are present in Table 2. As can be seen, there is a wide variation in the percentages of exfoliated and non-exfoliated particles, independent of alcohol and treatment time.
The XRD patterns performed at room temperature for the untreated and 1-month treated vermiculites from China and Libby are shown in Figure 2 and Figure 3, respectively. In CBE, CBN, CPE, CPN, LBE, LBN, LPE, and LPN, it is observed that the crystallinity and order of the 2-WLHS (WLHS: Water Layer Hydration States [29]), corresponding to the reflections at 14.789 Å (China samples) and 14.375 Å (Libby samples), and 2-1-WLHS, corresponding to the reflections at 12.799 Å and 12.133 Å (China samples) and 12.208 Å (Libby samples), have improved compared to the untreated samples, except for CBE [21]. The opposite occurred in the particles CME, CMN, CEE, CEN, LMN, LEN, except for CME.
It can be observed that the intensity of reflections from the non-exfoliated particles pre-treated with butanol and methanol are lower compared to those from the exfoliated particles. In the Libby samples, the reflections from the non-exfoliated particles are less intense than those of the exfoliated ones, and depending on the alcohol type the 2- and 2-1WHLS phases almost disappear.
As shown in Figure 4, High Resolution Transmission Electron Microscopy (HRTEM) analysis revealed that the pristine particles from both samples can possess homogeneous (Figure 4a,d) or heterogeneous structures (Figure 4b,e). After alcohol treatment and subsequent microwave irradiation, particles that were successfully exfoliated show homogeneity in their structures (Figure 4c), compared to the other particles that could not undergo an exfoliation (Figure 4f).
This heterogeneity is well presented in the electron diffraction patterns (Figure 5). Indeed, SAED patterns reflect the heterogeneity in the mineral composition of pristine vermiculite (Figure 5a,c) as well as the non-exfoliated particles (Figure 5d) on the nanoscale with the presence of more than one crystalline phase. Due to the dehydration that vermiculite particles can encounter in vacuum even in cryogenic conditions, it is expected that the interplanar spacings of the most important reflections would decrease in their values. Therefore, based on the reduced values and the JCPD cards, the presence of at least three phases could be estimated: dehydrated vermiculite, hydrobiotite and muscovite.
Average elemental analysis obtained using the STEM mode and bright-field detector combined with EDX from five exfoliated and five non-exfoliated particles of the samples investigated is shown in Table 3. In the set of analyses performed, the variation of the K and Fe percentages and their mapping with the particle size is notable (see more data in vermiculite-alcohol.zip, Supplementary Materials). The variation in the percentage of Mg is lower than that of K and Fe. Mg, as an interlayer cation, together with K and Fe and water, could have probably played an important role in the response of vermiculites to treatment. On the other hand, the distribution of K and Fe was not very homogeneous in some particle of the treated samples of both origins (Figure 6); although, in most of them it was homogeneous, as can be seen for instance in Figure 7. The distribution of Mg is rather more homogenous compared to that of K and Fe.
The average percentages of K and Fe for the treated samples from China and Libby are presented in Figure 8 and Figure 9, respectively.
The average % K is either much lower in exfoliated samples, as in the case for CME, slightly lower (0.1–0.9%), as in the case for CBE and CPE, compared to their non-exfoliated counterparts, or higher (1.3%), as in the case of CEE when compared to CEN (Figure 6a). Similarly, the % Fe of the CME was relatively lower, while that of CBE and CPE particles was just slightly lower (0.1–0.9%), and that of CEE was higher (1.8%), when compared to their non-exfoliated counterparts.
For Libby vermiculite, the average % K of the LBE, LPE and LEE particles was slightly lower (0.6–1.3%) than that of the non-exfoliated LBN, LPN and LEN particles (Figure 7a); the average % K of the LME was higher (0.9%) than that of LMN. The average weight % Fe of the LPE, LEE, LME particles was slightly higher (0.2–1.1%) than that of the non-exfoliated LPN, LEN and LMN particles (Figure 7b). Only the % Fe of the LBE was lower (1.0%) than that of LBN.
The infrared spectra of the studied treated samples from China (Figure 10) and Libby (Figure 11) were similar to those of the untreated samples [20,21] and showed the three characteristic regions: OH-stretching vibrations for the alcohol; the residual water for the hydroxyls of the vermiculites centered around 3380 cm−1 in the China samples and 3340 cm−1 in the Libby samples; OH-bending vibrations of the residual water around 1640 cm−1; and OH-bending vibration and Si-O-Si and Si-O-Al stretching vibrations of vermiculite centered around 940 cm-1. Bands centered at 810, 730 and 650 cm−1 are attributed to the deformation vibration of Si-O and the bending vibration of Si-O-M (where M can be Si, Mg, Al or Fe) [30,31]. Qualitatively, there were no significant differences in the interaction of the different alcohols on the vermiculites. There are slight variations in the intensity of the bands, including those for water.
The water loss data, presented in Table 4, show that the variation of water content for the treated and pristine samples does not exceed 7%. This variation corroborates the differences in the intensity of the water absorption bands in the infrared spectra. In the case of the Libby samples, the water content of the alcohol-treated samples is slightly lower than that of the pristine samples and the ones treated with alcohol and irradiated with microwaves. Moreover, in both treated samples from China and Libby, the water content follows almost the same pattern as the average percentages of K and Fe.

4. Discussion

As mentioned earlier, commercial vermiculite particles are composed of vermiculite with different hydration states, mica and different interstratifications between both. Their exfoliation is related to the mosaic distribution on a very small scale of the different mineral phases within the vermiculite particles, and the interlayer cations (Mg2+ and K+) and iron and water contents. These aspects are fundamental to understanding the behavior of vermiculites when subjected to any type of treatment. On the other hand, the different industrial applications of commercial vermiculites are largely dependent on this behavior. In addition, it is essential to understand the geological origin of vermiculites. Some aspects observed in the transformations caused by treatments with water loss could coincide with field observations [32,33].
We were expecting variation in the exfoliation according to the treatment duration and alcohol type. Nevertheless, in most cases, the exfoliation capacity varied randomly with both duration and alcohol type with a possible indication of reversibility over time (Table 2). A thorough analysis of the exfoliated and non-exfoliated revealed that these variations could be attributed to the different composition and phase distribution of the particles, as was confirmed with HRTEM and SAED analyses.
On the other hand, the crystallinity and structural order of the phases composing the particles is independent of their exfoliation. Marcos and Rodríguez [21] reported that potassium migration, due to the entry of alcohol into the structure, could be the cause of the improvement of the crystallinity and structural order of the phases, and the heterogeneous distribution of potassium and iron could justify it. However, the observation of the element maps of the analyzed particles shows that the degree of homogeneity in the distribution of different elements depends on the size scale. This is the case for the heterogeneous distribution of K, Ca of the interlayer, Fe and Ti observed in some analyzed particles, such as the one in Figure 4b, whose size is three times smaller than that of the particle in Figure 4a, which shows a homogeneous distribution of these elements.
Therefore, the existence of an intra-particle mosaic-like intergrowth of vermiculite, hydrobiotite and mica in the non-exfoliated treated and pristine commercial vermiculites on a very small scale could explain the observed heterogeneous distribution of interlayer cations and others as Fe.
Regarding the exfoliation, initially and in agreement with Marcos et al. [7] and Marcos and Rodríguez [22], the authors of the present study thought that the non-exfoliated particles would have lower K, Fe and water contents compared to the exfoliated ones. This is only true for CEN and LMN. The most feasible explanation is to consider the relationship between the exfoliation and the mosaic distribution of the different mineral phases within the vermiculite particles. Thus, non-exfoliation occurs when the pressure exercised by water vapor is lower than the binding forces that hold the layers together [2]. In addition, the different rates of energy absorption of the particles caused by their different mineral composition influence the success of the exfoliation.

Supplementary Materials

The following are available online at https://www.mdpi.com/article/10.3390/min11080835/s1, analyses of the analyzed elements and their mapping and SAED and HRTEM images of exfoliated and non-exfoliated vermiculites.

Author Contributions

Conceptualization, C.M.; methodology, C.M., Z.d.R. and A.A.; software, C.M. and A.A.; formal analysis, C.M., Z.d.R. and A.A.; resources, C.M.; data curation, C.M.; writing—original draft preparation, C.M. and A.A.; writing—review and editing, C.M. and A.A.; supervision, C.M.; project administration, C.M.; funding acquisition, C.M. All authors have read and agreed to the published version of the manuscript.

Funding

This research was funded by OVIEDO UNIVERSITY (OVIEDO, SPAIN), grant number PAPI18-EMERG-13.

Data Availability Statement

Not Applicable.

Acknowledgments

The authors would like to acknowledge the technical assistance provided at the Scientific-Technical Services, University of Oviedo, Spain, namely, executing X-ray diffraction, high-resolution transmission electron microscopy and thermal gravimetric analyses. A.A. is grateful for funding her position through GRUPIN-IDI/2018/170.

Conflicts of Interest

The authors declare no conflict of interest.

References

  1. Midgley, H.G.; Midgley, C.M. The mineralogy of some commercial vermiculites. Clay Miner. 1960, 4, 142–150. [Google Scholar] [CrossRef]
  2. Hillier, S.; Marwa, E.M.M.; Rice, C.M. On the mechanism of exfoliation of “Vermiculite”. Clay Miner. 2013, 48, 563–582. [Google Scholar] [CrossRef] [Green Version]
  3. Huo, X.; Wu, L.; Liao, L.; Xia, Z.; Wang, L. The effect of interlayer cations on the expansion of vermiculite. Powder Technol. 2012, 224, 241–246. [Google Scholar] [CrossRef]
  4. Obut, A.; Girgin, I.; Yörükoğlu, A. Microwave exfoliation of vermiculite and phlogopite. Clays Clay Miner. 2003, 51, 452–456. [Google Scholar] [CrossRef]
  5. Marcos, C.; Rodríguez, I. Expansibility of vermiculites irradiated with microwaves. Appl. Clay Sci. 2011, 51, 33–37. [Google Scholar] [CrossRef]
  6. Walker, G.F. Vermiculites and some related mixed-layer minerals. In X-ray Identification and Crystal Structures of Clay Minerals; Brindley, G.W., Ed.; Mineralogical Society: London, UK, 1951; pp. 199–223. [Google Scholar]
  7. Marcos, C.; Arango, Y.C.; Rodríguez, I. X-ray diffraction studies of the thermal behaviour of commercial vermiculites. Appl. Clay Sci. 2009, 42, 368–378. [Google Scholar] [CrossRef]
  8. Couderc, P.; Douillet, P. Les Vermiculites industrielles: Exfoliation, caractéristiques mineralogiques et chimiques. Bull. Soc. Franc. Céram. 1973, 99, 51–59. [Google Scholar]
  9. Mamina, A.K.; Koteĺnikova, E.N.; Muromtsev, V.A. Influence of the structural perfection of phlogopite crystals on their cleavability by hydrogen peroxide. Inorg. Mater. 1990, 26, 2104–2107. [Google Scholar]
  10. Justo, A.; Pérez-Rodríguez, J.L.; Sánchez-Soto, P. J Thermal studies of vermiculites and mica-vermiculite interstratifications. J. Therm. Biol. 1993, 40, 59–65. [Google Scholar] [CrossRef]
  11. Brigatti, M.F.; Colonna, S.; Malferrari, D.; Medici, L.; Poppi, L. Mercury adsorption by montmorillonite and vermiculite: A combined XRD, TG-MS, and EXAFS study. Appl. Clay Sci. 2005, 28, 1–8. [Google Scholar] [CrossRef]
  12. Jiménez de Haro, M.C.; Pérez-Rodríguez, J.L.; Poyato, T.J.; Pérez-Maqueda, L.A.; Ramírez-Valle, V.; Justo, A. Effect of ultrasound on preparation of porous materials from vermiculite. Appl. Clay Sci. 2005, 30, 11–20. [Google Scholar] [CrossRef]
  13. Yariv, S.; Cross, H. Organo-Clay Complexes and Interactions; Marcel Dekker Inc.: New York, NY, USA, 2002. [Google Scholar]
  14. Bergaya, F.; Theng, B.K.G.; Lagaly, G. (Eds.) . Handbook of Clay Science; Elsevier: Amsterdam, The Netherlands, 2006. [Google Scholar]
  15. Chervin, C.; Raynal, J.; André, N.; Bonneau, A.; Westercamp, P. Combining controlled atmosphere storage and ethanol vapors to control superficial scald of apple. Hortscience 2001, 36, 951–95216. [Google Scholar] [CrossRef] [Green Version]
  16. Emsen, B.; Dodologlu, A. Efficacy of different organic compounds against bee mite (Varroa destructor Anderson and Trueman) in honey bee (Apis mellifera L.) colonies. J. Anim. Vet. Adv. 2011, 10, 802–805. [Google Scholar] [CrossRef] [Green Version]
  17. Xu, J.; Meng, Y.Z.; Li, R.K.Y.; Xu, Y.; Rajulu, A.V. Preparation and properties of poly(vinyl alcohol)–vermiculite nanocomposites. J. Pol. Sci. Part B Polym. Phys. 2003, 41, 749–755. [Google Scholar] [CrossRef]
  18. Kim, J.M.; Lee, M.H.; Ko, J.A.; Kang, D.H.; Bae, H.; Park, H.J. Influence of food with high moisture content on oxygen barrier property of polyvinyl alcohol (PVA)/vermiculite nanocomposite coated multilayer packaging film. J. Food Sci. 2018, 83, 349–357. [Google Scholar] [CrossRef] [PubMed]
  19. Galimberti, M.; Cipolletti, V.R.; Coombs, M. Applications of clay–polymer nanocomposites. In Handbook of Clay Science; Bergaya, F., Lagaly, G., Eds.; Developments in Clay Science; Elsevier: Amsterdam, The Netherlands, 2013; pp. 539–586. [Google Scholar]
  20. Marcos, C.; Rodriguez, I. Structural changes on vermiculite treated with methanol and ethanold and subsequent microwave irradiation. Appl. Clay Sci. 2016, 123, 304–314. [Google Scholar] [CrossRef]
  21. Marcos, C.; Rodriguez, I. Effect of propanol and butanol and subsequent microwave irradiation on the structure of commercial vermiculites. Appl. Clay Sci. 2017, 144, 104–114. [Google Scholar] [CrossRef]
  22. Marcos, C.; Rodríguez, I. Expansion behaviour of commercial vermiculites at 1000 °C. Appl. Clay Sci. 2010, 48, 492–498. [Google Scholar] [CrossRef]
  23. Marcos, C.; Rodríguez, I. Exfoliation of vermiculites with chemical treatment using hydrogen peroxide and thermal treatment using microwaves. Appl. Clay Sci. 2014, 87, 219–227. [Google Scholar] [CrossRef]
  24. Velde, B. High temperature or metamorphic vermiculites. Contrib. Miner. Petrol. 1978, 66, 319–323. [Google Scholar] [CrossRef]
  25. Justo, A.; Maqueda, C.; Pérez Rodríguez, J.L. Estudio químico de vermiculitas de Andalucía y Badajoz. Bol. Soc. Esp. Miner. 1986, 9, 123–129. [Google Scholar]
  26. Serna, C.; Vanscoyoc, G.E. Infrared study of sepiolite and palygorskite surfaces. Dev. Sediment 1979, 27, 197–206. [Google Scholar]
  27. Emerson, W.W. Organo-clay complexes. Nature 1957, 180, 48–49. [Google Scholar] [CrossRef]
  28. Brindley, G.W.; Ray, S. Complexes of Ca-montmorillonite with primarymonohydric alcohols (clay-organic studies VIII). Am. Miner. 1964, 49, 106–115. [Google Scholar]
  29. Suzuki, M.; Wada, N.; Hines, D.R.; Whittingham, M.S. Hydration states and phase transitions in vermiculite intercalation compounds. Phys. Rev. B. 1987, 36, 2844–2851. [Google Scholar] [CrossRef] [PubMed]
  30. Farmer, V.C.; Russell, J.D.; McHardy, W.J.; Newman, A.C.D.; Ahlrichs, J.L.; Rimsaite, J.Y. Evidence for loss of protons and octahedral iron from oxidized biotites and vermiculites. Miner. Mag. 1971, 38, 121–137. [Google Scholar] [CrossRef]
  31. Madejová, J. FTIR techniques in clay mineral studies. Vib. Spectrosc. 2003, 31, 1–10. [Google Scholar] [CrossRef]
  32. Churchman, G.J.; Lowe, D.J. Alteration, formation, and occurrence of minerals in soils. In Handbook of Soil Sciences: Properties and Processes, 2nd ed.; Huang, P.M., Li, Y., Summer, M.E., Eds.; CRC Press: Boca Raton, FL, USA, 2012; pp. 20.71–20.72. [Google Scholar]
  33. Mohammed, I.J.; Al-Mashaikie, S.Z. Origin and distribution of clay minerals in the mudstones of the Kolosh formation in Rawandoz area, northeastern Iraq. Iraq. Geol. J. 2018, 51, 75–90. [Google Scholar]
Figure 1. Protocol followed independently for the two studied vermiculites, C and L, with each type of alcohol.
Minerals 11 00835 g001
Figure 2. XRD patterns of China samples, untreated (black) and treated with alcohol for 1 month and subsequent microwave irradiation. Patterns from exfoliated samples are displayed in red and those from non-exfoliated are displayed in blue.
Minerals 11 00835 g002
Figure 3. XRD patterns of Libby samples, untreated (black) and treated with alcohol for 1 month and subsequent microwave irradiation. Patterns from exfoliated samples are displayed in red and those from non-exfoliated are displayed in blue.
Minerals 11 00835 g003
Figure 4. TEM images of the pristine vermiculites from China (a,b) and from Libby (d,e) showing particles with homogenous (a,d) and heterogeneous (b,e) natures; TEM images of exfoliated vermiculite particle CME (c) and of a non-exfoliated LPN (f).
Minerals 11 00835 g004
Figure 5. Selected Area Electron Diffraction (SAED) patterns for the pristine vermiculites that showed heterogeneity in their Transmission Electron Microscopy (TEM) analysis from China (a) and Libby (c) showing dhkl values corresponding to dehydrated vermiculite, hydrobiotite and muscovite phases; SAED pattern of CME (b) reflects its homogeneity, while that the SAED pattern of LPN (d) adopts the heterogeneous pattern for the pristine Libby sample.
Minerals 11 00835 g005
Figure 6. STEM-EDX area mapping for O, Si, Mg, Al, K, Ca, Ti, and Fe elements in CME particles of two different size scales treated in methanol for 1 month and exfoliated with microwaves showing the homogeneous (a) and inhomogeneous (b) distribution of K and Fe in the particles, compared to the rest of the elements.
Minerals 11 00835 g006
Figure 7. STEM-EDX area mapping for O, Si, Mg, Al, K, Ca, Ti, and Fe elements in LPN particles of two different size scales treated in propanol for 1 month showing the homogeneous (a) and heterogeneous (b) distribution of K and Fe in the particles, compared to the rest of the elements.
Minerals 11 00835 g007
Figure 8. Average K % (a) and Fe % (b) obtained with STEM + EDX in the treated samples from China. Notes: red bar corresponds to exfoliated vermiculite particles, and blue bar corresponds to non-exfoliated vermiculite particle. T-sign corresponds to standard deviation.
Minerals 11 00835 g008
Figure 9. Average weight % of K (a) and Fe (b) obtained with STEM + EDX in the treated samples from Libby.
Minerals 11 00835 g009
Figure 10. Infrared spectra of China samples. Spectra for exfoliated samples are displayed in red and those of non-exfoliated samples are displayed in blue.
Minerals 11 00835 g010
Figure 11. Infrared spectra of Libby samples. Spectra for exfoliated samples are displayed in red and those of non-exfoliated samples are displayed in blue.
Minerals 11 00835 g011
Table 1. Codes for treated samples used in this study.
SamplesTreatment
ChinaLibbyAlcoholAfter Microwave Irradiation
CMELMEmethanolexfoliated
CMNLMNno exfoliated
CEELEEethanolexfoliated
CENLENno exfoliated
CBELBEbutanolexfoliated
CBNLBNno exfoliated
CPELPEpropanolexfoliated
CPNLPNno exfoliated
Table 2. Percentage of exfoliated particles treated with alcohol at different time intervals and subsequent microwave irradiation for 20 s.
SamplesAlcohol Treatment Time
1 h1 day1 week1 month
CME71988372
CEE70626975
CPE34402460
CBE72334737
LME60724471
LEE1001006768
LPE64405457
LBE77759057
Table 3. Average weight percentage of elements analyzed with STEM+EDX in exfoliated and non-exfoliated particles of the China and Libby samples, treated with alcohol for 1 month and subsequent microwave irradiation.
SamplesElements Weight % (Standard Deviation)
OSiMgAlKFeCaTi
CME50.2(0.7)19.3(0.5)16.4 (0.5)6.6(0.3)2.5(0.2)3.4(0.2)1.0(0.1)0.7(0.1)
CMN44.9(0.6)20.4(0.4)16.7(0.4)6.7(0.3)5.1(0.2)4.3(0.2)1.4(0.1)0.7(0.1)
CEE47.0(0.5)18.4(0.3)15.4(0.3)6.5(0.2)4.1(0.2)5.2(0.2)1.0(0.1)2.4(0.1)
CEN49.9(0.8)19.7(0.5)16.2(0.5)6.8(0.4)2.8(0.2)3.4(0.3)0.8(0.2)0.6(0.1)
CBE49.6(0.6)19.5(0.4)16.4(0.4)6.8(0.3)3.0(0.2)0.8(0.1)0.6(0.1)3.4(0.2)
CBN49.6(0.4)19.3(0.3)16.2(0.3)6.7(0.2)3.3(0.1)0.9(0.1)0.6(0.1)3.4(0.1)
CPE51.5(0.8)18.2(0.5)15.1(0.5)6.5(0.4)4.0(0.2)3.3(0.3)1.0(0.2)0.6(0.1)
CPN43.5(0.1)21.7(0.1)17.6(0.1)7.3(0.1)4.2(0.0)3.8(0.0)1.0(0.0)0.8(0.0)
LME47.1(1.4)19.0(0.9)14.3(0.8)7.0(0.7)4.3(0.5)6.5(0.6)0.8(0.3)0.7(0.3)
LMN44.6(1.2)20.3(0.8)14.4(0.7)7.3(0.6)5.6(0.4)6.3(0.5)0.7(0.3)0.8(0.3)
LEE45.2(1.9)19.4(1.2)14.0(1.1)7.4(0.9)6.0(0.7)6.5(0.8)0.7(0.4)0.8(0.4)
LEN46.7(1.2)19.6(0.8)14.0(0.7)6.9(0.6)5.1(0.4)6.3(0.5)0.8(0.2)0.6(0.2)
LBE46.9(1.9)19.1(1.2)13.8(1.1)7.0(0.8)4.4(0.6)6.4(0.8)1.2(0.4)0.8(0.4)
LBN44.5(1.5)19.9(1.0)14.1(0.9)7.2(0.7)5.0(0.5)7.4(0.5)1.1(0.3)0.9(0.3)
LPE37.8(0.7)22.0(0.5)14.8(0.5)7.6(0.4)5.7(0.3)9.6(0.4)1.6(0.2)0.9(0.1)
LPN38.6(0.6)21.8(0.4)14.9(0.4)7.3(0.3)6.5(0.3)8.5(0.3)1.1(0.2)0.8(0.1)
Table 4. The percentages of water content derived from the thermal gravimetric analysis of China and Libby samples.
SamplesWater Content %
TreatmentUntreated
Alcohol + Microwave IrradiationMicrowave Irradiation
C--10.3 a12.3 a
CM10.2 c---
CE12.1 c---
CB12.0 c---
CP11.9 c---
CME-11.0--
CMN-12.1
CEE-12.4
CEN-10.7
CBE-11.1
CBN-12.1
CPE-13.4
CPN-11.5
L--11.1 b11.3
LM7.9 d---
LE9.4 d---
LB8.2 d---
LP9.6 d---
LME-11.2--
LMN-12.7
LEE-13.0
LEN-10.1
LBE-11.3
LBN-11.1
LPE-15.0
LPN-12.6
Note: a [5], b [26]; c [20], d [21].
Publisher’s Note: MDPI stays neutral with regard to jurisdictional claims in published maps and institutional affiliations.

