
Demonstration of Optical Microscopy and Image Processing to Classify Respirable Coal Mine Dust Particles


1
Department of Mining & Minerals Engineering, Virginia Polytechnic Institute and State University, Blacksburg, VA 24060, USA
2
Department of Mechanical Engineering, Clemson University, Clemson, SC 29634, USA
*
Author to whom correspondence should be addressed.
Minerals 2021, 11(8), 838; https://doi.org/10.3390/min11080838
Submission received: 27 June 2021
/
Revised: 23 July 2021
/
Accepted: 25 July 2021
/
Published: 2 August 2021
(This article belongs to the Special Issue Mineralogy and Characteristics of Occupational and Environmental Dust Exposures)
Abstract
:Respirable coal mine dust represents a serious health hazard for miners. Monitoring methods are needed that enable fractionation of dust into its primary components, and that do so in real time. Near the production face, a simple capability to monitor the coal versus mineral dust fractions would be highly valuable for tracking changes in dust sources—and supporting timely responses in terms of dust controls or other interventions to reduce exposures. In this work, the premise of dust monitoring with polarized light microscopy was explored. Using images of coal and representative mineral particles (kaolinite, crystalline silica, and limestone rock dust), a model was built to exploit birefringence of the mineral particles and effectively separate them from the coal. The model showed >95% accuracy on a test dataset with known particles. For composite samples containing both coal and minerals, the model also showed a very good agreement with results from the scanning electron microscopy classification, which was used as a reference method. Results could further the concept of a “cell phone microscope” type monitor for semi-continuous measurements in coal mines.
1. Introduction
Respirable coal mine dust (RCMD) represents a serious health hazard for miners [1,2,3,4,5,6,7,8,9,10,11,12]. While the crystalline silica content in the dust has long been recognized as a major factor in development of the most severe and rapidly progressive forms of occupational lung disease, there is some evidence to suggest that other minerals such as silicates can also play a role [13,14]. A recent report from the National Academies of Science, Engineering, and Medicine [15] recommended the development of improved sampling and monitoring techniques that enable the measurement of specific RCMD components, and ideally in real time. The basic premise of this recommendation is of course that better capabilities to track dust conditions should allow miners to more quickly and effectively respond to reduce exposure risks [15].
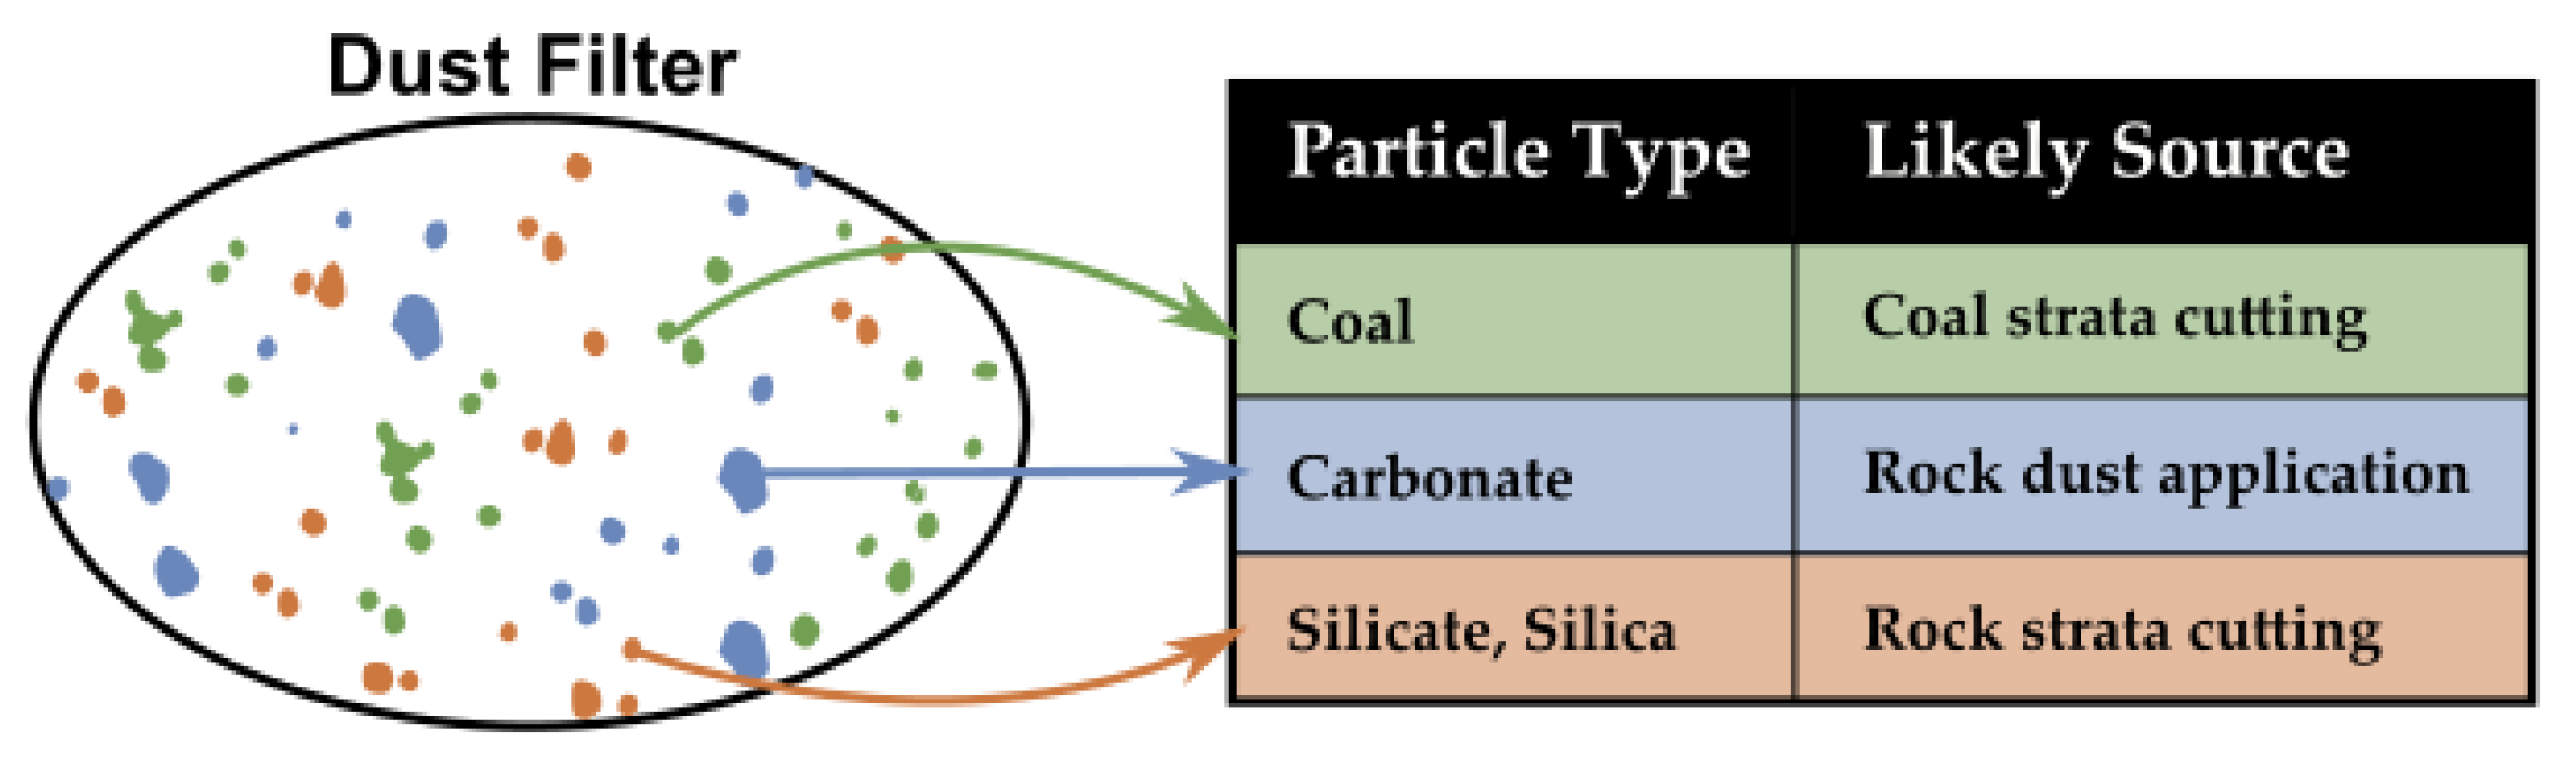
Prior research suggests that there are generally three primary sources of respirable dust in underground coal mines: (i) The coal seam itself, which contributes coal dust particles; (ii) the rock strata surrounding the coal seam, which generally contributes silica, silicate, and other mineral dust particles; and (iii) the rock dusting products applied to mine surfaces, which are often composed of high purity limestone (i.e., calcium carbonate) [16,17,18]. Thus, the ability to fractionate dust into its major components in some location of interest may provide valuable insights about dust sources in that location [19]. For example, at the production face where dust is primarily generated by the mining activity (i.e., cutting of coal and adjacent rock strata), a simple measure of the coal to mineral ratio in the respirable dust would be valuable for understanding the relative contributions of dust from each source—and for targeting dust and exposure controls accordingly.
At present, however, no device is available to make such measurements in real time. Indeed, the relatively new continuous personal dust monitor has advanced near-real-time monitoring of the whole RCMD mass concentration [20], but it cannot fractionate the dust into its components. In addition, while portable spectroscopy can allow “end-of-shift” measurements of silica and possibly other dust constituents [21], it still requires a filter sample collected over hours. Practically speaking, the development of an RCMD monitor that can do both real-time and component-specific measurements is challenged by the analytical problem (i.e., quick measurement and classification of tiny particles), but also the specific hardware constraints presented by coal mine environments (i.e., a monitor must be field worthy, and safe to use where unique safety hazards can exist).
One approach that has not been considered is portable light microscopy. With respect to the analytical problem, optical microscopy (OM) with polarized light has been a standard approach to minerals identification for well over a century [22] and has been combined with more sophisticated methods in recent years [23]. Relative to the specific problem of distinguishing coal from mineral particles, OM techniques have been used in several applications. The coal grain analysis (CGA), which uses reflected light microscopy with an automated image processing system to characterize mineral particles, has been applied (albeit to polished samples) from urban environments to classify coal and non-coal airborne particulates [24,25]. Moreover, polarized light microscopy has been used to distinguish between mineral and coal dust particles in lung tissue samples from miners affected by occupational coal workers’ pneumoconiosis (CWP or “Black Lung”) [13,14,26]. In this case, the mineral particles (i.e., silica and silicates) typically exhibit birefringence due to their anisotropic crystalline structures, whereas the coal dust does not. If something analogous can be achieved by semi-continuous sampling of RCMD, where particles are imaged without sample preparation and where image processing is used to classify particles as either coal or mineral dust, the basis for a new monitoring technology may be developed.
With respect to the challenges around the hardware, portable OM for field applications is now possible [27]. Indeed “cell phone microscopes” have seen applications such as blood-borne parasite detection [28,29], determination of cell size and morphology of yeast [29], and rapid on-site asbestos detection [30], and automated image processing techniques are rapidly progressing [31]. Furthermore, all that is really needed from the cell phone microscope are the camera chip and relevant added optical elements. Thus, it seems plausible that these components could be combined with other existing components that have already been approved for use in coal mines (e.g., light source, battery and air sampling pump) to build a semi-continuous RCMD monitor that is both safe and efficacious.
Given the general idea of what such a monitoring concept might entail, the aim of the work presented here is to show that the analytical premise is feasible. Specifically, this work aims to demonstrate that OM with automated image analysis can be used to accurately fractionate respirable-sized dust particles into two classes: Coal and minerals.
2. Experimental Details
The general approach to this work was to collect samples of respirable-sized particles representative of RCMD components, image these particles with an OM under plane- and cross-polarized conditions, and then use two digital algorithms to process the images. The first employed an established technique to identify particles from the background and extract feature data. The second algorithm was used to classify particles as either coal or mineral, and was developed here by training a model with feature data acquired on known particles (i.e., in single-material samples). Finally, the two algorithms were applied to OM images of composite samples and the classification results were compared to those from a scanning electron microscopy with energy dispersive X-ray (SEM-EDX) method as reference. Details of each part of the experimental approach are described in the following sections.
2.1. Dust Sample Preparation
As noted earlier, previous research [19] suggests that there are four main particle types comprising RCMD in most mines: Coal, silicate, silica, and carbonate, as shown in Figure 1. To generate samples having particles of each type, four representative materials were used: Coal particles were obtained from a pulverized clean bituminous coal product (sieved to −230 mesh), which was received directly from an industry partner. Natural calcium carbonate particles were obtained from a real (limestone) rock dust product, also received from an industry partner. Silica particles were obtained from high purity silica powders (MIN-U-SIL® 5 and MIN-U-SIL® 10, from US Silica, Katy, TX, USA). Silicate particles were obtained from a high purity kaolinite powder (Ward’s Science, Rochester, NY, USA).
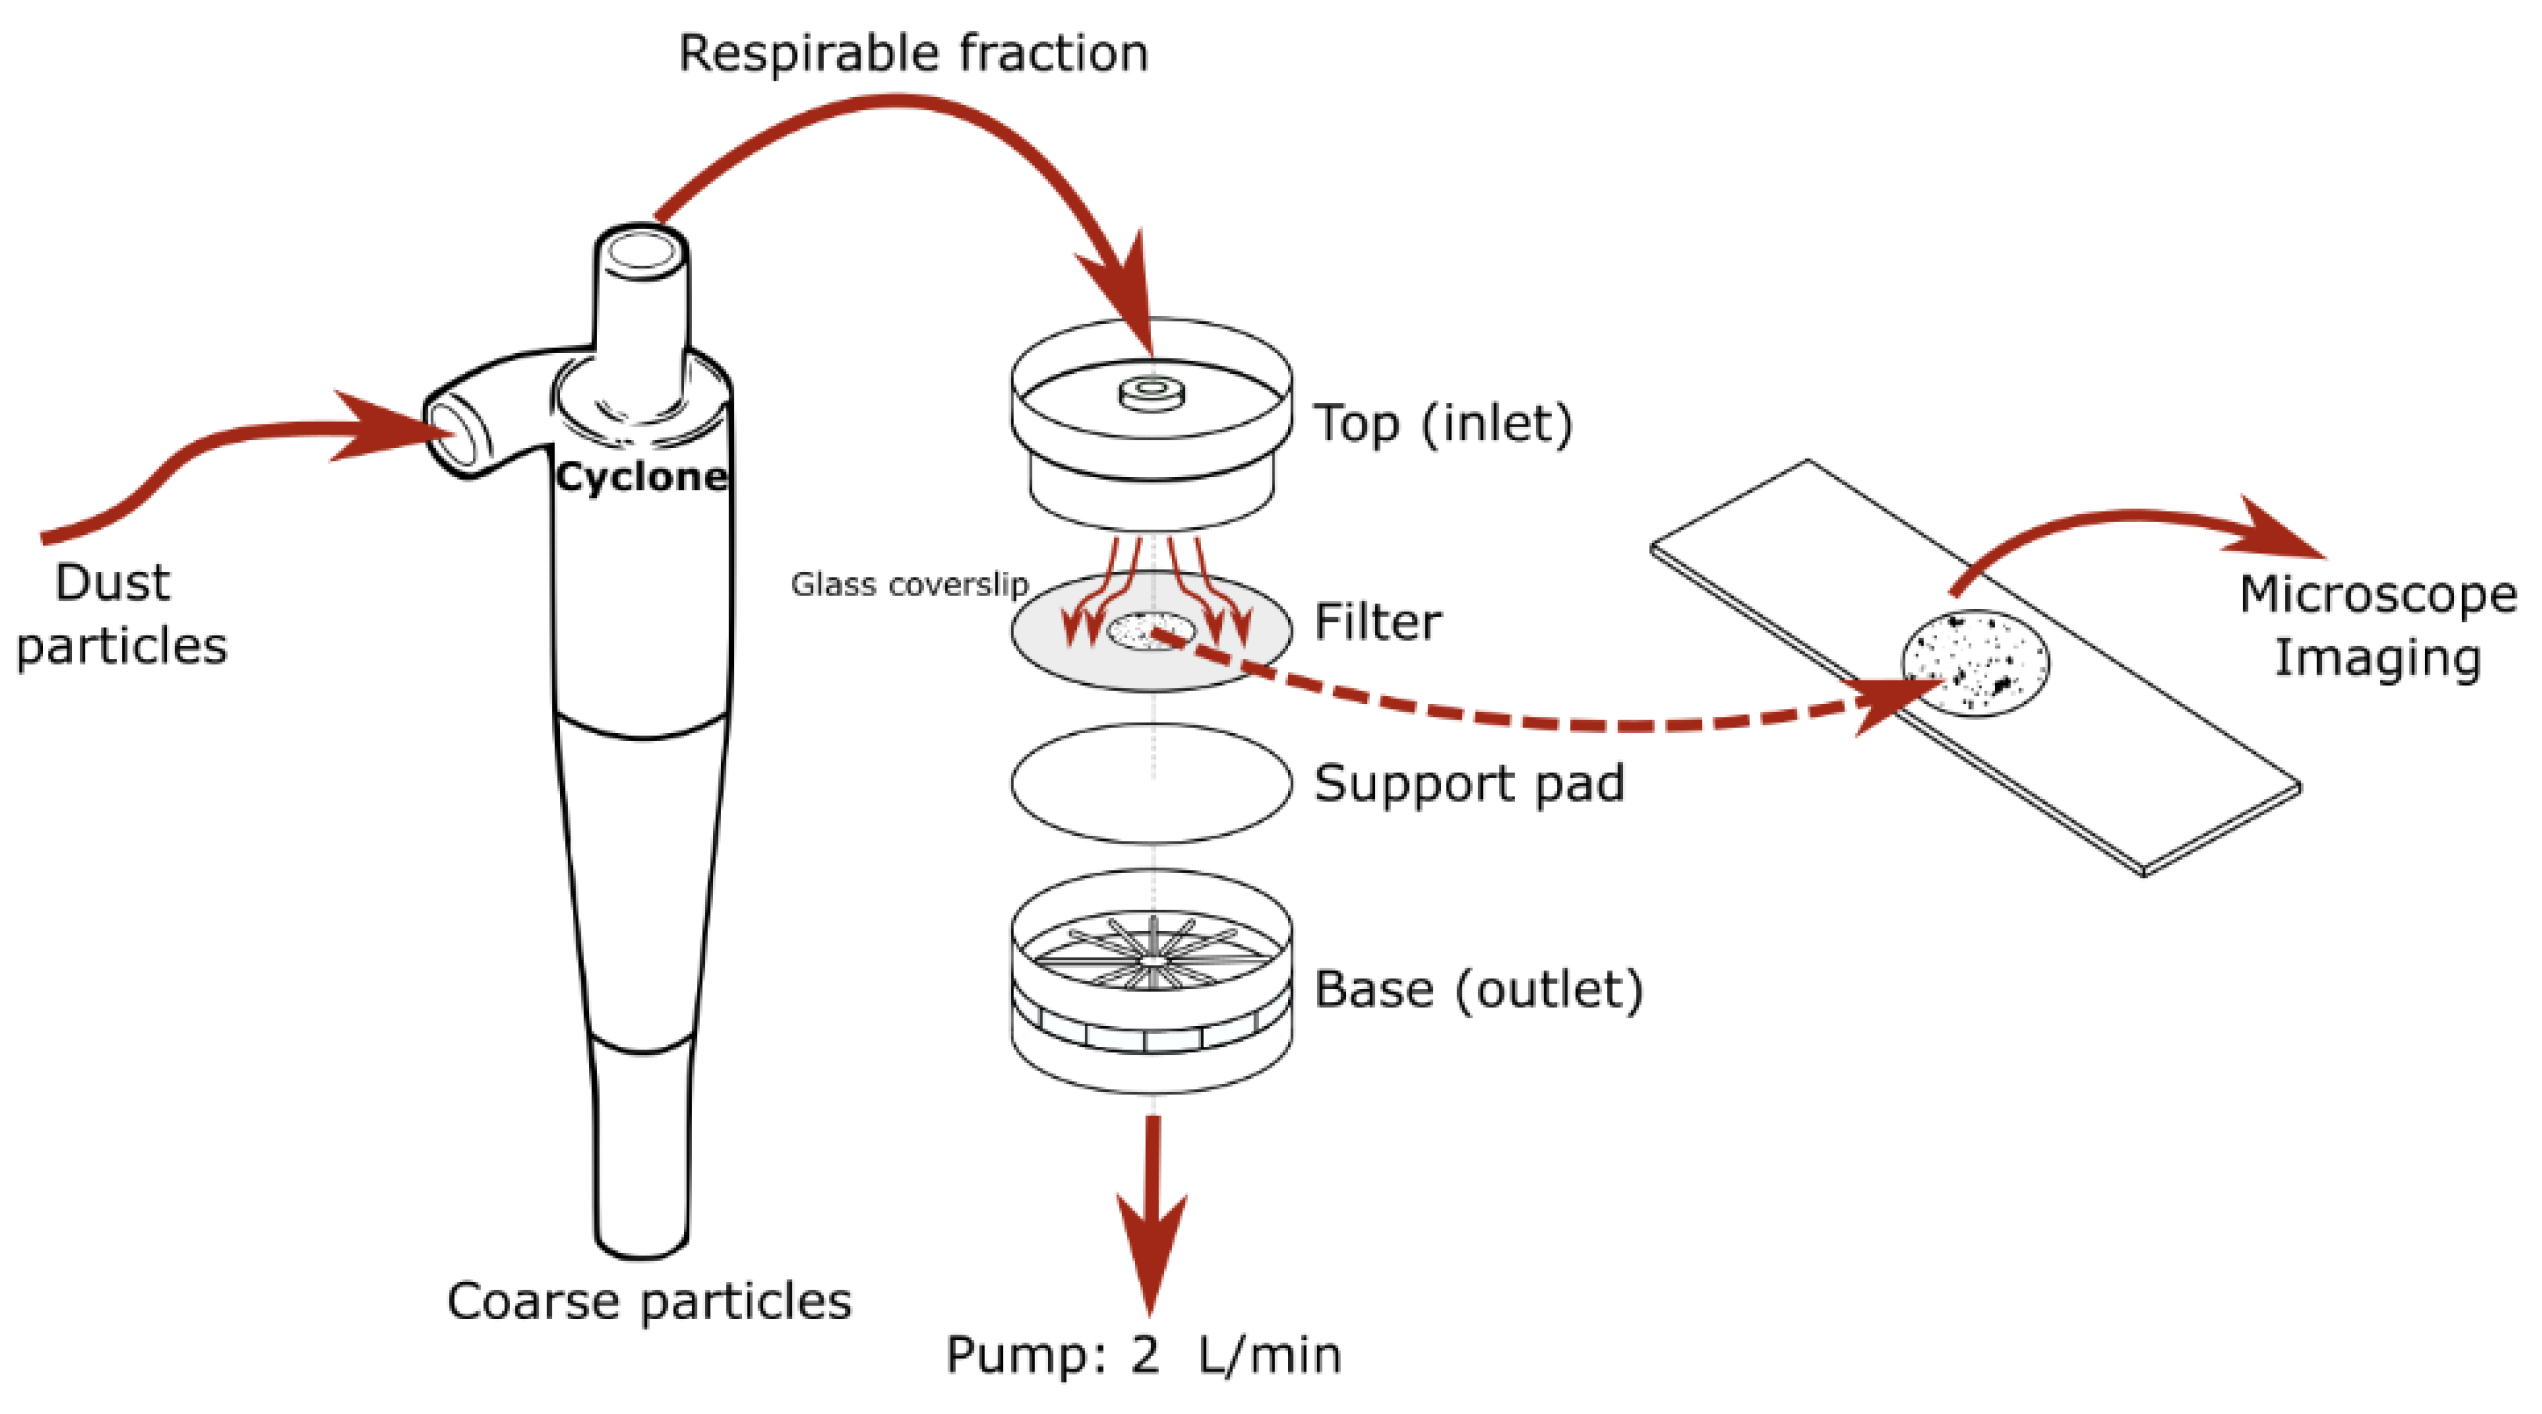
Respirable dust samples were generated by aerosolizing the above products (one at a time) in a small enclosure and sampling the particles using a standard train: Air pump (Escort ELF type) operated at 2.0 L/min, 10-mm nylon cyclone (Dorr Oliver type, which yields a D50 of ~4 µm at 2.0 L/min), two-piece styrene filter cassette (37 mm diameter). As shown in Figure 2, inside the sampling cassette there was a polycarbonate filter (PC; 37 mm track etched with nominal 0.4 µm pore size) and cellulose support pad. On top of the filter was a glass coverslip (~10 mm diameter). In this way, particle deposition occurred on both the coverslip and the PC filter simultaneously. The collection time was adjusted to achieve sufficient particle density for imaging while limiting interference between particles. All the sampling equipment and supplies were obtained from Zefon International (Ocala, FL, USA).
Three single-material samples were collected for each of the four dust materials. Additionally, a total of three composite samples were collected, each contained coal and one type of mineral particles (i.e., kaolinite, rock dust, or silica). For the composite samples, coal particles were first collected onto the PC filter with a coverslip and then the mineral particles were collected onto the same filter with a coverslip.
Following sample collection, the glass coverslips were carefully removed from their respective PC filter and imaged under the optical microscope. The PC filters were prepared for parallel analysis by the scanning electron microscope (SEM), as described below.
2.2. Image Acquisition
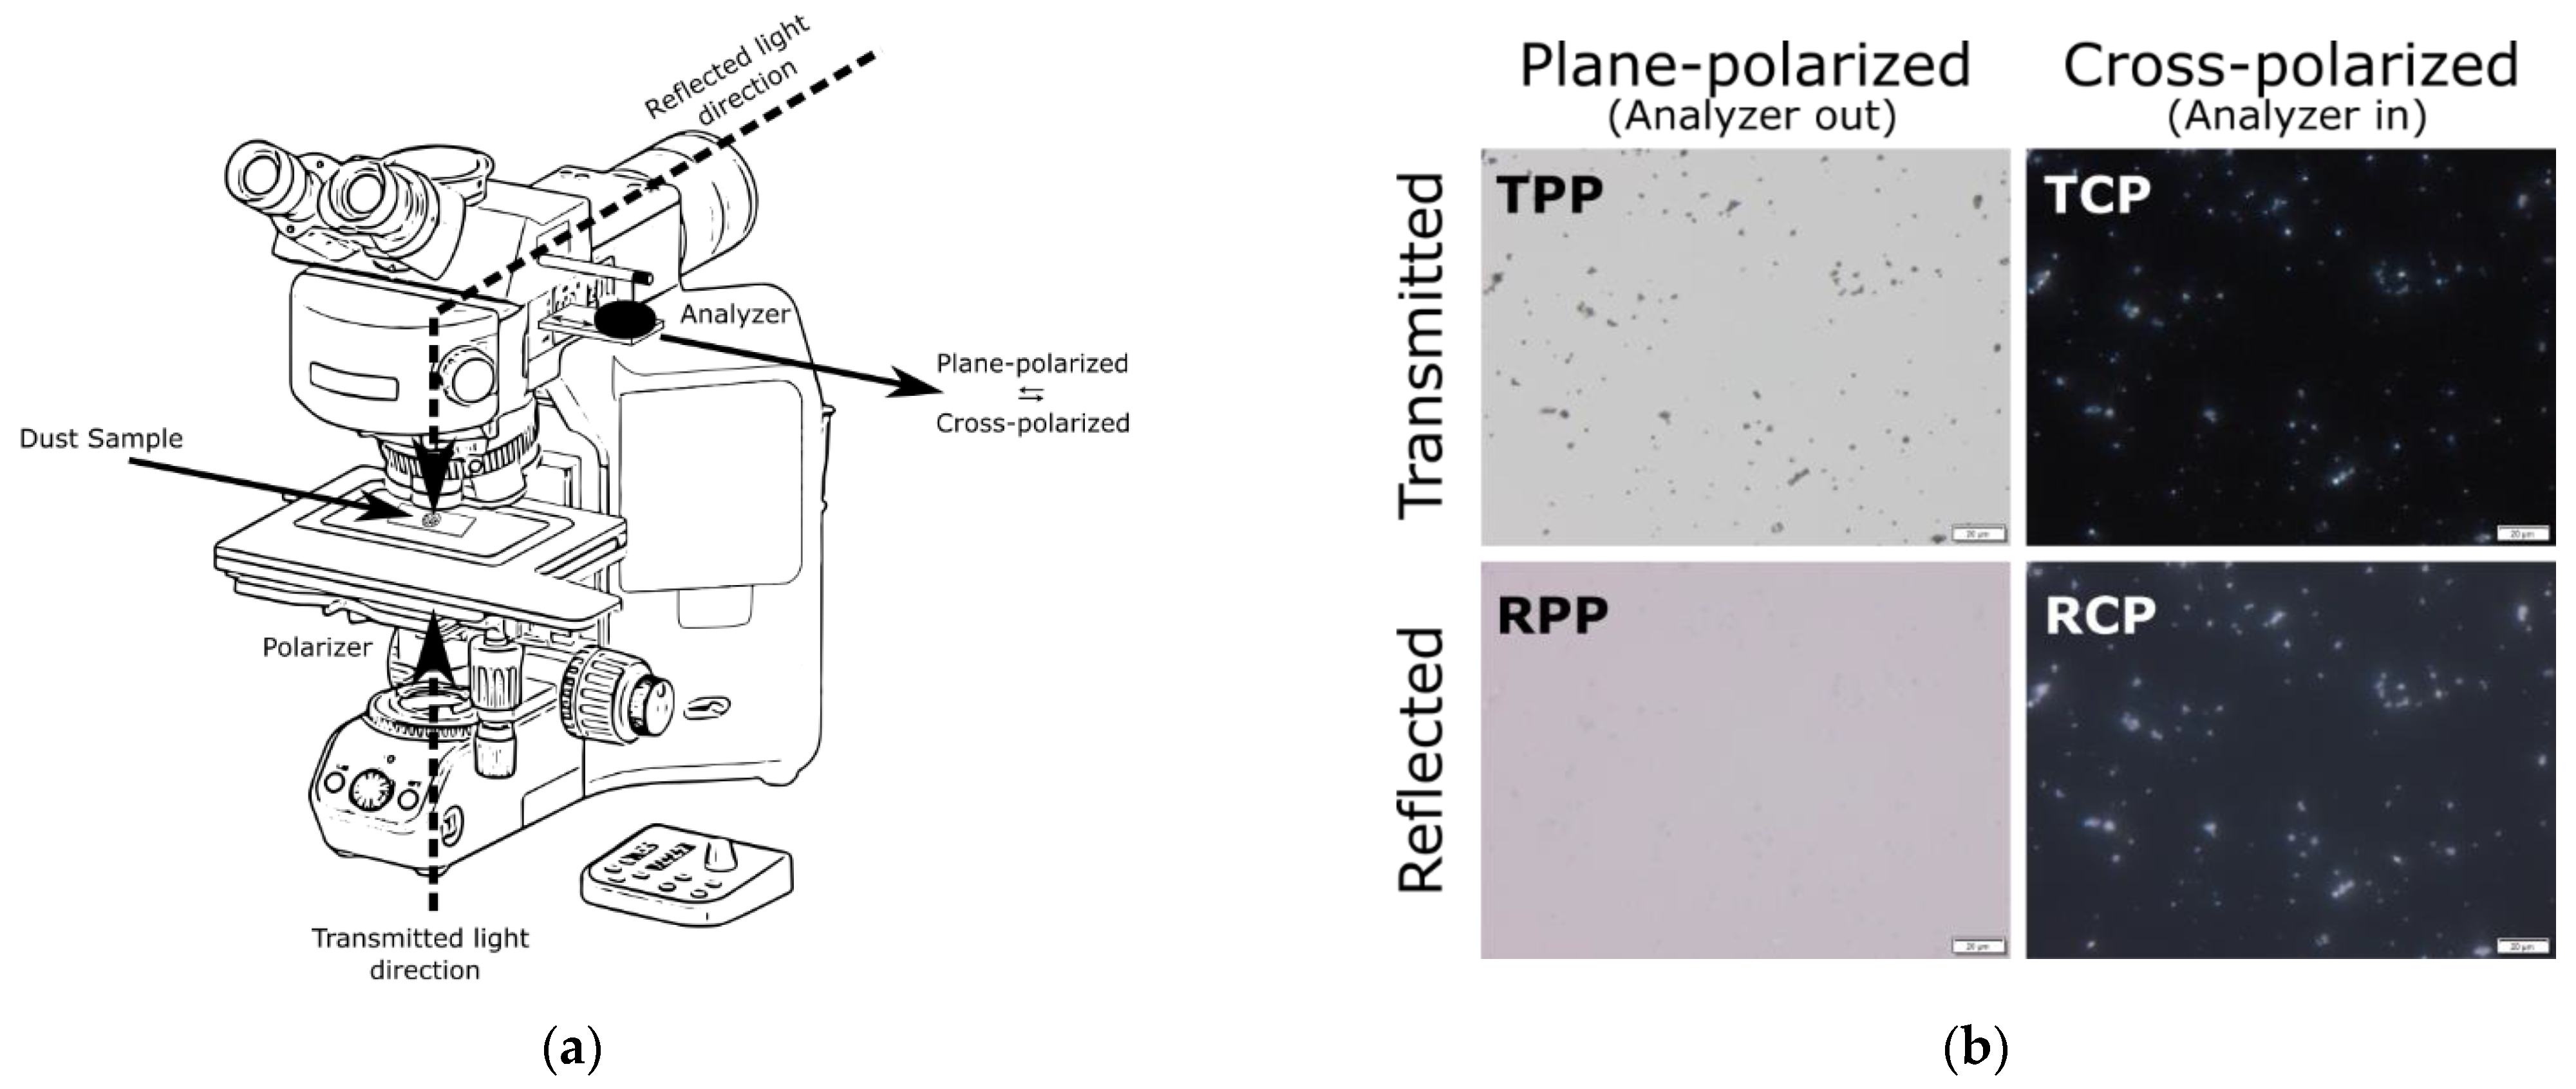
OM imaging was done with an Olympus BX53M Polarizing Microscope and the Stream Start 2.3 imaging software (Olympus, Center Valley, PA, USA). To facilitate discussion of the imaging process and results, the region of a sample where an image is acquired is referred to as a “frame”, and “image” refers to the data collected under specific lighting conditions in that frame. For each frame, images were collected for four conditions: Transmitted plane-polarized (TPP), transmitted cross-polarized (TCP), reflected plane-polarized (RPP), and reflected cross-polarized (RCP) (see Figure 3). For each of the single material samples, 50 frames were imaged yielding 600 images per material (Table 1). For the composite samples, 20 frames were imaged yielding 80 images per sample. Table 1 also shows the total number of particles captured by the images of each material or sample.
For image acquisition, the exposure time was fixed for each lighting condition to avoid the saturation of pixels. To determine the appropriate exposure times, the automatic exposure mode available in the Stream Start software was used to acquire a total of 10 images on samples that contained different particle types and loading densities. The average exposure time was then calculated for each lighting condition and fixed for further work as: 30.51 ms for TPP, 815.06 ms for TCP, 12.99 ms for RPP, and 122.44 ms for RCP. To determine the appropriate color balance, a clean coverslip on a blank glass slide was imaged while illuminated by the microscope’s white LED light source set at 50% of its maximum intensity. The color balance was then set so that the color adjustment of the red, green, blue channels and saturation were 1.81, 1.00, 1.28, and 1.00, respectively. These procedures ensured that, for example, a pixel at the same location of a specific object did not vary from day to day in terms of the overall pixel intensity and the intensity for the red, green, and blue channels. The Gamma correction and saturation were both set to 1.00. A condenser aperture of 0.40 and an objective magnification of 40× were used for all of the images obtained herein. The camera adapter used a 0.63× magnification, yielding a total calibrated magnification of 25.008×. All the images were saved as 12-bit resolution TIFF images using the RGB color space. The images were 2560 × 1920 pixels, with a spatial calibration of 87.971 nm/pixel.
2.3. Image Processing
2.3.1. Particle Identification
The first step in image processing was to simply identify the particles in each frame. To separate the particles from the background, a local adaptive thresholding algorithm was used [32], which is a built-in function in the MATLAB® (R2021a) Image Processing Toolbox called “adaptthresh”. This method computes a threshold for every pixel based on the first-order statistics of neighboring pixels (e.g., mean, median), thereby accounting for non-uniform illumination, changes in background intensities, and different intensity ranges between objects in the image, and performing better than a global thresholding approach. Here, a neighborhood size of 241 × 321 pixels was used to compute the local threshold. This neighborhood window size was selected to enclose an area where the illumination is approximately uniform. A sensitivity factor was also set to determine which pixels get thresholded as foreground (particle) versus background. This factor can range from (0,1). Higher values cause more pixels to be thresholded as foreground, while lower values have the opposite effect—so it is important to optimize the sensitivity factor. Herein, the sensitivity was set to 0.63, which was determined by trial-and-error until identification of particle pixels visually matched with the expected output using randomly selected images in the dataset as a reference.
The particle identification algorithm output was a binary image with each pixel labeled as either particle or background. On this image, morphological operations were performed to eliminate pixilation fuzz around particle boundaries and holes inside the particles. The routine filled holes using iterative dilation-erosion for morphological closing using a pixel connectivity value of 4. Preliminary exploration showed that the TPP images had the best performance for particle identification (i.e., as opposed to the TCP, RPP, or RCP), so only TPP images were used for this identification task.
Once the particles were identified in the TPP image from each frame, the resulting binary mask was applied to all four images from the frame (TCP, RPP, RCP, and TPP) to extract the location, grayscale intensities, and RGB intensities for all particle pixels in each lighting condition. Then, the mean grayscale intensity and RGB intensities for each particle were computed and stored.
2.3.2. Particle Classification
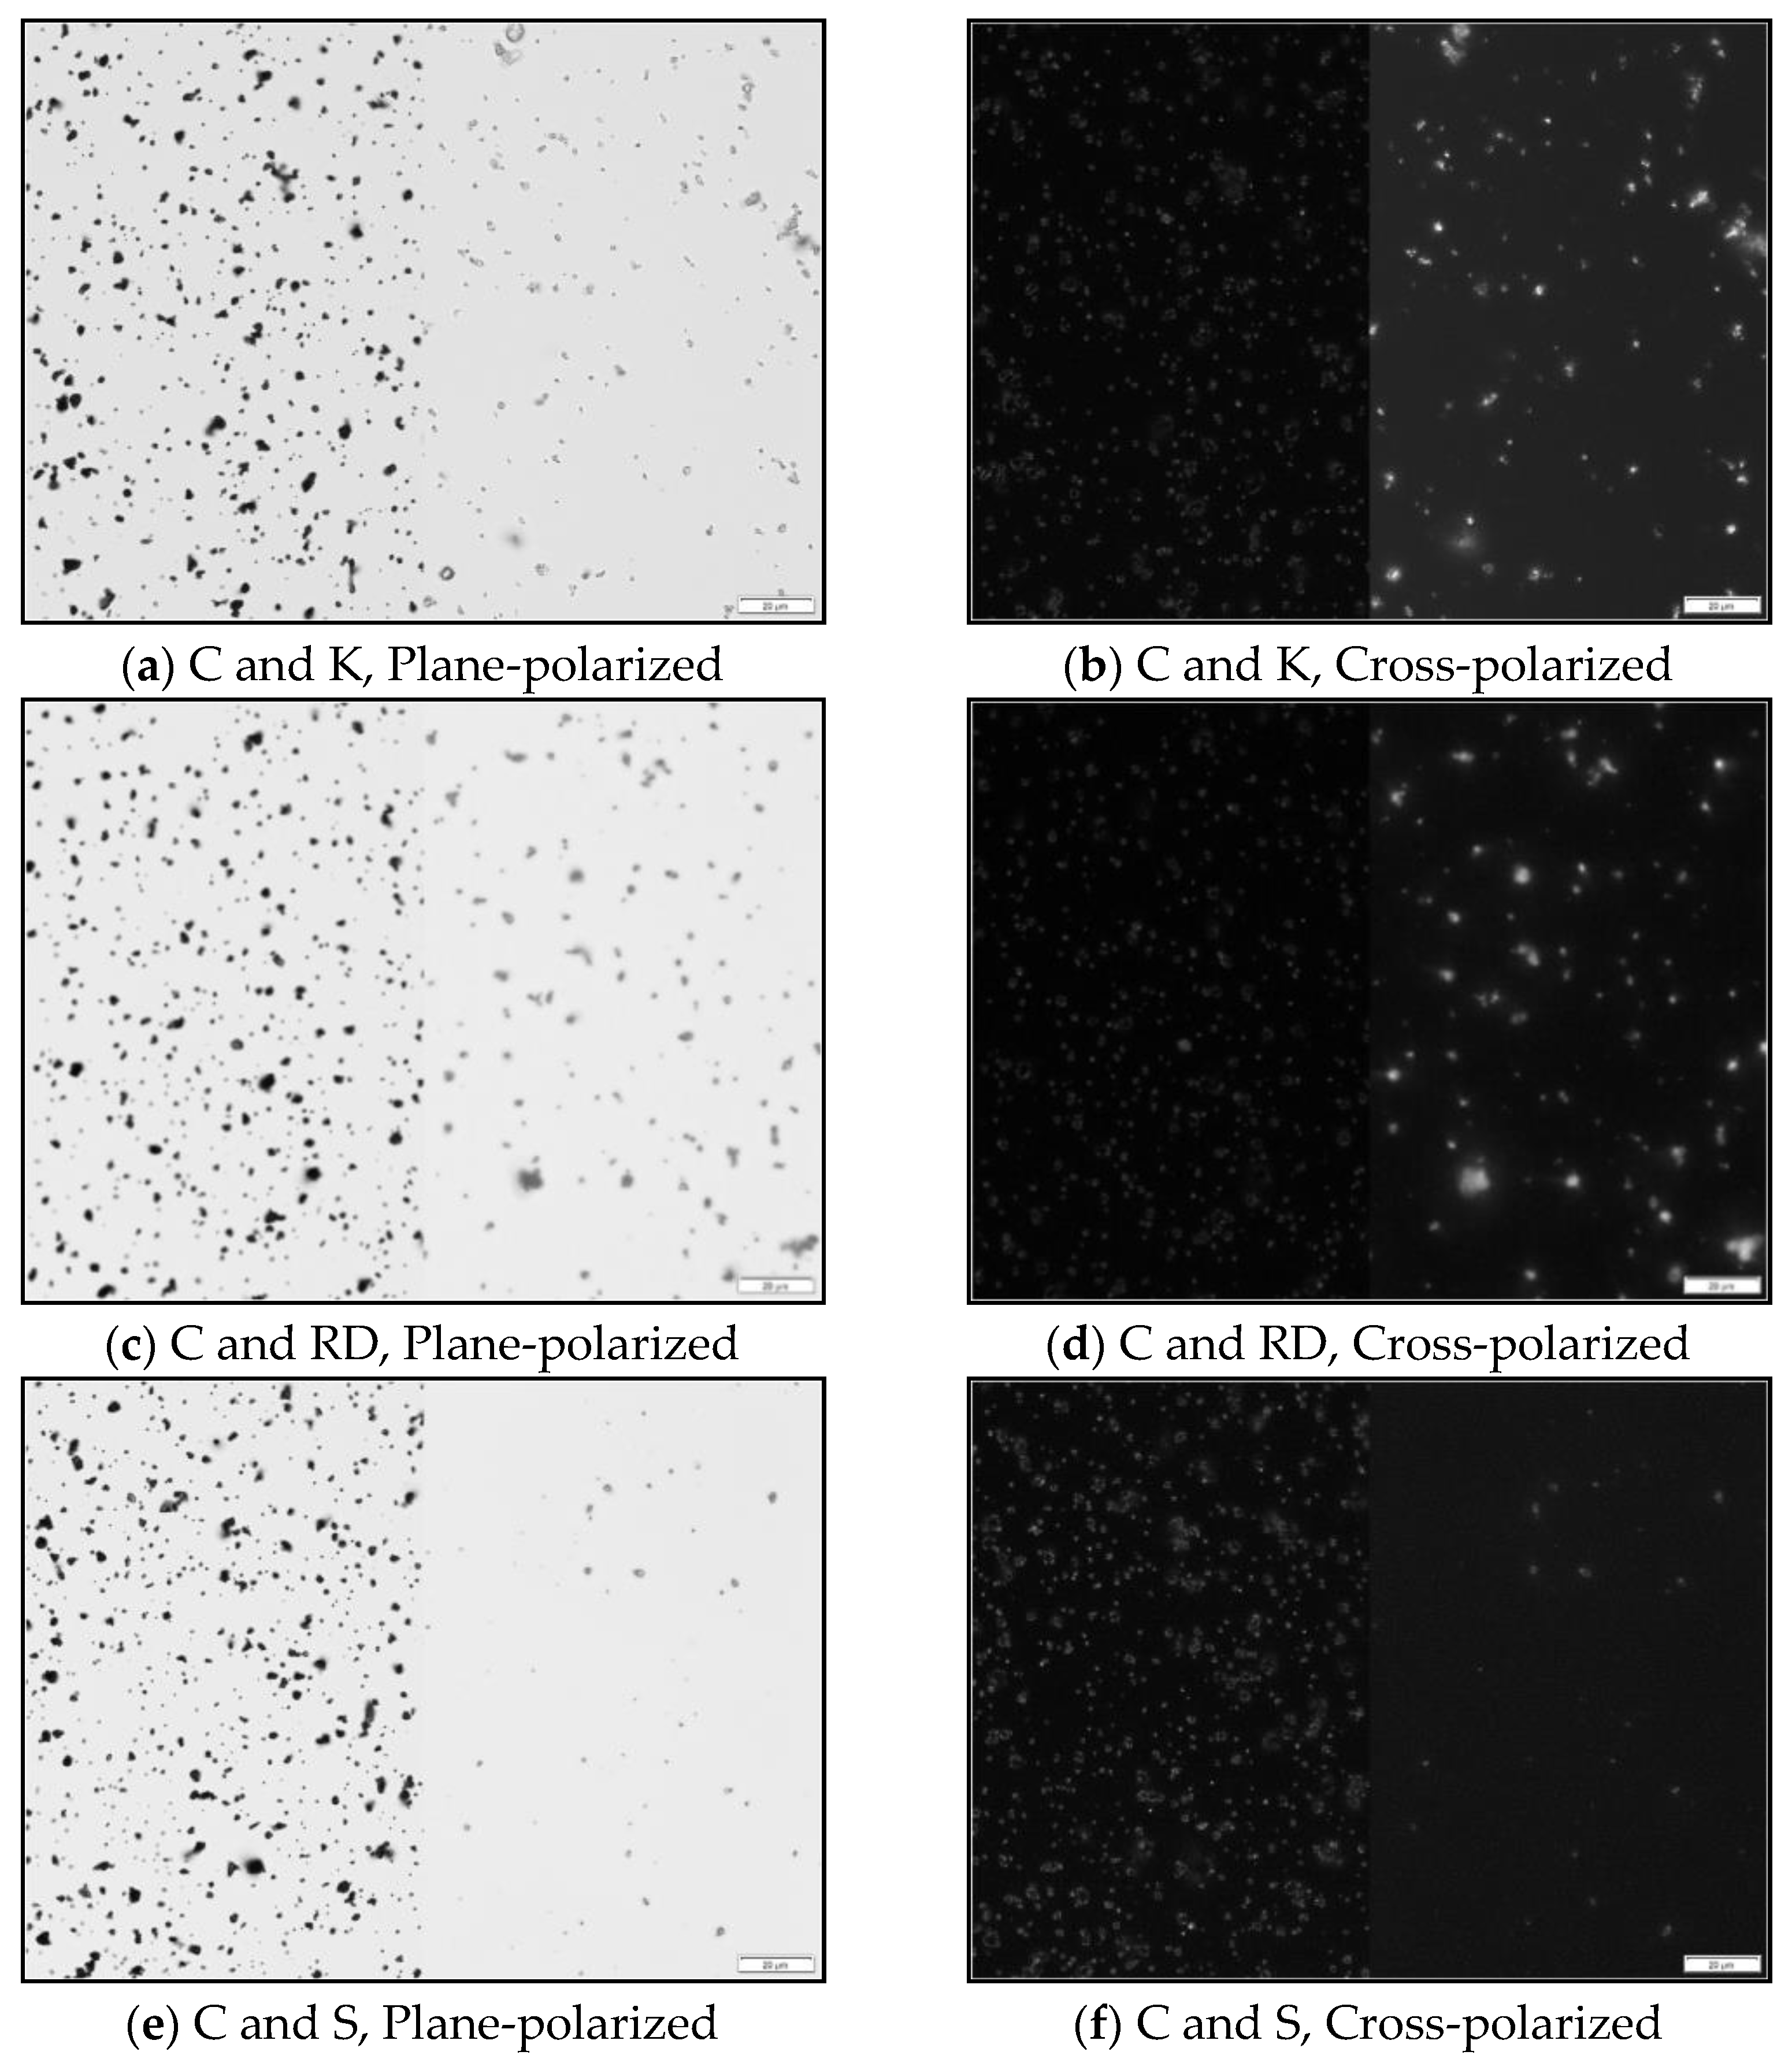
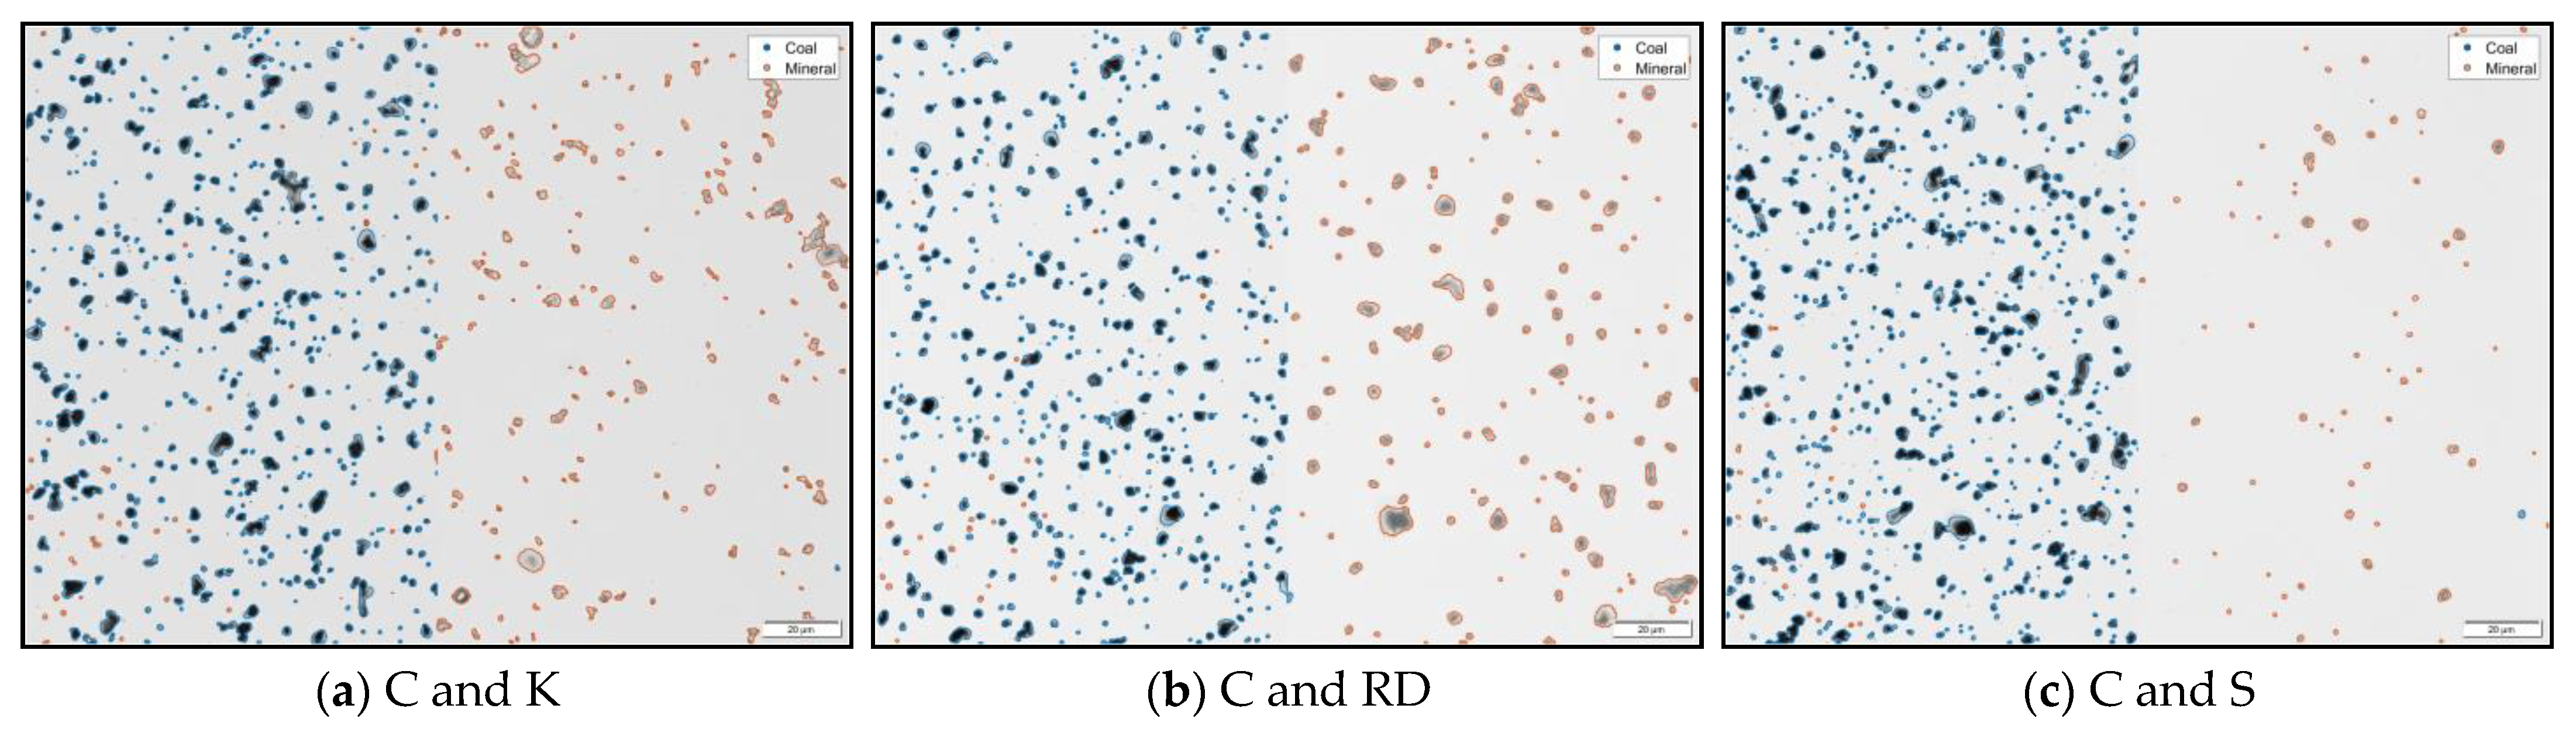
To distinguish between coal and mineral particles, the phenomenon of birefringence was exploited. Under plane-polarized (PP) conditions, both coal and mineral particles can be distinguished from the background. However, under cross-polarized (CP) conditions, only anisotropic materials—such as the mineral types considered here—are clearly visible. Figure 4 illustrates this simple premise: The coal particles (left half of each image) are clearly visible in the PP condition, and are essentially invisible in CP. On the other hand, mineral particles are somewhat more difficult to see in PP, but are clearly visible in CP. Accordingly, a simple additive metric between the PP and CP particle intensities was used to establish a threshold between the coal and mineral particles. For each PP and CP image pair (transmitted or reflected light), the mean greyscale intensity for each particle was summed to determine the “added mean particle intensity” or AMPI.
The AMPI metric was used to build a model for classification of particles as either coal or mineral. For this, the image dataset compiled from the single-material dust samples (including all 150 frames for each material) was split into training and test sets, which were identical for the transmitted and reflected light images. The training dataset contained 90% of the image frames, and the remaining 10% of the frames were reserved to test the model performance. The particle size was limited to 11 pixels (about 1 µm) in Feret diameter (defined as the maximum distance between two parallel tangent planes to the contour of the particle). At this limit, the adaptive thresholding algorithm identified a total of 166,635 particles in the model training dataset and 26,418 particles in the test dataset.
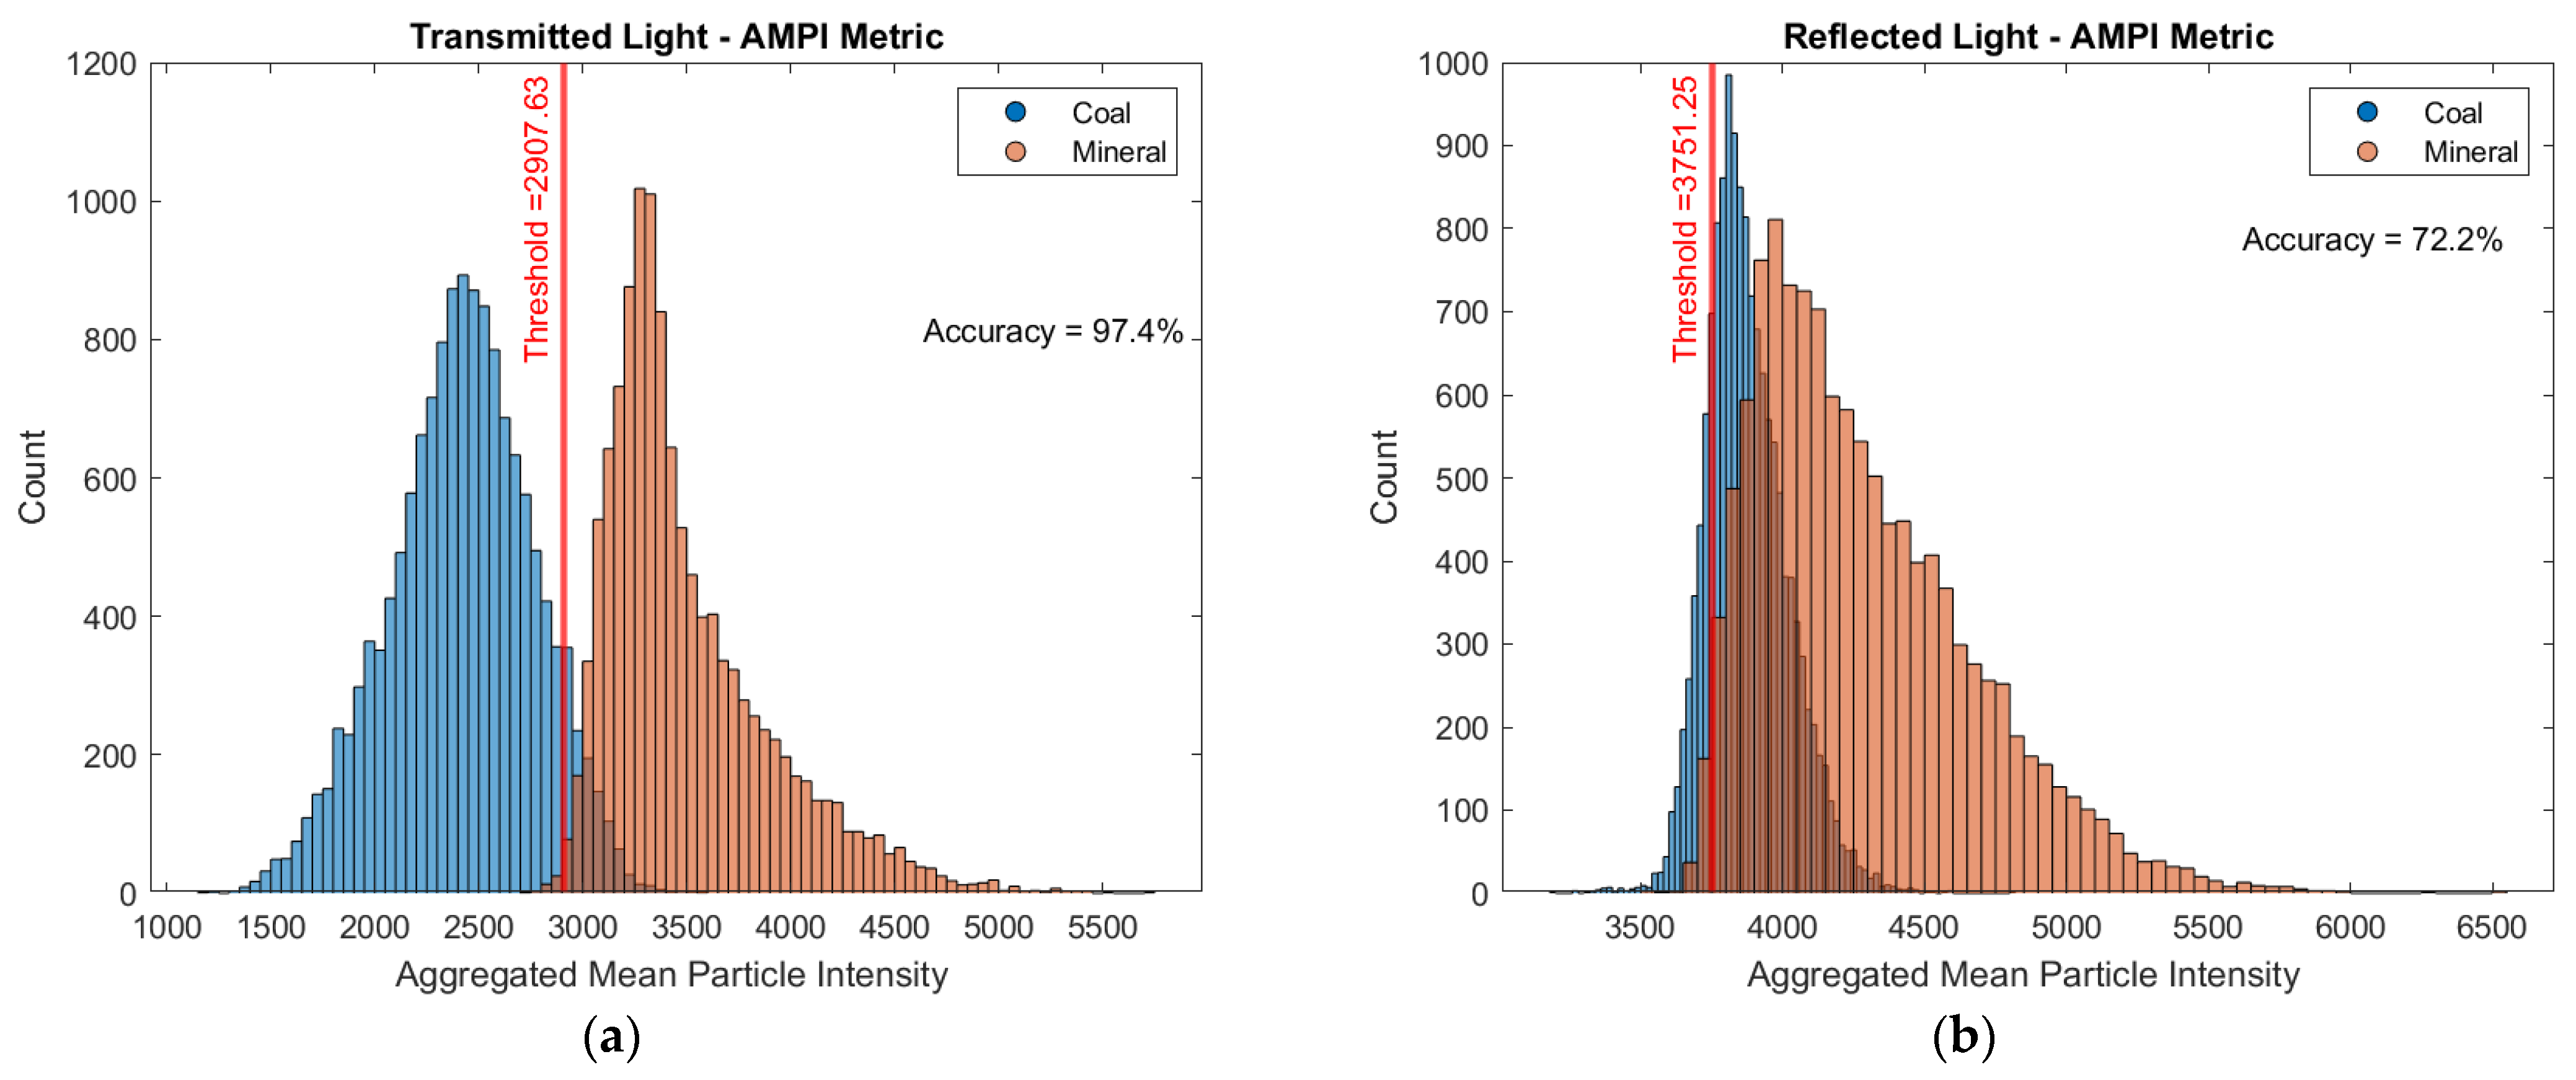
Figure 5 shows the distribution of AMPI values for all coal and mineral (i.e., rock dust, kaolinite, and silica) particles used for model training with both the transmitted and reflected light PP and CP image pairs. The optimal AMPI threshold in both cases was obtained by iteratively selecting a threshold and computing the resulting accuracy (defined as the percentage of particles correctly classified relative to the total number classified by the model). The model using transmitted light images yielded an accuracy of more than 97% (within the training dataset), while the reflected light model yielded about 72% accuracy. Thus, the transmitted light model was selected for further work.
When the transmitted light AMPI model was challenged using the test dataset reserved from the single-material sample frames, an overall accuracy of 95.7% was achieved (Table 2). Of the 26,418 total particles in this dataset, 14,394 (54.5%) were in the C sample frames (and thus presumed to be coal and not mineral) and the other 12,024 (45.5%) were in the RD, K, or S sample frames. The model misclassified 1098 particles from the C sample frames (representing 7.6% of the coal particles), and 52 particles across all the mineral samples (0.4%). The excellent model performance is visually illustrated in Figure 6.
2.4. SEM-EDX Analysis
As described above, concurrent with the collection of dust particles on the glass coverslips for OM, particles were also collected on PC filters for analysis by SEM-EDX. One or two filters from each of the single-material samples, and all three composite sample filters were prepared and analyzed following the procedures detailed in Sarver et al. [19].
Briefly, a 9-mm subsection of the sample filter was carefully cut, and sputter coated with Au/Pd. The samples were analyzed with a FEI Quanta 600 FEG environmental SEM (FEI, Hillsboro, OR, USA) equipped with a Bruker Quantax 400 EDX spectroscope (Bruker, Ewing, NJ, USA). A computer-controlled routine described by Johann-Essex et al. [16] was used to select, size, and classify about 500 particles (1–10 µm) per sample using the classification criteria shown in Table 3. The routine was run using Bruker’s Esprit software (version 1.9), and the following SEM settings: 1000× magnification, 12.5 mm working distance, 15 kV accelerating voltage, 5.5 μm spot size.
Table 4 shows the SEM-EDX classification results, displayed on a percentage area basis, which was calculated by summing the measured area of all the particles in a given class and dividing by the total area of particles in all classes. Results for the single-material samples verify the high-purity of the materials used to generate the dust. As expected, coal particles were primarily classified as carbonaceous and mixed carbonaceous, kaolinite particles were classified as alumino-silicate, rock dust was primarily classified as carbonate, and silica was classified as silica. The composite sample results are also shown in the table and are later compared to the OM results.
3. Results
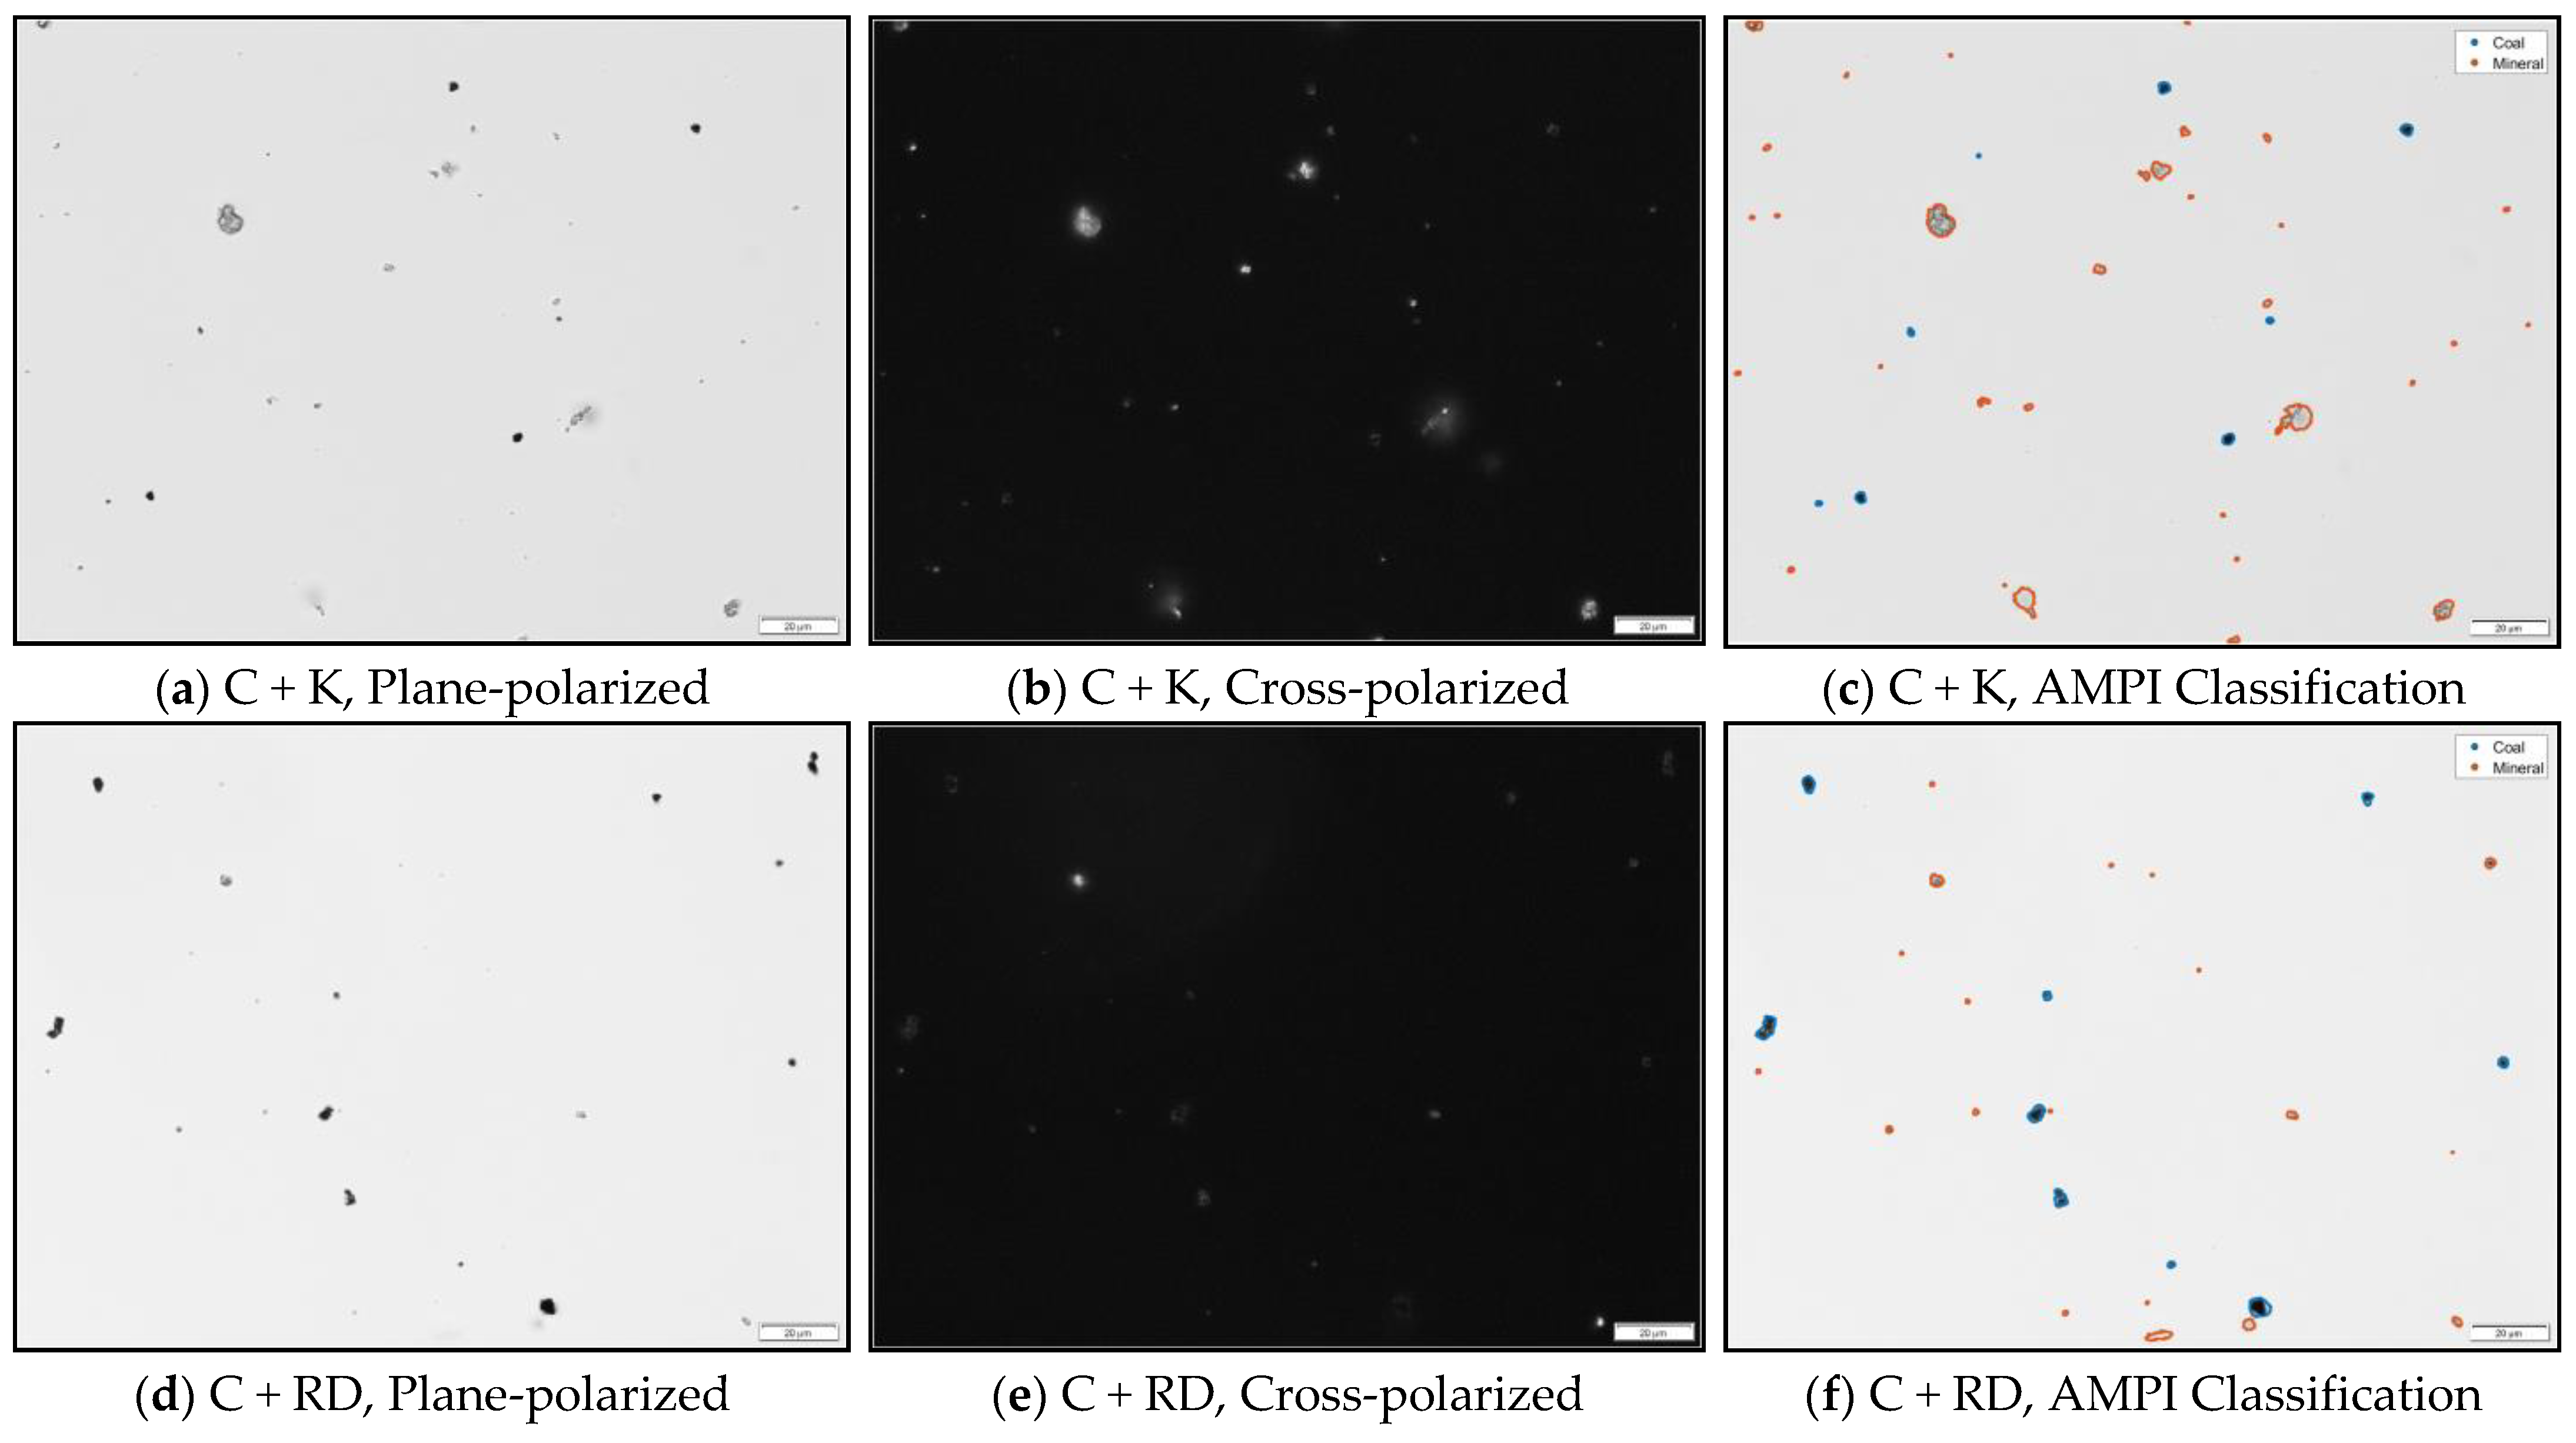
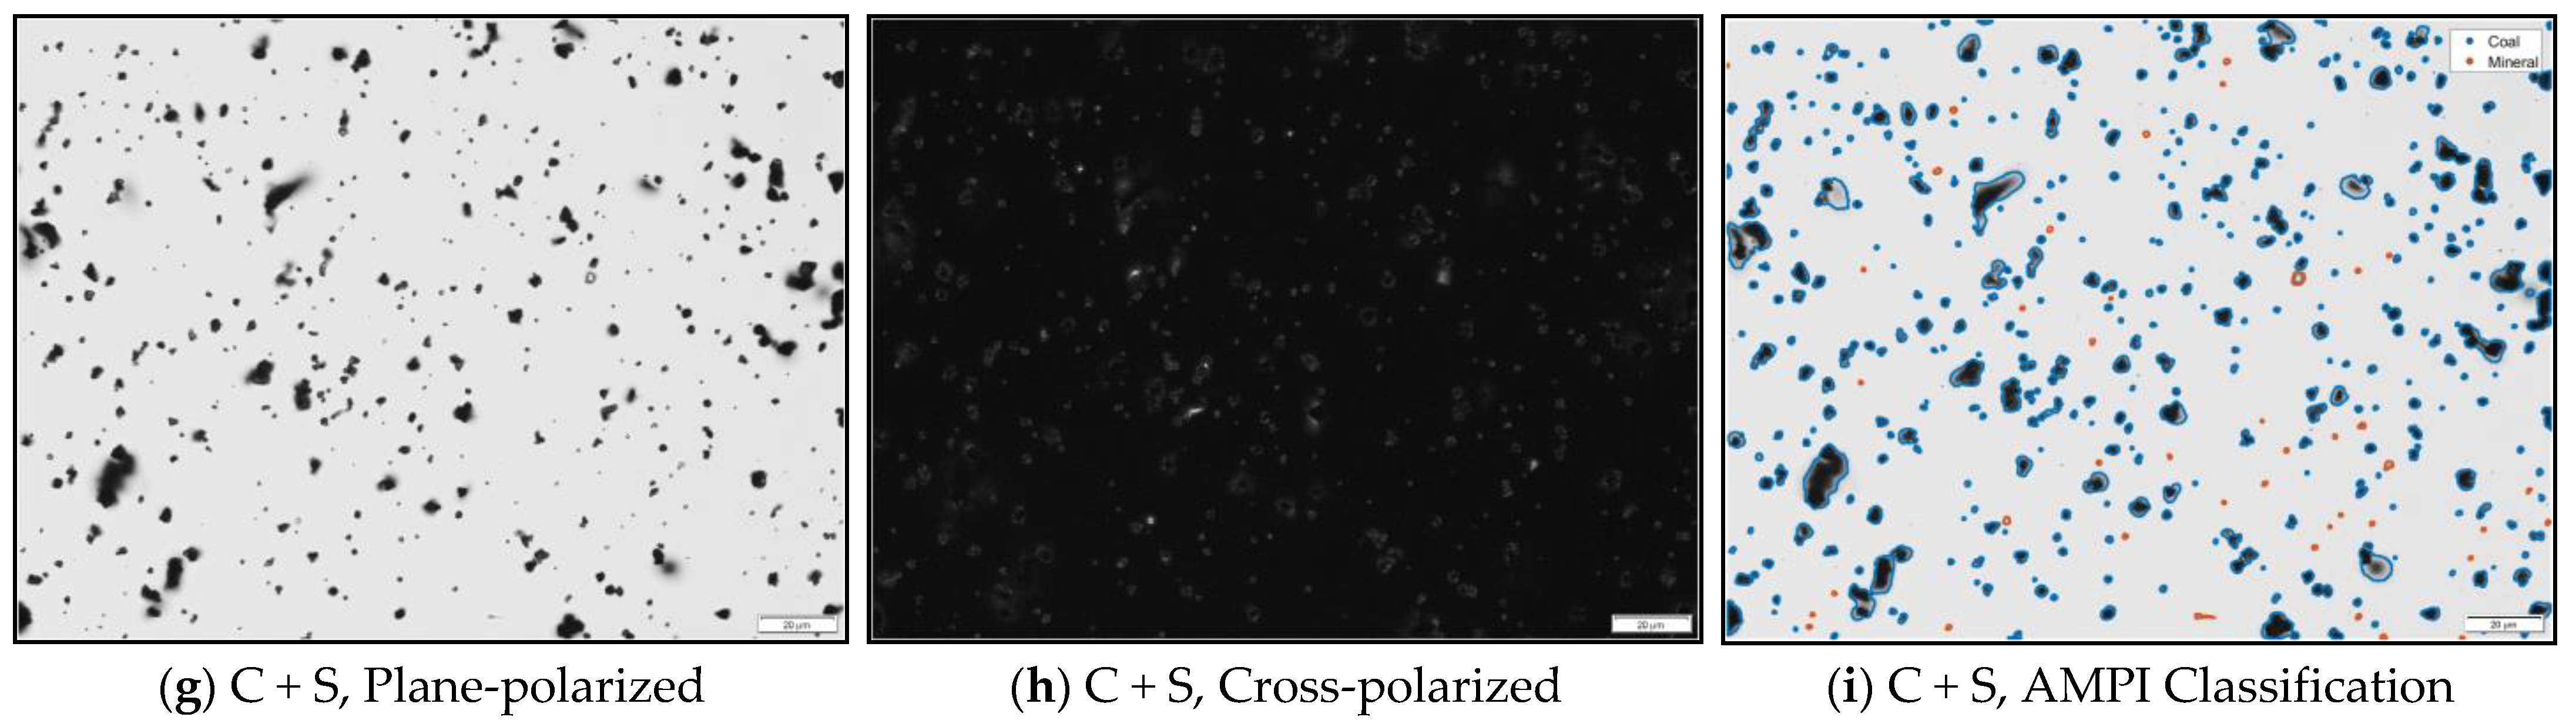
The particle identification algorithm and AMPI classification model were applied to the transmitted light images from all 20 frames analyzed for each of the composite dust samples (i.e., C + RD, C + K, or C + S). Figure 7 shows an example of the results for each composite sample. The left column of the figure shows TPP images, the middle column shows TCP images, and the right column shows the model classification. In the TPP images, particles that exhibit high contrast with the background can be visually identified as coal, and particles that exhibit less contrast are believed to be minerals. In the TCP images, the mineral particles exhibit higher contrast, especially those in the samples containing rock dust and kaolinite. While the silica particles are less birefringent and hence illuminate less intensely in the TCP images, a great benefit of the suggested AMPI approach is that it fundamentally accounts for the change in intensity from TPP to TCP, which enables the classification of silica as mineral.
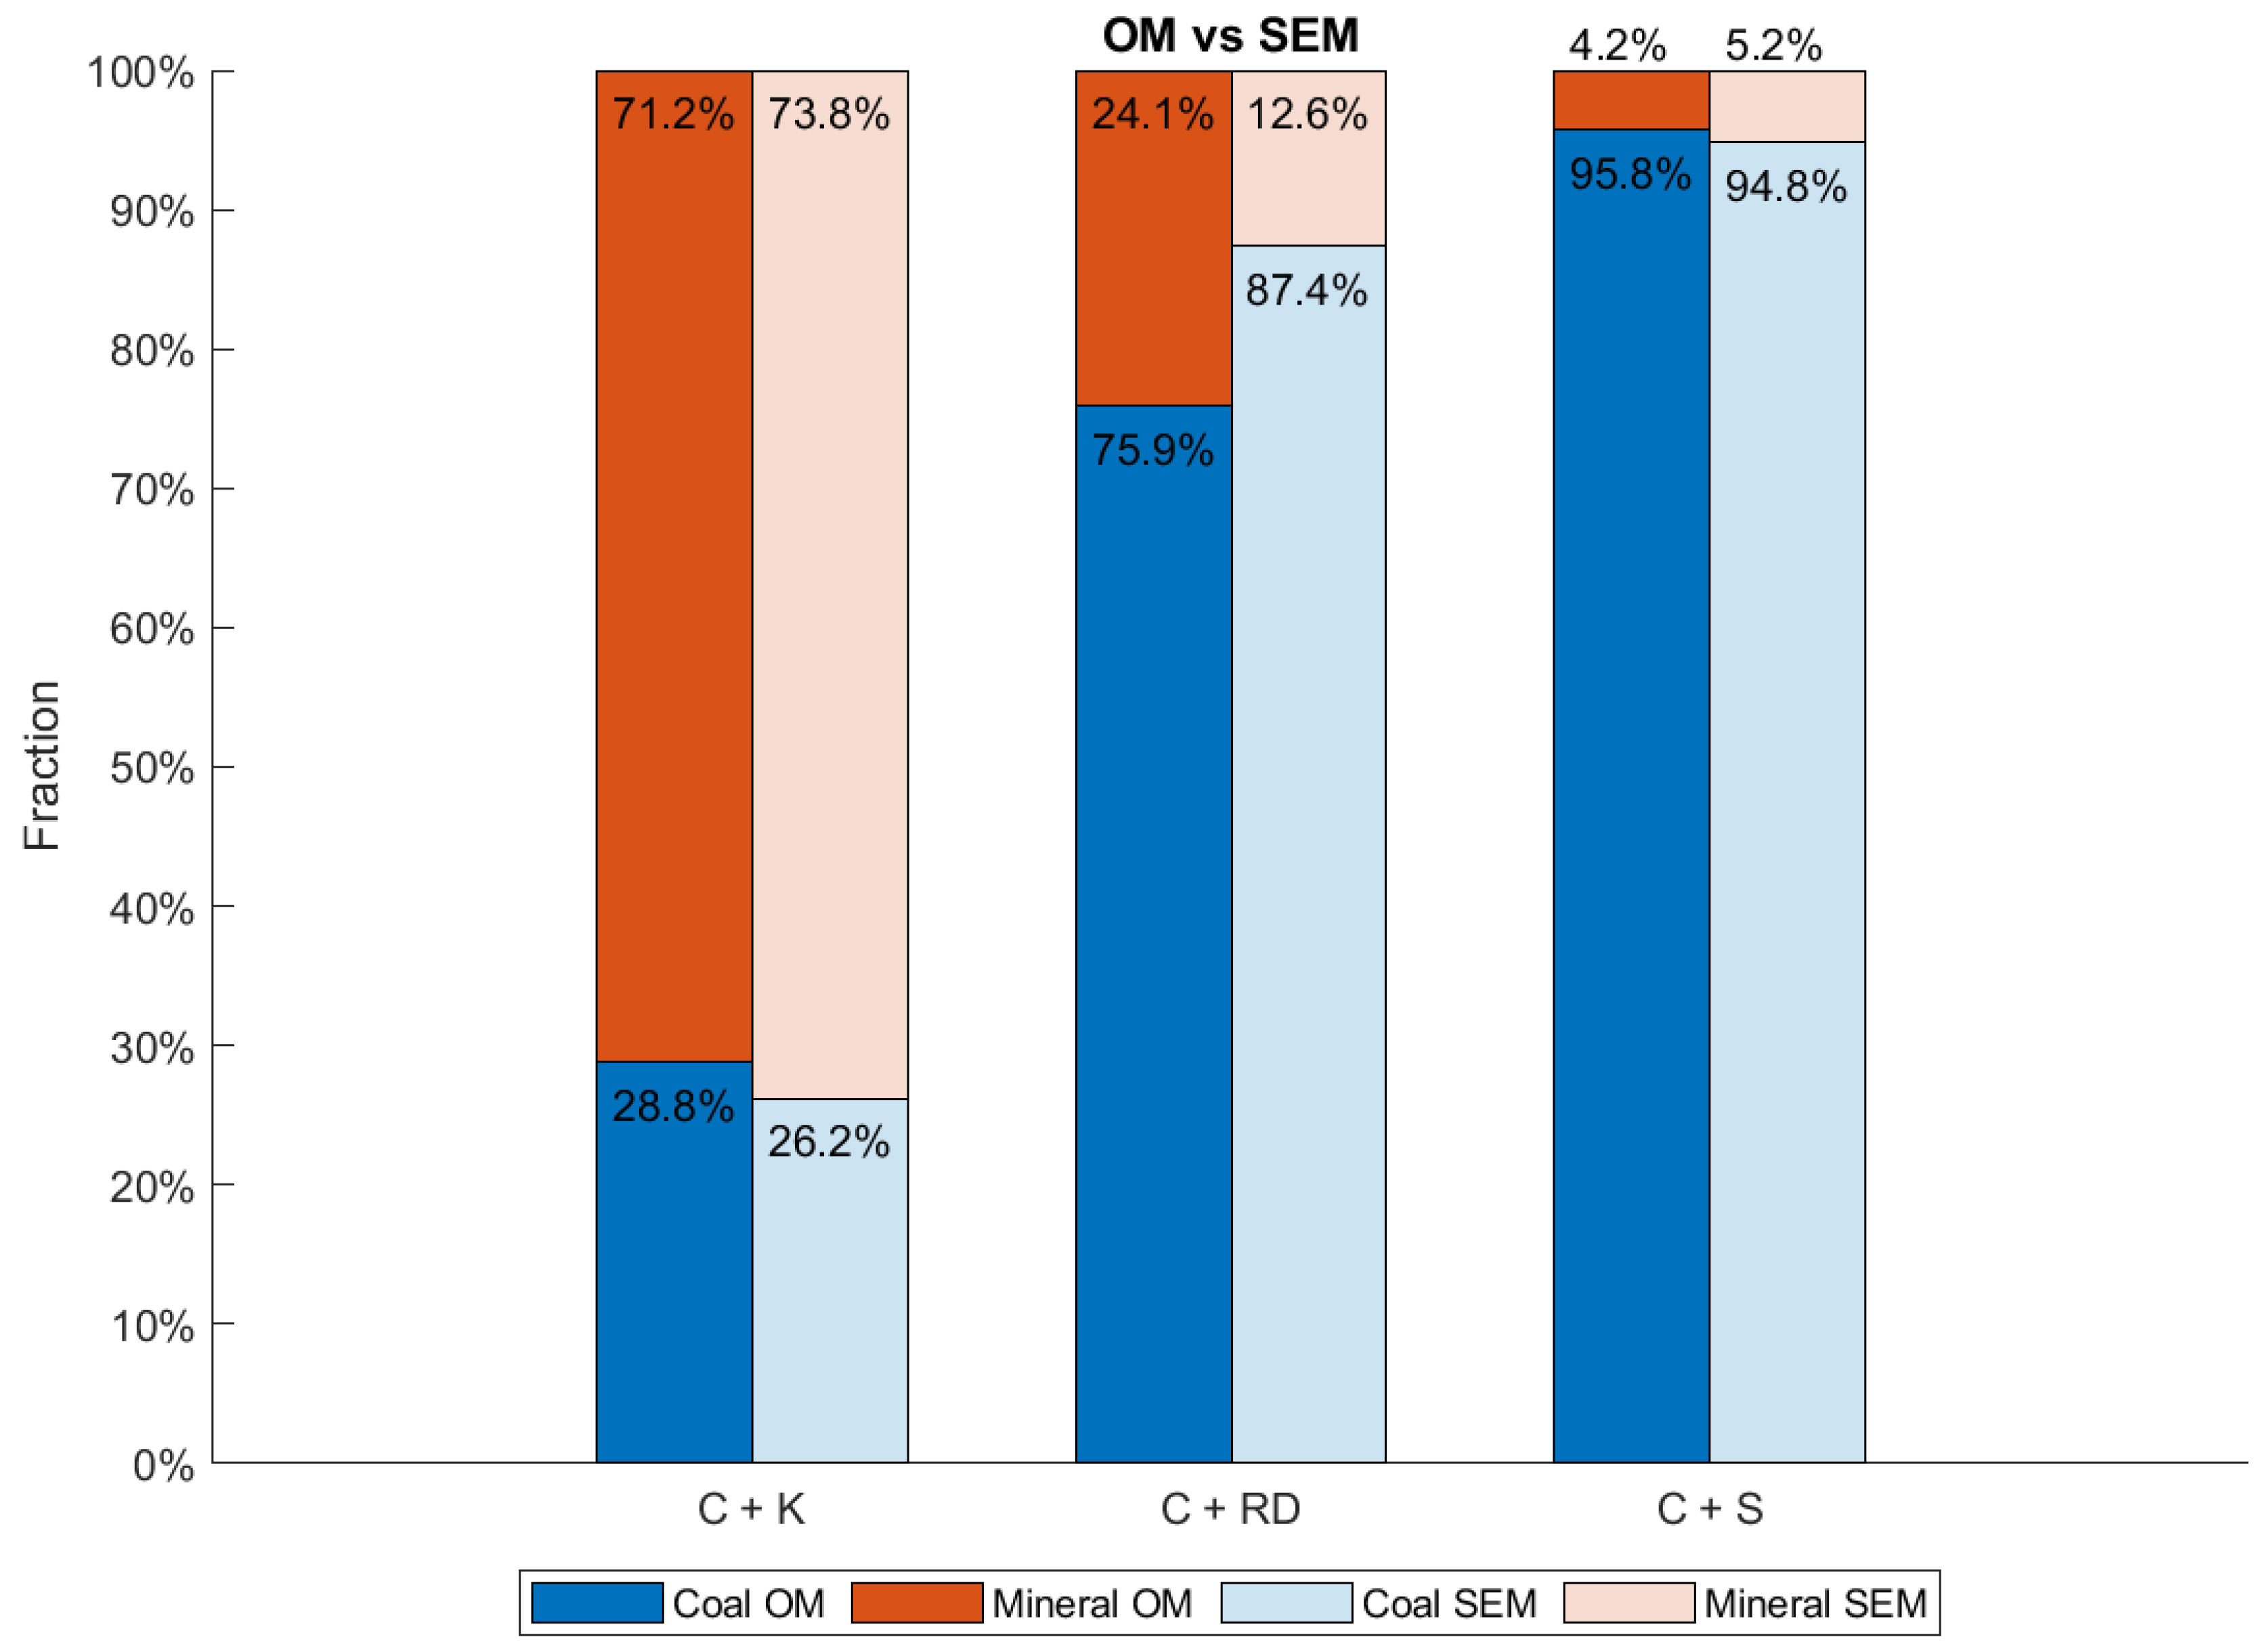
Figure 8 summarizes the classification results for all three composite samples and compares them to the SEM-EDX reference. The OM results represent the classification of all particles identified in the 20 composite frames imaged for each sample. The SEM-EDX data are collapsed from Table 3, with the carbonaceous and mixed carbonaceous classes being summed to yield the coal fraction, and all the other classes being summed to yield the mineral fraction. For both OM and SEM-EDX, the coal and mineral fractions were computed by summing the areas of all particles in each class and dividing by the total area of all the particles identified. Overall, the OM results agree quite favorably with the SEM-EDX output, deviating by only 2.6%, 11.5%, and 1.0% for the C + K, C + RD, and C + S samples, respectively.
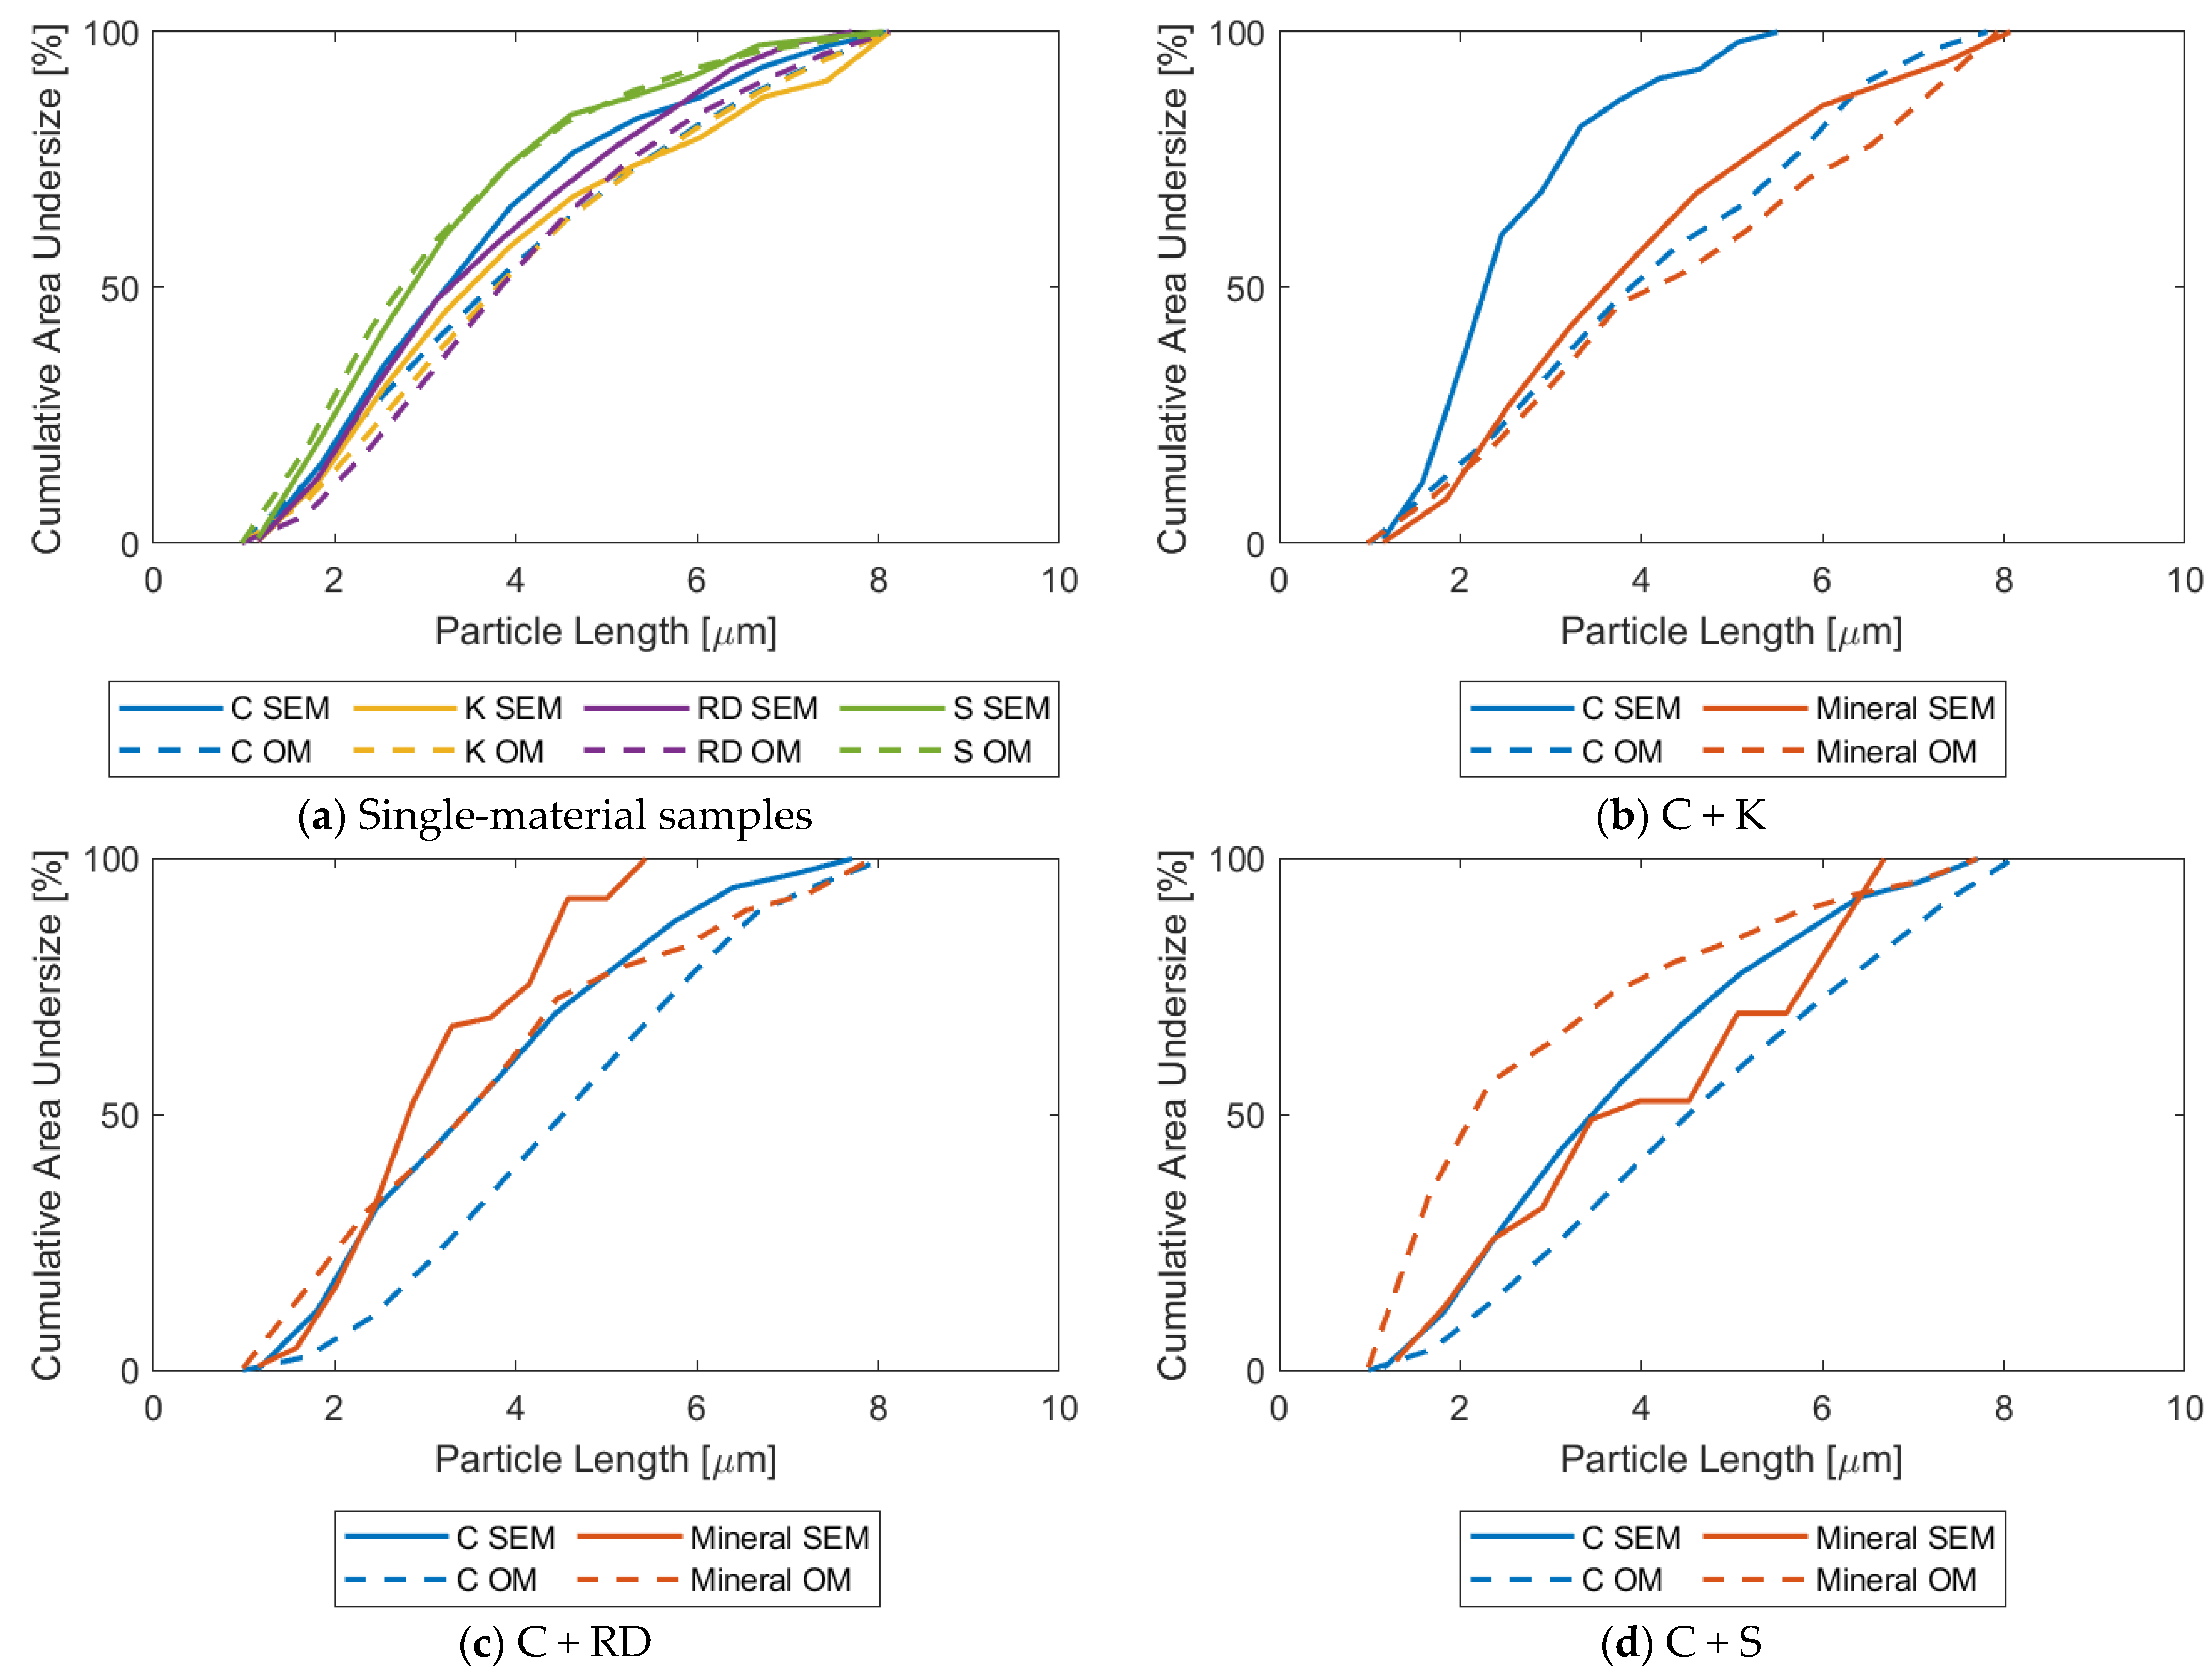
The particle size data derived from the OM and SEM-EDX analyses were also used to construct cumulative particle size distributions (CPSDs) for each dust sample based on the Feret diameter (Figure 9). For the single-material samples (Figure 9a), the CPSDs represent all the particles included in either the OM or SEM-EDX datasets. For the composite samples (Figure 9b–d), separate coal and mineral curves were determined based on the classification results. Again, the OM results compare favorably with the SEM-EDX CPSDs for the single-material samples, particularly those for the three minerals. Here, the average deviation of the experimental results from the SEM-EDX output is 2.3%, 0.3%, 2.9%, and 8.7% for K, RD, S, and C, respectively. For coal, the OM measures the particles as being slightly coarser than the SEM-EDX, which might be related to differences in determining coal versus mineral particle boundaries in the TPP images.
For the composite samples, the OM results do not agree as well with the SEM-EDX output. This performance is most likely an artifact of the much lower particle counts included in the CPSDs for these samples. For example, based on the estimated 3–5% silica in the C + S sample and the total particle counts shown in Table 1 and Table 4, the OM and SEM-EDX mineral curves for this sample only include about 158 and 26 silica particles, respectively. Particle counts were also relatively low for coal in the C + K sample and rock dust in the C + RD sample. Furthermore, it should be noted that any differences in particle deposition during sampling on the glass coverslips used for OM and the PC filters used for SEM-EDX could contribute to discrepancies in the CPSDs derived from the two methods.
4. Discussion
The OM approach demonstrated here for fractionating coal and minerals in respirable dust samples shows real promise. The classification results shown in Figure 8 were obtained with no sample preparation between the dust collection and image acquisition. That is to say, unlike the typical use of birefringence in mineralogy, here the particles are not fixed in resin and polished, nor are any other steps taken to ensure that the mineral particles have their crystal structures oriented in any particular way with respect to the incident light polarity. Moreover, the classification model is relying on a single particle feature (AMPI) that requires just two images. The success of such a simple approach bodes well for the development of an actual field monitoring approach: It is relatively easy to implement and troubleshoot, has low computational costs, and the results are easy to interpret—potentially enabling more rapid scaling of the concept.
This approach might be easily applied underground if a monitoring device can be built using components that are already approved as intrinsically safe (e.g., pumps, lights, batteries) or that do not pose specific safety hazards (e.g., cyclones, glass slides, objective lenses, polarization filters). A real-time application will require a control system to collect and analyze the samples automatically. In this case, the circuits and electrical components need to be designed to avoid and dissipate heat or spark energy, and would require testing and certification by MSHA for US mines.
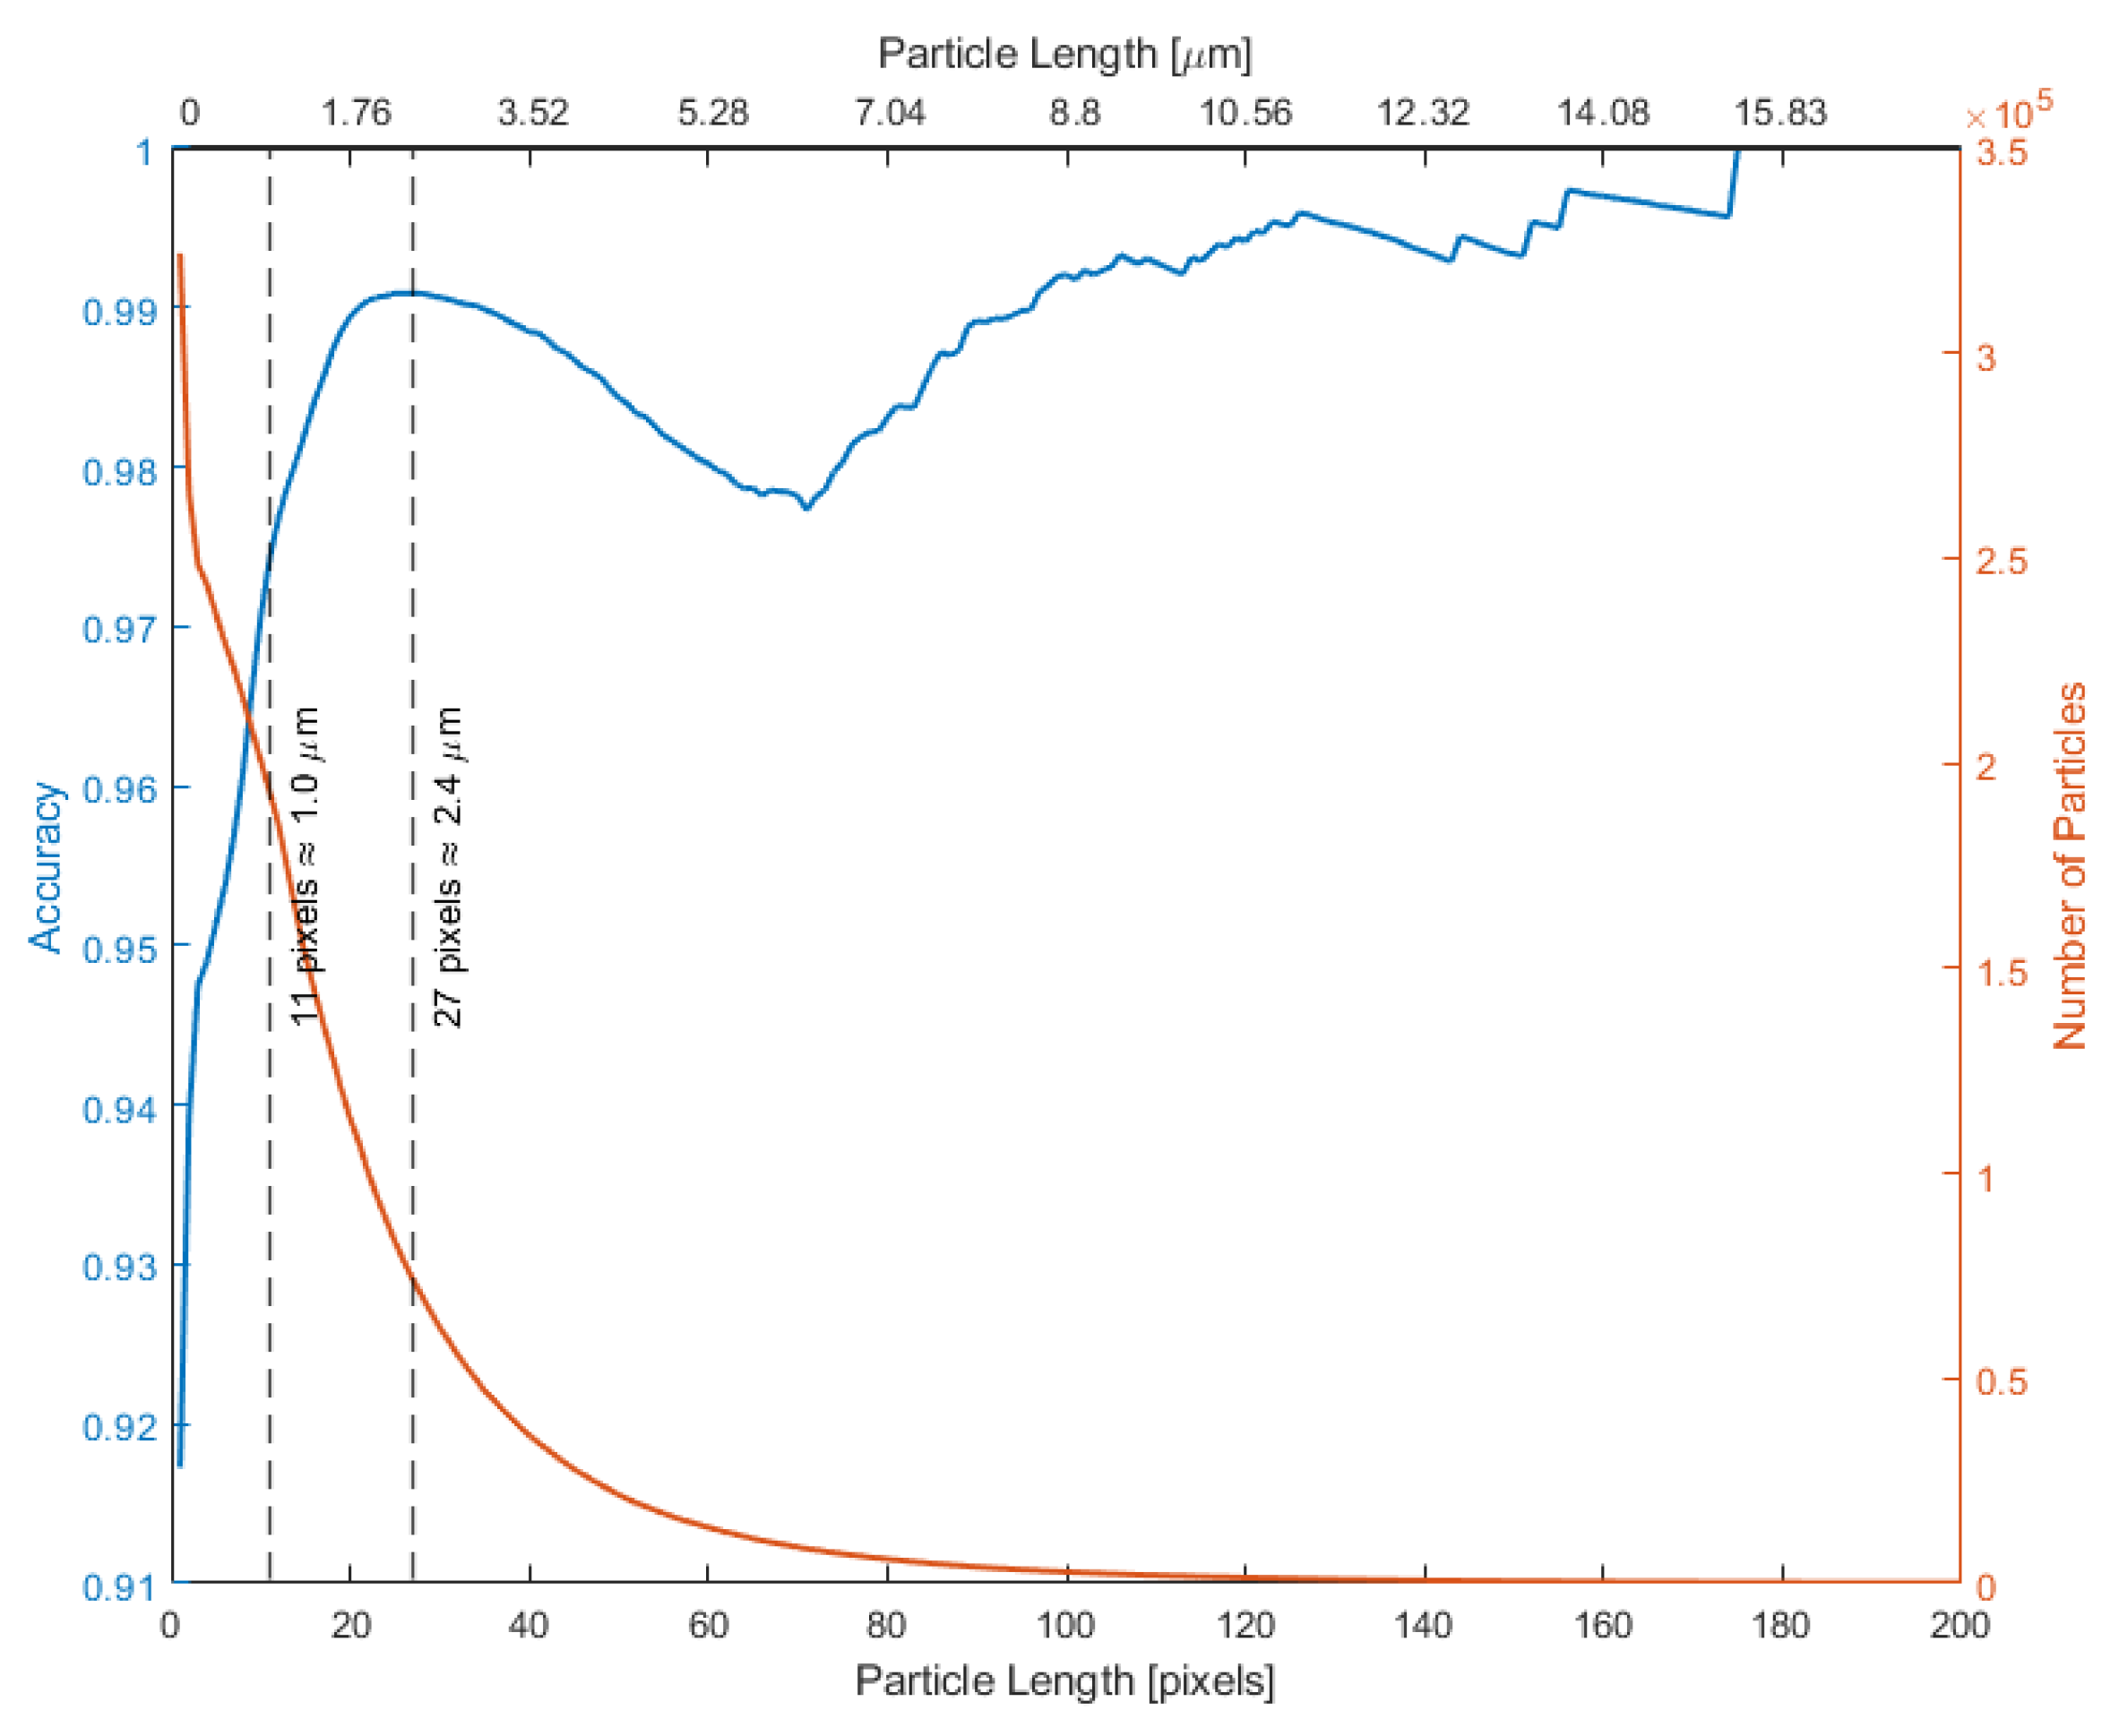
All that said, possible improvements to the current approach should also be considered. For example, while a ~1-µm lower size limit was imposed on particle length to build and apply the AMPI classification model (i.e., such that results could be directly compared with those from the SEM-EDX method), increasing this limit somewhat might improve the model accuracy. Figure 10 shows the expected AMPI model accuracy as a function of minimum particle size. The figure was generated using the same single-material sample images used to build the original model, by setting a series of lower size threshold values and iteratively training the model at each instance. For the training dataset used in this study, the maximum model accuracy predicted is about 99% at the lower particle size limit of about 27 pixels (2.4 µm). Incidentally, the application of the ~2.4-µm model to the three composite samples analyzed here would not significantly change the OM classification results shown in Figure 8.
Other routes to the improved classification performance could include the use of additional particle features, such as particle texture and directionality of pixel intensities across particles. For instance, microscope observations on mineral samples showed dark, pronounced particle outlines (or Becke lines [33]) and relatively high variability in pixel intensities across particles. In contrast, coal particles showed a uniform dark appearance.
The non-uniform deposition of particles on the filter has been recognized as a factor that influences air sample representativeness. The deposition of larger particles in the central area of the filter can occur due to high flow rates through the inlet of the sample cassette [34]. The glass coverslip used for the OM analysis was attached to the filter in the central area. On the other hand, the area of the filter sampled for the SEM analysis was towards the edge. Thus, coarser particles may deposit on the coverslip compared to the OM approach, and this may explain the differences between OM and SEM results. Future work should concentrate on testing the proposed approach using real-world coal mine dust samples and validating the results against the methods currently available for characterizing RCMD.
Finally, it is worth mentioning that, while particle agglomeration generally did not appear to be a problem for the samples included in the current study, agglomeration would present obvious limitations for an OM-based dust monitor. Not only can agglomeration make particle identification more difficult since boundaries are obscured, but it might also confuse classification efforts when particles’ optical properties interfere with one another. Thus, a key consideration for building a semi-continuous monitor must be how to control the particle loading density on the sampling and imaging substrate.
5. Conclusions
Monitoring technologies that enable the measurement of specific respirable coal mine dust (RCMD) components, in near real time are needed. Therefore, the potential of using optical microscopy (OM) to meet this need has not been explored. The results presented here are promising showing that, at least in a laboratory environment, the OM method with automated image processing can provide accurate quantification of the coal and mineral fractions RCMD. Such information could be quite valuable, particularly near the mine production face where dust generation is high and understanding the relative contributions of coal and rock strata would allow quick interventions with respect to dust control and exposure prevention.
The OM approach demonstrated here requires just two images of dust particles on a glass substrate—one in plane-polarized light and the other in cross-polarized light—and a set of training data. No sample preparation is needed. Accordingly, the implementation of this approach in the field can certainly be envisioned with a careful selection of the key components: A suitable camera, objective lens, and polarization filters, along with a light source, programmable dust sampler, and battery. Given the rapid advances in “cell phone microscopy” and existing intrinsically safe hardware for coal mines, these seem feasible.
Finally, it should be mentioned that no attempt was made here to subclassify the minerals, though this would be valuable—especially for silica. To this end, future work should also consider how to exploit the differences between topological and/or optical features of the primary mineral types expected in RCMD.
Author Contributions
Conceptualization, E.S., N.S. and J.R.S.; methodology, E.S., N.S. and J.R.S.; modeling, N.S.; validation, N.S. and C.K.; formal analysis, N.S.; data curation, N.S.; writing—original draft preparation, N.S. and E.S.; writing—review and editing, N.S., E.S., C.K. and J.R.S.; visualization, N.S.; supervision, E.S. and J.R.S.; project administration, E.S.; funding acquisition, E.S. All authors have read and agreed to the published version of the manuscript.
Funding
This research was funded by the Alpha Foundation for the Improvement of Mine Safety and Health, grant number AFC316FO-74.
Acknowledgments
The authors wish to thank the Alpha Foundation for funding our work, and our industry partners for providing the dust materials used in this study. The views expressed here are those of the authors and do not necessarily represent the research sponsors or partners.
Conflicts of Interest
The authors declare no conflict of interest.
References
- Si, S.; Carey, R.; Reid, A.; Driscoll, T.; Glass, D.; Peters, S.; Benke, G.; Darcey, E.; Fritschi, L. The Australian Work Exposures Study: Prevalence of Occupational Exposure to Respirable Crystalline Silica. Ann. Occup. Hyg. 2016, 60, 631–637. [Google Scholar] [CrossRef] [PubMed]
- Poinen-Rughooputh, S.; Rughooputh, M.S.; Guo, Y.; Rong, Y.; Chen, W. Occupational exposure to silica dust and risk of lung cancer: An updated meta-analysis of epidemiological studies. BMC Public Health 2016, 16, 1–17. [Google Scholar] [CrossRef] [Green Version]
- Zosky, G.R.; Hoy, R.F.; Silverstone, E.J.; Brims, F.J.; Miles, S.; Johnson, A.R.; Gibson, P.G.; Yates, D.H. Coal workers’ pneumoconiosis: An Australian perspective. Med. J. Aust. 2016, 204, 414–418. [Google Scholar] [CrossRef] [PubMed]
- Mischler, S.E.; Cauda, E.G.; Di Giuseppe, M.; McWilliams, L.J.; St. Croix, C.; Sun, M.; Franks, J.; Ortiz, L.A. Differential activation of RAW 264.7 macrophages by size-segregated crystalline silica. J. Occup. Med. Toxicol. 2016, 11, 57. [Google Scholar] [CrossRef] [PubMed] [Green Version]
- Blackley, D.J.; Crum, J.B.; Halldin, C.N.; Storey, E.; Laney, A.S. Resurgence of Progressive Massive Fibrosis in Coal Miners—Eastern Kentucky. MMWR Morb. Mortal. Wkly. Rep. 2016, 65, 1385–1389. [Google Scholar] [CrossRef] [PubMed] [Green Version]
- Graber, J.M.; Harris, G.; Almberg, K.S.; Rose, C.S.; Petsonk, E.L.; Cohen, R.A. Increasing Severity of Pneumoconiosis Among Younger Former US Coal Miners Working Exclusively Under Modern Dust-Control Regulations. J. Occup. Environ. Med. 2017, 59, e105–e111. [Google Scholar] [CrossRef] [PubMed]
- Laney, A.S.; Blackley, D.J.; Halldin, C.N. Radiographic disease progression in contemporary US coal miners with progressive massive fibrosis. Occup. Environ. Med. 2017, 74, 517–520. [Google Scholar] [CrossRef]
- Beer, C.; Kolstad, H.A.; Søndergaard, K.; Bendstrup, E.; Heederik, D.; Olsen, K.E.; Omland, Ø.; Petsonk, E.; Sigsgaard, T.; Sherson, D.L.; et al. A systematic review of occupational exposure to coal dust and the risk of interstitial lung diseases. Eur. Clin. Respir. J. 2017, 4, 1264711. [Google Scholar] [CrossRef]
- Almberg, K.S.; Halldin, C.N.; Blackley, D.J.; Laney, A.S.; Storey, E.; Rose, C.S.; Go, L.H.T.; Cohen, R.A. Progressive Massive Fibrosis Resurgence Identified in U.S. Coal Miners Filing for Black Lung Benefits, 1970–2016. Ann. Am. Thorac. Soc. 2018, 15, 1420–1426. [Google Scholar] [CrossRef]
- Blackley, D.J.; Reynolds, L.E.; Short, C.; Carson, R.; Storey, E.; Halldin, C.N.; Laney, A.S. Progressive Massive Fibrosis in Coal Miners From 3 Clinics in Virginia. JAMA 2018, 319, 500–501. [Google Scholar] [CrossRef]
- Doney, B.C.; Blackley, D.; Hale, J.M.; Halldin, C.; Kurth, L.; Syamlal, G.; Laney, A.S. Respirable coal mine dust in underground mines, United States, 1982–2017. Am. J. Ind. Med. 2019, 62, 478–485. [Google Scholar] [CrossRef] [PubMed]
- Liu, T.; Liu, S. The impacts of coal dust on miners’ health: A review. Environ. Res. 2020, 190, 109849. [Google Scholar] [CrossRef]
- Cohen, R.A.; Petsonk, E.L.; Rose, C.; Young, B.; Regier, M.; Najmuddin, A.; Abraham, J.L.; Churg, A.; Green, F.H.Y. Lung Pathology in U.S. Coal Workers with Rapidly Progressive Pneumoconiosis Implicates Silica and Silicates. Am. J. Respir. Crit. Care Med. 2016, 193, 673–680. [Google Scholar] [CrossRef] [PubMed] [Green Version]
- Jelic, T.M.; Estalilla, O.C.; Sawyer-Kaplan, P.R.; Plata, M.J.; Powers, J.T.; Emmett, M.; Kuenstner, J.T. Coal Mine Dust Desquamative Chronic Interstitial Pneumonia: A Precursor of Dust-Related Diffuse Fibrosis and of Emphysema. Int. J. Occup. Environ. Med. 2017, 8, 153–165. [Google Scholar] [CrossRef] [Green Version]
- National Academies of Sciences, Engineering and Medicine. Monitoring and Sampling Approaches to Assess Underground Coal Mine Dust Exposures; National Academies of Sciences, Engineering and Medicine: Washington, DC, USA, 2018. [Google Scholar]
- Johann-Essex, V.; Keles, C.; Sarver, E. A Computer-Controlled SEM-EDX Routine for Characterizing Respirable Coal Mine Dust. Minerals 2017, 7, 15. [Google Scholar] [CrossRef] [Green Version]
- Johann-Essex, V.; Keles, C.; Rezaee, M.; Scaggs-Witte, M.; Sarver, E. Respirable coal mine dust characteristics in samples collected in central and northern Appalachia. Int. J. Coal Geol. 2017, 182, 85–93. [Google Scholar] [CrossRef]
- Phillips, K.; Keles, C.; Scaggs-Witte, M.; Johann-Essex, V.; Rezaee, M.; Sarver, E. Comparison of Coal vs. Mineral Mass Fractions in Respirable Dust in Appalachian Coal Mines. In Proceedings of the 16th North American Mine Ventilation Symposium, Golden, CO, USA, 17–22 June 2017; pp. 7.1–7.9. [Google Scholar]
- Sarver, E.; Keles, C.; Rezaee, M. Beyond conventional metrics: Comprehensive characterization of respirable coal mine dust. Int. J. Coal Geol. 2019, 207, 84–95. [Google Scholar] [CrossRef]
- Mining Publication: Performance of a New Personal Respirable Dust Monitor for Mine Use. Available online: https://www.cdc.gov/niosh/mining/works/coversheet1719.html (accessed on 27 July 2021).
- Cauda, E.; Miller, A.; Drake, P. Promoting early exposure monitoring for respirable crystalline silica: Taking the laboratory to the mine site. J. Occup. Environ. Hyg. 2016, 18, D39–D45. [Google Scholar] [CrossRef] [PubMed] [Green Version]
- Winchell, N.H.; Winchell, A.N. Elements of Optical Mineralogy: An Introduction to Microscopic Petrography, with Description of All Minerals Whose Optical Elements Are Known and Tables Arranged for Their Determination Microscopically; D. Van Nostrand: New York, NY, USA, 1909; pp. 41–100. [Google Scholar]
- Whitbread, I.K. Petrography. In Encyclopedia of Geoarchaeology; Gilbert, A.S., Ed.; Springer: Dordrecht, The Netherlands, 2017; pp. 660–664. [Google Scholar]
- Koval, S.; Krahenbuhl, G.; Warren, K.; O’Brien, G. Optical microscopy as a new approach for characterising dust particulates in urban environment. J. Environ. Manag. 2018, 223, 196–202. [Google Scholar] [CrossRef]
- O’Brien, G.; Gu, Y.; Adair, B.J.I.; Firth, B. The use of optical reflected light and SEM imaging systems to provide quantitative coal characterisation. Miner. Eng. 2011, 24, 1299–1304. [Google Scholar] [CrossRef]
- Vallurupalli, S.; Chawla, K.; Kupfer, Y.; Tessler, S. Mixed dust pneumoconiosis occurring in an unusual setting. BMJ Case Rep. 2013, bcr2013200976. [Google Scholar] [CrossRef] [Green Version]
- Breslauer, D.N.; Maamari, R.N.; Switz, N.A.; Lam, W.A.; Fletcher, D.A. Mobile Phone Based Clinical Microscopy for Global Health Applications. PLoS ONE 2009, 4, e006320. [Google Scholar] [CrossRef]
- D’Ambrosio, M.V.; Bakalar, M.; Bennuru, S.; Reber, C.; Skandarajah, A.; Nilsson, L.; Switz, N.; Kamgno, J.; Pion, S.; Boussinesq, M.; et al. Point-of-care quantification of blood-borne filarial parasites with a mobile phone microscope. Sci. Transl. Med. 2015, 7, 286re4. [Google Scholar] [CrossRef] [PubMed] [Green Version]
- Jagannadh, V.K.; Srinivasan, R.; Gorthi, S.S. A semi-automated, field-portable microscopy platform for clinical diagnostic applications. AIP Adv. 2015, 5, 084902. [Google Scholar] [CrossRef] [Green Version]
- Kuroda, A.; Alexandrov, M.; Nishimura, T.; Ishida, T. Rapid on-site detection of airborne asbestos fibers and potentially hazardous nanomaterials using fluorescence microscopy-based biosensing. Biotechnol. J. 2016, 11, 757–767. [Google Scholar] [CrossRef] [PubMed]
- Lou, W.; Zhang, D.; Bayless, R.C. Review of mineral recognition and its future. Appl. Geochem. 2020, 122, 104727. [Google Scholar] [CrossRef]
- Bradley, D.; Roth, G. Adaptive Thresholding using the Integral Image. J. Graph. Tools 2007, 12, 13–21. [Google Scholar] [CrossRef]
- Delly, J.G. Essentials of Polarized Light Microscopy, 1st ed.; Hooke College of Applied Sciences: Westmont, IL, USA, 2007; pp. 183–187. [Google Scholar]
- NIOSH Manual of Analytical Methods (NMAM) 5th Edition. Available online: https://www.cdc.gov/niosh/nmam/default.html (accessed on 27 July 2021).
Figure 1.
Conceptual illustration of major RCMD sources and particle types.

Figure 2.
Sample preparation methods.

Figure 3.
(a) Optical microscope setup; (b) four images obtained for each frame.

Figure 4.
Examples of dual images collected under (a,c,e) TPP lighting conditions and (b,d,f) TCP lighting conditions. The left-hand side of each image contains only coal dust particles and the right-hand side contains only mineral particles. Sample types are abbreviated as C: Coal; K: Kaolinite; RD: Rock dust; and S: Silica.

Figure 5.
Added mean particle intensity (AMPI) distributions for coal and mineral particles in the training datasets using (a) transmitted and (b) reflected PP and CP image pairs. The distribution includes the same 166,635 particles in both plots, with a lower size limit of 11 pixels.
Figure 5.
Added mean particle intensity (AMPI) distributions for coal and mineral particles in the training datasets using (a) transmitted and (b) reflected PP and CP image pairs. The distribution includes the same 166,635 particles in both plots, with a lower size limit of 11 pixels.

Figure 6.
Example of the transmitted light AMPI classification model results on dual images with only coal particles on the left side and only mineral particles on the right side. The mineral particles were (a) kaolinite, (b) rock dust, and (c) silica. The classification results are superimposed on the same TPP images shown in Figure 4. Particles classified as coal are shown with blue boundaries and those classified as mineral are shown with orange boundaries. Sample types are abbreviated as C: Coal; K: Kaolinite; RD: Rock dust; and S: Silica.

Figure 7.
Coal versus mineral classification on composite samples containing (a–c) C + K, (d–f) C + RD, and (g–i) C + S. In each row, the left image shows the TPP input image, the middle image shows the TCP image, and the right image shows the model output with coal particles outlined in blue and mineral particles outlined in orange.


Figure 8.
Coal and mineral fractions in composite samples containing coal and one mineral based on OM and SEM-EDX classification.
Figure 8.
Coal and mineral fractions in composite samples containing coal and one mineral based on OM and SEM-EDX classification.

Figure 9.
CPSD for coal and mineral particles identified in (a) single-material samples and (b–d) composite samples.
Figure 9.
CPSD for coal and mineral particles identified in (a) single-material samples and (b–d) composite samples.

Figure 10.
Effect of minimum particle size on accuracy (left blue axis) of the AMPI model built using transmitted light PP and CP image pairs. The total number of particles included in the model training set is also shown in the right orange axis.
Figure 10.
Effect of minimum particle size on accuracy (left blue axis) of the AMPI model built using transmitted light PP and CP image pairs. The total number of particles included in the model training set is also shown in the right orange axis.


Table 1.
Summary of image acquisition and total particles identified (Feret diameter > 11 pixels) in the dust samples. Sample types are abbreviated as C: Coal; K: Kaolinite; RD: Rock dust; and S: Silica.
Table 1.
Summary of image acquisition and total particles identified (Feret diameter > 11 pixels) in the dust samples. Sample types are abbreviated as C: Coal; K: Kaolinite; RD: Rock dust; and S: Silica.
| Dust Samples | Number of Samples | Frames Imaged/Sample | Number of Frames | Total Number of Images | Total Particles Identified | |
|---|---|---|---|---|---|---|
| Single material | C | 3 | 50 | 150 | 600 | 69,080 |
| K | 3 | 50 | 150 | 600 | 45,687 | |
| RD | 3 | 50 | 150 | 600 | 40,824 | |
| S | 3 | 50 | 150 | 600 | 37,462 | |
| Composite | C + K | 1 | 20 | 20 | 80 | 792 |
| C + RD | 1 | 20 | 20 | 80 | 615 | |
| C + S | 1 | 20 | 20 | 80 | 6300 | |
Table 2.
Transmitted light added mean particle intensity (AMPI) classification model results on the training and test datasets using particles from single-material samples.
Table 2.
Transmitted light added mean particle intensity (AMPI) classification model results on the training and test datasets using particles from single-material samples.
| Dataset/Output | C | K | RD | S | |
|---|---|---|---|---|---|
| Training set (97.4%) | True | 55,583 | 40,988 | 36,697 | 35,174 |
| Predicted | 52,052 (93.7%) | 40,489 (98.8%) | 36,642 (99.8%) | 34,923 (99.3%) | |
| Misclassified | 3531 (6.3%) | 499 (1.2%) | 55 (0.2%) | 251 (0.7%) | |
| Test set (95.7%) | True | 14,394 | 5139 | 4399 | 2486 |
| Predicted | 13,296 (92.4%) | 5100 (99.2%) | 4399 (100.0%) | 2473 (99.5%) | |
| Misclassified | 1098 (7.6%) | 39 (0.8%) | 0 (0.0%) | 13 (0.5%) | |
Table 3.
SEM-EDX particle classification criteria.
| Particle Class | Atomic% by SEM-EDX | |||||||
|---|---|---|---|---|---|---|---|---|
| O | Al | Si | C | Mg | Ca | Ti | Fe | |
| Carbonaceous | <29.00 | ≤0.30 | ≤0.30 | ≥75.00 | ≤0.50 | ≤0.41 | ≤0.06 | ≤0.15 |
| Mixed carbonaceous | <0.35 | <0.35 | ≤0.50 | ≤0.50 | ≤0.06 | ≤0.06 | ||
| Alumino-silicates | ≥0.35 | ≥0.35 | ||||||
| Silica 1 | ≥0.33 | |||||||
| Carbonate | >9.00 | >0.50 | >0.50 | |||||
| Heavy minerals | >1.00 | >1.00 | >1.00 | |||||
1 Additional limits for S: Al/Si < 1/3.
Table 4.
SEM-EDX classification results on the single-material and composite samples containing coal plus one mineral.
Table 4.
SEM-EDX classification results on the single-material and composite samples containing coal plus one mineral.
| Dust Sample | Area % of All Particles | Particles Analyzed | |||||||
|---|---|---|---|---|---|---|---|---|---|
| Carbnaceous | Mixed Carbonaceous | Alumino-Silicates | Silica | Carbonate | Heavy Minerals | Other | |||
| Single material | S | 0.3 | 0.3 | 0.0 | 99.4 | 0.0 | 0.0 | 0.0 | 500 |
| 0.1 | 0.2 | 0.0 | 99.7 | 0.0 | 0.0 | 0.0 | 533 | ||
| K | 0.0 | 0.0 | 100.0 | 0.0 | 0.0 | 0.0 | 0.0 | 550 | |
| RD | 0.6 | 1.0 | 0.9 | 0.0 | 97.0 | 0.0 | 0.6 | 500 | |
| 0.9 | 0.7 | 0.3 | 0.0 | 98.2 | 0.0 | 0.0 | 550 | ||
| C | 98.5 | 1.3 | 0.1 | 0.0 | 0.0 | 0.0 | 0.1 | 550 | |
| 99.9 | 0.1 | 0.0 | 0.0 | 0.0 | 0.0 | 0.0 | 550 | ||
| Composite | C + K | 8.8 | 17.4 | 73.8 | 0.0 | 0.0 | 0.0 | 0.0 | 500 |
| C + RD | 85.9 | 1.4 | 0.0 | 0.0 | 12.6 | 0.0 | 0.0 | 500 | |
| C + S | 92.2 | 2.6 | 0.1 | 4.8 | 0.0 | 0.0 | 0.3 | 500 | |
Publisher’s Note: MDPI stays neutral with regard to jurisdictional claims in published maps and institutional affiliations. |
© 2021 by the authors. Licensee MDPI, Basel, Switzerland. This article is an open access article distributed under the terms and conditions of the Creative Commons Attribution (CC BY) license (https://creativecommons.org/licenses/by/4.0/).
Share and Cite
MDPI and ACS Style
Santa, N.; Keles, C.; Saylor, J.R.; Sarver, E. Demonstration of Optical Microscopy and Image Processing to Classify Respirable Coal Mine Dust Particles. Minerals 2021, 11, 838. https://doi.org/10.3390/min11080838
AMA Style
Santa N, Keles C, Saylor JR, Sarver E. Demonstration of Optical Microscopy and Image Processing to Classify Respirable Coal Mine Dust Particles. Minerals. 2021; 11(8):838. https://doi.org/10.3390/min11080838
Chicago/Turabian StyleSanta, Nestor, Cigdem Keles, J. R. Saylor, and Emily Sarver. 2021. "Demonstration of Optical Microscopy and Image Processing to Classify Respirable Coal Mine Dust Particles" Minerals 11, no. 8: 838. https://doi.org/10.3390/min11080838
Note that from the first issue of 2016, this journal uses article numbers instead of page numbers. See further details here.