
Influence of Segmented Rolls on Homogeneity of Cooling in Continuous Casting


1
Faculty of Mechanical Engineering, Brno University of Technology, 60190 Brno, Czech Republic
2
Research Laboratory, POSCO Gwangyang Work, 396, Gumho-ro, Gwangyang-si 545-711, Korea
*
Author to whom correspondence should be addressed.
Metals 2021, 11(8), 1232; https://doi.org/10.3390/met11081232
Submission received: 26 May 2021
/
Revised: 21 July 2021
/
Accepted: 30 July 2021
/
Published: 2 August 2021
(This article belongs to the Special Issue Advances in the Continuous Casting of Steel)
Abstract
:This paper deals with secondary cooling in a continuous caster. In particular, it deals with cooling inhomogeneity caused by spray arrangement and segmented rolls used for leading the strand. The cooling section is placed under the mold. Segmented rolls are supported by bearings in several places across the strand. Sprayed water can flow in the gaps between rolls where the bearing pocket is located. The main question that was experimentally studied is how this geometry with segmented rolls can influence homogeneity of cooling. Two experimental approaches developed for this study were applied, and both used full-scale geometrical configuration. The first one was a cold test where water flow and water distribution were observed using a transparent board with the studied surface structures (rollers and bearing pockets) and four spraying nozzles. The second one was a cooling test using a heated steel plate with rolls and bearing pockets. Cooling homogeneity was studied based on the temperature distribution on the rear side of the sample, which was recorded using an infrared camera. Homogeneity of cooling distribution was experimentally studied for three levels of cooling intensity that are used in typical cooling sections in plants. The hot tests showed that the bearing pockets do not provide significant cooling inhomogeneity despite the fact that a large amount of water flows through the gap between the rollers (which has been observed in cold tests).
1. Introduction
Secondary cooling in continuous casting is an important part of the whole casting process. The solid shell of the strand becomes thicker, and the core gradually solidifies. Improper cooling can cause serious surface defects or can even lead to breakout. Knowledge of cooling intensity and homogeneity is essential for controlling the whole casting process, including the surface temperatures, which can influence the quality of the product [1,2]. The cooling intensity of the spray nozzle is dependent on many factors. The first group of factors includes the nozzle itself (the most important factors are geometry of spray, coolant flowrate, droplet size, droplet velocity, and water impingement density) [3]. The second group of factors is related to the cooled surface and the geometrical conditions near the impact area. The major factors are surface temperature [4] and roughness [5], scale thickness, and geometrical conditions near the impact area. Forced convection of air with droplets mixed with vapor in the secondary cooling zone is geometrically limited by the space between the two rolls and the strand surface. It should be mentioned that gravitational forces must also be considered because of the varying positions of the nozzles. The nozzles spray slightly upwards or downwards below the bending point.
There are not many publications about experimental investigation of spray cooling in continuous casting. Recently published results of full-scale laboratory measurements of spray cooling of a slab show results for a cluster of mist nozzles [6]. Three rows of four nozzles are used here, and the configuration reflects real conditions in continuous casting. Results are obtained for the stationary configuration, as in this study.
Some studies consider spray thickness to be an important parameter for prediction of cooling intensity. That is the thickness of the water layer on the cooled surface. Paper [7] uses a similar combination of experimental methods as this paper—cold tests for showing the shape of coolant distribution on the surface and hot tests for measurement of the heat transfer coefficient. The results are for a flat surface without rolls.
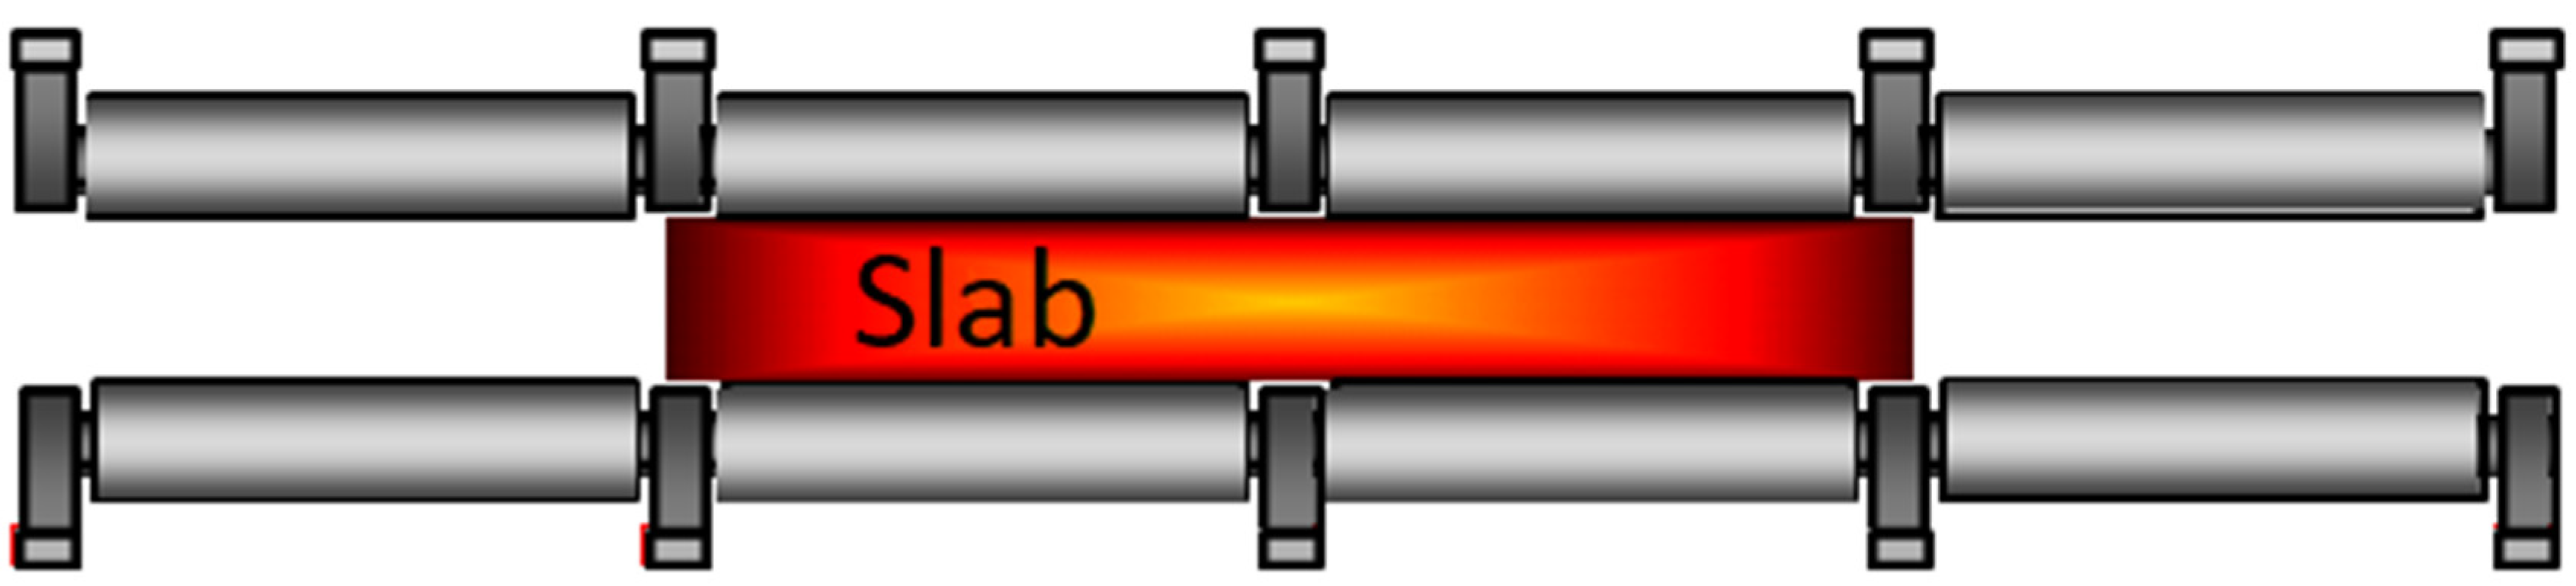
This paper is focused on a special aspect of geometrical conditions. Some casters have to use segmented rolls (see Figure 1). This supporting structure is not compact along the strand width [8]. Short rolls are supported by several bearings. Rolls are pressed against the strand, but between the rolls, there are bearing pockets that do not touch the surface. Due to bearing pockets having a different geometry to rollers, this structure can significantly influence water flow over the slab surface. The configuration mentioned has become common in casting plants, but information about the role of this geometry on cooling inhomogeneity is not properly described. The impact on cooling intensity and homogeneity was studied experimentally, and the results are described in this paper.
The influence of segmented rolls on slab bulge deformation is presented in [9]. That numerical study shows an important difference between segmented rollers and classical rollers. The thermal aspect of cooling inhomogeneity is not considered in [9].
An experimental study of cooling inhomogeneity was carried out in laboratory conditions and the results are presented in this paper. The developed laboratory methods of measurement allow study of cooling in a full-scale geometrical configuration and with variable positions of the cooled surface. The basic tests were done with the strand in a vertical position, and thus, the nozzles were spraying in a horizontal position. Additional cold tests were conducted with the cooled surface tilted and spraying upwards or downwards. Additional hot tests were done with the cooled surface tilted by 45° and only spraying downwards. Cold tests were conducted to observe the fluid flow, and hot tests were conducted to study cooling intensity and cooling homogeneity.
2. Experimental Technique
Standard heat transfer tests for measurement of the cooling intensity of nozzles used in continuous casting are done with moveable nozzles [10]. The speed of the relative movement of the nozzle towards the sample is the same as the real casting speed. However, this configuration does not allow rolls to be implemented in test samples with tight contact between the sample and the roll in laboratory conditions. Tight contact is crucial in this study because any water flow between the roll and the sample would cause additional water cooling in the area where there is roll-strand contact, which can be relatively intensive. This study used a compact testing device (see Figure 2) where models of rolls with bearing pockets were attached to the test plate, which simulated the cooled surface of the strand. The tests were stationary, i.e., there was no relative movement of the test sample and nozzles.
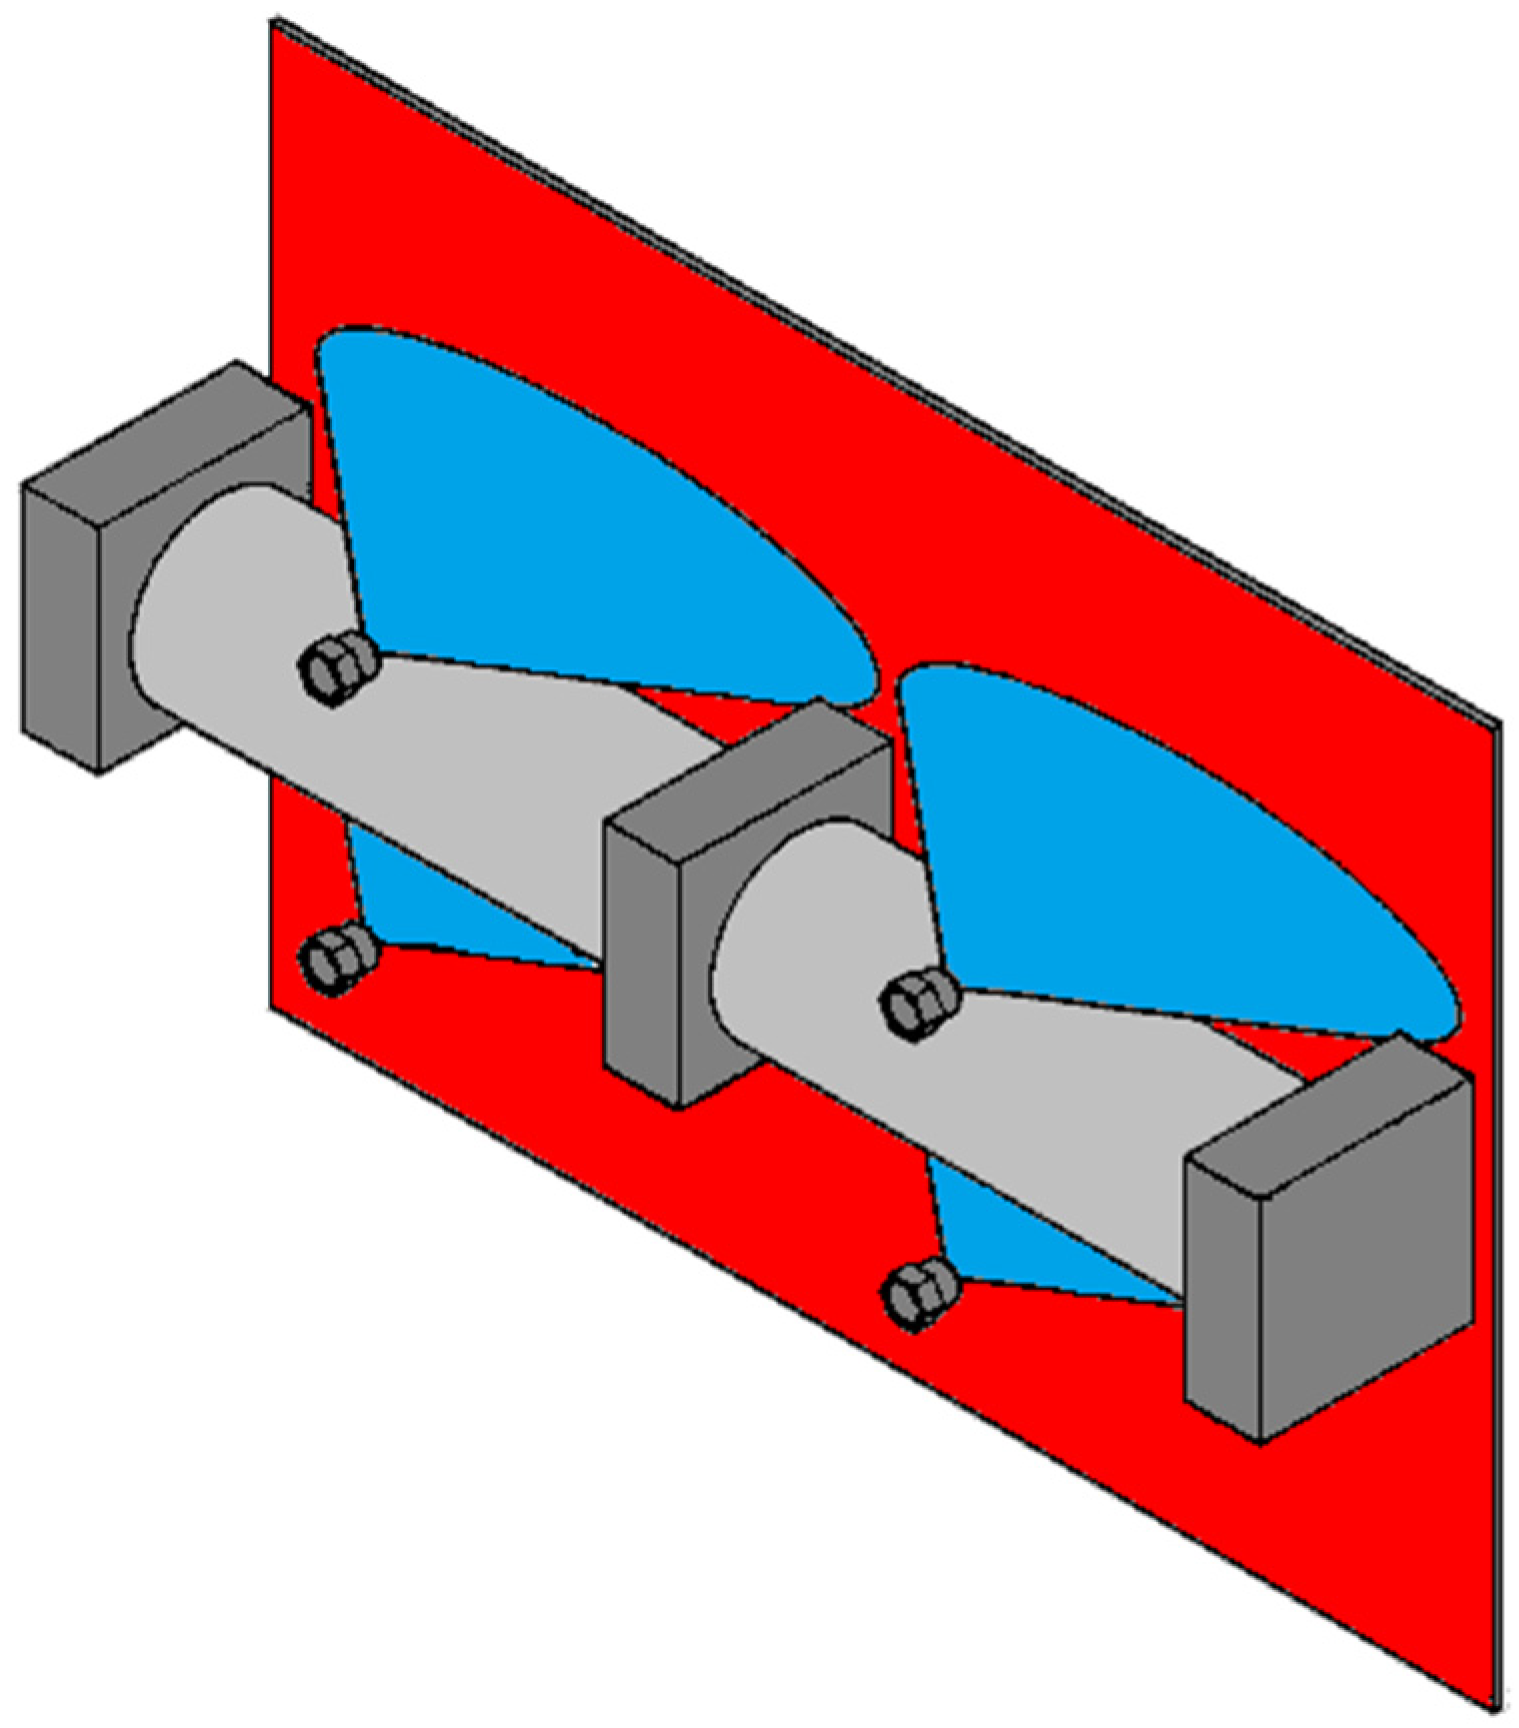
Both cold and hot tests used identical geometry, with rolls having a diameter of 100 mm, a roll segment length of 270 mm, a gap of 50 mm between the rolls, and a gap of 12 mm between the strand and the bearing pocket. Four mist nozzles were used in each test. Two nozzles were located above the rolls and two below. The test configuration is shown in Figure 2. The spray height was 110 mm. Tests were done for three different pressure settings (the parameters are shown in Table 1).
The standard position of the test plate was vertical with the nozzle axes in a horizontal position. Additional experiments were done with a tilted test bench, where the test plate was tilted by 30°, 45°, and 60° from a vertical position, both positively and negatively. Positive tilting here refers to the situation where nozzles spray upwards. Tilted configurations simulated the situation below the bending point where nozzles spray downwards on the upper strand surface and upwards on the bottom strand surface.
2.1. Cold Tests
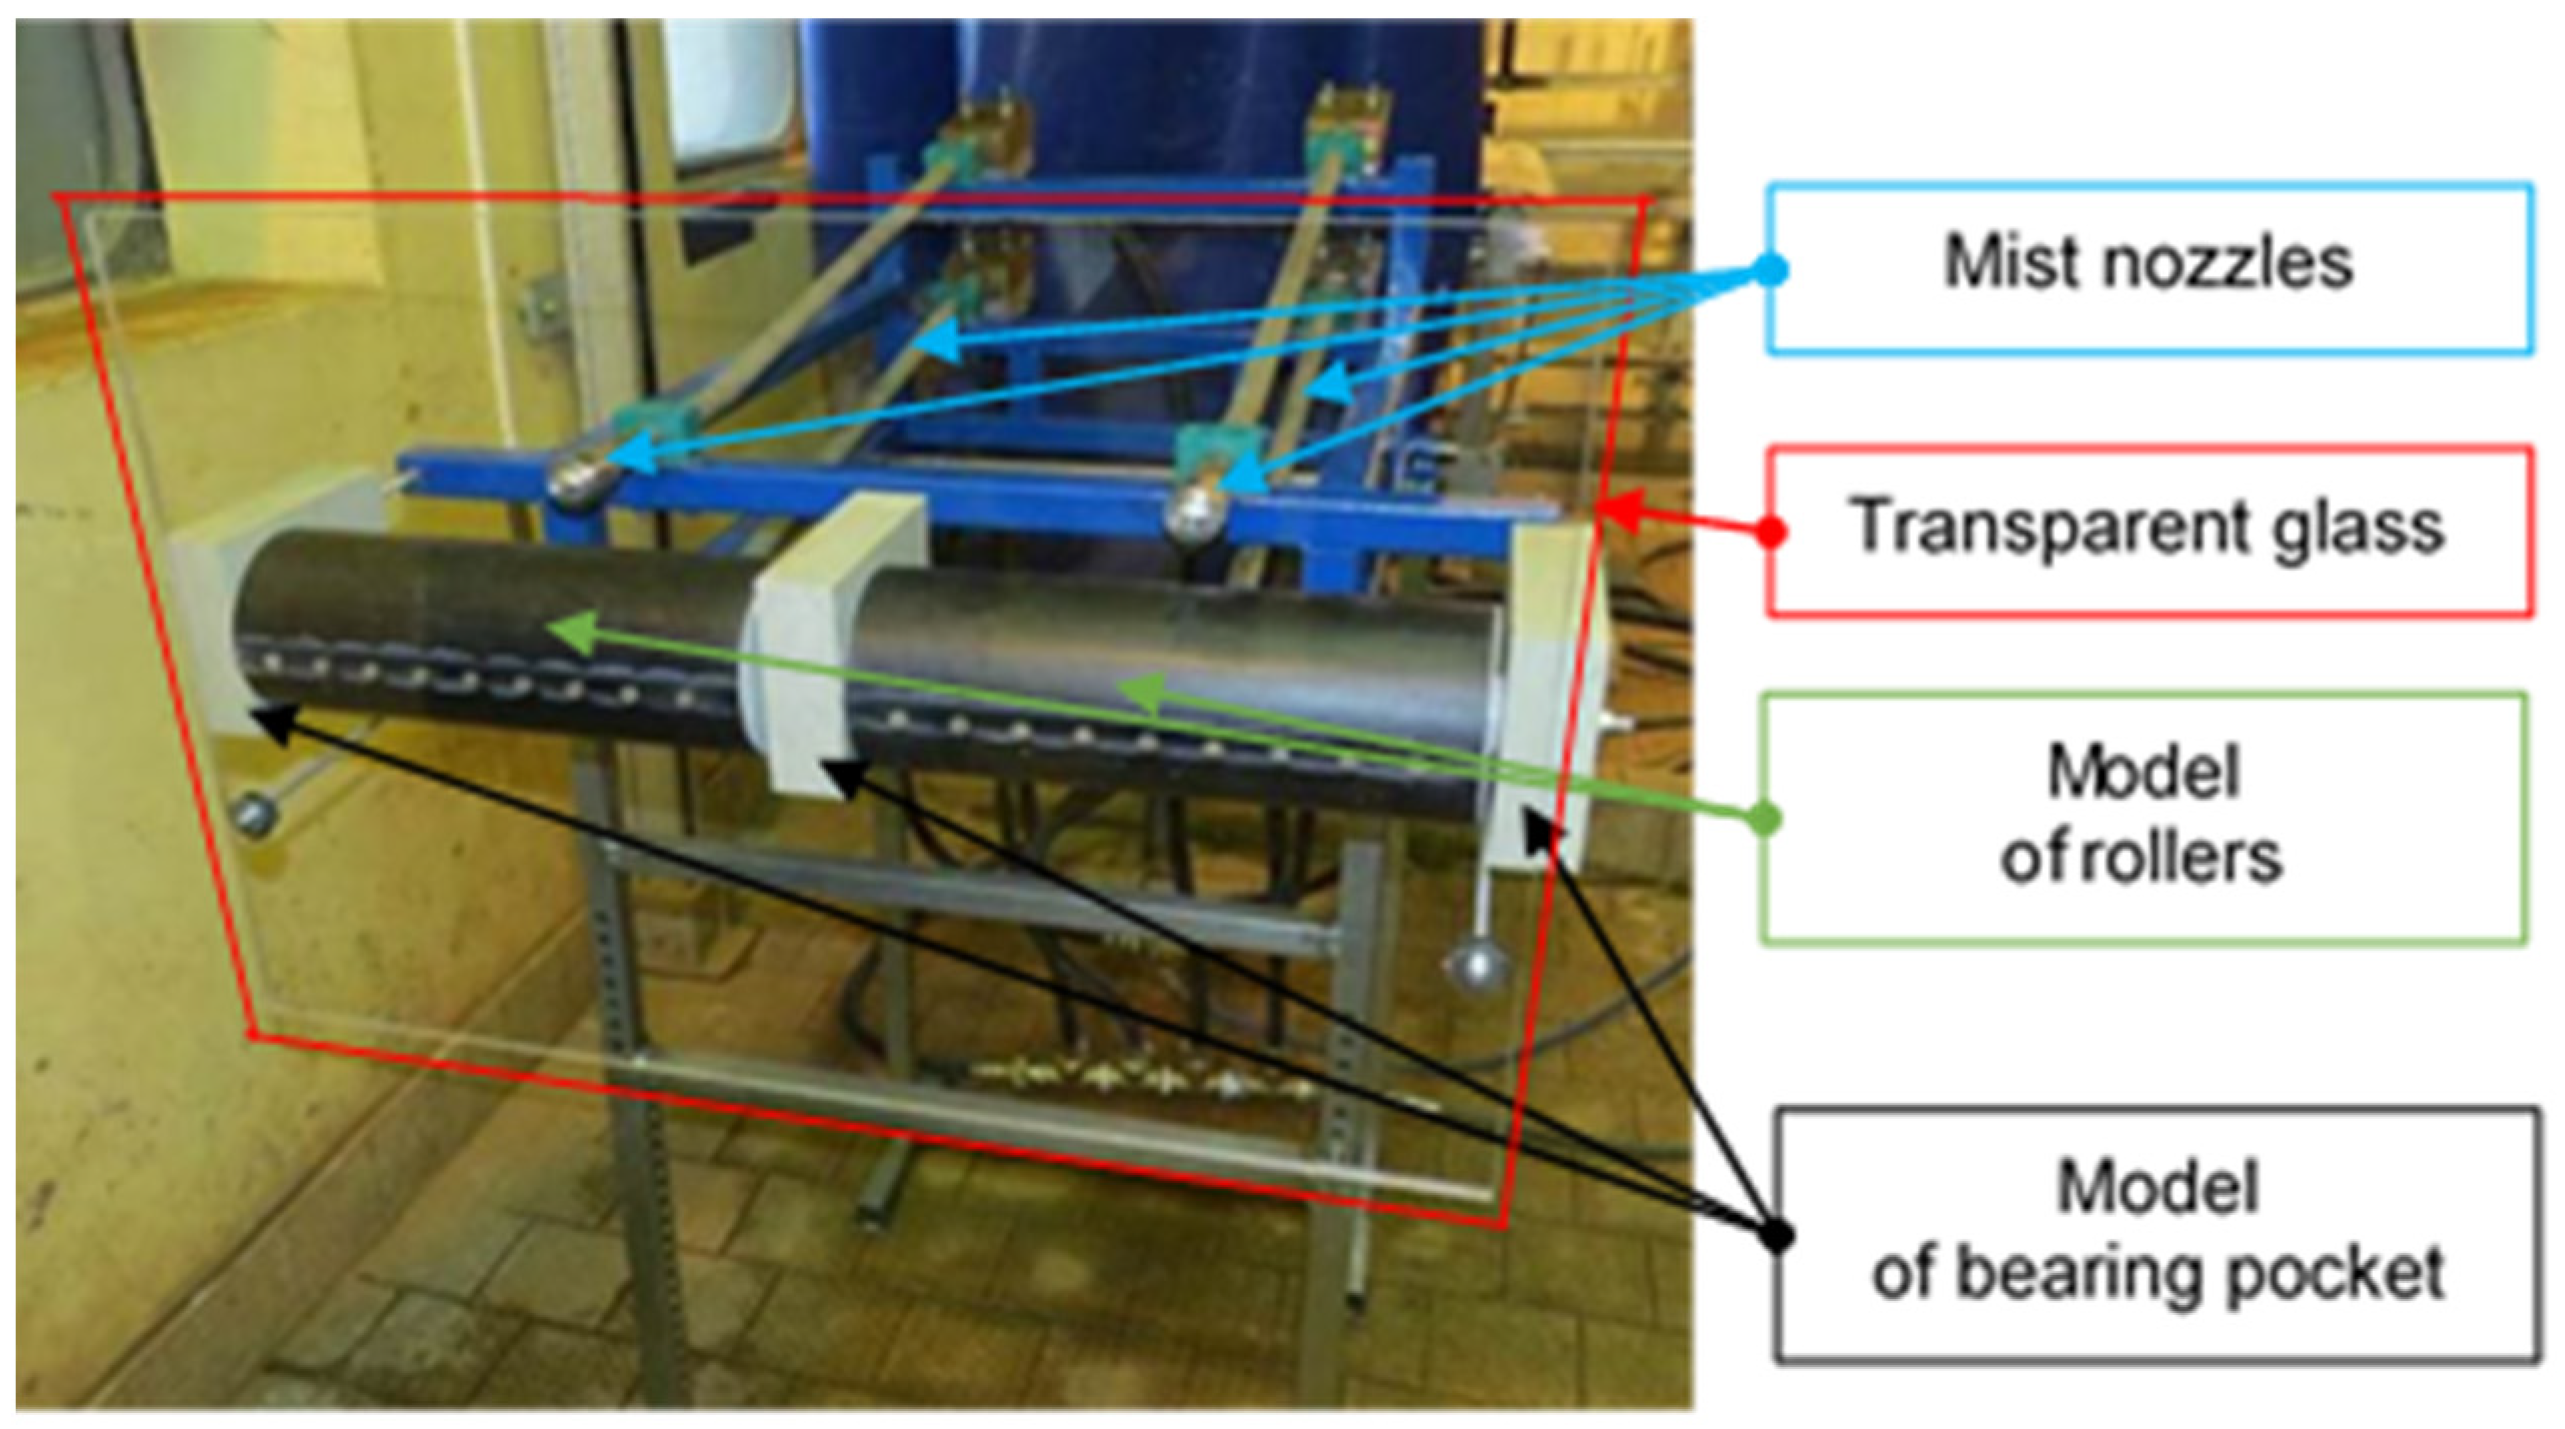
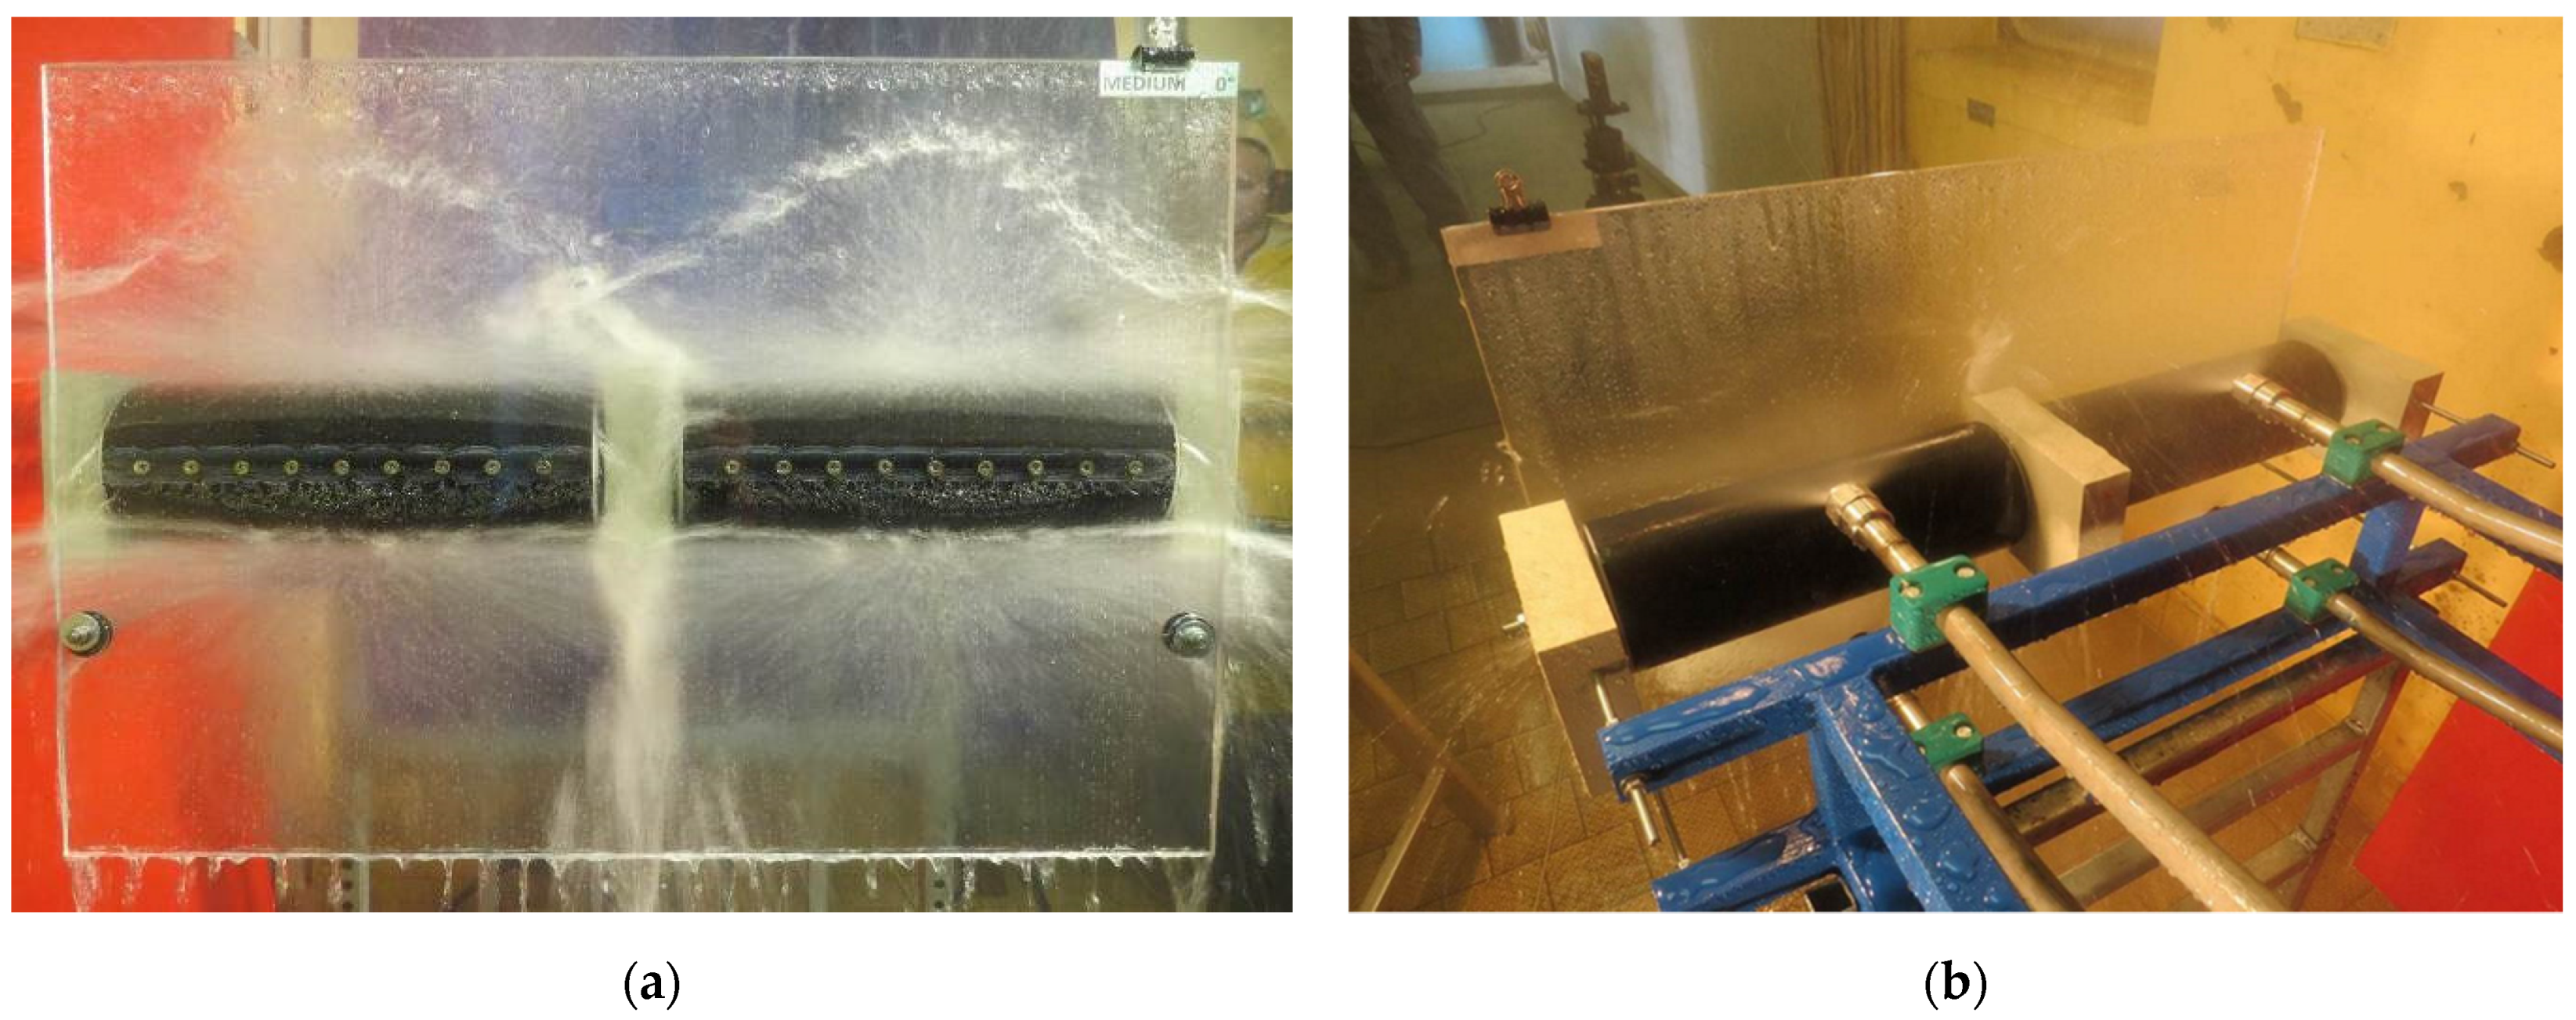
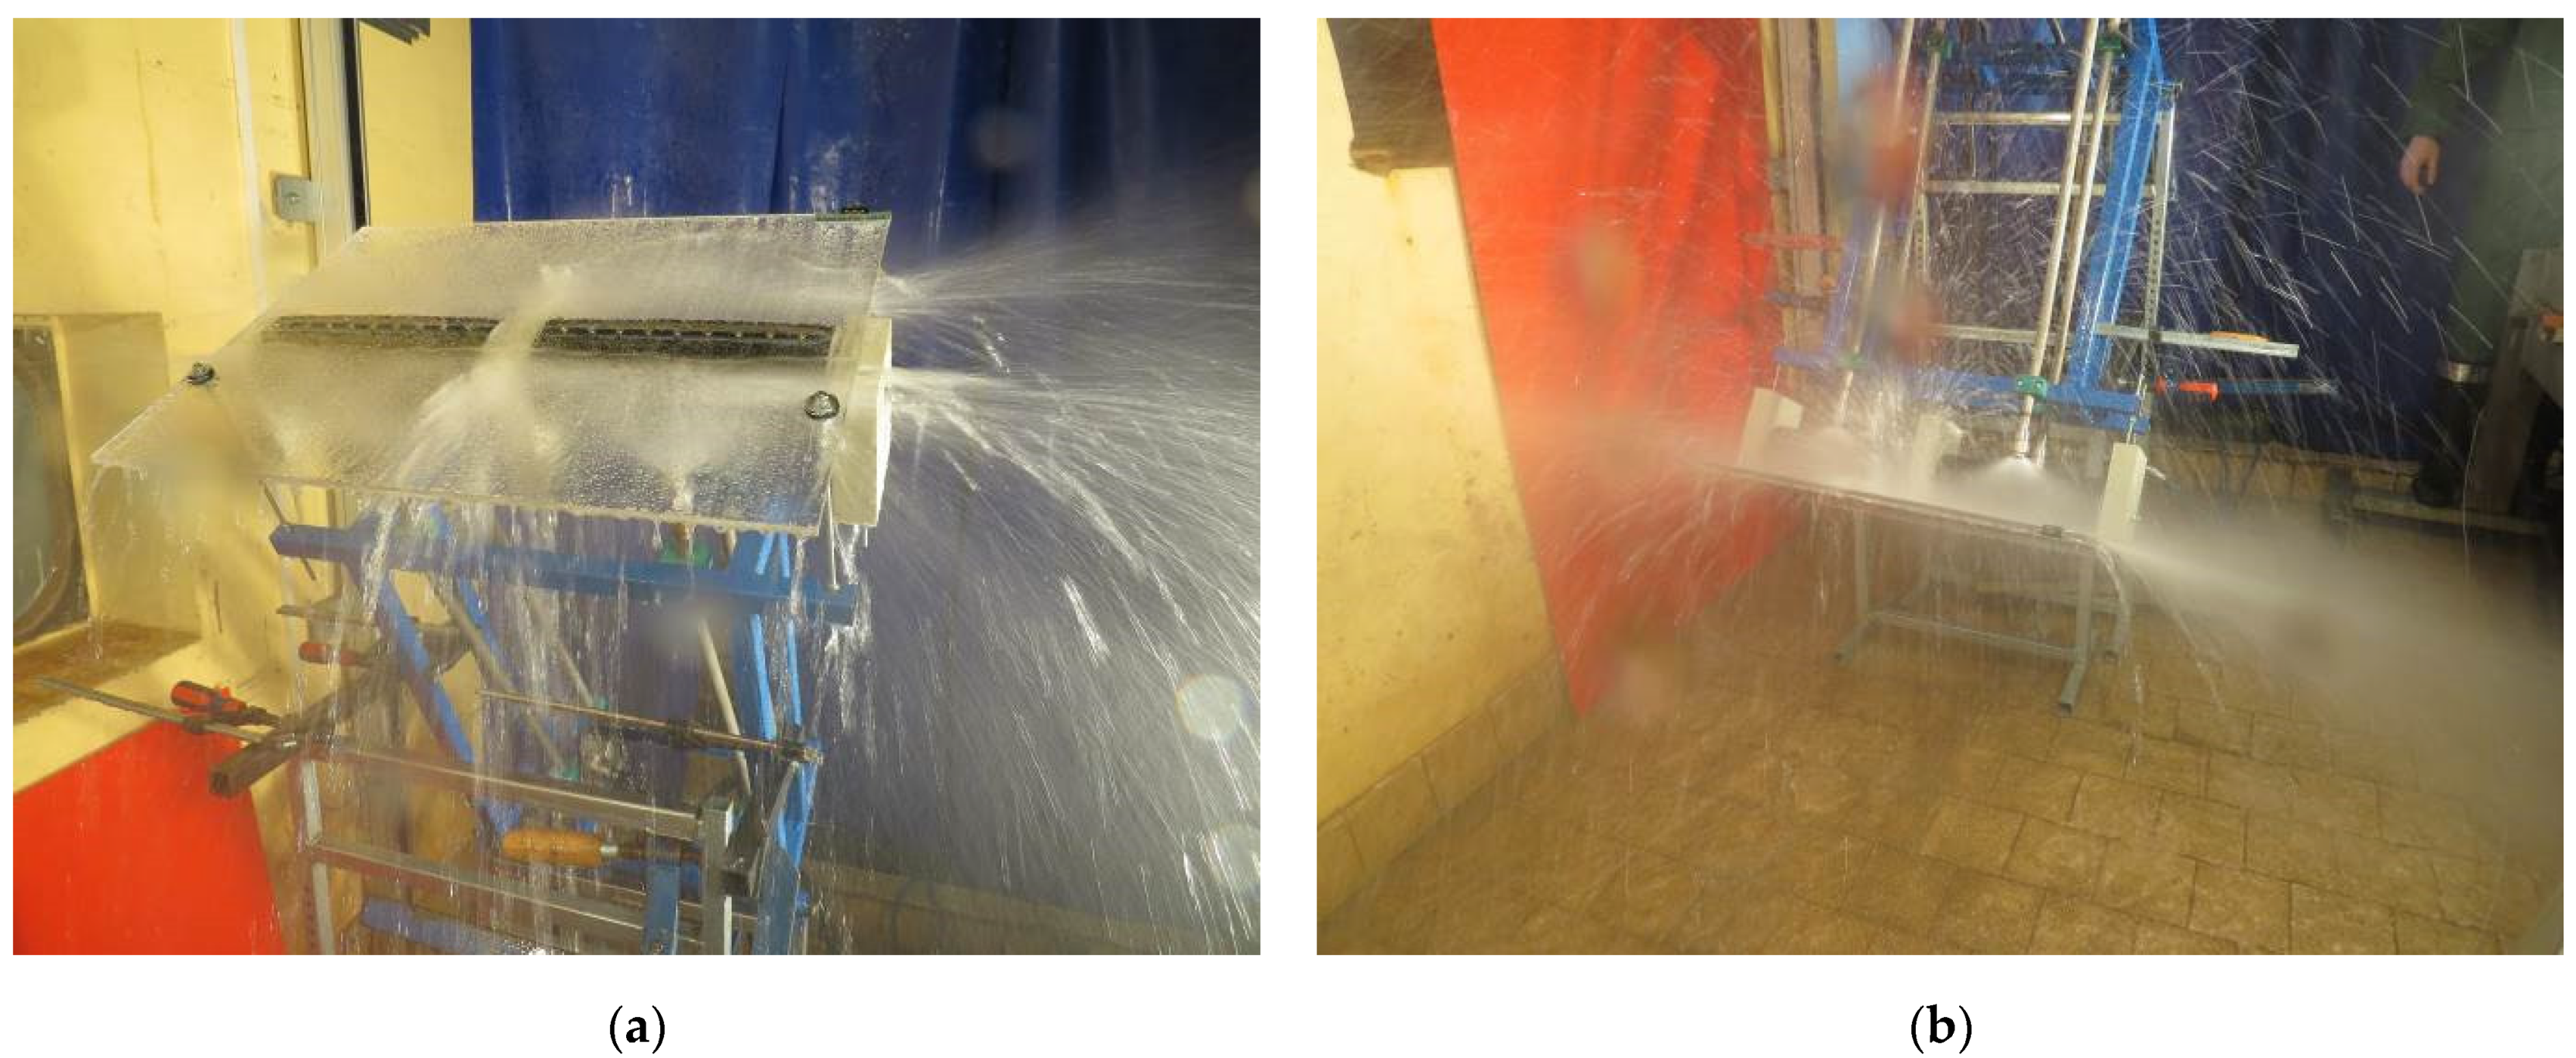
Cold tests were designed for visual observation of water flow on the cooled surface of the strand, in the area near the rolls and the bearing pockets. The setup of nozzles, rolls, bearing pockets, and the strand surface were assembled in full scale. The impact surface was made of a transparent plastic plate (see Figure 3). This allowed observation from both sides (front and rear). The front view of the transparent glass is shown in Figure 4a. Water flow on the plate surface, in the V-gap between the plate and the rolls, and through the gaps between the rolls were observed during cold experiments.
2.2. Hot Tests
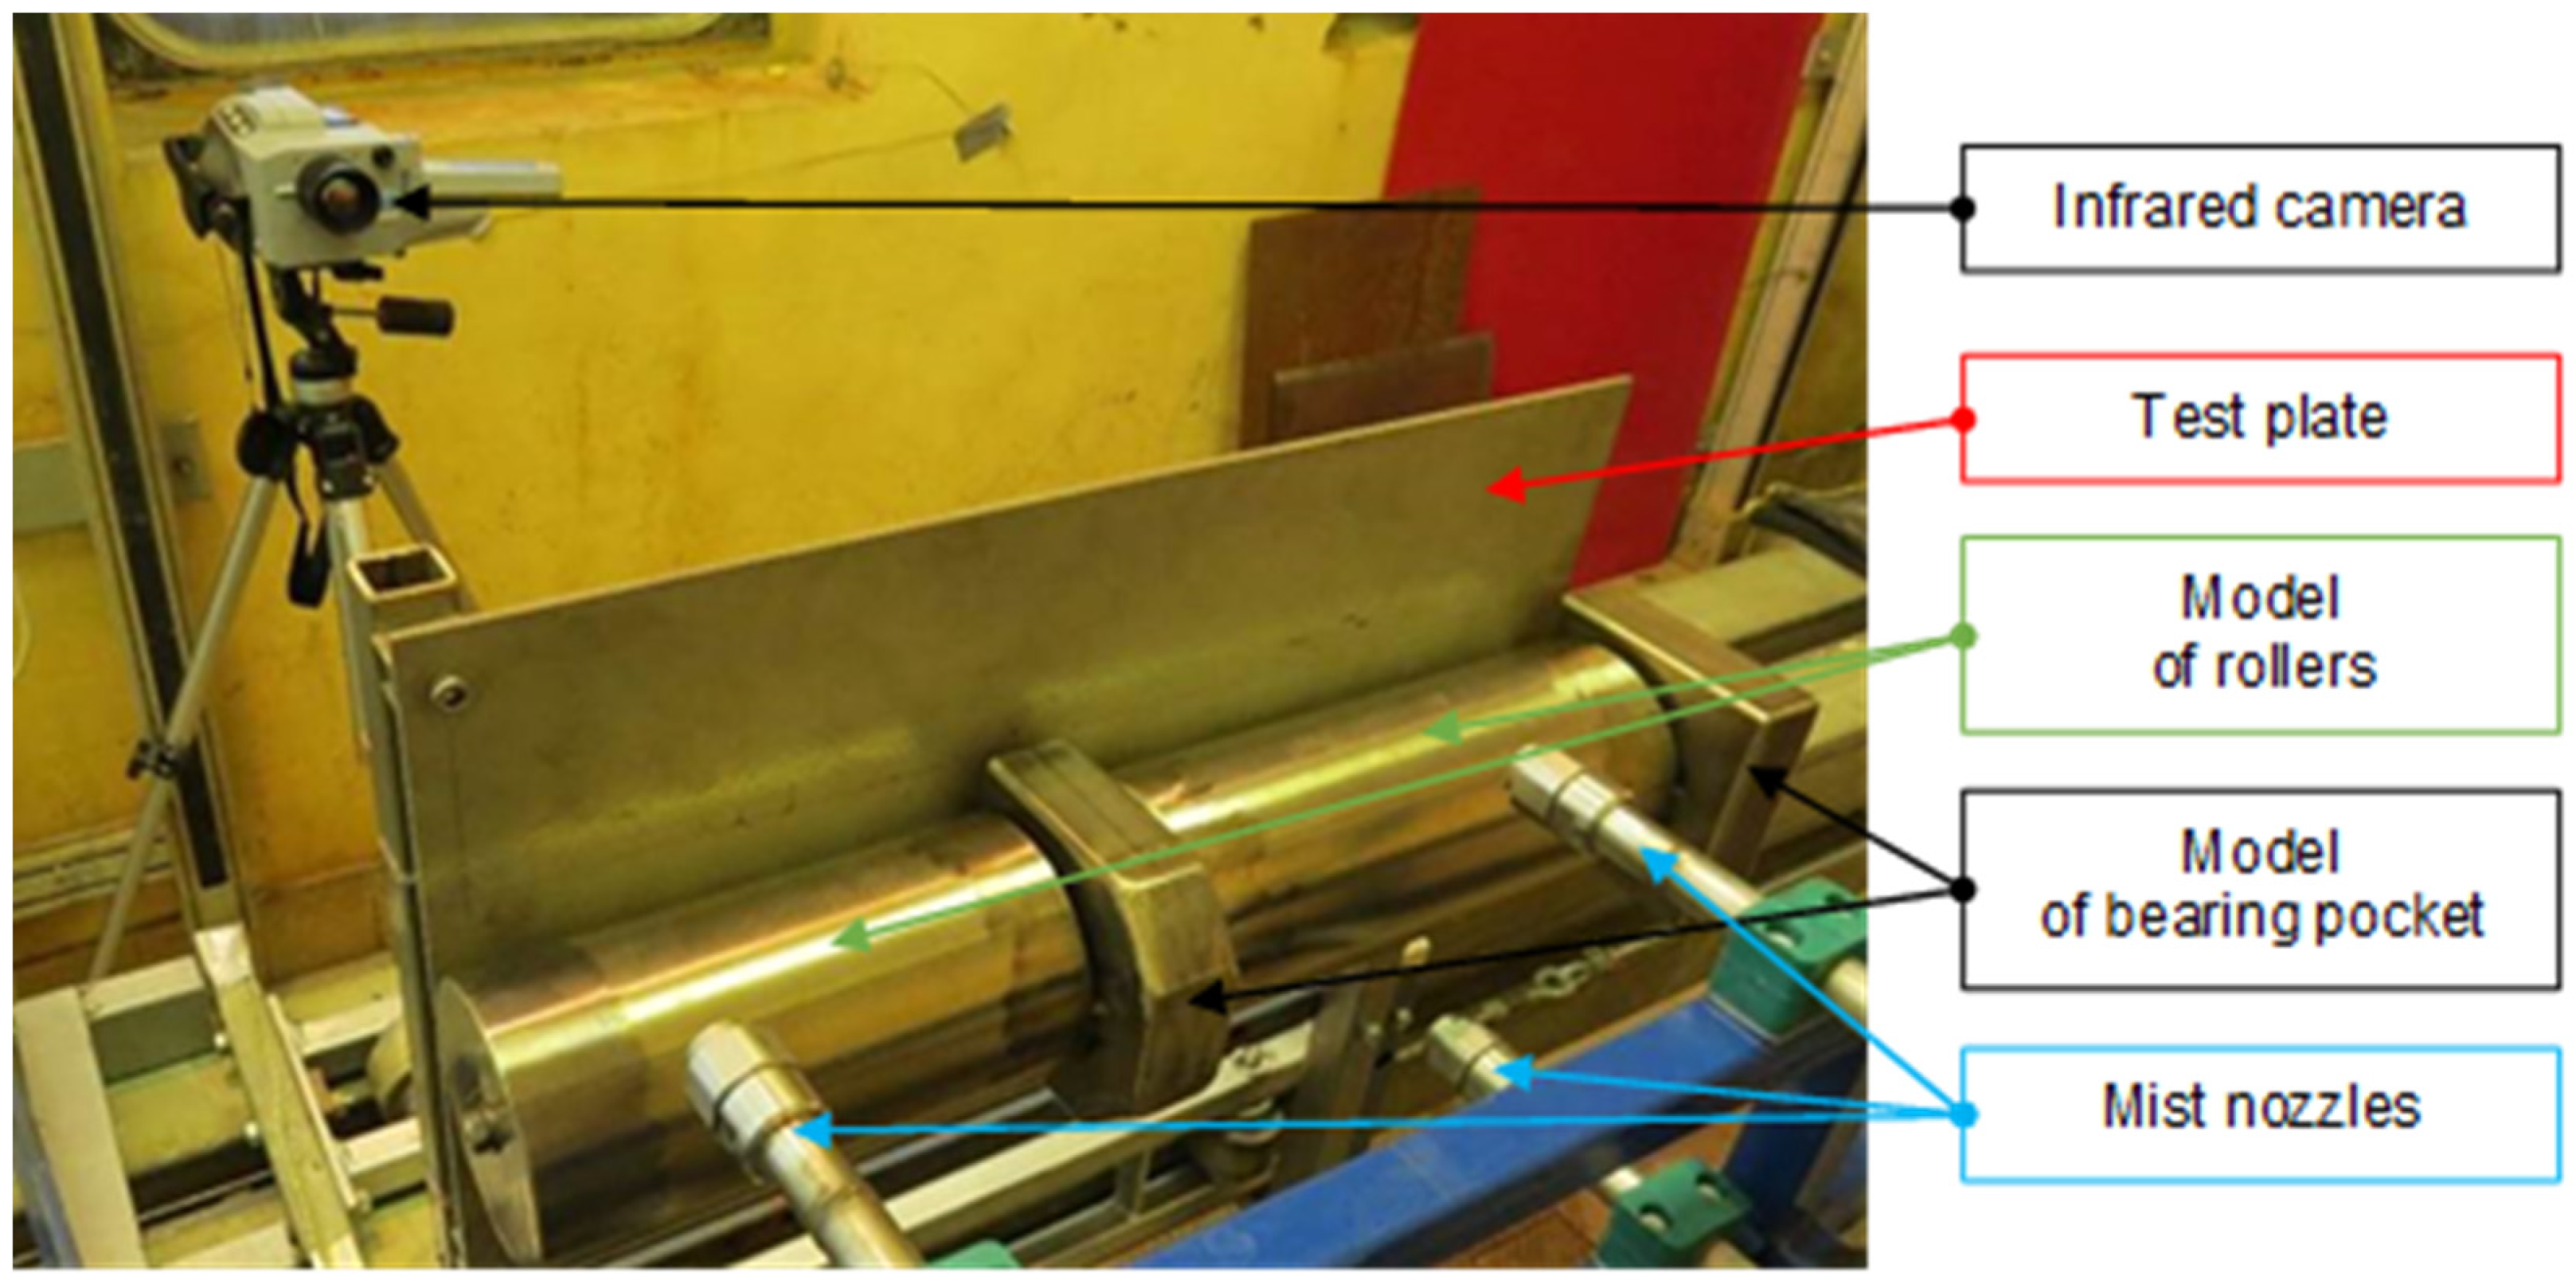
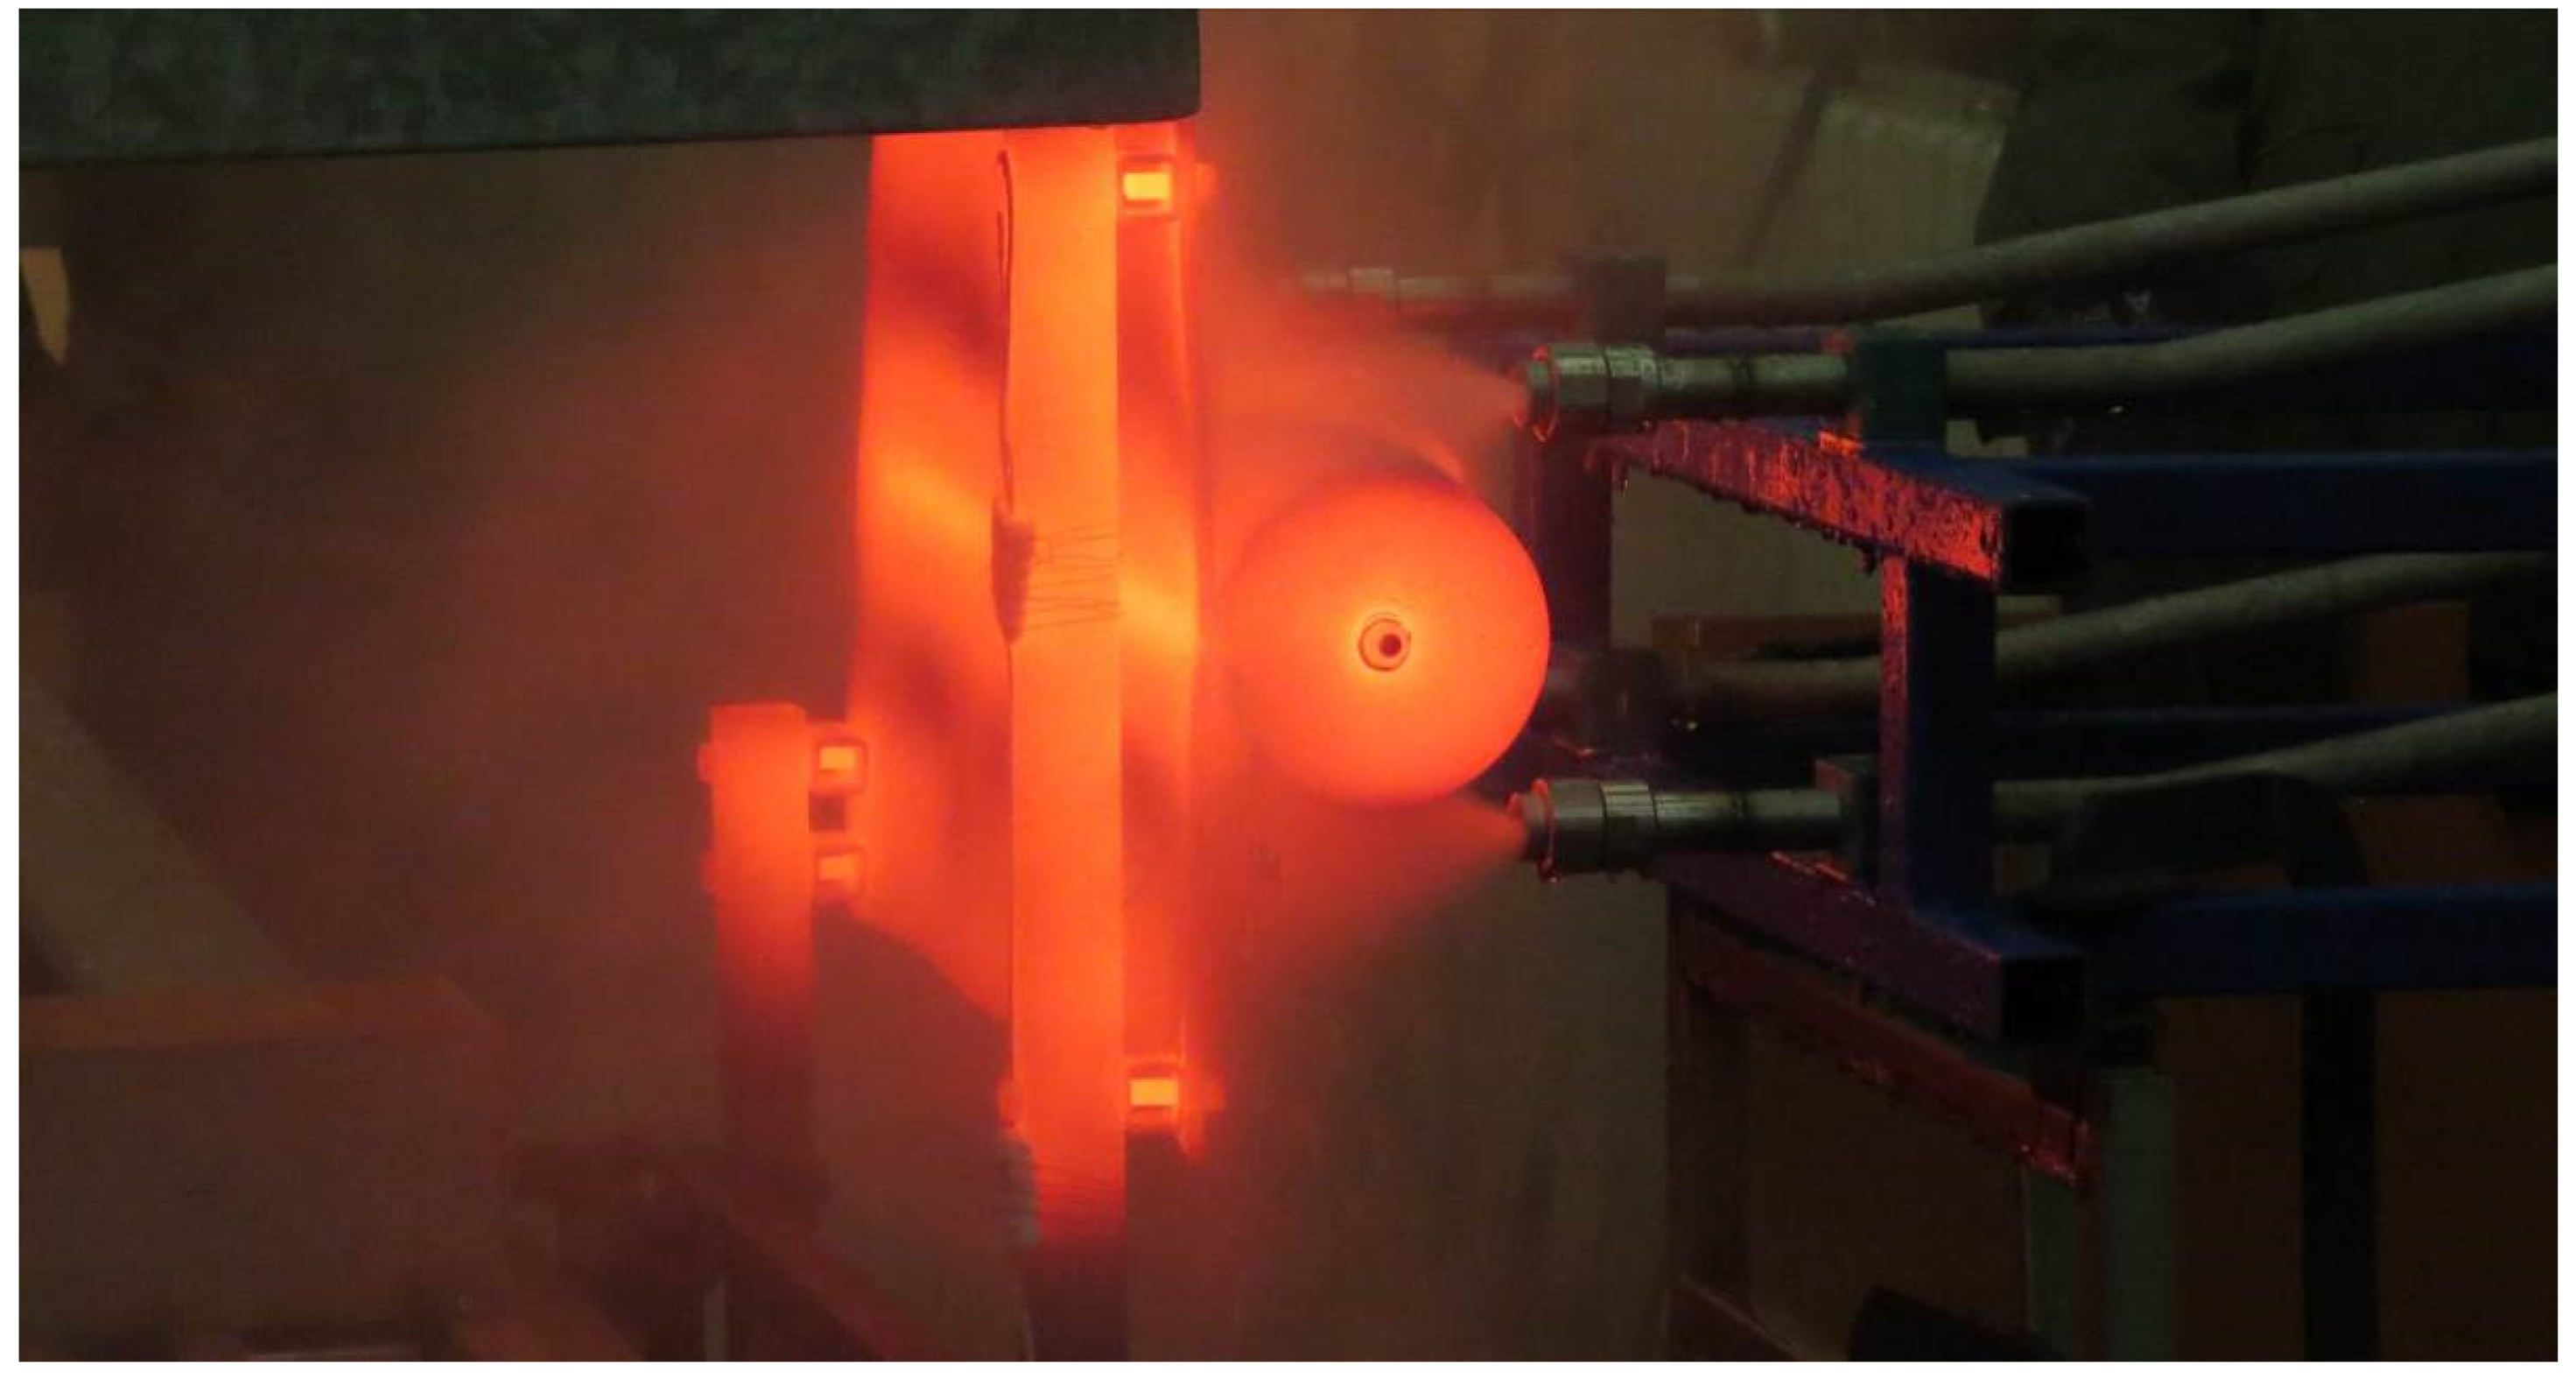
Hot tests also used the full-scale model. The test bench was built as a compact unit, as shown in Figure 5. The cooled surface of the strand was simulated by a 5 mm thick steel plate. This thickness is a compromise between conflicting requirements: small difference between temperatures on the front and back side, good stiffness, and long duration of cooling. The thickness needs to be as small as possible to obtain good information about temperature distribution on the cooled side by measuring the temperature on the rear side with an infrared camera. However a very thin plate would cool too quickly, and the plate would be extremely deformed by thermal stress. Steel rolls with bearing pockets (identical geometry as in the plant) were welded to the steel plate to ensure perfect contact between the rolls and the plate without any water leakage. The infrared camera, which recorded the temperature distribution during the experiment, was facing the rear side of the cooled steel plate (see Figure 5). There were four pairs of thermocouple wires (Ø 0.25 mm) welded on the rear side of the test plate to allow the emissivity of the scanned surface to be calibrated. A thin graphite layer (about 0.02 mm thick) was applied on the rear side of the test plate to increase and homogenize emissivity. The cooling experiments were done as stationary tests without any movement. The entire specimen with steel cylinders, bearing pocket and test plate could move horizontally, and it was moved to an electric furnace prior to cooling. The heated part is obvious from Figure 6 (the orange color). The temperature of the sample was monitored during heating using the four thermocouples mentioned above. The hot parts in the initial stage of the experiment are shown in Figure 6 together with the jets from the mist nozzles.
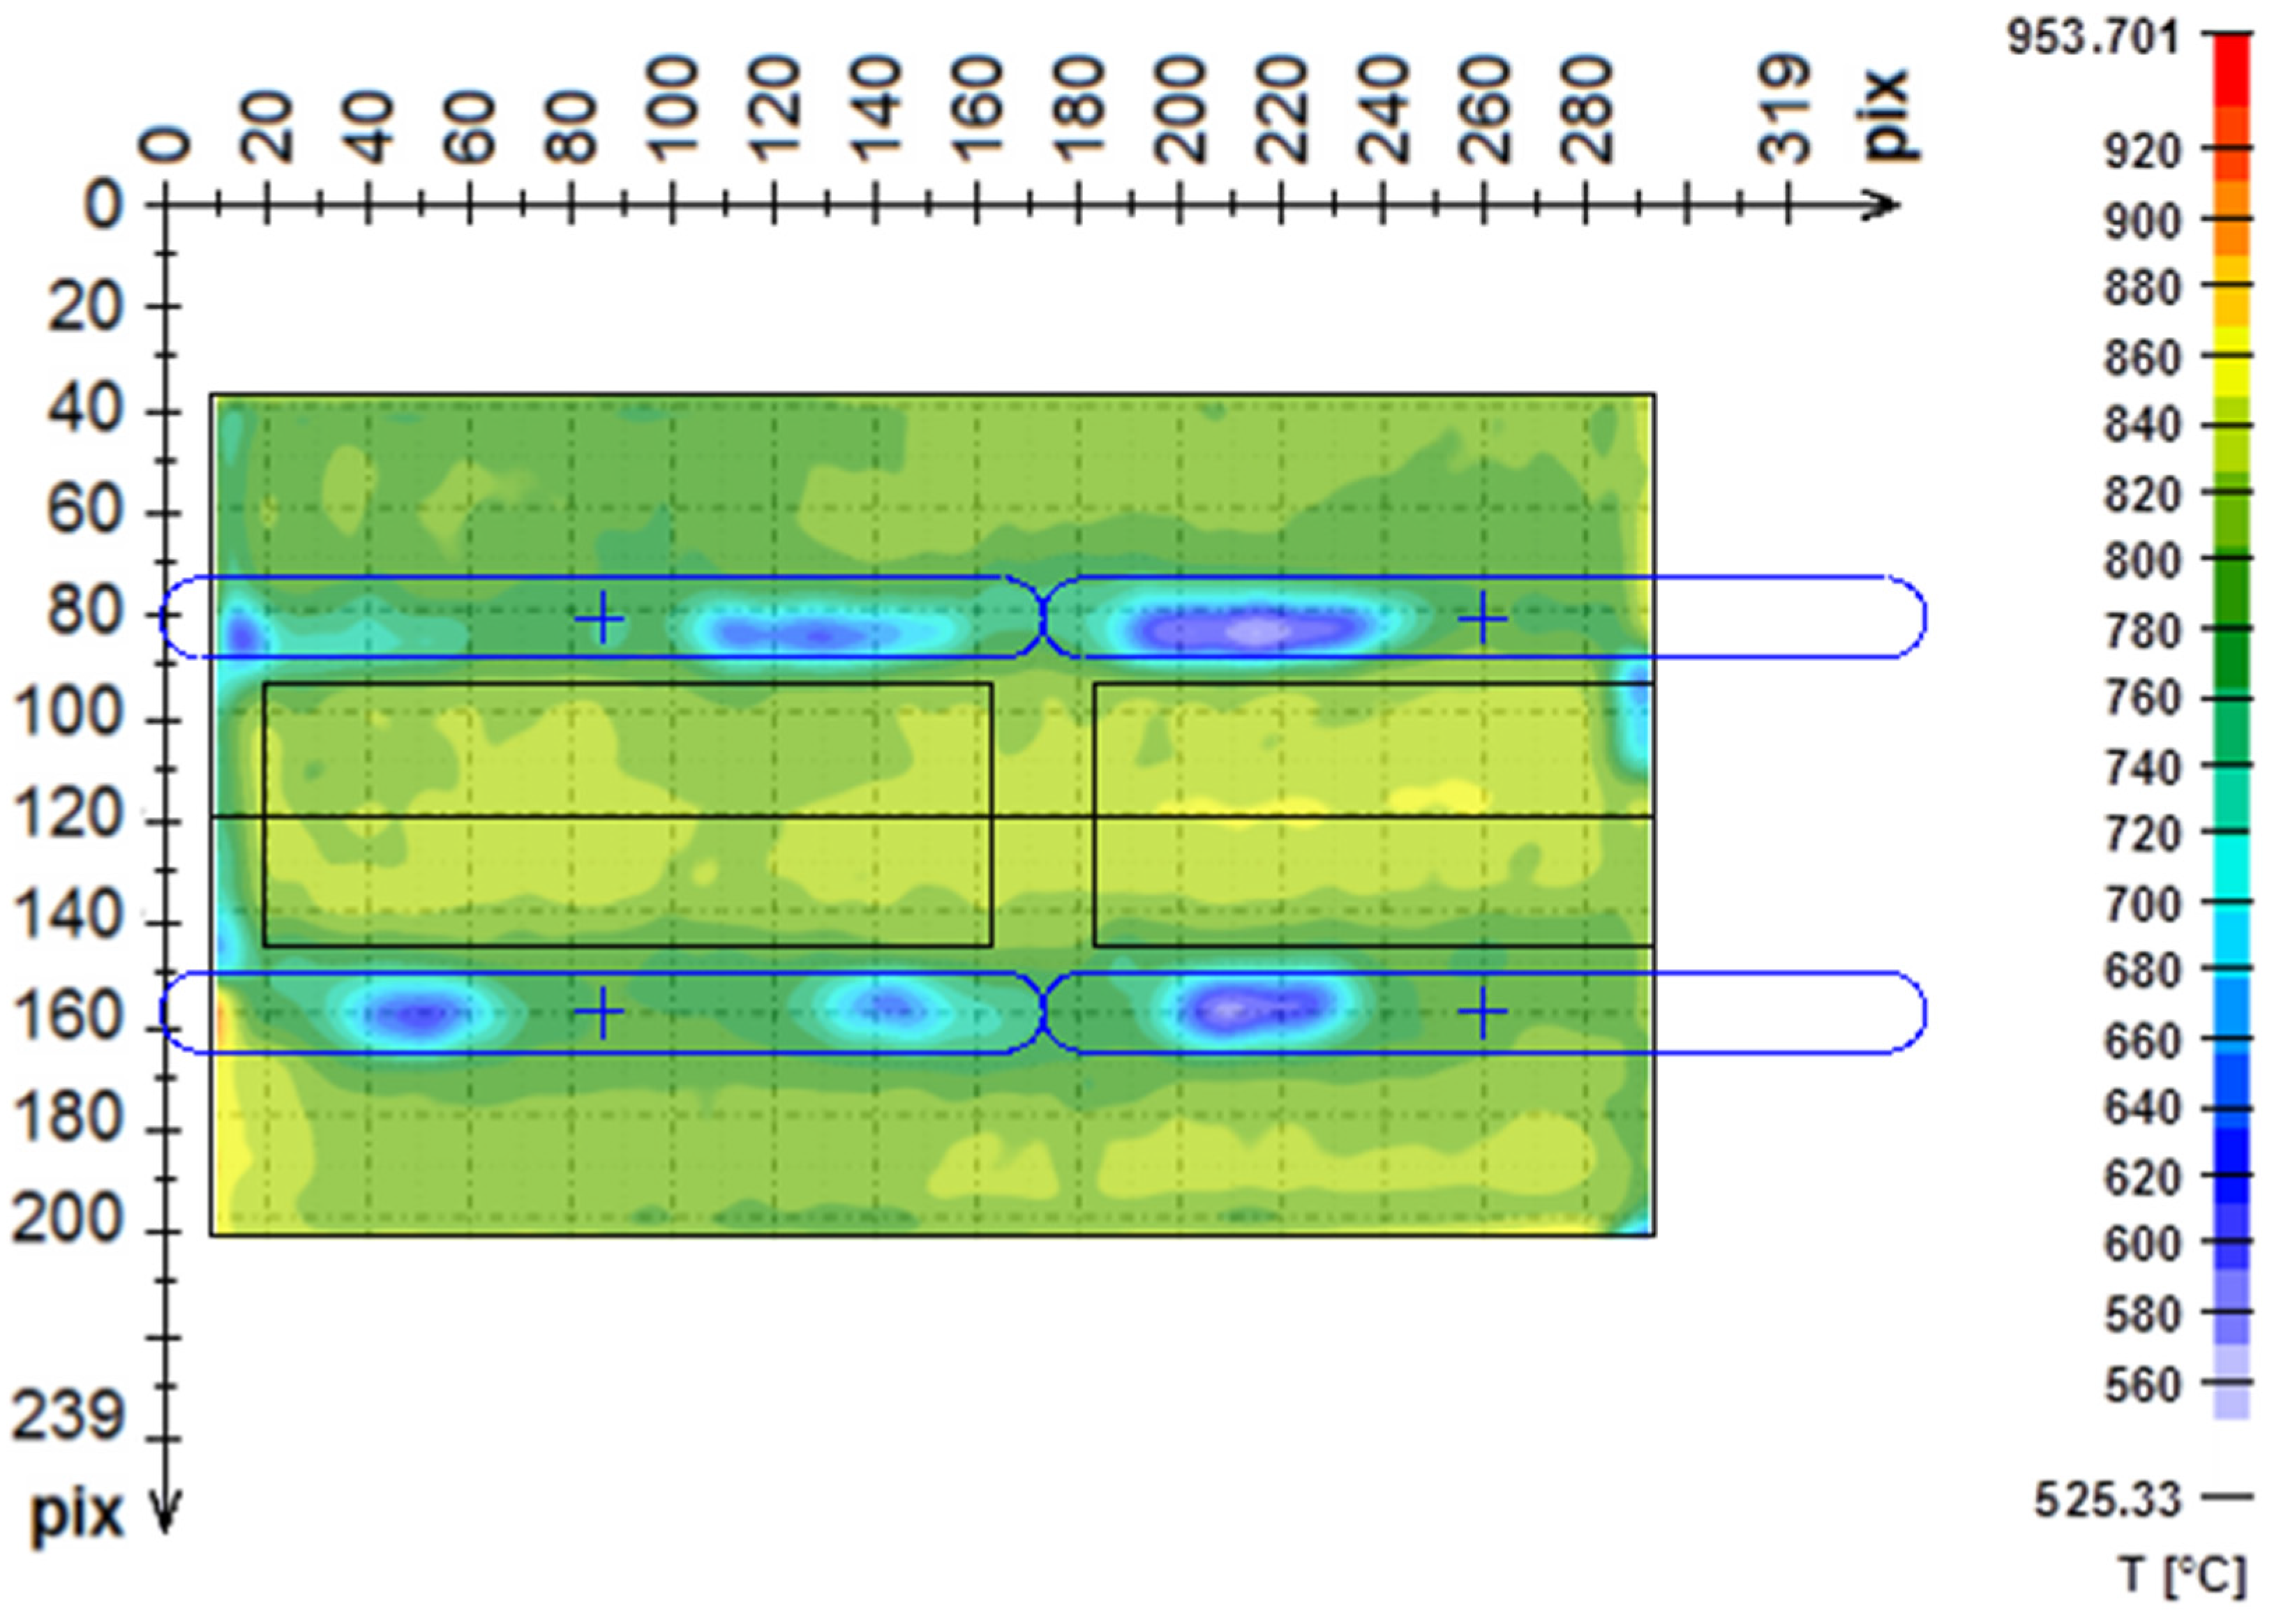
Recorded data from the infrared camera has been filtered (in space and time domains) and corrected using calibrated emissivity for each point. An example of temperature distribution captured by the infrared camera is shown in Figure 7.
Hot tests were performed at three initial test plate temperatures (600 °C, 900 °C, and 1100 °C) for an inclination angle of 0° and with an initial temperature of 900 °C for an inclination angle of −45°. Three levels of flowrate were tested for each configuration: low, medium, and high (see Table 1).
It should be noted that the use of infrared cameras to evaluate the inverse heat conduction task is very complicated in practice. The choice of material thickness is crucial. Thick material reduces the sensitivity of the inverse task. The measured temperature drop on the rear side of the test plate has a significant time delay compared to the temperature drop on the cooled surface. Due to this fact, the boundary conditions are smoothed out too much. In contrast, thin material has a low heat capacity, and the cooling process is, thus, very fast. In order to guarantee the selected initial temperature, this time interval must be minimized and the sample heated to a significantly greater temperature than the initial temperature. Furthermore, a thin sample is more susceptible to deformation, which is even more important in the case of inhomogeneous cooling of a plate with the structures on the surface. A board thickness of 5 mm was chosen as the optimal compromise considering the complications mentioned above. The next problem is that the accuracy of the inverse task is fundamentally affected by the accuracy of and the presence of noise in the input data (measured temperature). The accuracy of infrared temperature measurements depends on many aspects, such as:
- quality of the device itself (resolution, sensitivity, noise, etc.),
- emissivity of the test sample and homogeneity of emissivity depending on the position and time,
- clear view for infrared camera on the observed surface.
The problem of potentially inhomogeneous surface emissivity was solved by calibration. The emissivity was determined for each pixel so that the whole sample had the same initial temperature in the infrared image. Thermocouples installed on the surface were used to measure the sample temperature for emissivity calibration. Keeping a perfectly clear view of the scanned surface during cooling experiments is difficult, mainly due to the water vapor that forms during cooling. Air jets were used to blow steam and mist away from the camera. The greater the noise in the data, the stronger the filtration must be. By using stronger data filtering, average HTC values only change slightly, but it blurs the shape of the HTC distribution [11,12]. This is also the case for the results described in this article, where the required output of the inverse task was simplified to only one average HTC value for the high temperature range.
3. Results
3.1. Cold Test
A typical example of a cold test is shown in Figure 4. It is obvious that the water flow is highly turbulent. The stagnation point, or stagnation line, between adjacent nozzles moves from side to side (marked with a black dotted line in Figure 8).
It should be noted that the water in the gap between the rollers and the slab is not just standing. It is intensively flushed along the rollers into the gap under the bearing pocket and also to the edge of the slab, which can be seen in all photos from the experiments.
Intensive water flow through the gap between the rollers is visible for all tested configurations (angles and flows). The underlying question is whether this water flow has a significant effect on the homogeneity of cooling, i.e., if there is a supercooled area below the bearing pocket. This question is answered by the hot tests.
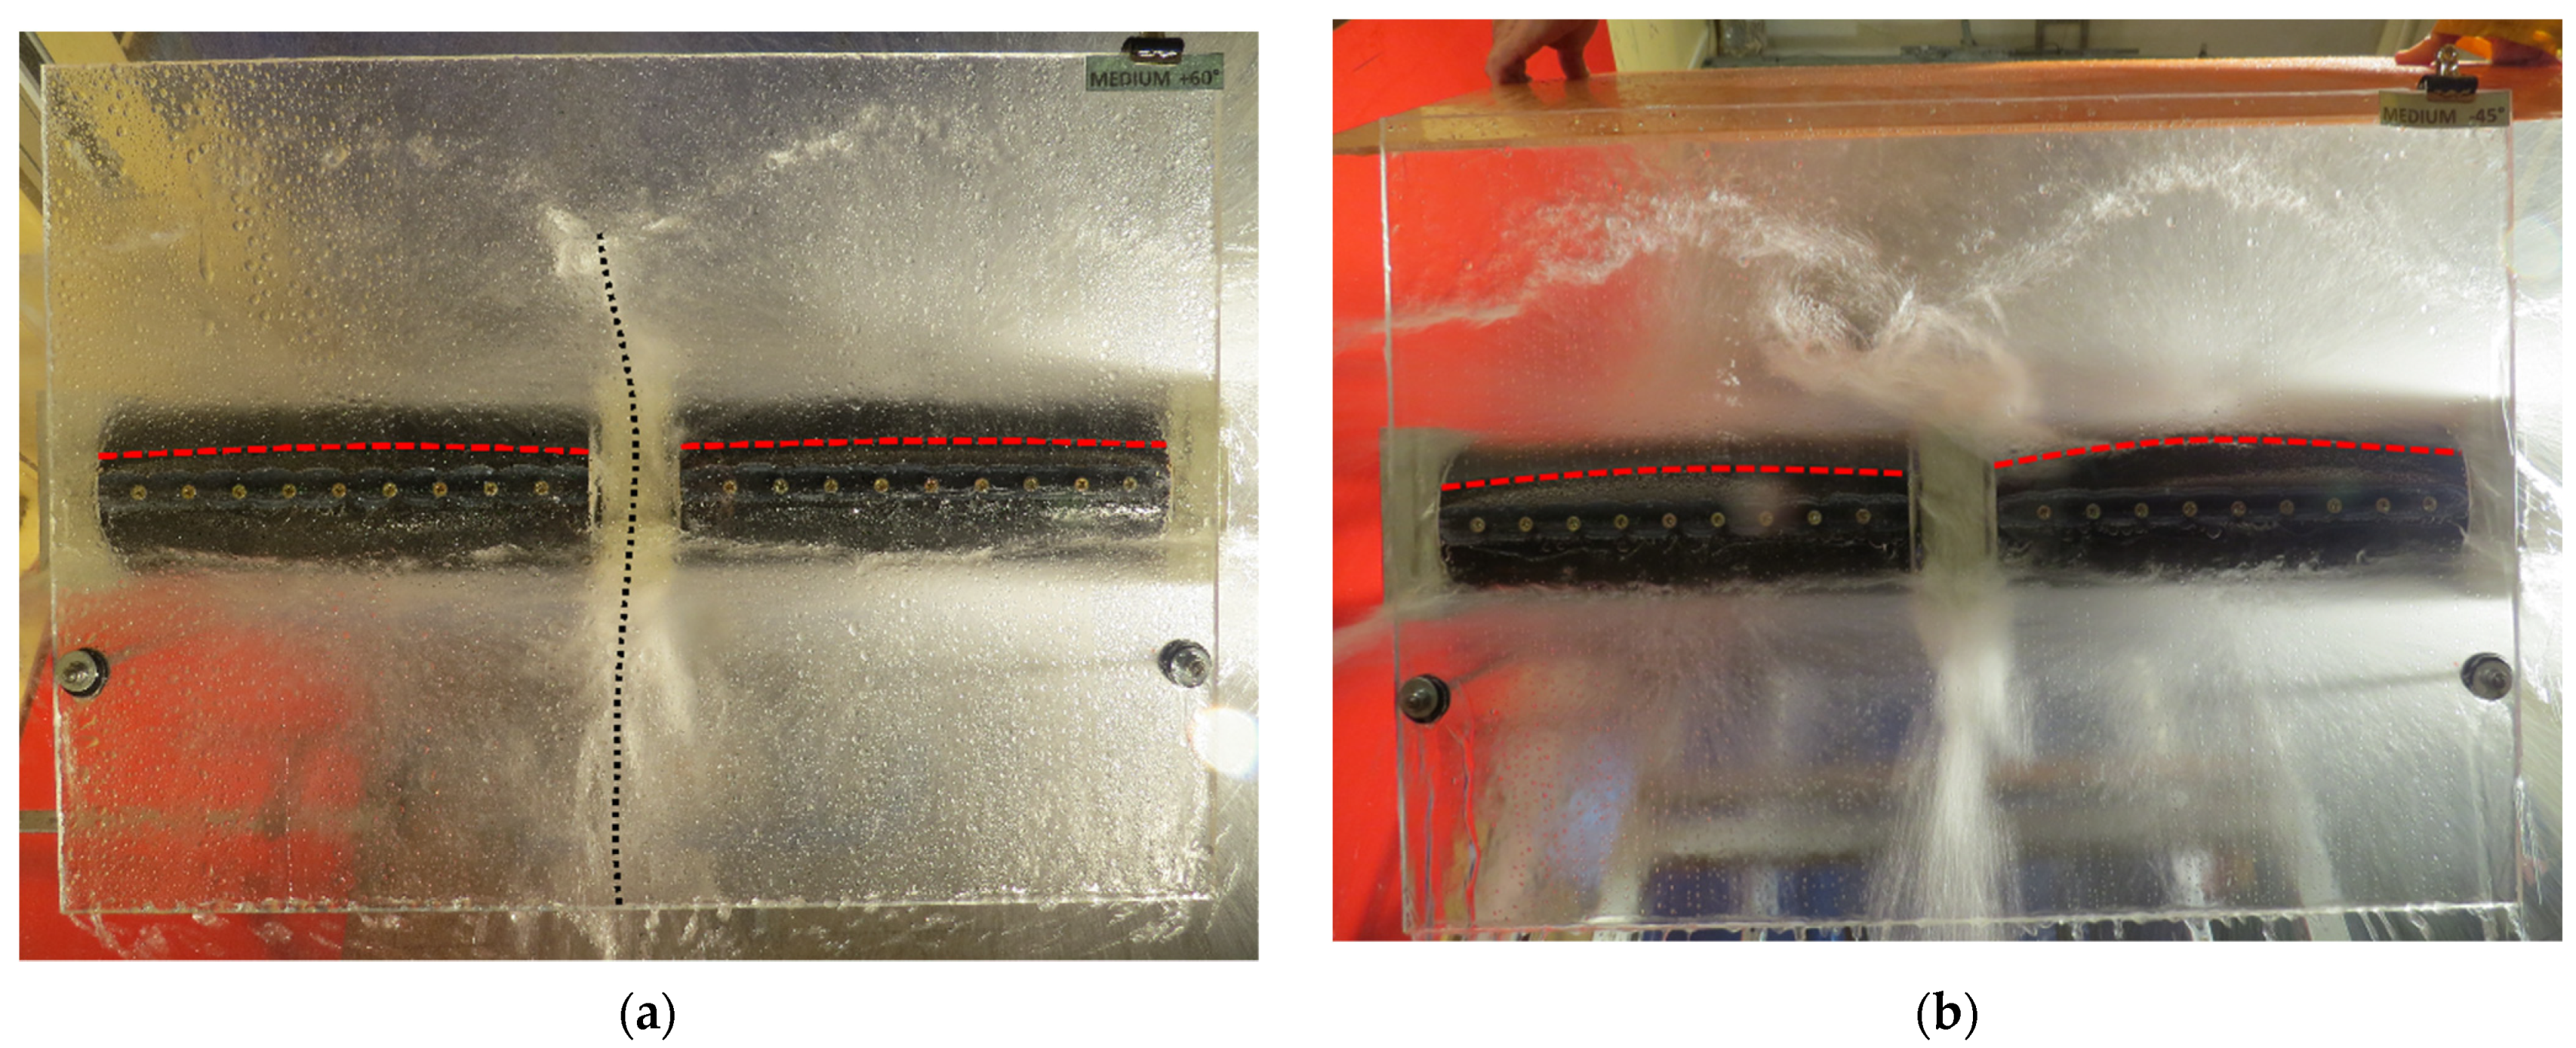
Figure 9 shows the test benches in an inclined position. The figure on the left (a) shows upwards spraying and the figure on the right (b) shows downwards spraying. The nozzle’s footprint and water flow distribution over the surface is only slightly dependent on the inclination, as can be seen in Figure 8. The boundaries of the footprint are marked by the dotted line. Small differences can be observed at the height of the water layer between the roller and the slab. It can be observed that the amount of water accumulated in the V-shaped gap is larger when the nozzles spray downwards.
Generally, the photos from all experiments suggest that there is less water in the space above the cylinder for larger angles (+60°) than for smaller angles (−60°, −45°, −30°, 0°, +30°).
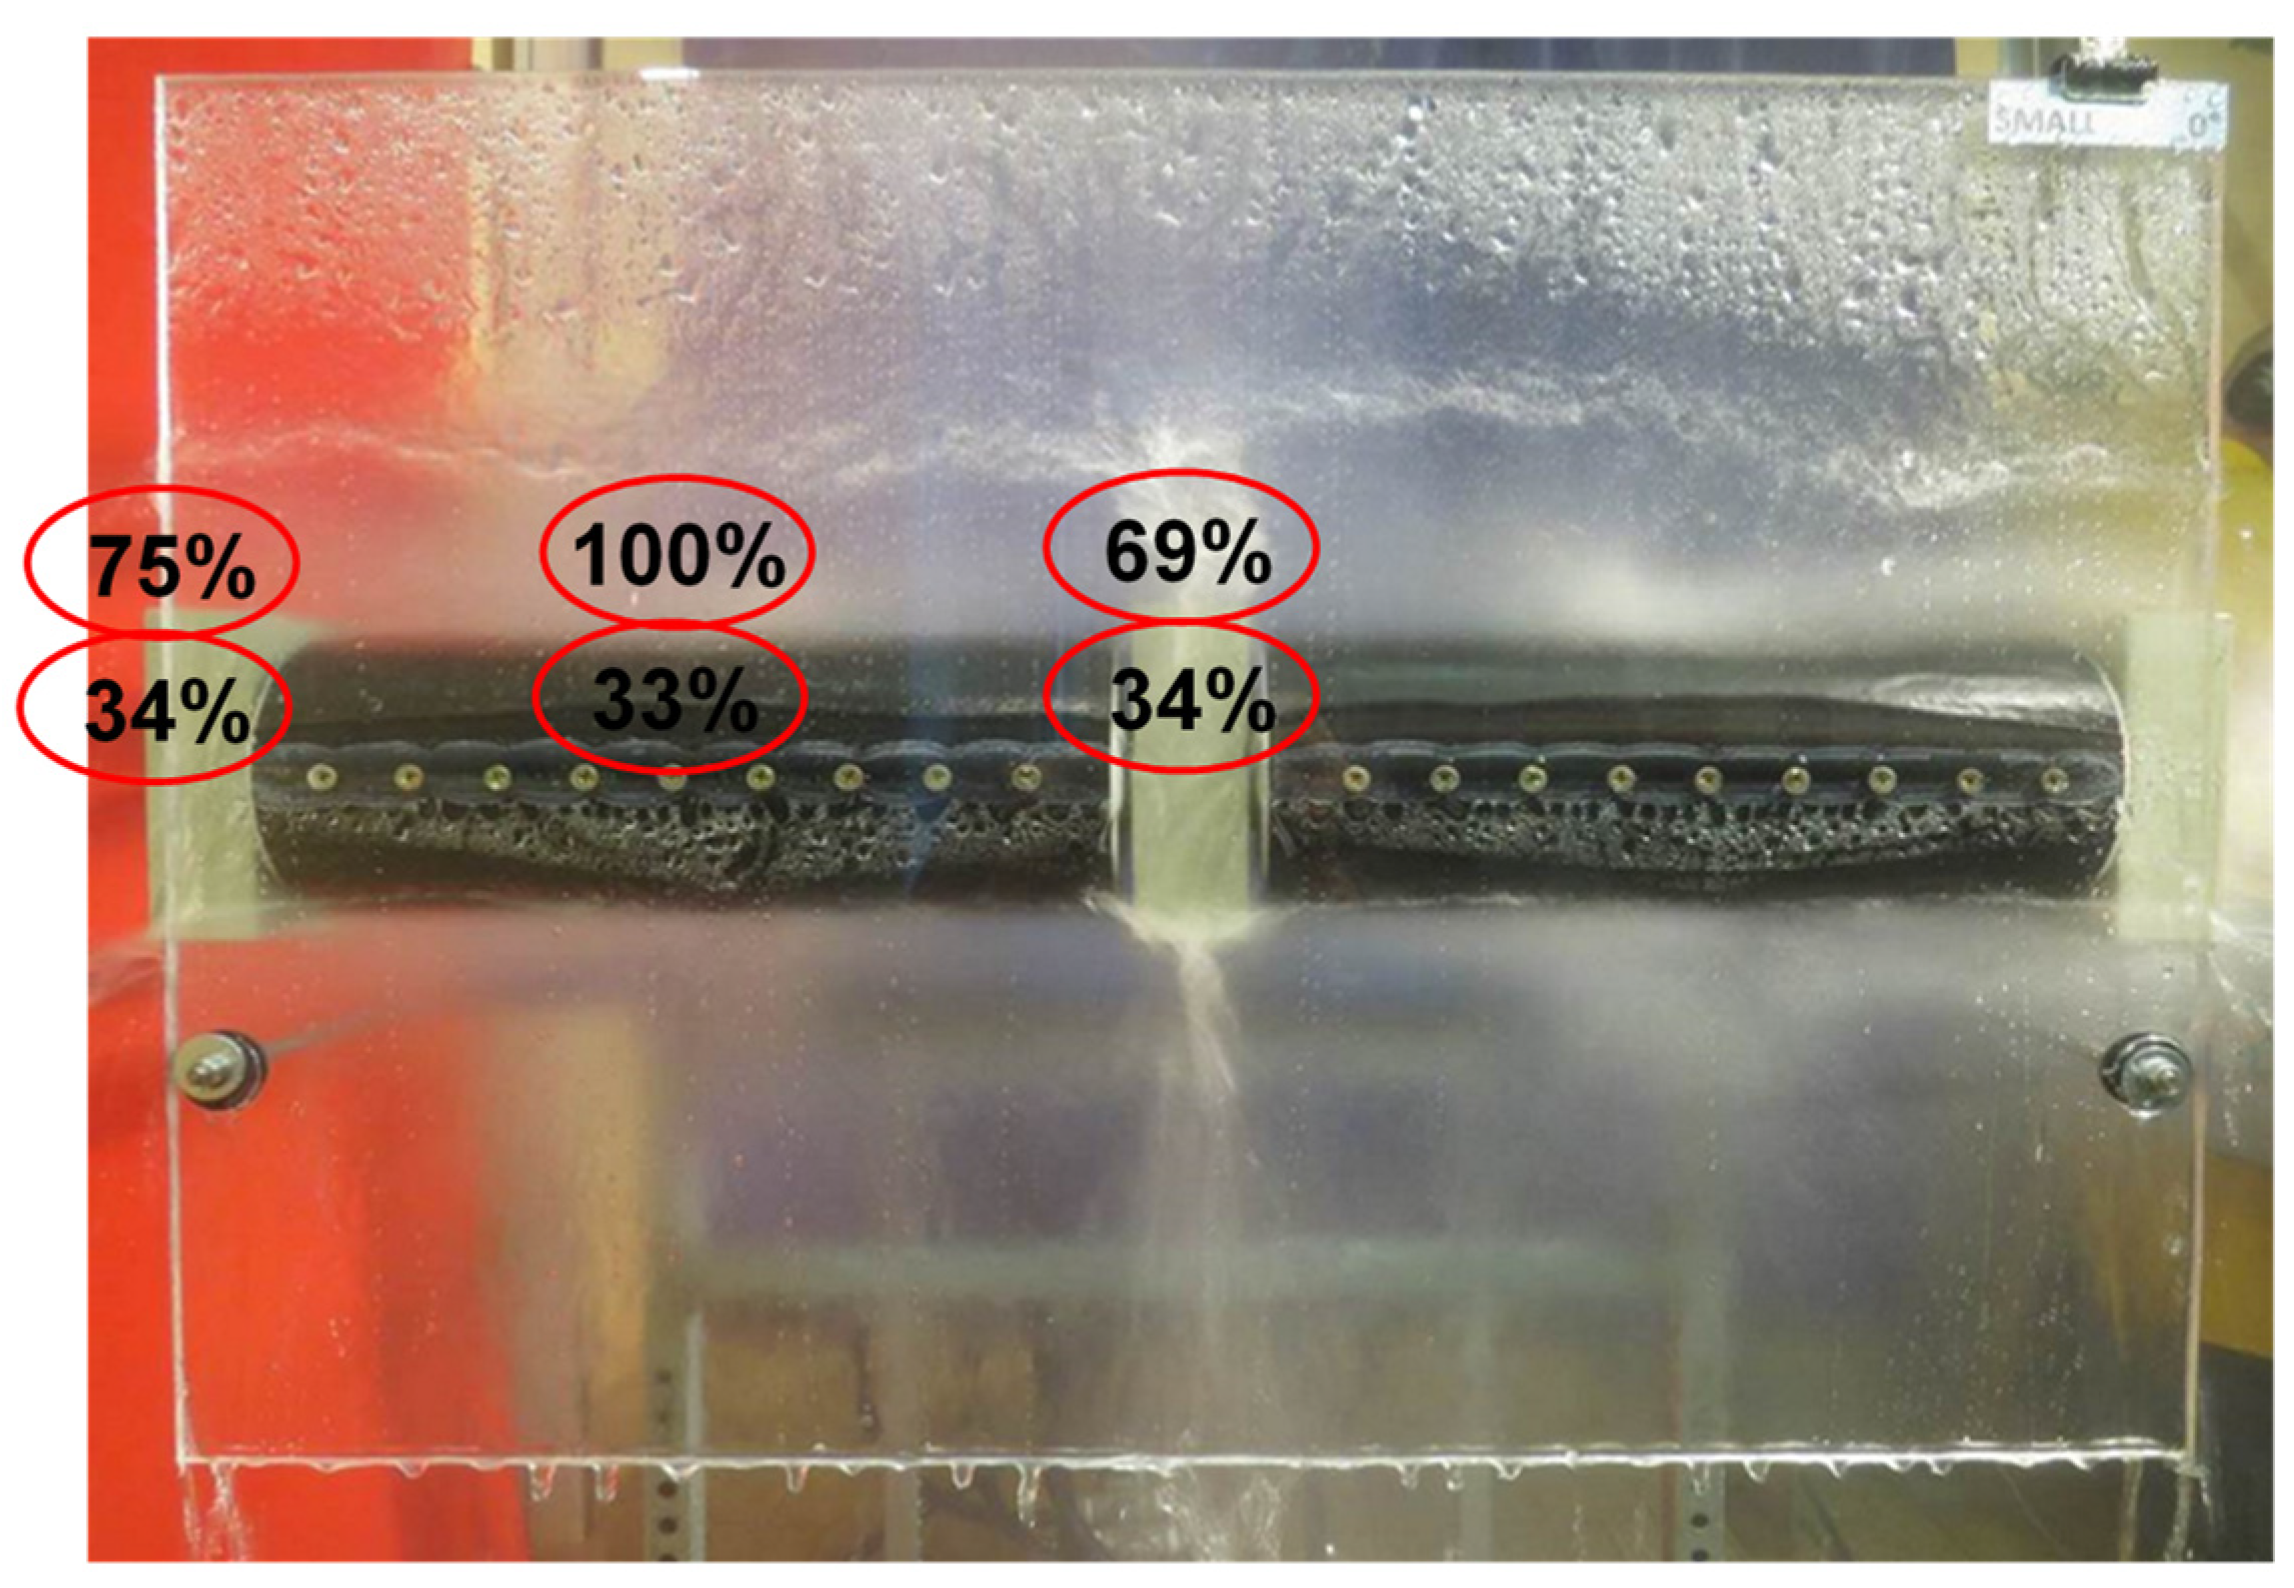
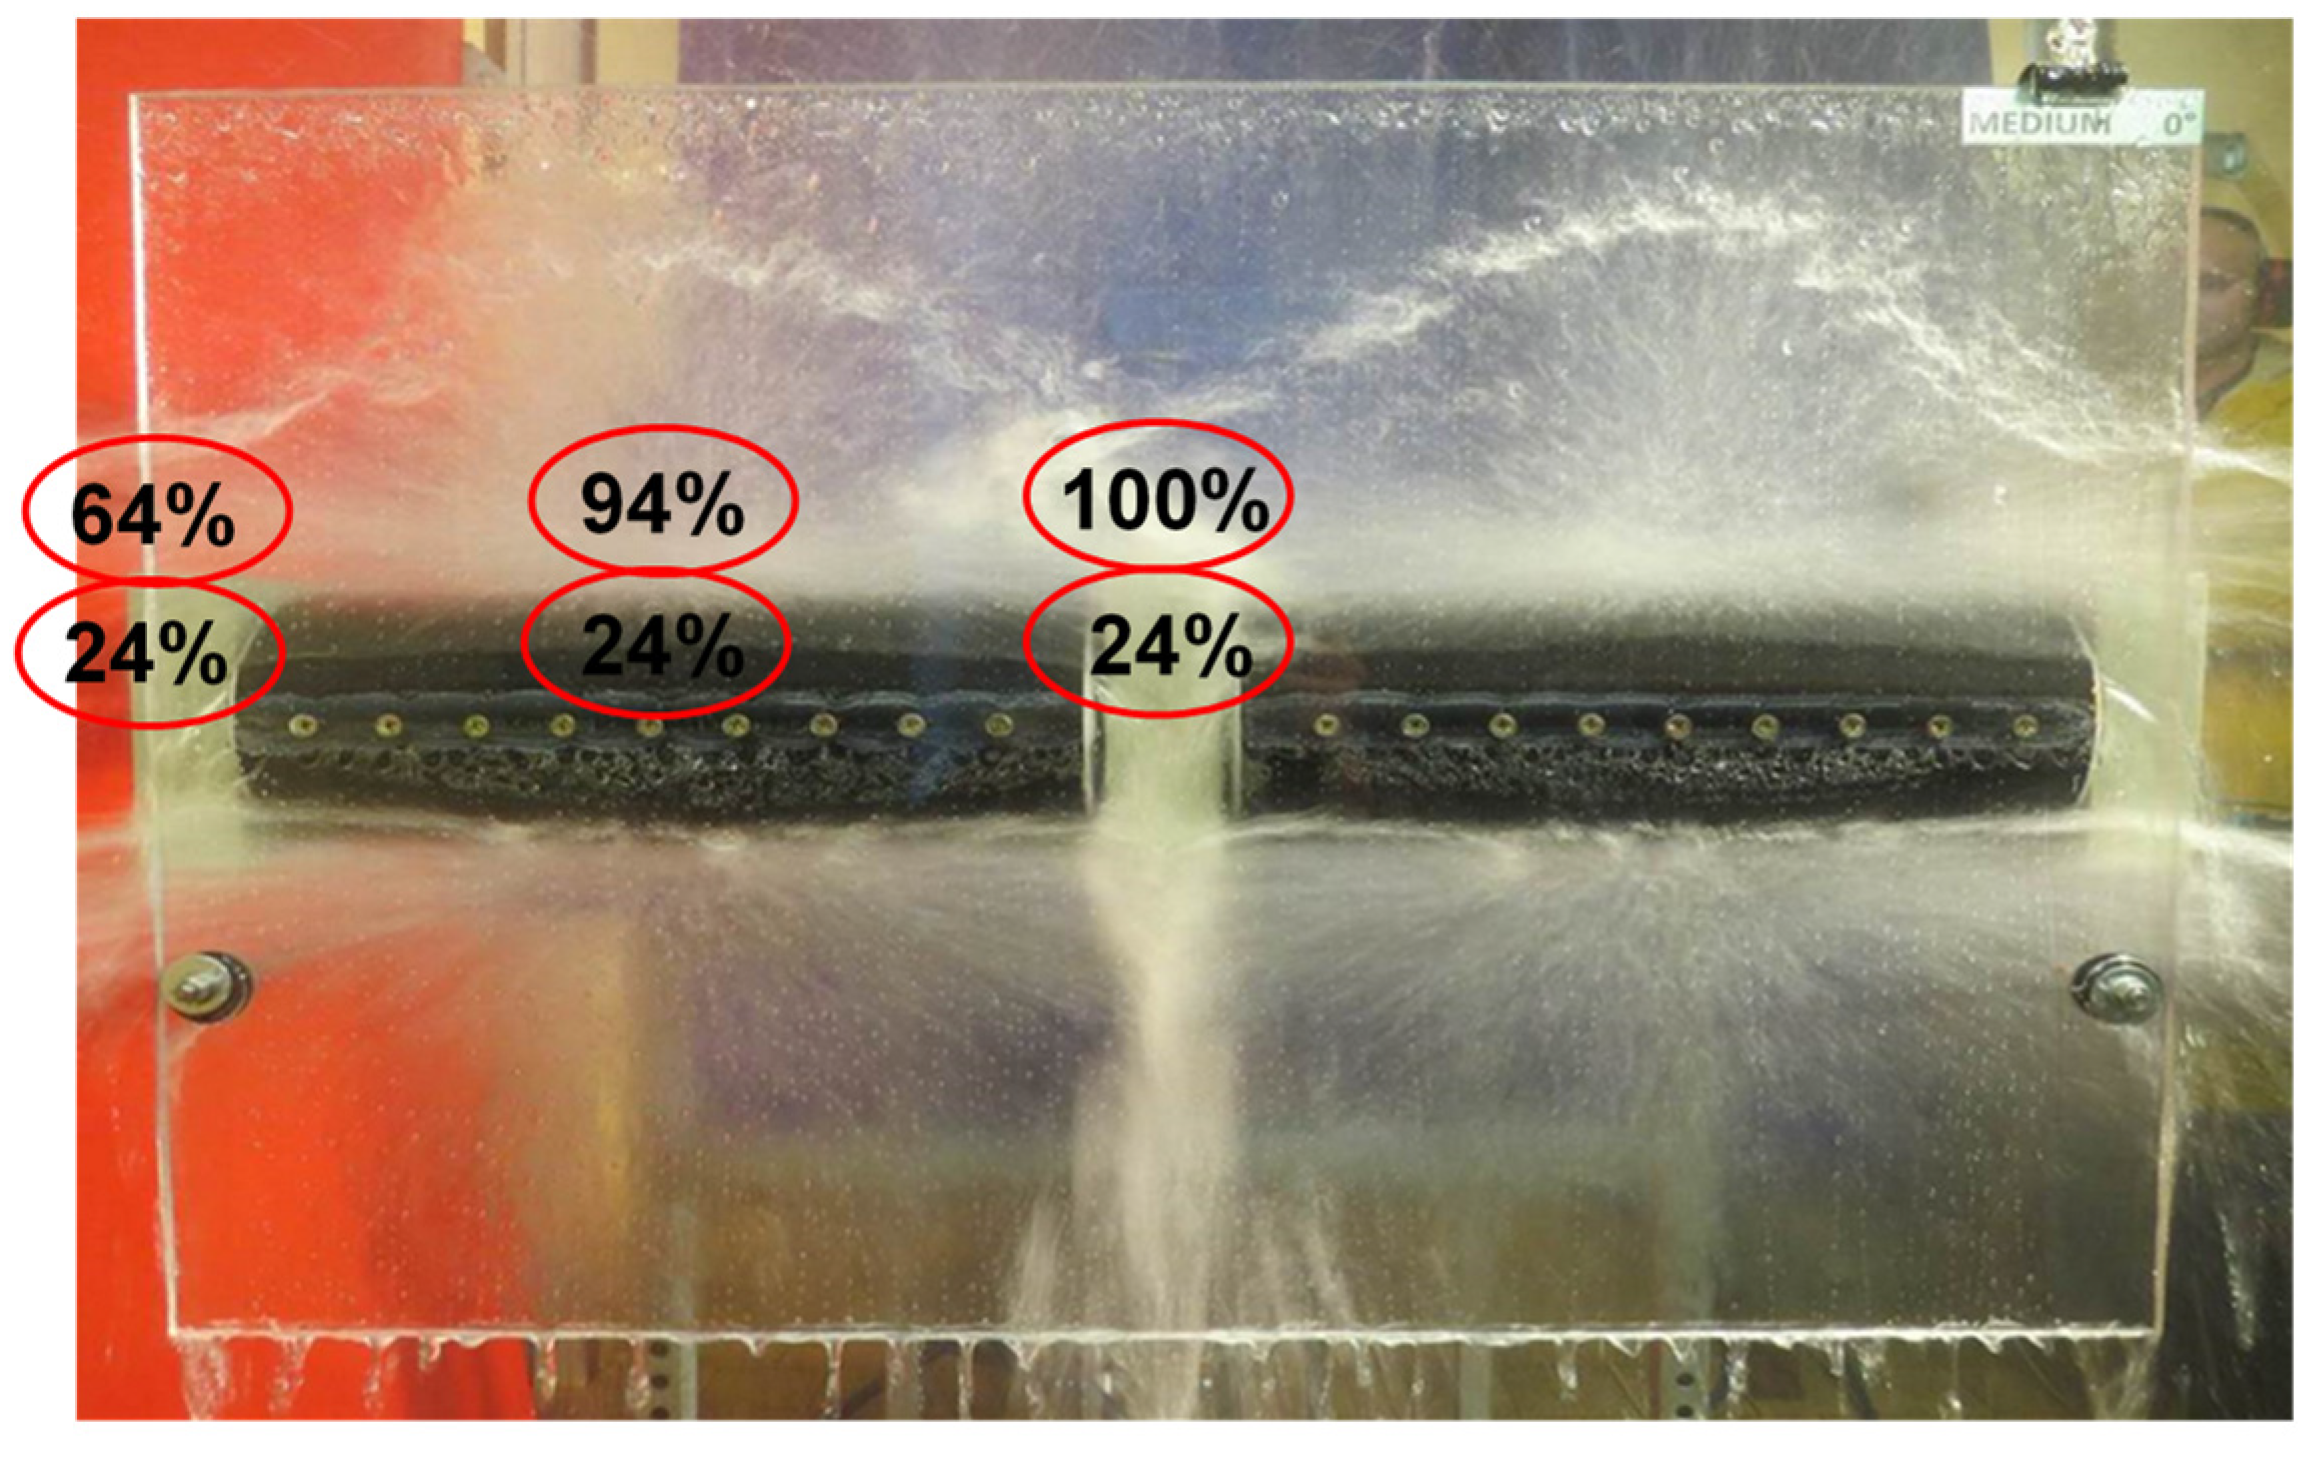
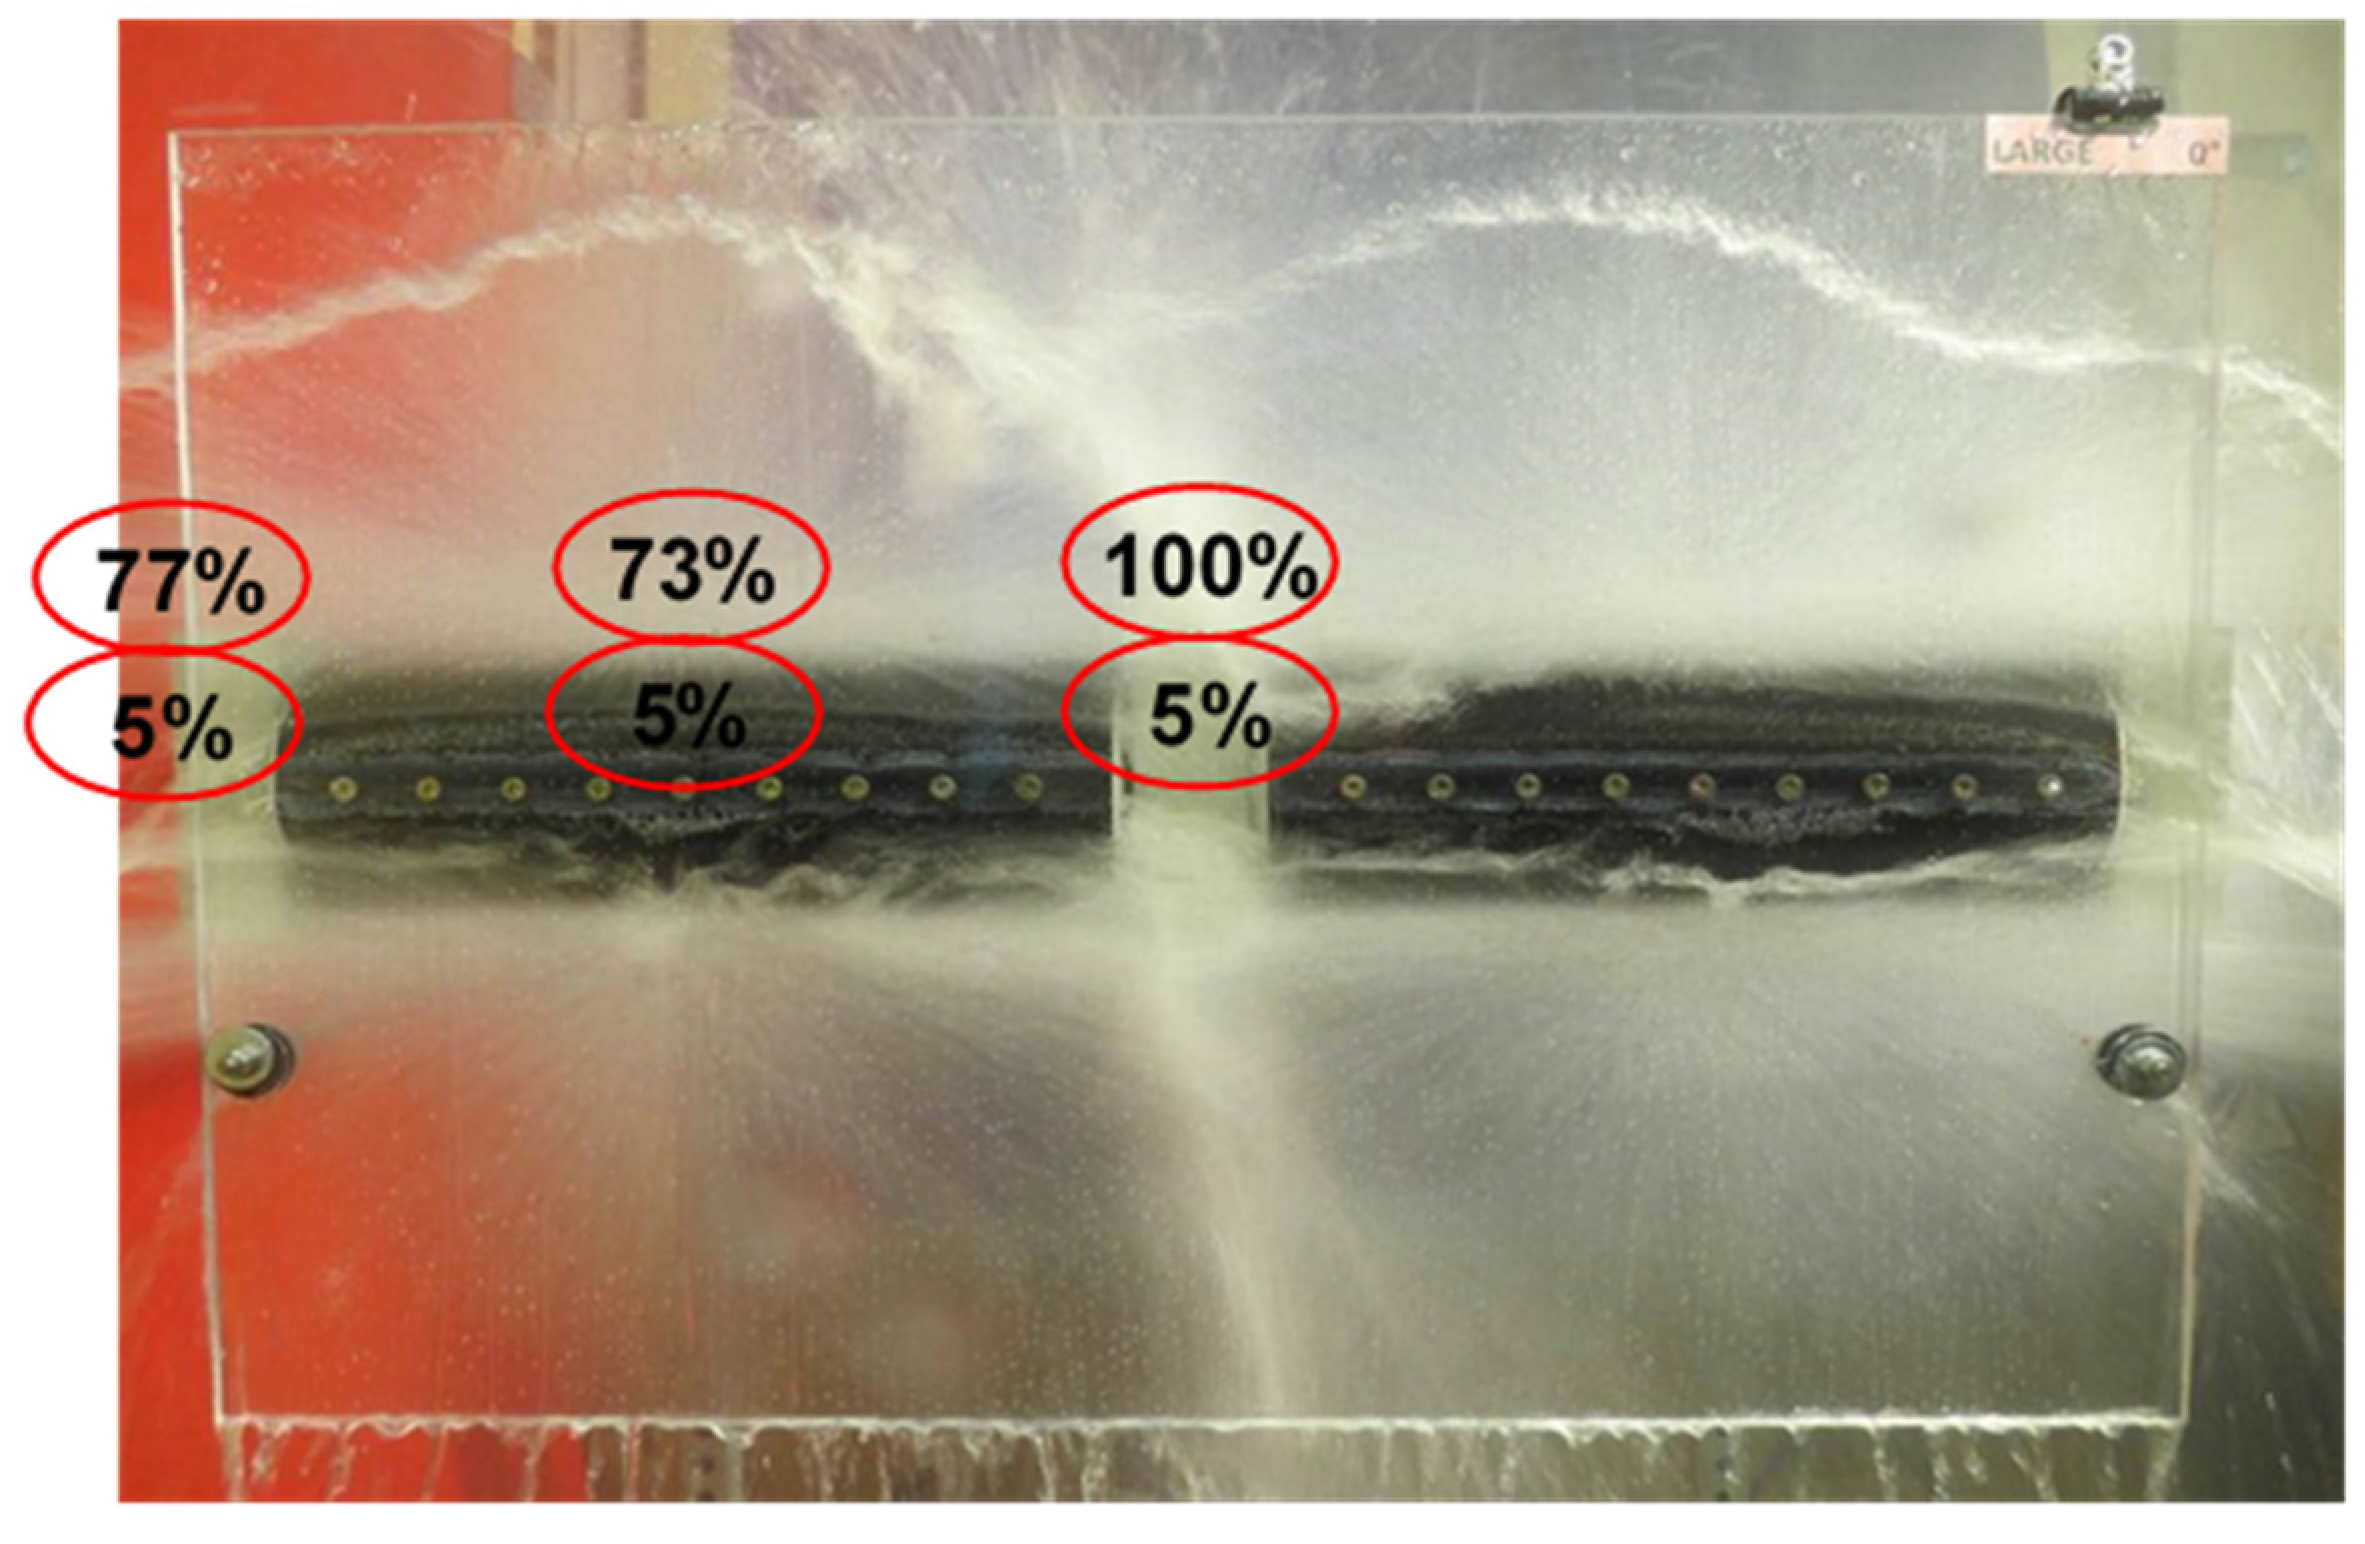
It is often assumed that the V-shaped gap between the strand and the roll is filled with water [13]. However, in cold tests, it was observed that any water in a V-shaped gap was intensively discharged. The results for three levels of spray intensity are shown in Figure 10, Figure 11, and Figure 12 for a low, medium, and high flowrate, respectively. A V-shaped gap below the roll is washed out for medium and high flow (against gravitational forces). For the low flow, there is only some water. The gap is not filled, and therefore, it is not washed out.
3.2. Hot Test
The most important results are the thermal images from the cooling experiments (see Figure 7). The test plate, the rollers, and the impact footprint of nozzles are marked in the thermal image from the infra-camera. This makes it easy to see how the cooling intensity is related to the impact footprint of nozzles and structures on the surface.
An inverse task was also used for evaluation of cooling intensity on the cooled surface [11,12]. The use of an infrared camera allows the heat transfer coefficient (HTC) value to be evaluated at any point of the scanned surface by solving the inverse heat conduction problem. Relative HTC values for three levels of flow rates are plotted in selected places in the corresponding figures from the cold test (see Figure 10, Figure 11, and Figure 12). The main result is that no supercooled area below the bearing pocket is observed, in contrast to the areas below the rollers, despite the fact that a large amount of water flows through the gap between the rollers (under the bearing pocket). This is due to the low impact pressure of the flowing water, which is insufficient to break the vapor layer at the high temperatures found on the slab.
The measurements showed that the nozzles have significant inhomogeneous cooling intensity along the spray width (see Figure 10). Moreover, the cooling intensity distribution in the nozzle’s footprint is dependent on the water flowrate. The values were determined at 6 points. The upper row lies directly under the nozzles. The second row is for the area closer to the roll. Maximum cooling intensity is found under the nozzle for the low flowrate (Figure 10). When the water flowrate increases, the maximum cooling intensity shifts along the spray width from the center to the overlap region (Figure 11). When the maximum water flow rate was used, the maximum cooling intensity was in the overlap region and cooling also increased on the edge of the plate (Figure 12). The measurements also showed that this effect (effect of shifting the cooling intensity depending on the water flow rate) is not present at a high temperature (for experiment with heating temperature increased to 1100 °C). The reason is that the water is separated from the surface by a vapor layer (see Leidenfrost effect [14]).
4. Conclusions
The design of the experiment for cooling homogeneity tests (hot and cold test) was developed in Heat Transfer and Fluid Flow Laboratory. Cold tests were performed with a transparent plate to allow observation both from the front and rear side. An infrared camera was used to record temperature distribution on the rear side of the test plate during hot tests. The experimental technique that was developed allows the study of fluid flow and cooling distribution on a plate with attached rolls and bearing pockets. Both cold and hot tests were done with the cooled surface in variable positions. The complete experimental setup can be tilted, and this feature allows us to study changes in cooling when the slope of the test plate and the direction of the nozzle spray is changed.
Cold tests showed the interaction between jets from neighboring nozzles and the distribution of flow around segmented rolls and between rolls divided by bearing pockets. New findings showed intensive discharge of the accumulated water from the V-gap between the rolls and the strand on the upper side of the rolls. An interesting effect was observed on the underside of the rolls where the V-gap was partially filled by water moving upwards dynamically on the strand surface against gravity. The water in the gap between the rollers and the slab is not just standing. Water is intensively flushed along the rollers into the gap under the bearing pocket, where very intensive flow can be observed.
The hot test showed that the presence of bearing pockets does not have a dominant influence on the homogeneity of cooling, unlike the design of cooling itself. In addition, the position of the maximum cooling intensity changes as the water flow rate increases, for the tested nozzles configuration. The position of maximum cooling observed along the spray width is different for each tested flow rate (low, medium, and high). The choice of nozzles and their overlaps has a much more significant influence on cooling homogeneity. In the future, it would be interesting to develop a numerical model of the experiment to predict the cooling homogeneity. However, this is far beyond the scope of this paper because it requires a twin fluid flow model with evaporation and phase change in a large domain with very small droplets.
Author Contributions
Conceptualization, J.-Y.H.; writing—original draft, J.K. and T.L.; writing—review and editing, M.P. All authors have read and agreed to the published version of the manuscript.
Funding
The paper presented was supported by an internal grant of the Brno University of Technology focused on specific research and development No. FSI-S-20-6478.
Institutional Review Board Statement
Not applicable.
Informed Consent Statement
Not applicable.
Data Availability Statement
Data sharing not applicable.
Conflicts of Interest
The authors declare no conflict of interest.
References
- Stetina, J.; Mauder, T.; Klimes, L.; Kavicka, F. Minimization of surface defects by increasing the surface temperature during the straightening of a continuously cast slab. Mater. Tehnol. 2013, 47, 311–316. [Google Scholar]
- Mauder, T.; Stetina, J. High Quality Steel Casting by Using Advanced Mathematical Methods. Metals 2018, 8, 1019. [Google Scholar] [CrossRef] [Green Version]
- Raudensky, M.; Hnizdil, M.; Hwang, J.Y.; Lee, S.H.; Kim, S.Y. Influence of the water temperature on the cooling intensity of mist nozzles in continuous casting. Mater. Tehnol. 2012, 46, 311–315. [Google Scholar]
- Hnizdil, M.; Chabicovsky, M.; Raudenský, M.; Magadoux, E.; Code, F. Spray Cooling Unit for Heat Treatment of Stainless Steel Sheets. Available online: https://www.scientific.net/AMR.936.1720 (accessed on 8 October 2020).
- Brožová, T.; Chabičovský, M.; Horský, J. Influence of the surface roughness on the cooling intensity during spray cooling. In Proceeding of the 25th Anniversary International Conference on Metallurgy and Materials, Brno, Czech Republic, 25–27 May 2016; pp. 41–46. [Google Scholar]
- Zhang, Y.; Wen, Z.; Zhao, Z.; Bi, C.; Guo, Y.; Huang, J. Laboratory Experimental Setup and Research on Heat Transfer Characteristics during Secondary Cooling in Continuous Casting. Metals 2019, 9, 61. [Google Scholar] [CrossRef] [Green Version]
- Tsutsumi, K.; Kubota, J.; Hosokawa, A.; Ueoka, S.; Nakano, H.; Kuramoto, A.; Sumi, I. Effect of Spray Thickness and Collision Pressure on Spray Cooling Capacity in a Continuous Casting Process. Steel Res. Int. 2018, 89. [Google Scholar] [CrossRef]
- Yu, K.-O. Modeling for Casting and Solidification Processing; Marcel Dekker: New York, NY, USA, 2002; ISBN 978-0-8247-8881-0. [Google Scholar]
- Qin, Q.; Li, M.; Huang, J. Analysis of the Influence of Segmented Rollers on Slab Bulge Deformation. Metals 2019, 9, 231. [Google Scholar] [CrossRef] [Green Version]
- Chabičovský, M.; Resl, O.; Raudenský, M. Impact of oxide layer on spray cooling intensity and homogeneity during continuous casting of the steel. In Proceedings of the 27th International Conference on Metallurgy and Materials, Brno, Czech Republic, 23–25 May 2018; pp. 69–74. [Google Scholar]
- Keith, A. Woodbury Inverse Engineering Handbook; CRC Press: Boca Raton, FL, USA, 2003; ISBN 978-0-8493-0861-1. [Google Scholar]
- Beck, J.V.; Blackwell, B.; Clair, C.R.S., Jr. Inverse Heat Conduction: Ill.-Posed Problems, 1st ed.; Wiley-Interscience: New York, NY, USA, 1985; ISBN 978-0-471-08319-1. [Google Scholar]
- Javurek, M.; Mittermair, A. Secondary Cooling: Heat Transfer Measurement—Comparison of Different Methods. In Proceedings of the 4th ESTAD Conference, Düsseldorf, Germany, 24–28 June 2019. [Google Scholar]
- Raudensky, M.; Horsky, J.; Dumek, V.; Kotrbacek, P. Experimental study of Leidenfrost phenomena at hot sprayed surface. In Proceedings of the ASME 2003 Heat Transfer Summer Conference, Las Vegas, NV, USA, 21–23 July 2003; pp. 355–359. [Google Scholar]
Figure 1.
Configuration scheme, top view of slab with segmented rolls and bearing pockets.

Figure 2.
Scheme of test geometrical configuration.

Figure 3.
Experimental device for cold test.

Figure 4.
Example of water distribution (vertical plate, medium flow): (a) front view; (b) rear view.
Figure 4.
Example of water distribution (vertical plate, medium flow): (a) front view; (b) rear view.

Figure 5.
Experimental device for hot test.

Figure 6.
Hot cooling test, plate in vertical position.

Figure 7.
Example of measured temperature distribution after filtration and emissivity correction, situation shown in Figure 6 (black line shows edge of test plate and position of rolls, blue line shows impact area of mist nozzles, and blue crosses show axes of the nozzles). The scale of the axes is in pixels.

Figure 8.
Comparison of nozzle footprint for tilt: (a) +60° (left, nozzles spray upwards) and (b) −45° (right, nozzles spray downwards); nozzles and flow rate are identical; the red dashed lines indicate the water level in the V-shaped gap and the black dotted line marks stagnation points.
Figure 8.
Comparison of nozzle footprint for tilt: (a) +60° (left, nozzles spray upwards) and (b) −45° (right, nozzles spray downwards); nozzles and flow rate are identical; the red dashed lines indicate the water level in the V-shaped gap and the black dotted line marks stagnation points.

Figure 9.
Example of experiment with tilt: (a) +60°(upwards); (b) −60°(downwards).

Figure 10.
Relative cooling intensities for low flowrate.

Figure 11.
Relative cooling intensities for medium flowrate.

Figure 12.
Relative cooling intensities for high flowrate.


Table 1.
Spray parameters.
| Experiment Setting | Water Flow per Single Nozzle (l/min) | Water Pressure (Bar) | Air Pressure (Bar) |
|---|---|---|---|
| Low flowrate | 1.5 | 0.5 | 0.8 |
| Medium flowrate | 15 | 2.0 | 1.0 |
| High flowrate | 30 | 8.0 | 3.5 |
Publisher’s Note: MDPI stays neutral with regard to jurisdictional claims in published maps and institutional affiliations. |
© 2021 by the authors. Licensee MDPI, Basel, Switzerland. This article is an open access article distributed under the terms and conditions of the Creative Commons Attribution (CC BY) license (https://creativecommons.org/licenses/by/4.0/).
Share and Cite
MDPI and ACS Style
Kominek, J.; Luks, T.; Pohanka, M.; Hwang, J.-Y. Influence of Segmented Rolls on Homogeneity of Cooling in Continuous Casting. Metals 2021, 11, 1232. https://doi.org/10.3390/met11081232
AMA Style
Kominek J, Luks T, Pohanka M, Hwang J-Y. Influence of Segmented Rolls on Homogeneity of Cooling in Continuous Casting. Metals. 2021; 11(8):1232. https://doi.org/10.3390/met11081232
Chicago/Turabian StyleKominek, Jan, Tomas Luks, Michal Pohanka, and Jong-Yeon Hwang. 2021. "Influence of Segmented Rolls on Homogeneity of Cooling in Continuous Casting" Metals 11, no. 8: 1232. https://doi.org/10.3390/met11081232
Note that from the first issue of 2016, this journal uses article numbers instead of page numbers. See further details here.