
Behavior of Offshore Pile in Calcareous Sand—Case Study


1
Geotechnical Engineering Department, Zagazig University, Zagazig 44519, Egypt
2
Department of Disaster Mitigation for Structures, Tongji University, Siping Road, Yangpu District, Shanghai 200092, China
*
Author to whom correspondence should be addressed.
J. Mar. Sci. Eng. 2021, 9(8), 839; https://doi.org/10.3390/jmse9080839
Submission received: 20 June 2021
/
Revised: 24 July 2021
/
Accepted: 28 July 2021
/
Published: 2 August 2021
(This article belongs to the Section Geological Oceanography)
Abstract
:The erosion of limestone and calcarenite ridges that existed parallel to the Mediterranean shoreline forms the calcareous sand (CS) formation at the surface layer of Egypt’s northern coast. The CS is often combined with broken shells which are considered geotechnically problematic due to their possible crushability and relatively high compressibility. In this research, CS samples collected from a site along the northern coast of Egypt are studied to better understand its behavior under normal and shear stresses. Reconstituted CS specimens with different ratios of broken shells (BS) are also investigated to study the effect of BS ratios on the soil mixture strength behavior. The strength is evaluated using laboratory direct-shear and one-dimensional compression tests (oedometer test). The CS specimens are not exposed to significant crushability even under relatively high-stress levels. In addition, a 3D finite element analysis (FEA) is presented in this paper to study the degradation offshore pile capacity in CS having different percentages of BS. The stress–strain results using oedometer tests are compared with a numerical model, and it gave identical matching for most cases. The effects of pile diameter and embedment depth parameters are then studied for the case study on the northern coast. Three different mixing ratios of CS and BS have been used, CS + 10% BS, CS + 30% BS, and CS + 50% BS, which resulted in a decrease of the ultimate vertical compression pile load capacity by 8.8%, 15%, and 16%, respectively.
1. Introduction
Piled foundations for large floating and fixed offshore structures are constructed in CS in many coastal zones, consisting of carbonate particles of various shapes and sizes. This type of soil is found scattered around the world, to name a few, Oahu beaches, Barry’s beach, Mediterranean coastal line between Alexandria and Marsa Matrouh cities, Bass Strait southwest coast of Australia, and South China Sea (Nansha Islands) [1,2,3,4,5]. One of these soils’ properties is their proclivity to crush when subjected to modest forces, [2,6,7] observing that the amount of particles crushing during loading and deformation significantly impacts the soil strength and stress–strain behavior. It was proved by [6] that crushing resistance increases with increasing particle size. On the contrary, the shearing resistance increases as the particle size decreases. Reviews of literature about several types of piles in CS and the characteristics and behavior of CS was summarized by [8]. Based on the pile load test results, it is found that the pile capacities in CS are low with high variability and conflicting results. In addition, the choice of soil strength parameters could be more challenging to evaluate because most of the strength theories consider that soil particles are incompressible, [8,9,10,11]. For these reasons, the design and construction of several types of foundations in calcareous soil sediments need greater focus and understanding of the nature and properties of these problematic soil formations, especially for deposits of biogenic origin [12,13].
Several researchers proposed classifications for calcareous sediments soil [6,14,15,16]. However, there is no standard or code for this type of soil, as it is difficult to quantify its cementation level and susceptibility to crushing; significant steps toward a detailed understanding of the behavior and axial load capacity of driven piles in CS to determine end bearing, skin friction resistance, and load-deformation relationships for piles in CS through utilizing the CPT data are represented by [17,18]. The response of piles in CS were experimentally studied by [14,19,20] and they figured out that the limiting skin friction and end-bearing capacities for piles in the carbonate sediments are based on site-specific experience. Piles installed in CS show strength degradation in the overall pile capacity mainly due to soil particle breakage [12].
The physical properties of CS exhibit lower densities,, and higher void ratios, , and specific gravity, , than siliceous sand [5,8,12,21,22]. The high specific gravity of vgenerally ranges between 2.75 and 2.85 based on its main mineralogy composition, such as calcite and aragonite . In contrast, silica sand presents a lower value of specific gravity due to its mineral composition of quartz, with a specific gravity of 2.65 [23]. For example, the values for the CS from Florida and Guam are about 2.80 or greater [24], whereas the value for quartz sands is about 2.65 [17]. The inclusion of crushed shells and corals with cavities and voids inside their bodies or on their surfaces contributes to the high value of the intra-particle void space [21]. CS from the northern coast beach along the Mediterranean western coast road is formed mainly from weathering and denudation of limestone ridges along the coastal line.
The CS particles fracture when subjected to a high compressive stress level. However, the amount of these fractured particles is not specified quantitatively [25]. The particle crushing process depends on the particle strength, size, shape, gradation, density, stress anisotropy, etc. It causes complexities in estimating engineering properties such as permeability, shear strength, and compressibility of sand soils [25,26]. In laboratory testing of sands, there can be significant crushing of up to 50% by weight after testing the sand soil sample uniaxially under high stress around 100 MPa [26]. Unusually, [25,26,27,28] used the oedometer test to determine the load-voids ratio relationships not only for clayey soil but also for crushable CS.
This study provides a novel technique to analyze and assess the offshore piles in CS with and without BS based on lab test results that can be used in the FEA for the offshore pile model. The research starts with investigating the physical and mechanical properties of the CS and CS with various ratios of BS samples from a site at the northern coast, Egypt. The angle of internal friction and the stress–strain curve are obtained for all samples using direct shear and oedometer tests, respectively. Following that, a numerical study for the tested specimens is performed and verified with the oedometer lab results. Finally, parametric analysis for a pile in the soil under study is presented to investigate its axial response in such a soil formation. It should be noted that this paper is a part of a comprehensive research program intended for the complete characterization of CS in Egypt. More details are presented in [29,30,31].
2. Site Investigation of the Study Site
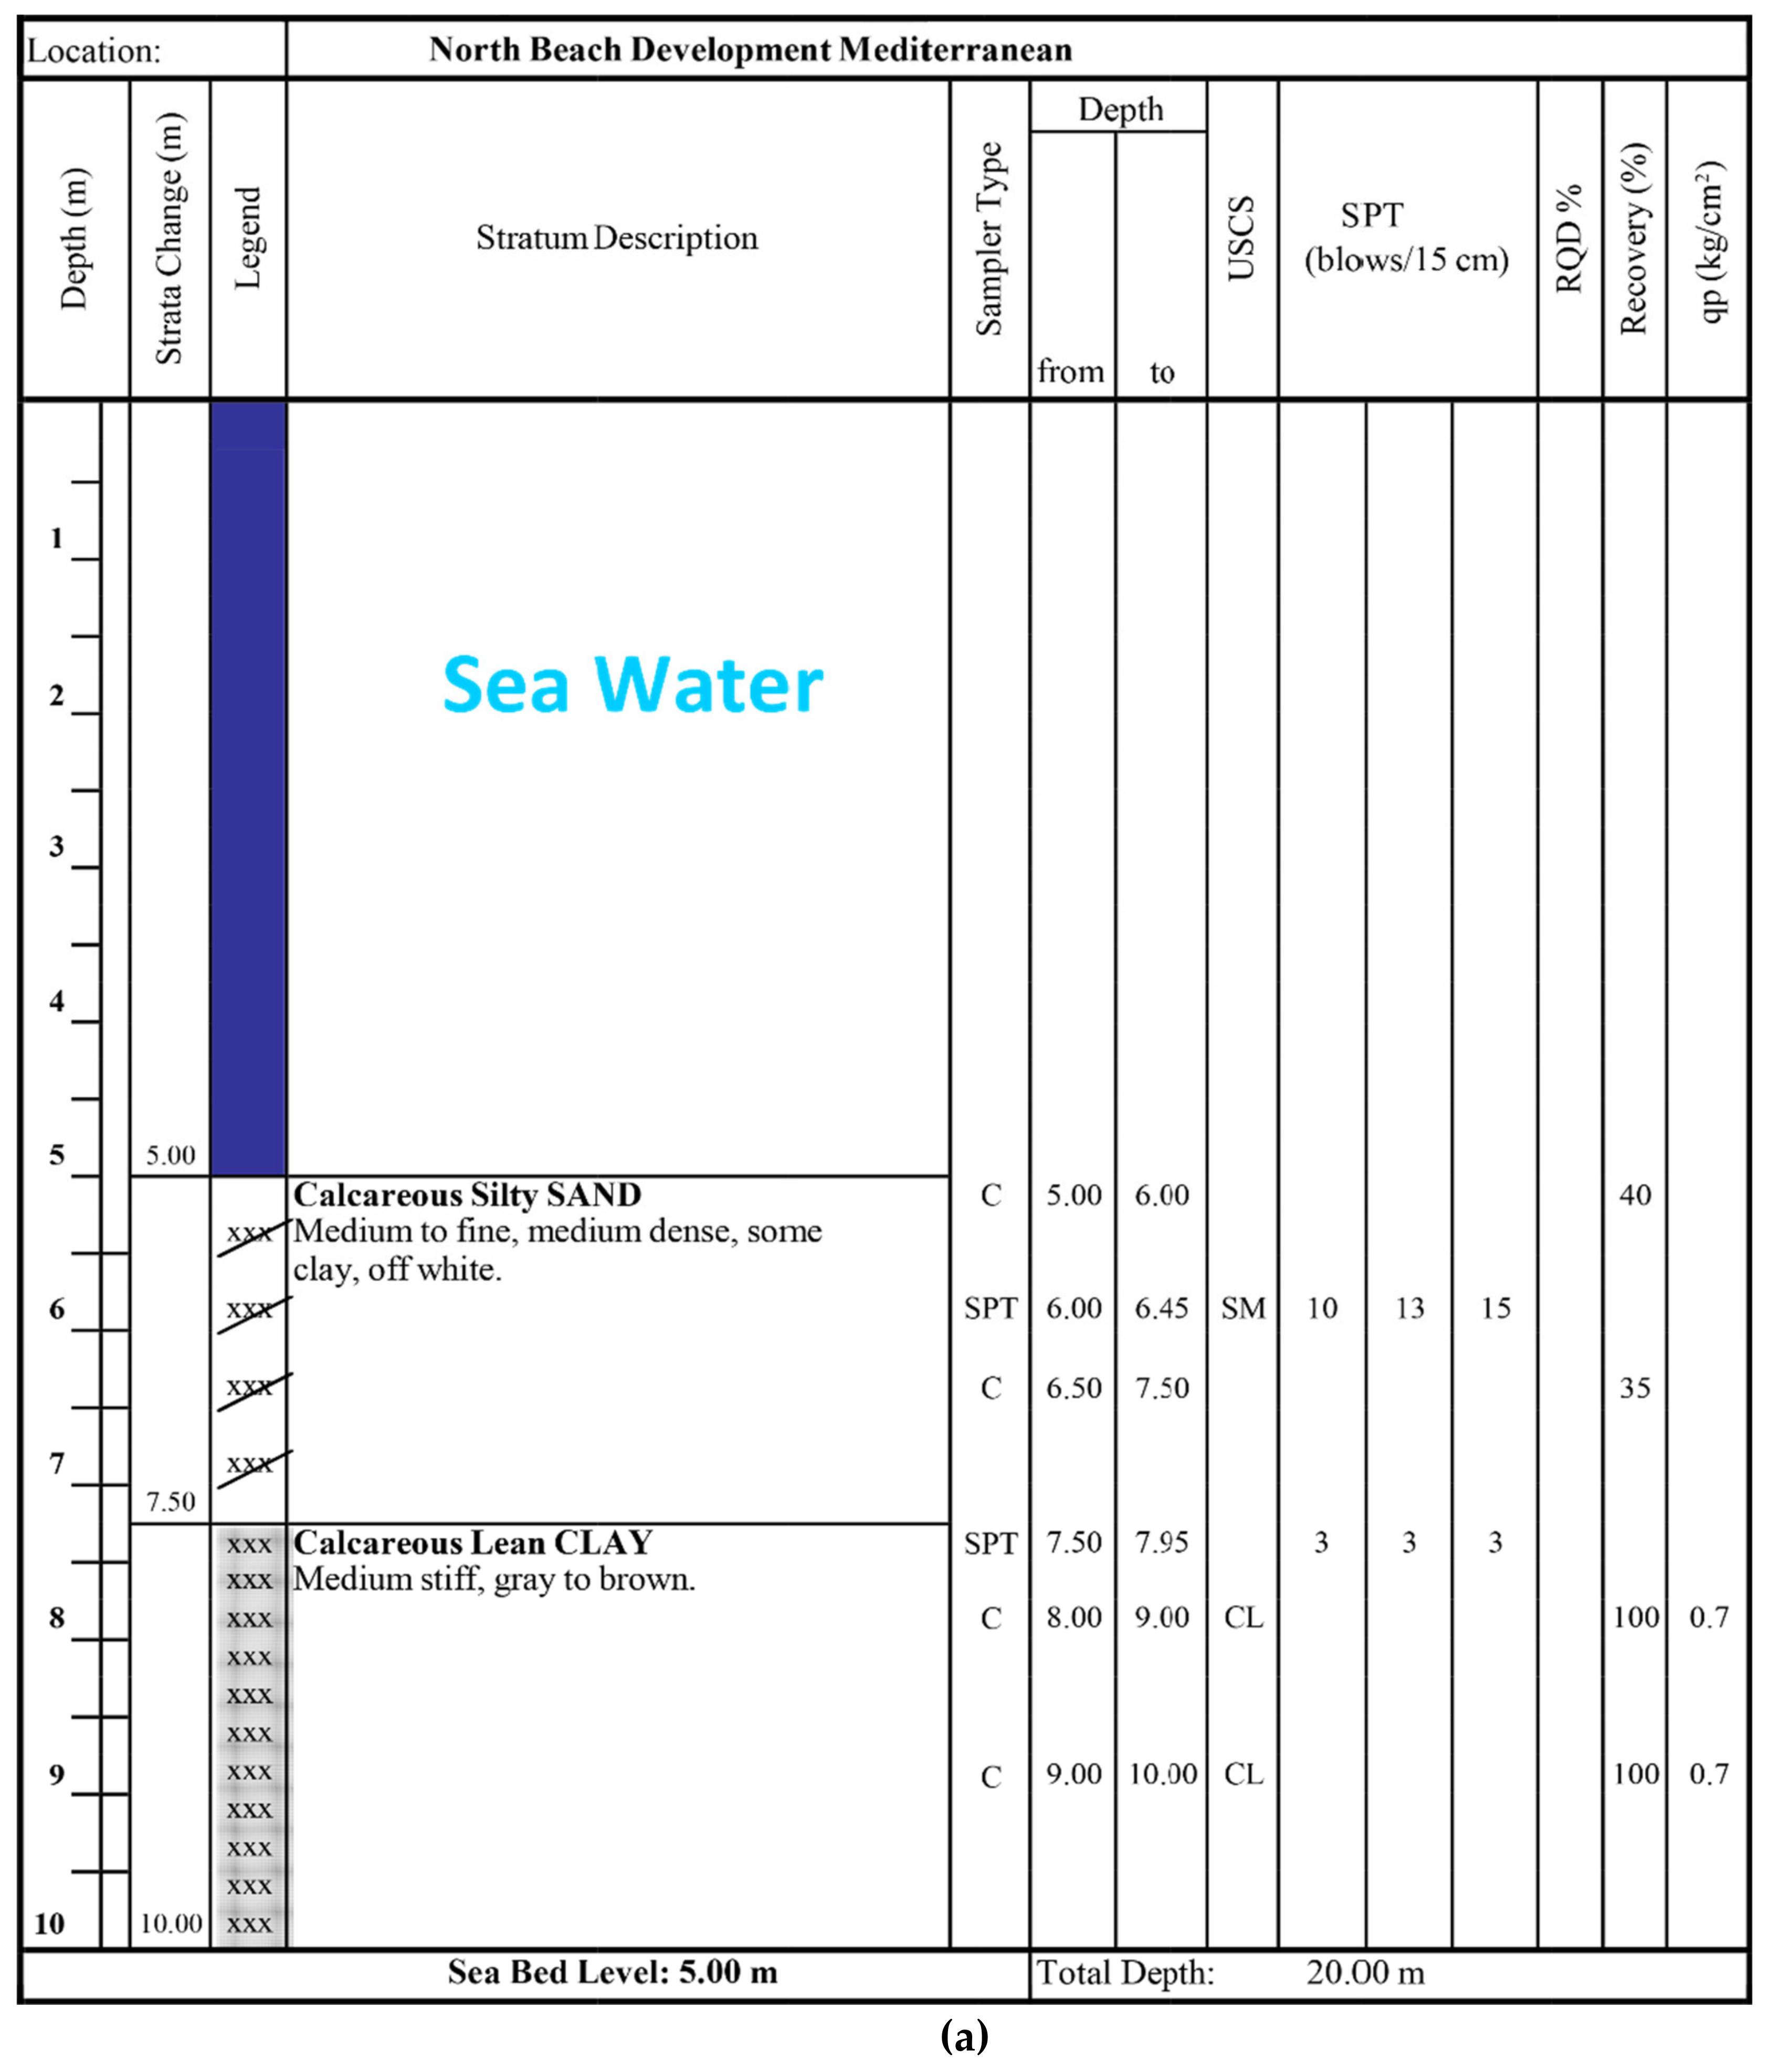
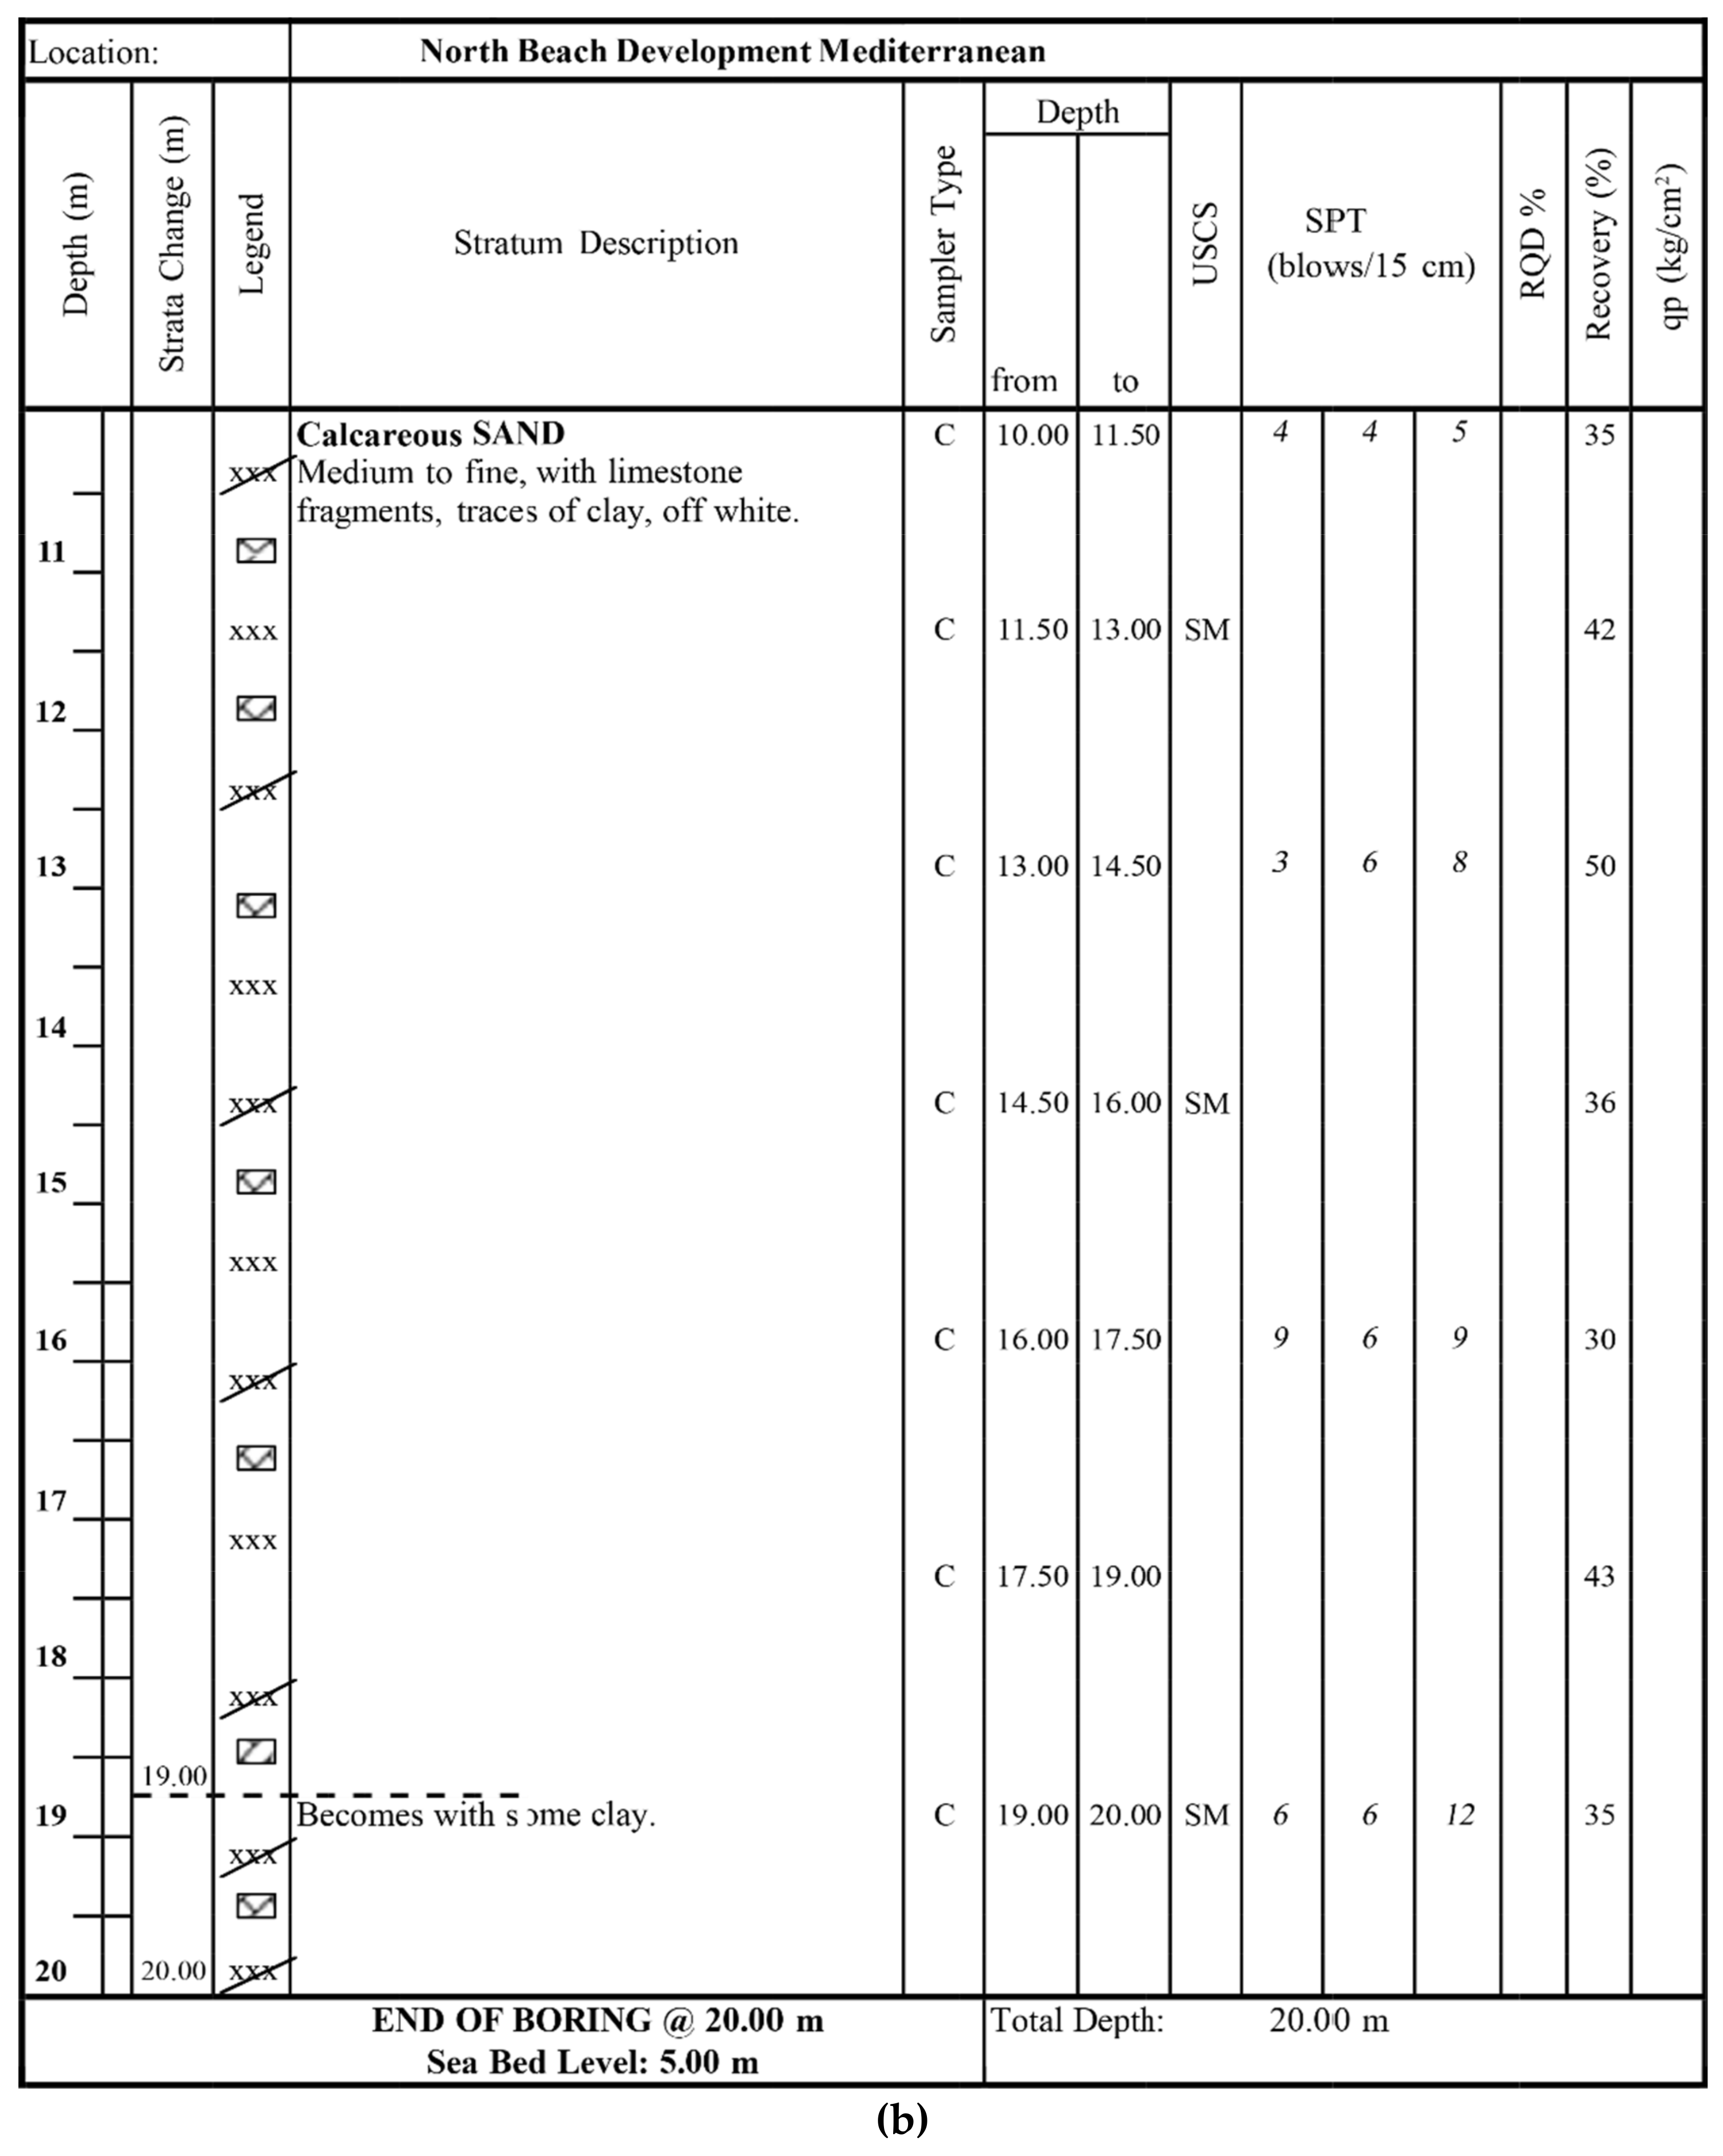
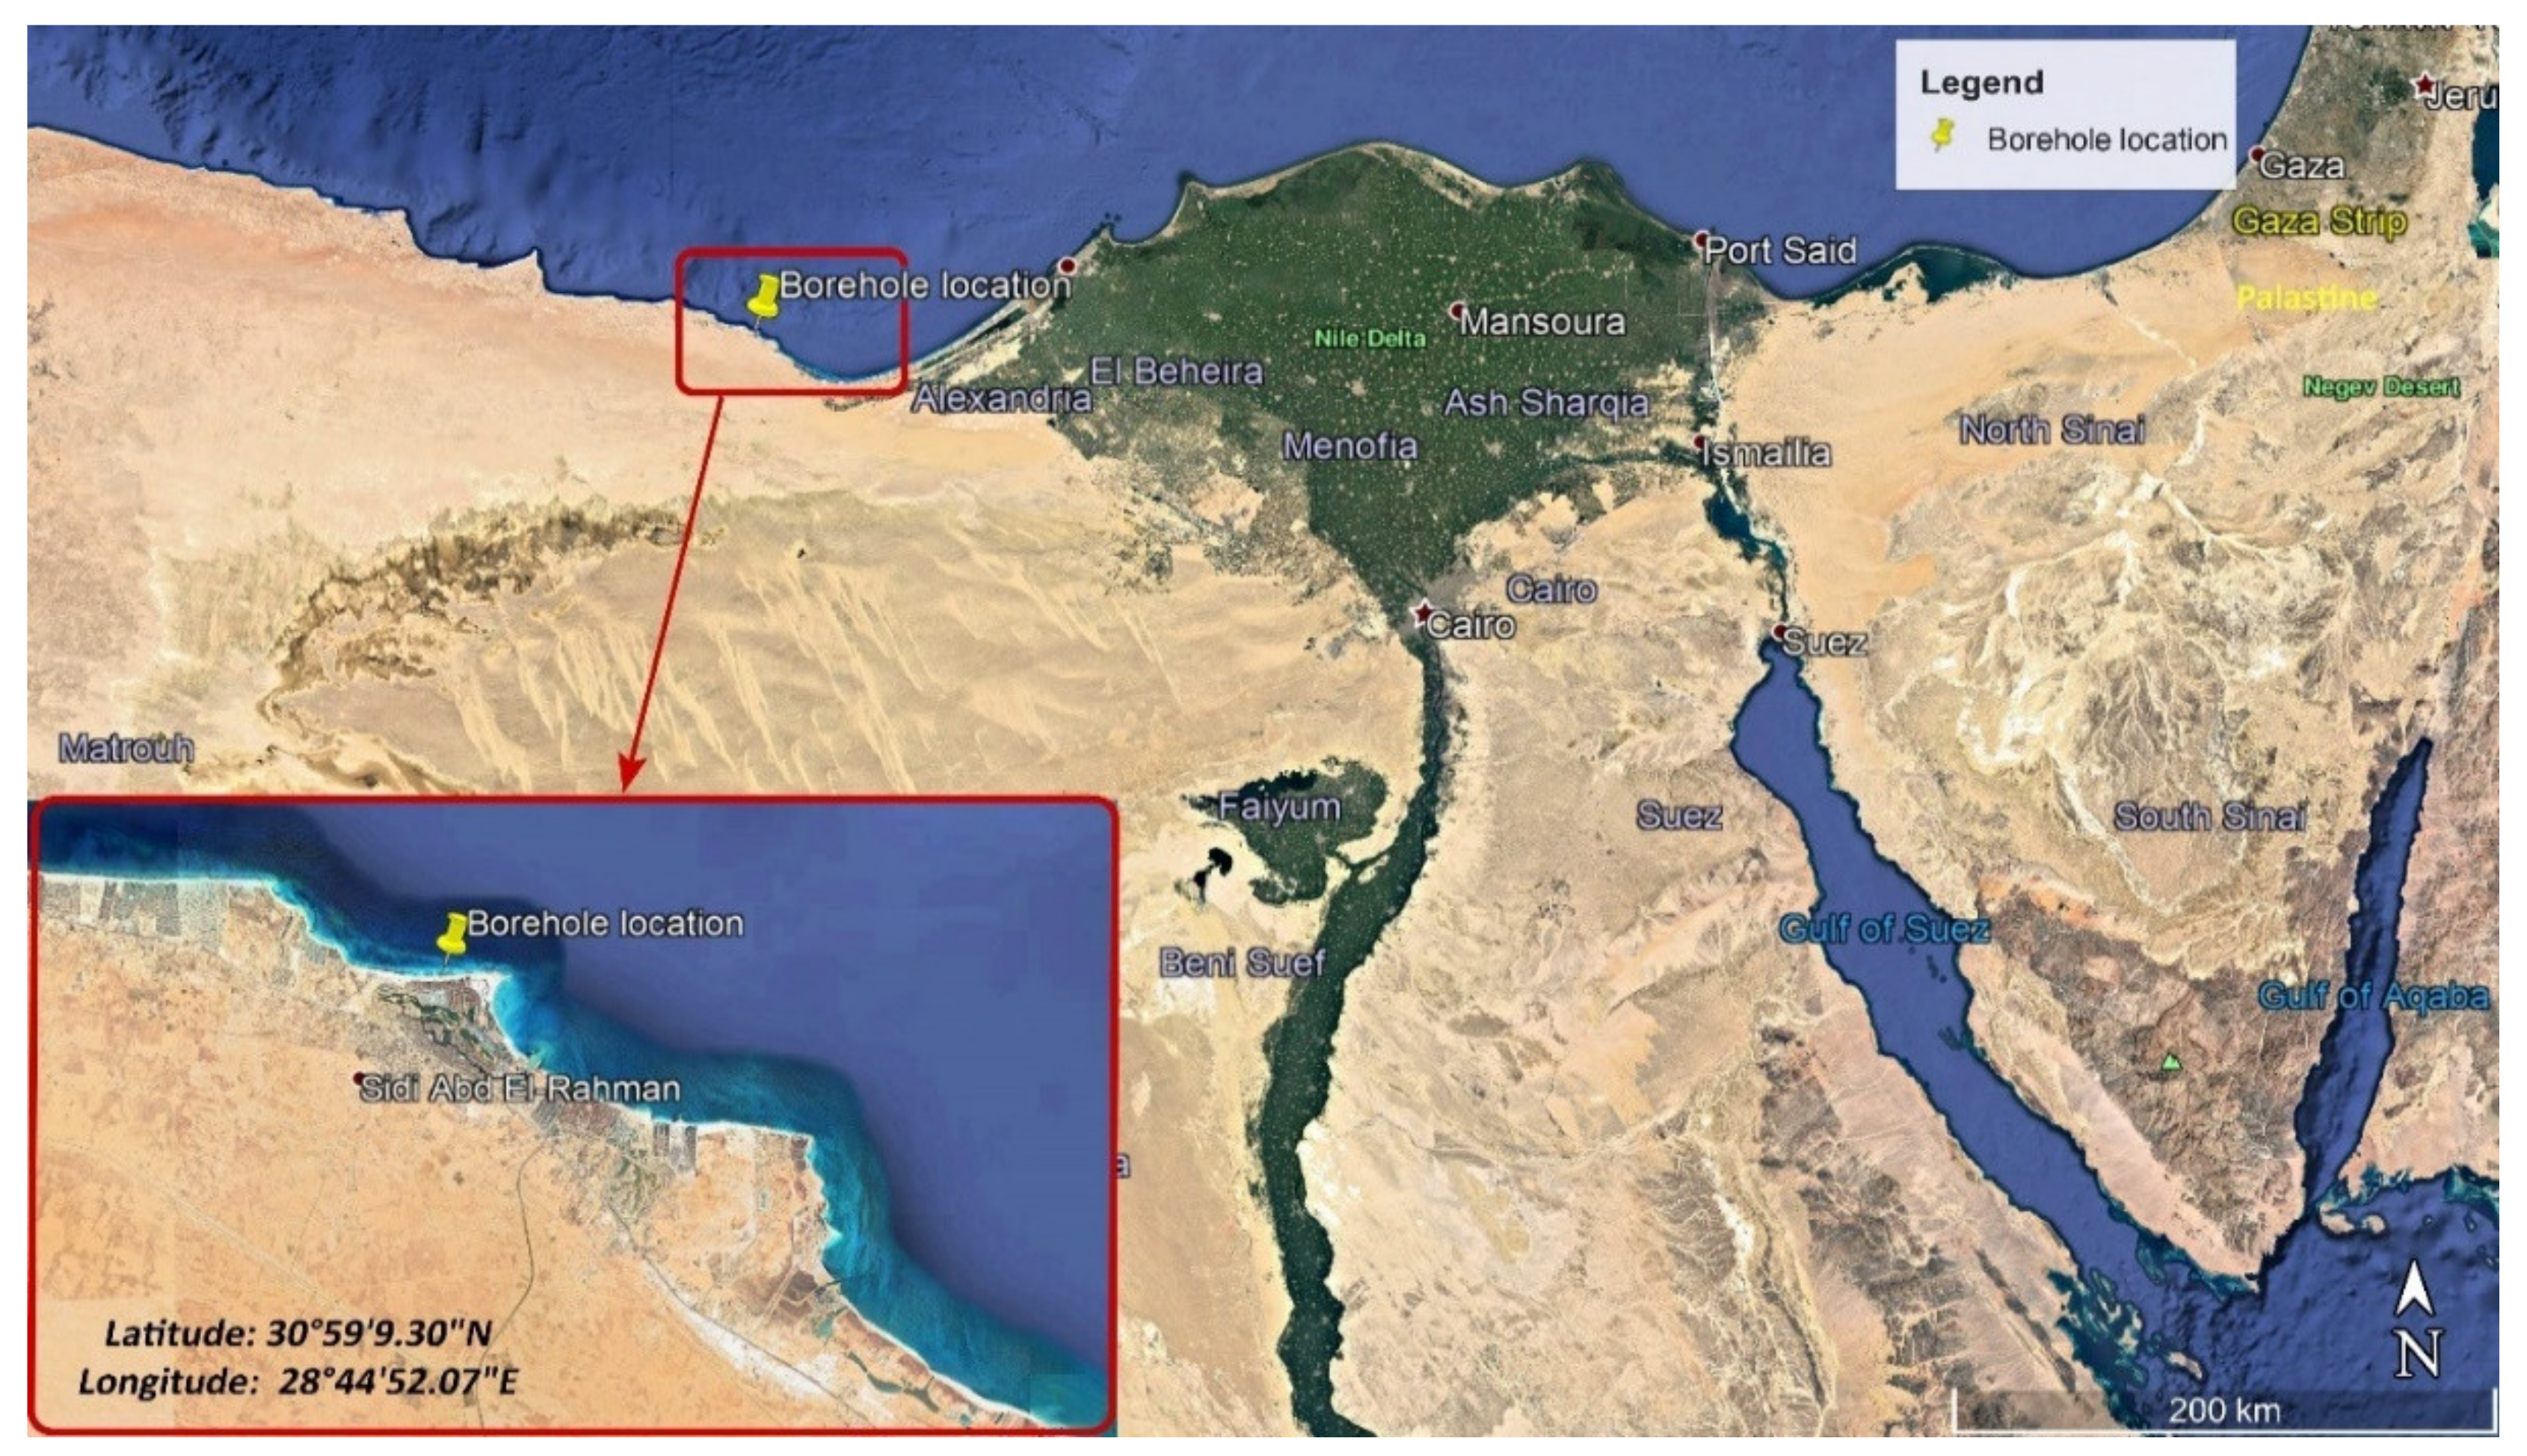
The borehole samples used herein are part of a geotechnical investigation at the North Beach Development project site on the northern coast, Egypt. In addition to the field investigation, laboratory tests are performed on representative soil samples to determine the soil characteristics, as represented in Figure 1. The borehole is executed using a mechanical wet rotary drilling rig (ACE). All soil samples recovered from the boreholes are visually examined and classified before being transported to the geotechnical laboratory for further classification and testing. Representative cohesionless samples are collected using a cored sampler and standard penetration test (SPT) sampler following standard procedures of ASTM D1586. A map of the investigated area and the boring location are shown in Figure 2. The soil stratigraphy, starting from the sea-bed level, consisted of three layers. The first layer is composed of calcareous silty sand. The layer starts from the sea bed level and extends to a depth of 2.5 m. The second layer consisted of calcareous lean clay with a thickness of 2.5 m as well. The third layer is an extended layer of calcareous loose to medium dense CS, which extended down to a depth of 20 m. Figure 1 illustrates the SPT results and the soil stiffness parameters, and as presented, the seawater level is 5.0 m above the mud-line.
3. Laboratory Testing Program
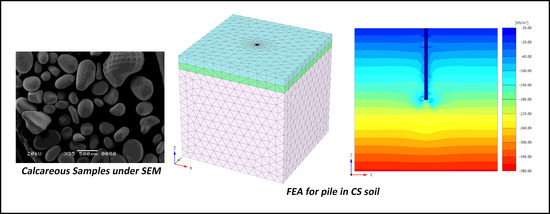
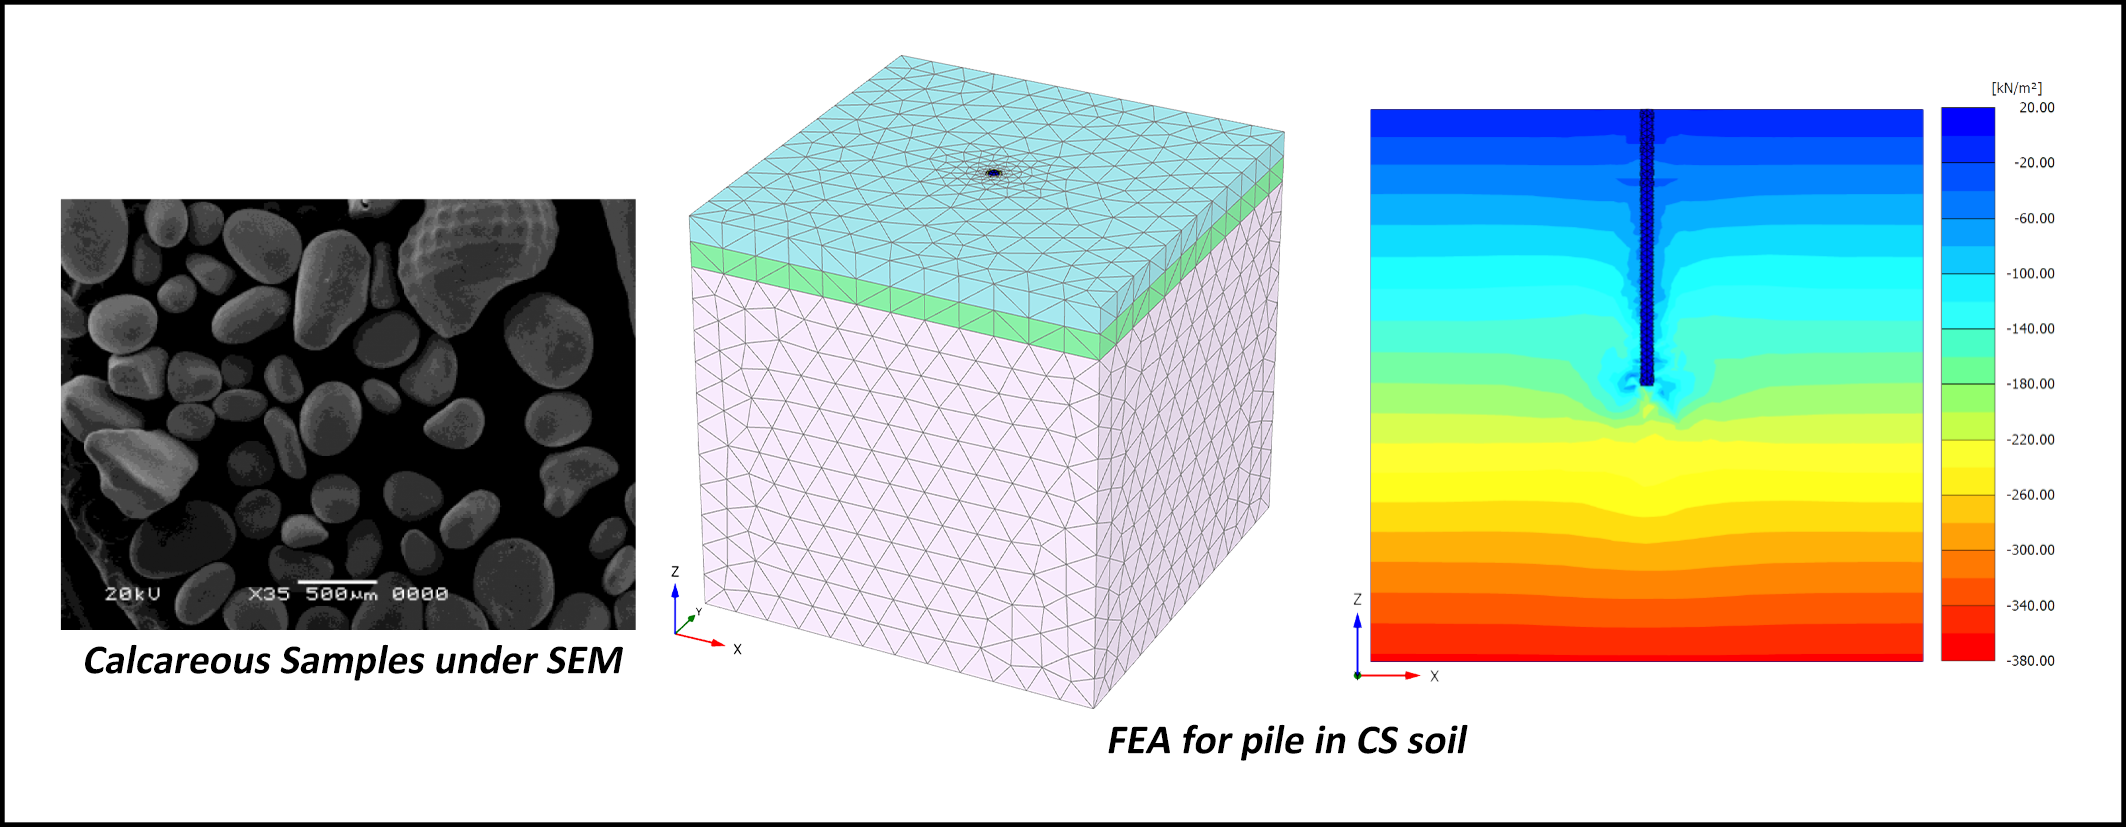
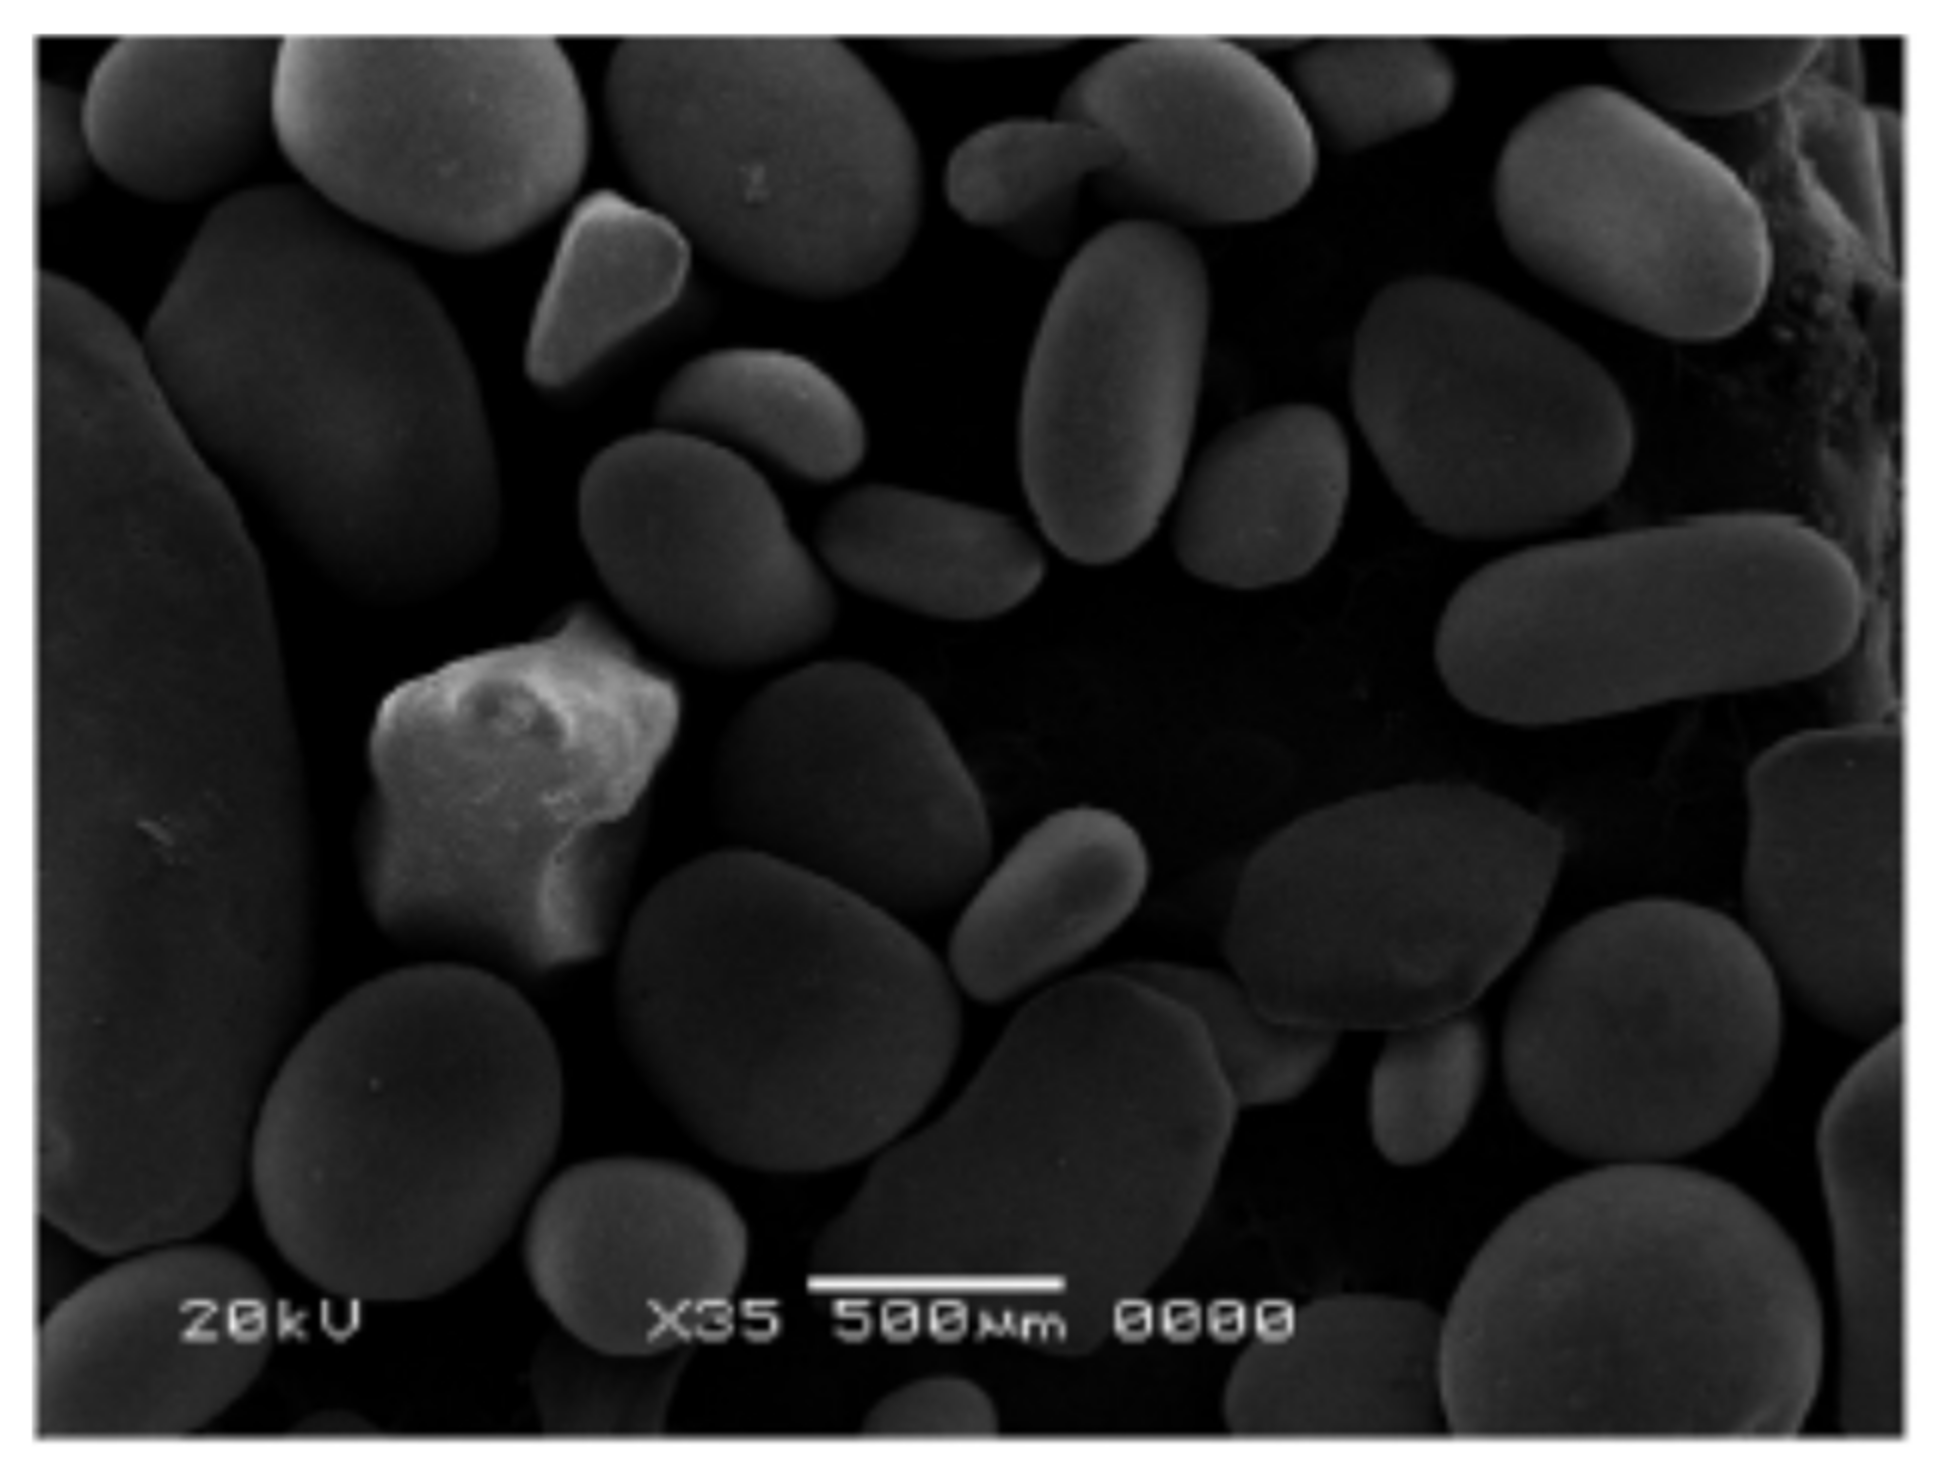
The average values of carbonate contents for these sands, as determined by tests performed according to [32], range between 97% and 99%. Figure 3 shows scanning electron microscope (SEM) results for the tested CS sample. The sand particles are classified as rounded to subrounded, confirming the nature of the weather conditions that led to the formation of this sand. The roundness of the particles is mainly caused by the repetitive sea wave movements that erode the limestone rock pieces along the beach.
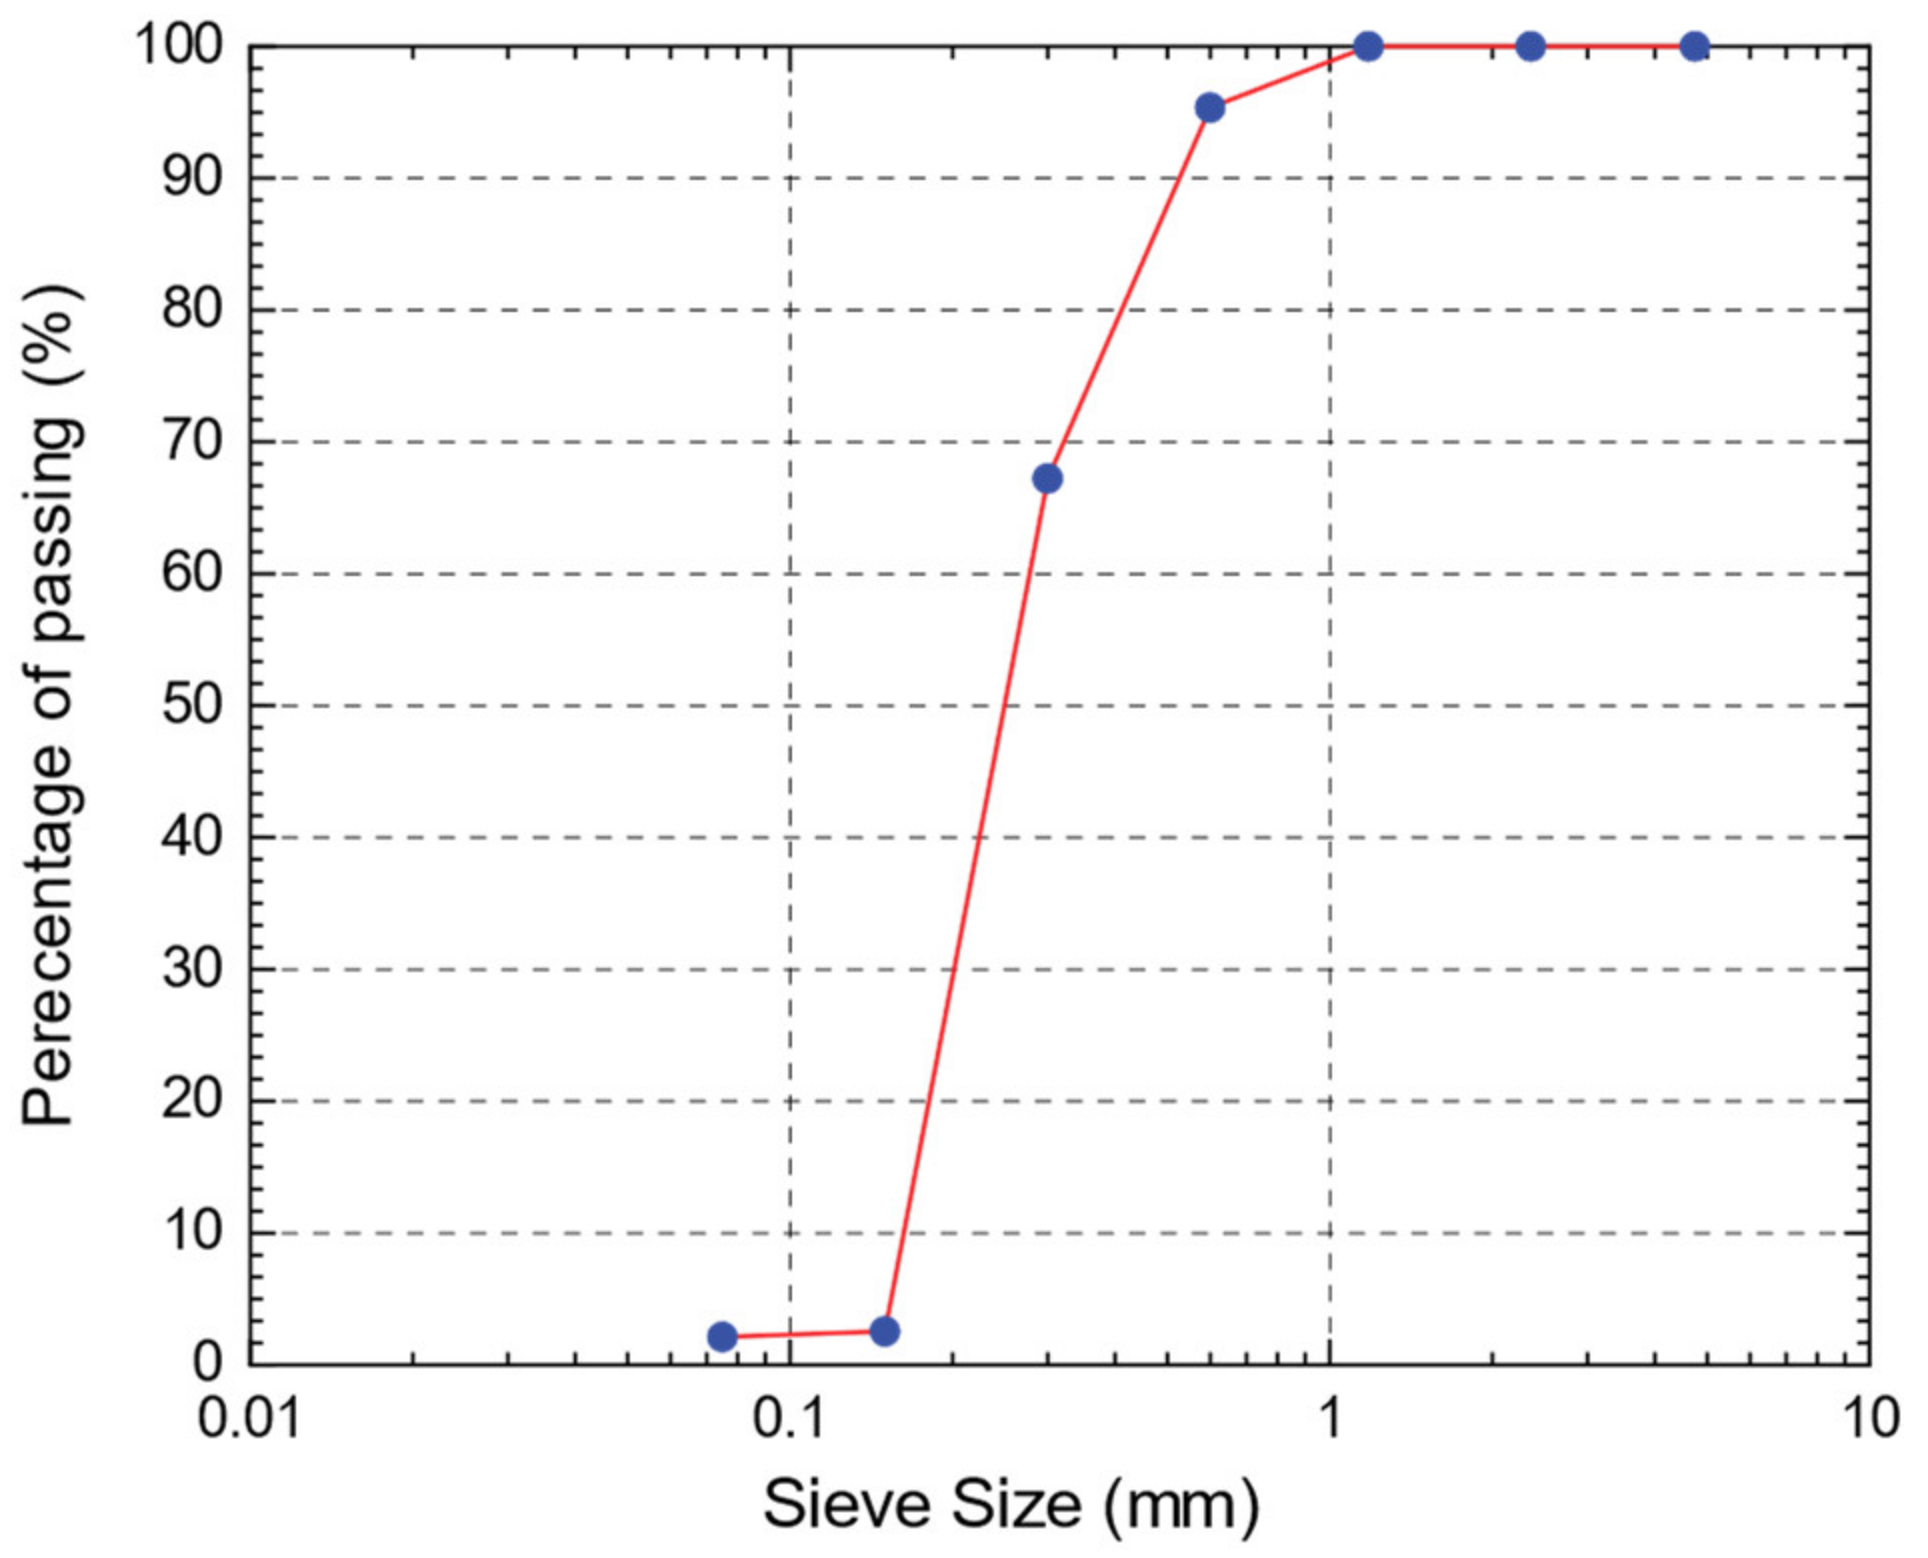
As shown in Figure 4, the CS particles are classified as medium to fine with a uniform grading, and according to the Unified Soil Classification System [33], the samples are categorized as poorly graded sand (SP). Grading coefficients are summarized in Table 1. According to the American Standards of Testing Materials [34], minimum and maximum index density, , have been determined.
3.1. Direct Shear Test
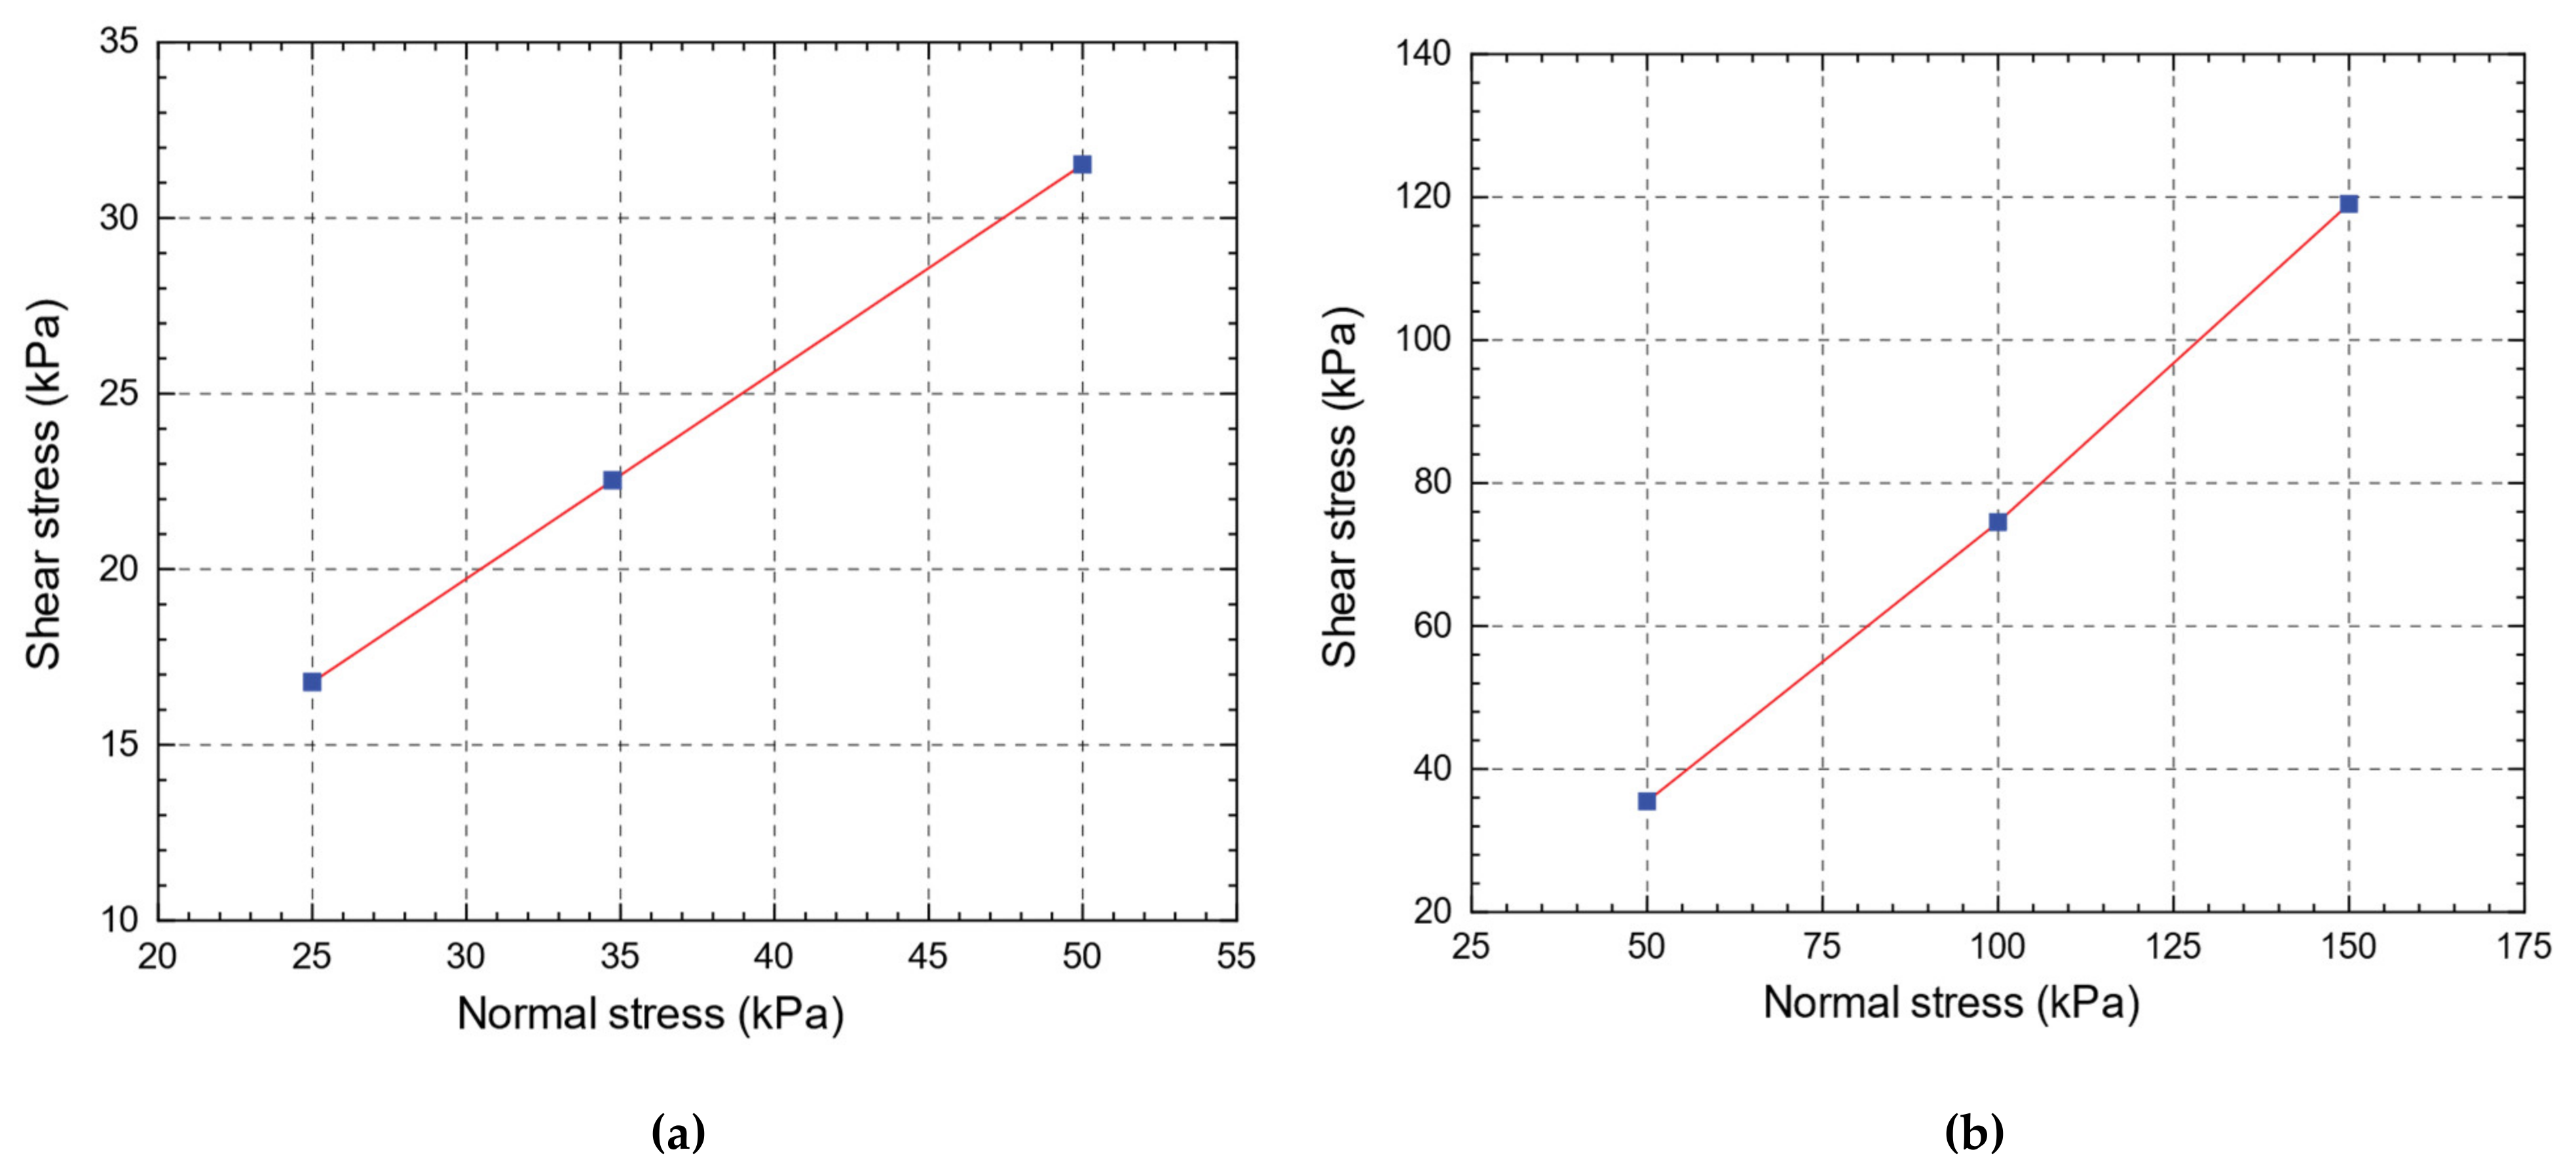
The engineering properties of soil that are significant to a geotechnical engineer are shear strength and compressibility characteristics [19,25]. A series of direct shear tests were performed on the original CS samples and other samples mixed with varying ratios of BS (10%, 30%, and 50%) by weight collected from the same site to determine the shear strength parameters, and . Before mixing with the dry CS, the broken shells are ground and sieved using sieve No. 50 and No. 150 with an opening of 0.30 and 0.15 mm, respectively, and the retained particles on sieve 150 are used. The normal and the corresponding shear stress relationship for the soil in the case of loose and dense states are illustrated in Figure 5. The loose state was achieved by putting the sample in the test container without compaction, while the dense state was conducted by placing the sample in the container on three layers and applying 25 uniformly distributed strokes over the cross-section of each layer surface. The mixing ratios were chosen to satisfy the different amounts of broken shells and marine compositions in the offshore calcareous deposits. The angles of internal friction, void ratios, and unit weight densities were determined in the loose and dense states for all samples in the dry case, as presented in Table 2.
In the case of original CS samples, the friction angle is 30.5° and 39.9° in the loose and dense states, respectively. Test results also showed that increasing the BS ratio increases the friction angle simply because of the slight increase in the angular shape of the shell particles.
Figure 6 describes the relationship between the shear strength and the horizontal movement for the CS + 30% BS samples in the dense state at different normal stresses showing the peak shear strength and the residual shear stress for each case. The peak shear strength is used to determine the peak friction angles, while the residual shear strength is used in determining the residual friction angles. The residual angles of internal friction are determined for all samples in the dry case, as presented in Table 2.
3.2. Oedometer Test
Oedometer tests are conducted for samples of CS and CS mixed with different BS ratios of 10%, 30%, and 50%, respectively. The BS is ground and sieved using sieves No. 50 and No. 150 before being mixed with the dry CS, and the retained particles on sieve No. 150 are used. The recovery ratios of soil samples in the CS layer were low, and the samples were disturbed; therefore, the in situ soil density was not determined. On the other hand, soil density is one of the primary inputs in the numerical analysis; thus, the density was determined based on the SPT number, and its value was 17 kPa, which is associated with relative density, . Although the in situ sample conditions dramatically affect the laboratory results, this study aims to compare the mechanical properties of CS samples with different ratios of BS under standardized test conditions for all samples. The samples are placed in a steel cylinder chamber of 50 mm internal diameter and compressed to reach relative compaction of 60%. The samples are incrementally loaded with initial vertical stress of 25 kPa, and then the load is doubled when the deformation stopped until reaching the final stress of 3.2 MPa. Eight sequential loading steps are applied 0, 25, 50, 100, 200, 400, 800, 1600, and 3200 kPa. The maximum vertical stress that can be used safely in this test is not more than 3200 kPa due to the limited capacity of the loading arm.
Figure 7 shows the relationship between stress and changes in the void ratio for several samples on a semi-loop scale. The effect of BS ratio has a minor impact on the change of void ratio under small stress values. With the increase of the normal stress, the particles compressed, and the voids between them decrease. The decrease rate of the void ratio increases with the rise of normal stress. Adding 10% of the BS has a significant effect on the void ratio compared with the original CS. The CS with 30% and 50% almost has the same effect on the void ratio. Hence, it can be concluded that the impact of increasing the BS ratio by more than 30%, does not significantly affect the void ratio in the sample when subjected to relatively high compressive stress. The usual compression line has not yet been reached since the maximum stress is insufficient to commence crushing and yielding of the particles; the amount passing from sieve 150 was negligible, which means that approximately no crushing occurred to the CS or BS particles.
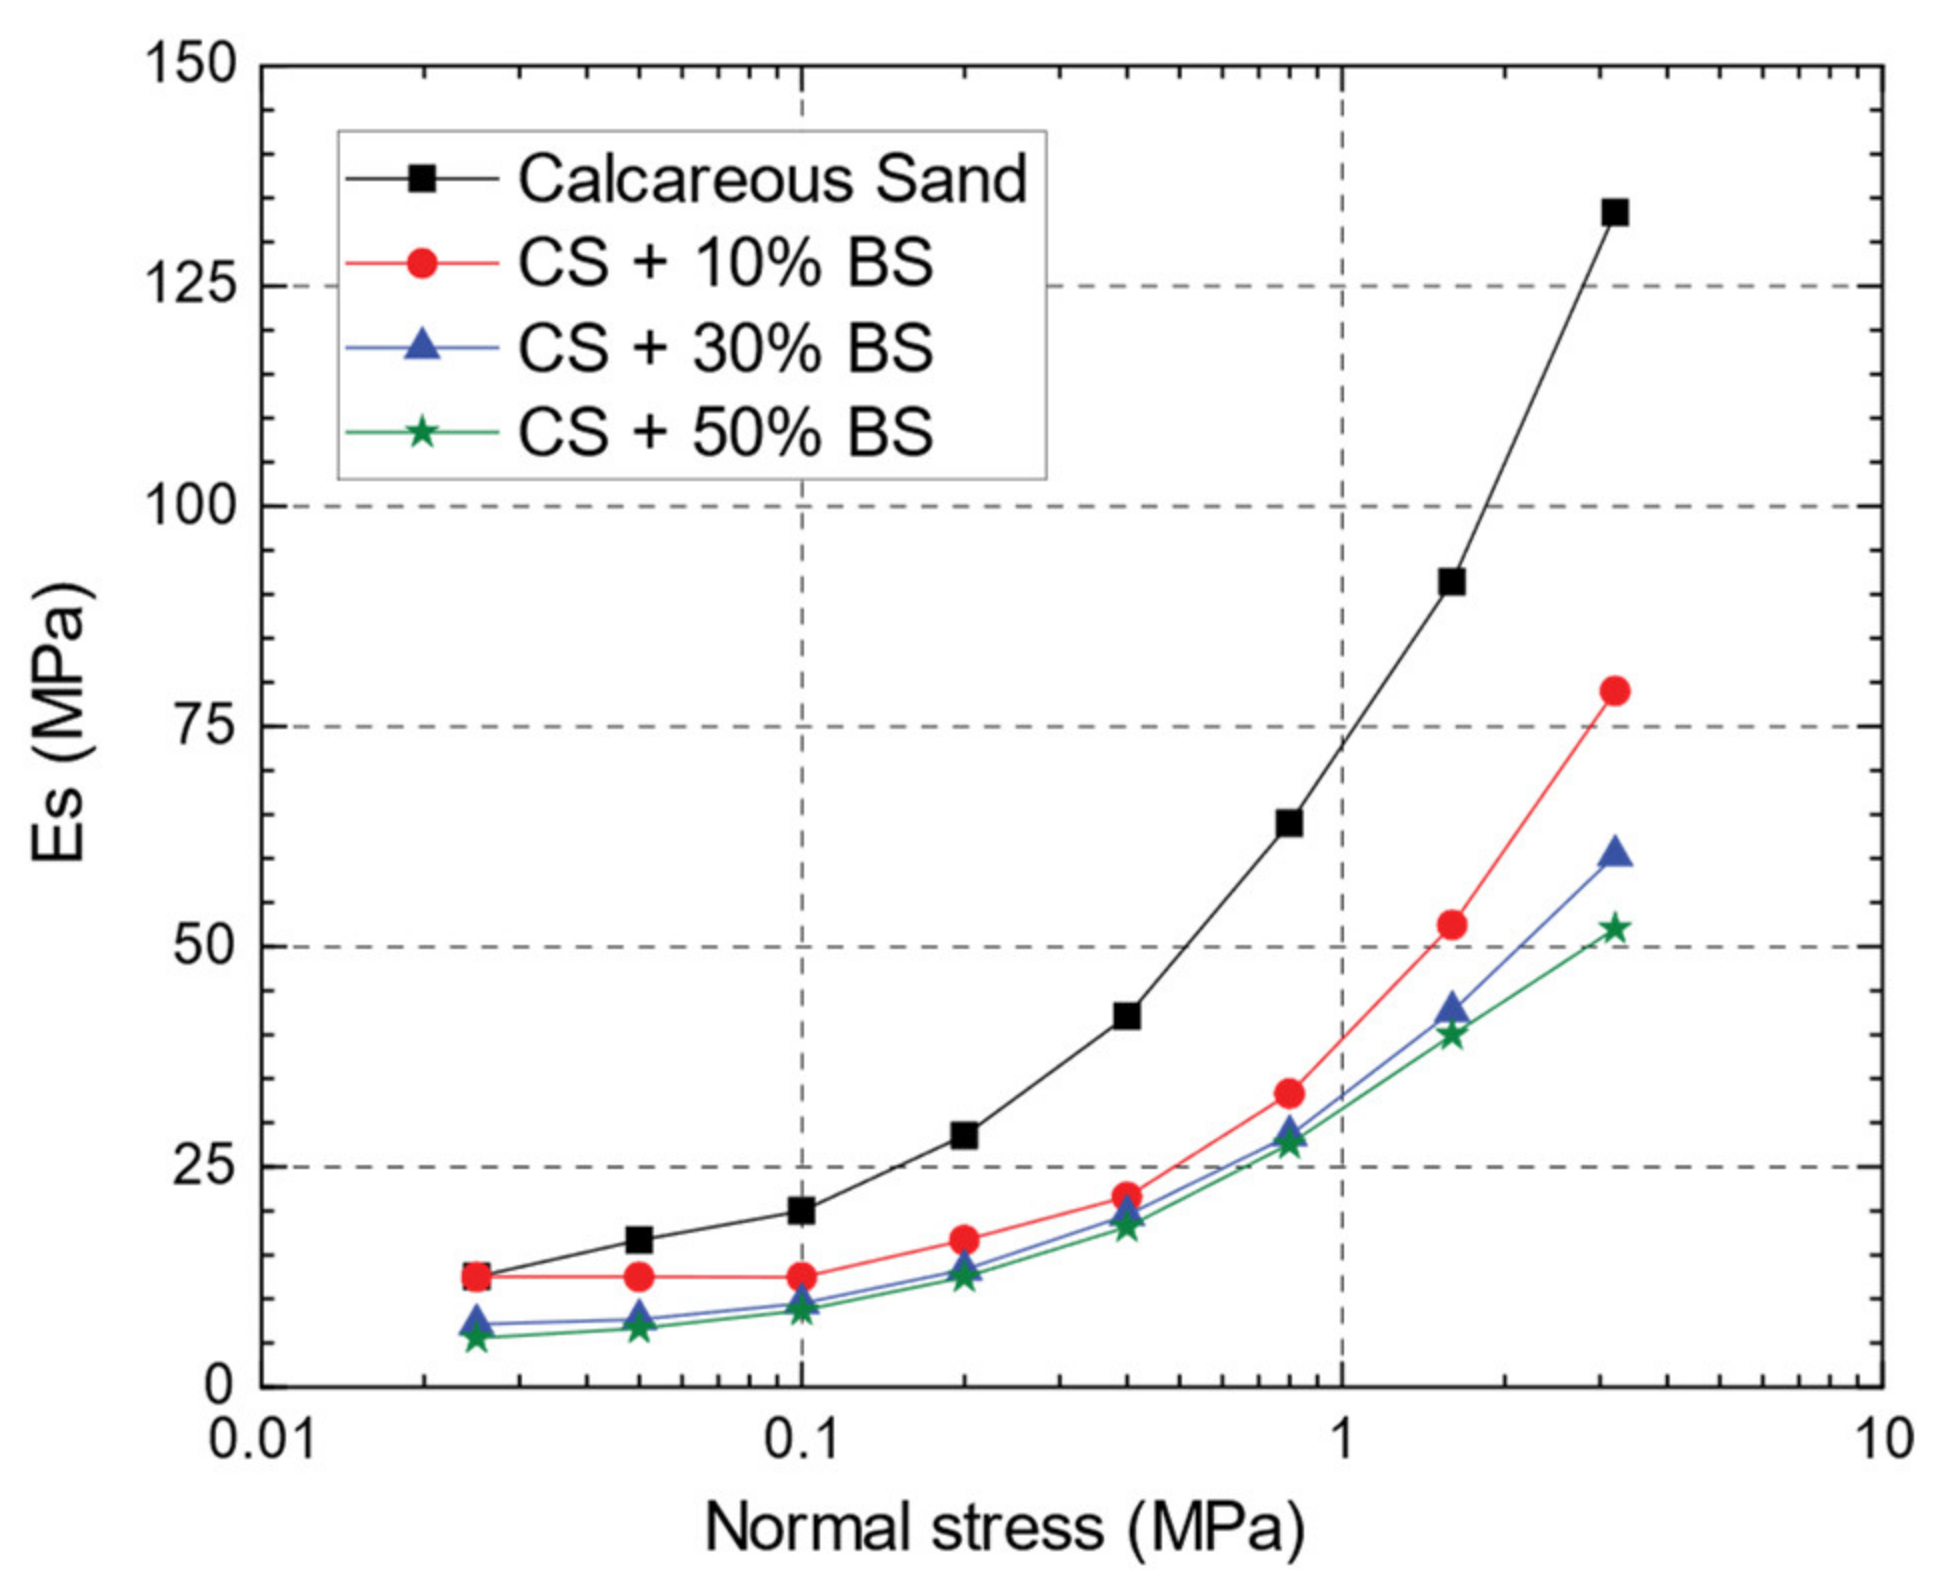
Young’s modulus, , is a parameter commonly introduced as the deformability parameter related to the linear elastic behavior of soil. On the other hand, the soil is not an ideal linear elastic material which means, the soil modulus is stress-dependent. The is calculated from the oedometer test results according to [35] as follows.
where, is the sample dry mass; is the specific gravity; is the water unit weight; is the surface loaded area; is the sample height after each loading; is the equivalent height of the solid sample; is the initial void ratio; are the settlement, change in void ratio, and normal stress per load step, respectively; and is the coefficient of compressibility.
From Equations (3) and (4), is directly proportional to and inversely proportional to . Figure 8 shows the increase of the constrained soil modulus associated with the rise of normal stresses for CS, CS + 10% BS, CS + 30% BS, and CS + 50% BS samples.
4. Verification Model
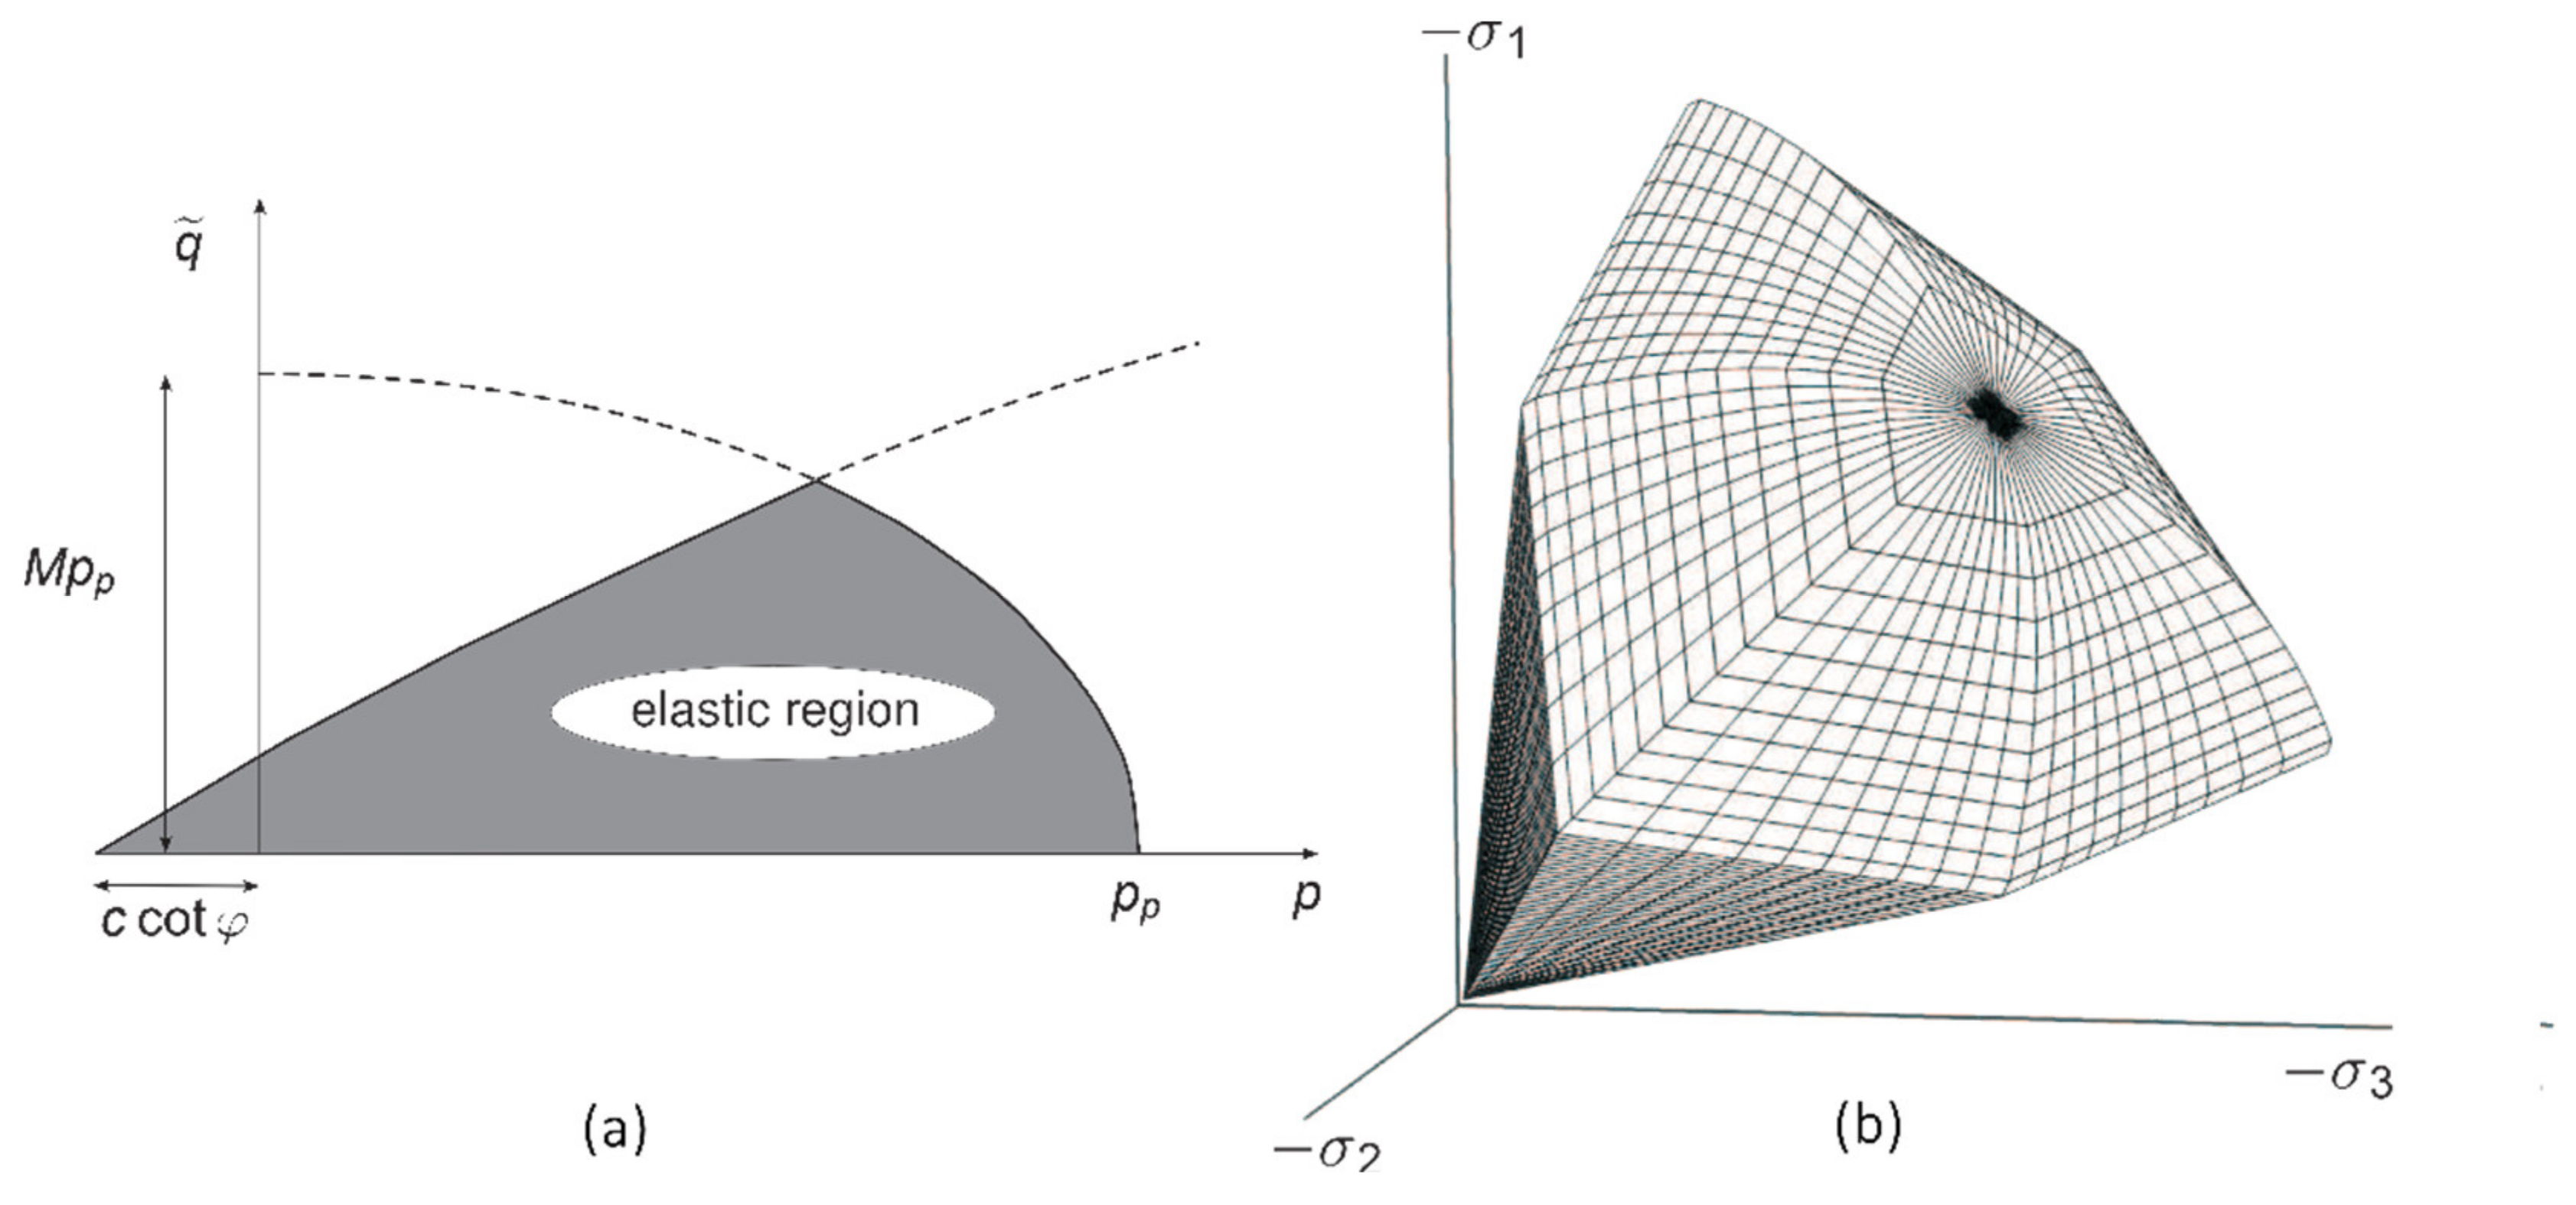
To guarantee reliable results, the FEA should be verified first with previous experimental work. A pile load test is adopted to verify the FEA using PLAXIS 3D software. PLAXIS uses different soil models to define the soil behavior, such as Mohr–Coulomb model, hardening soil (HS) model, soft soil model, etc. In this study, the HS model is used to model the nonlinear soil behavior. HS model is an advanced nonlinear constitutive law for the simulation of soil behavior. Unlike an elastic perfectly-plastic model, the yield surface of a hardening plasticity model is not fixed in principal stress space. Therefore, it can expand due to plastic straining, as shown in Figure 9 [36].
The soil characteristic parameters such as the friction angle (, cohesion (c), and the dilatancy angle () are used to describe the limiting state of stress, the same as the original Mohr–Coulomb model. To define the soil stiffness behavior, other parameters have been used—the triaxial loading stiffness, , the triaxial unloading stiffness, , and the oedometer loading stiffness, , are used. These parameters are related to reference stress, which is usually taken as 100 kPa. The hardening soil (HS) model, as a constitutive law of the CS to simulate a piles raft foundation of a high-rise building in Kuwait City using PLAXIS 3D program, was utilized by [37]. Based on that, the soil in the current model is modeled using the HS model.
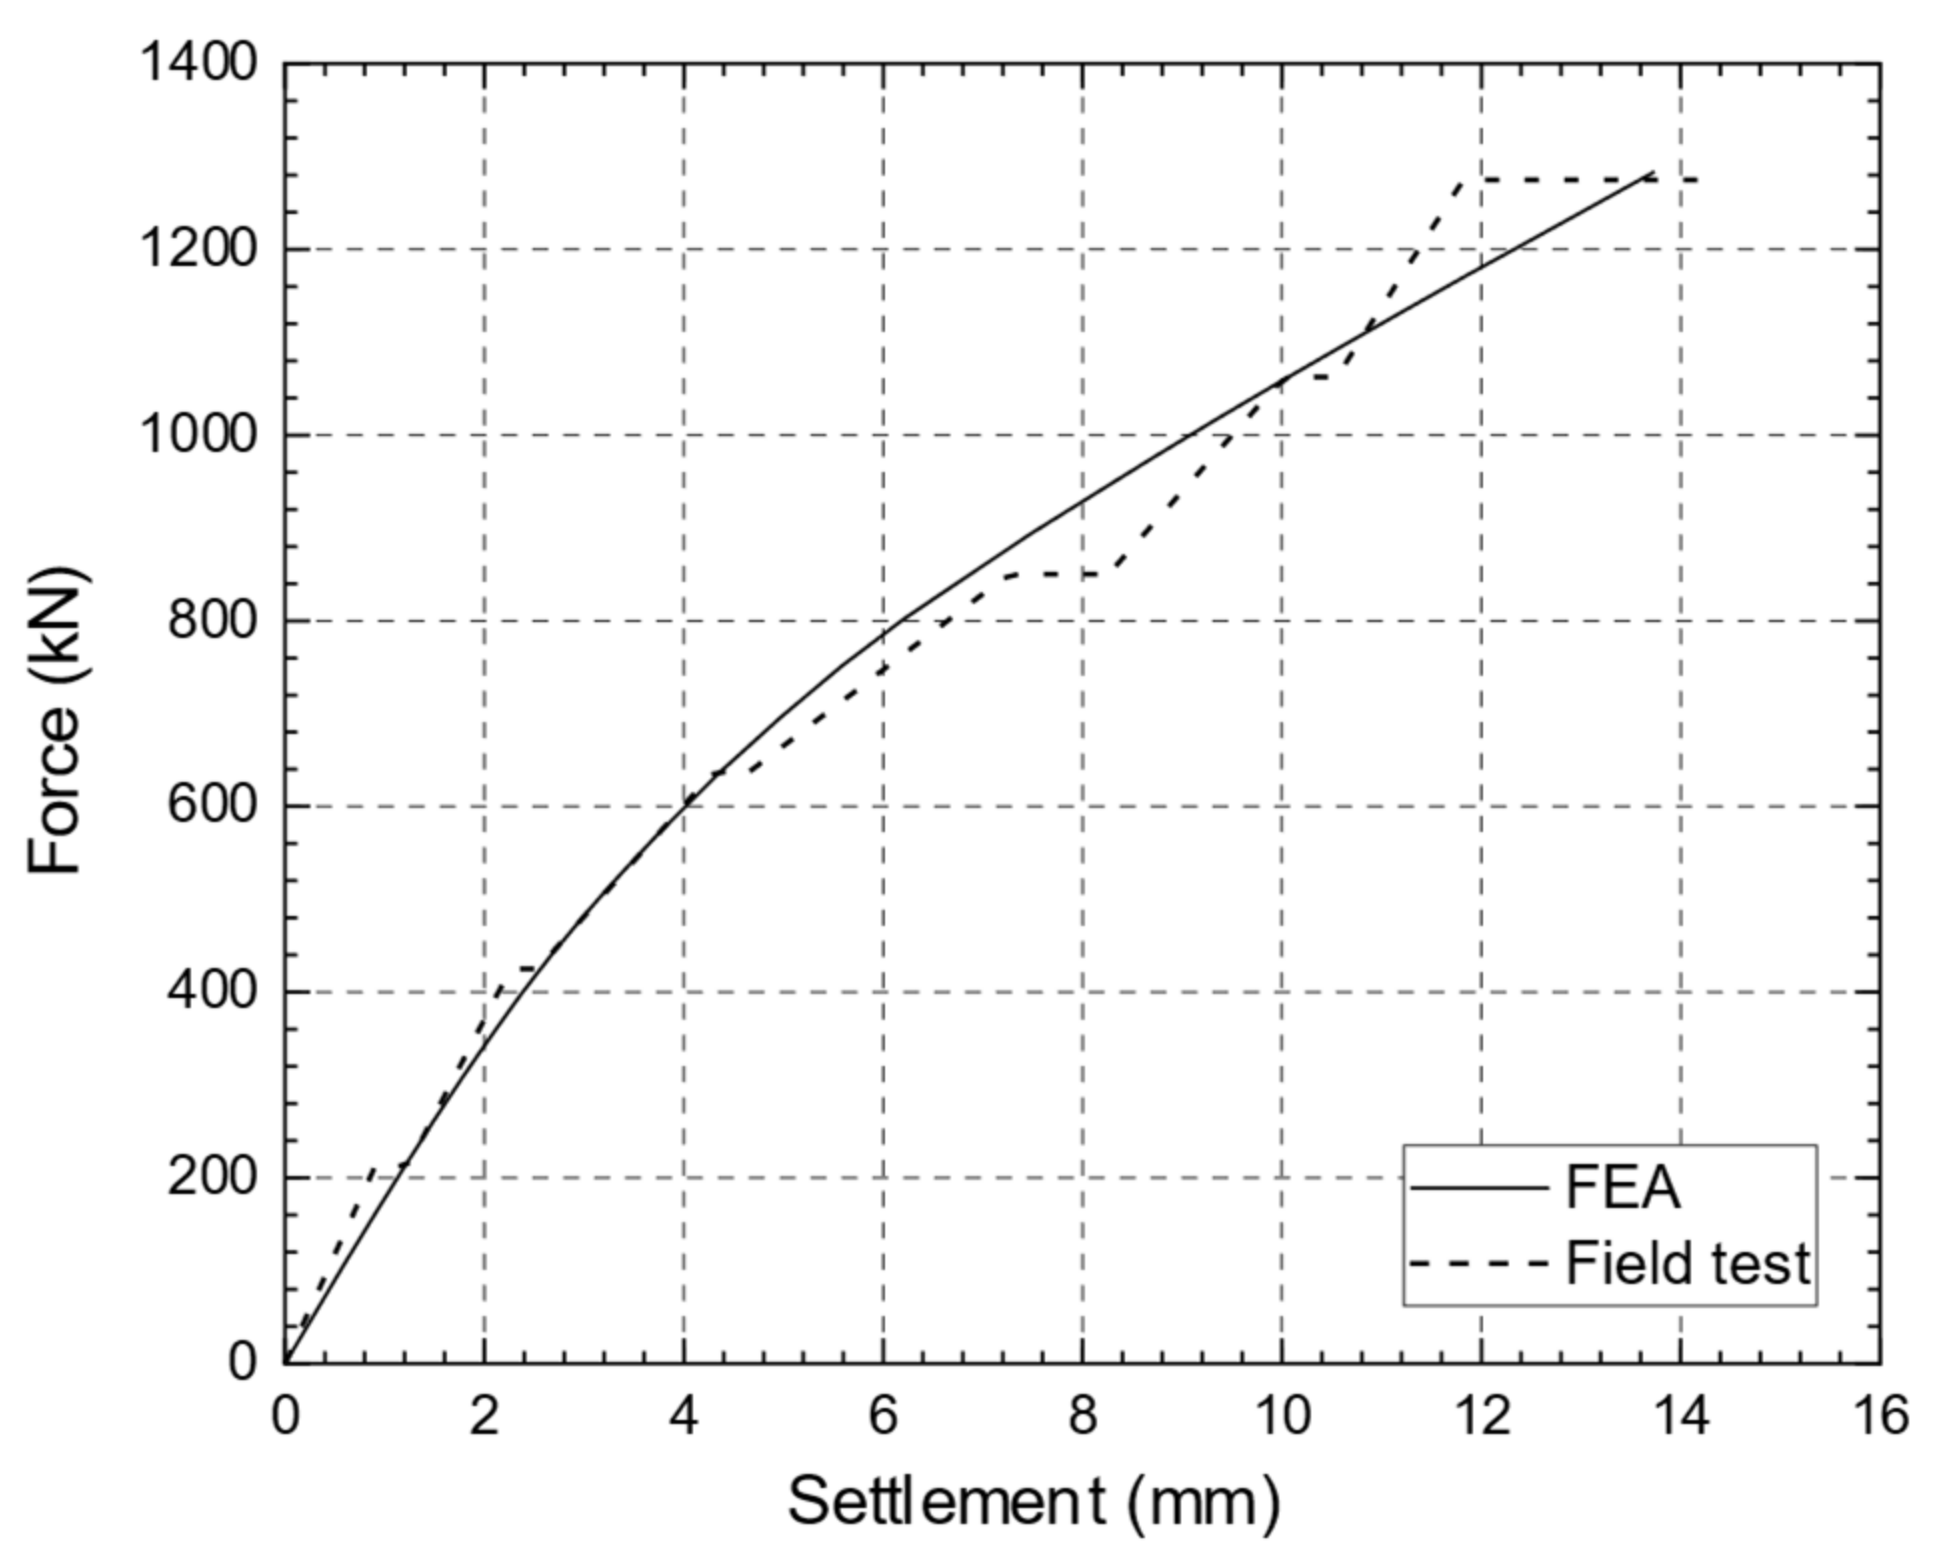
A pile load test performed in Alexandria in northern Egypt is used as a verification model, where CS exists extensively and naturally mixed with different percentages of BS. The tested driven concrete pile length is equal to 17.0 m with a diameter of 52 cm. The pile is defined as a linear elastic material with a Young’s modulus, , of , Poisson’s ratio, , and a unit weight, , of . Interface elements are used at the pile-soil contact interface. A strength reduction factor, , is taken equal to 1, which gave the best result. The pile was loaded until reaching 1275 kN, which corresponds with 150% of its working load. The pile tip ends in calcareous sand-shell mixture. Table 3 describes the soil physical properties determined according to [38] depending on the values of the SPT numbers and the layer description according to a borehole conducted in the pile load test location.
Groundwater table exists at 2.5 m below ground surface. The field pile load test was terminated when a sudden settlement of about 2.5 mm occurred under the applied load. Figure 10 illustrates close agreement between the results of the field test with numerical analysis. The FEA shows a net settlement of 13.5 mm under the same test load.
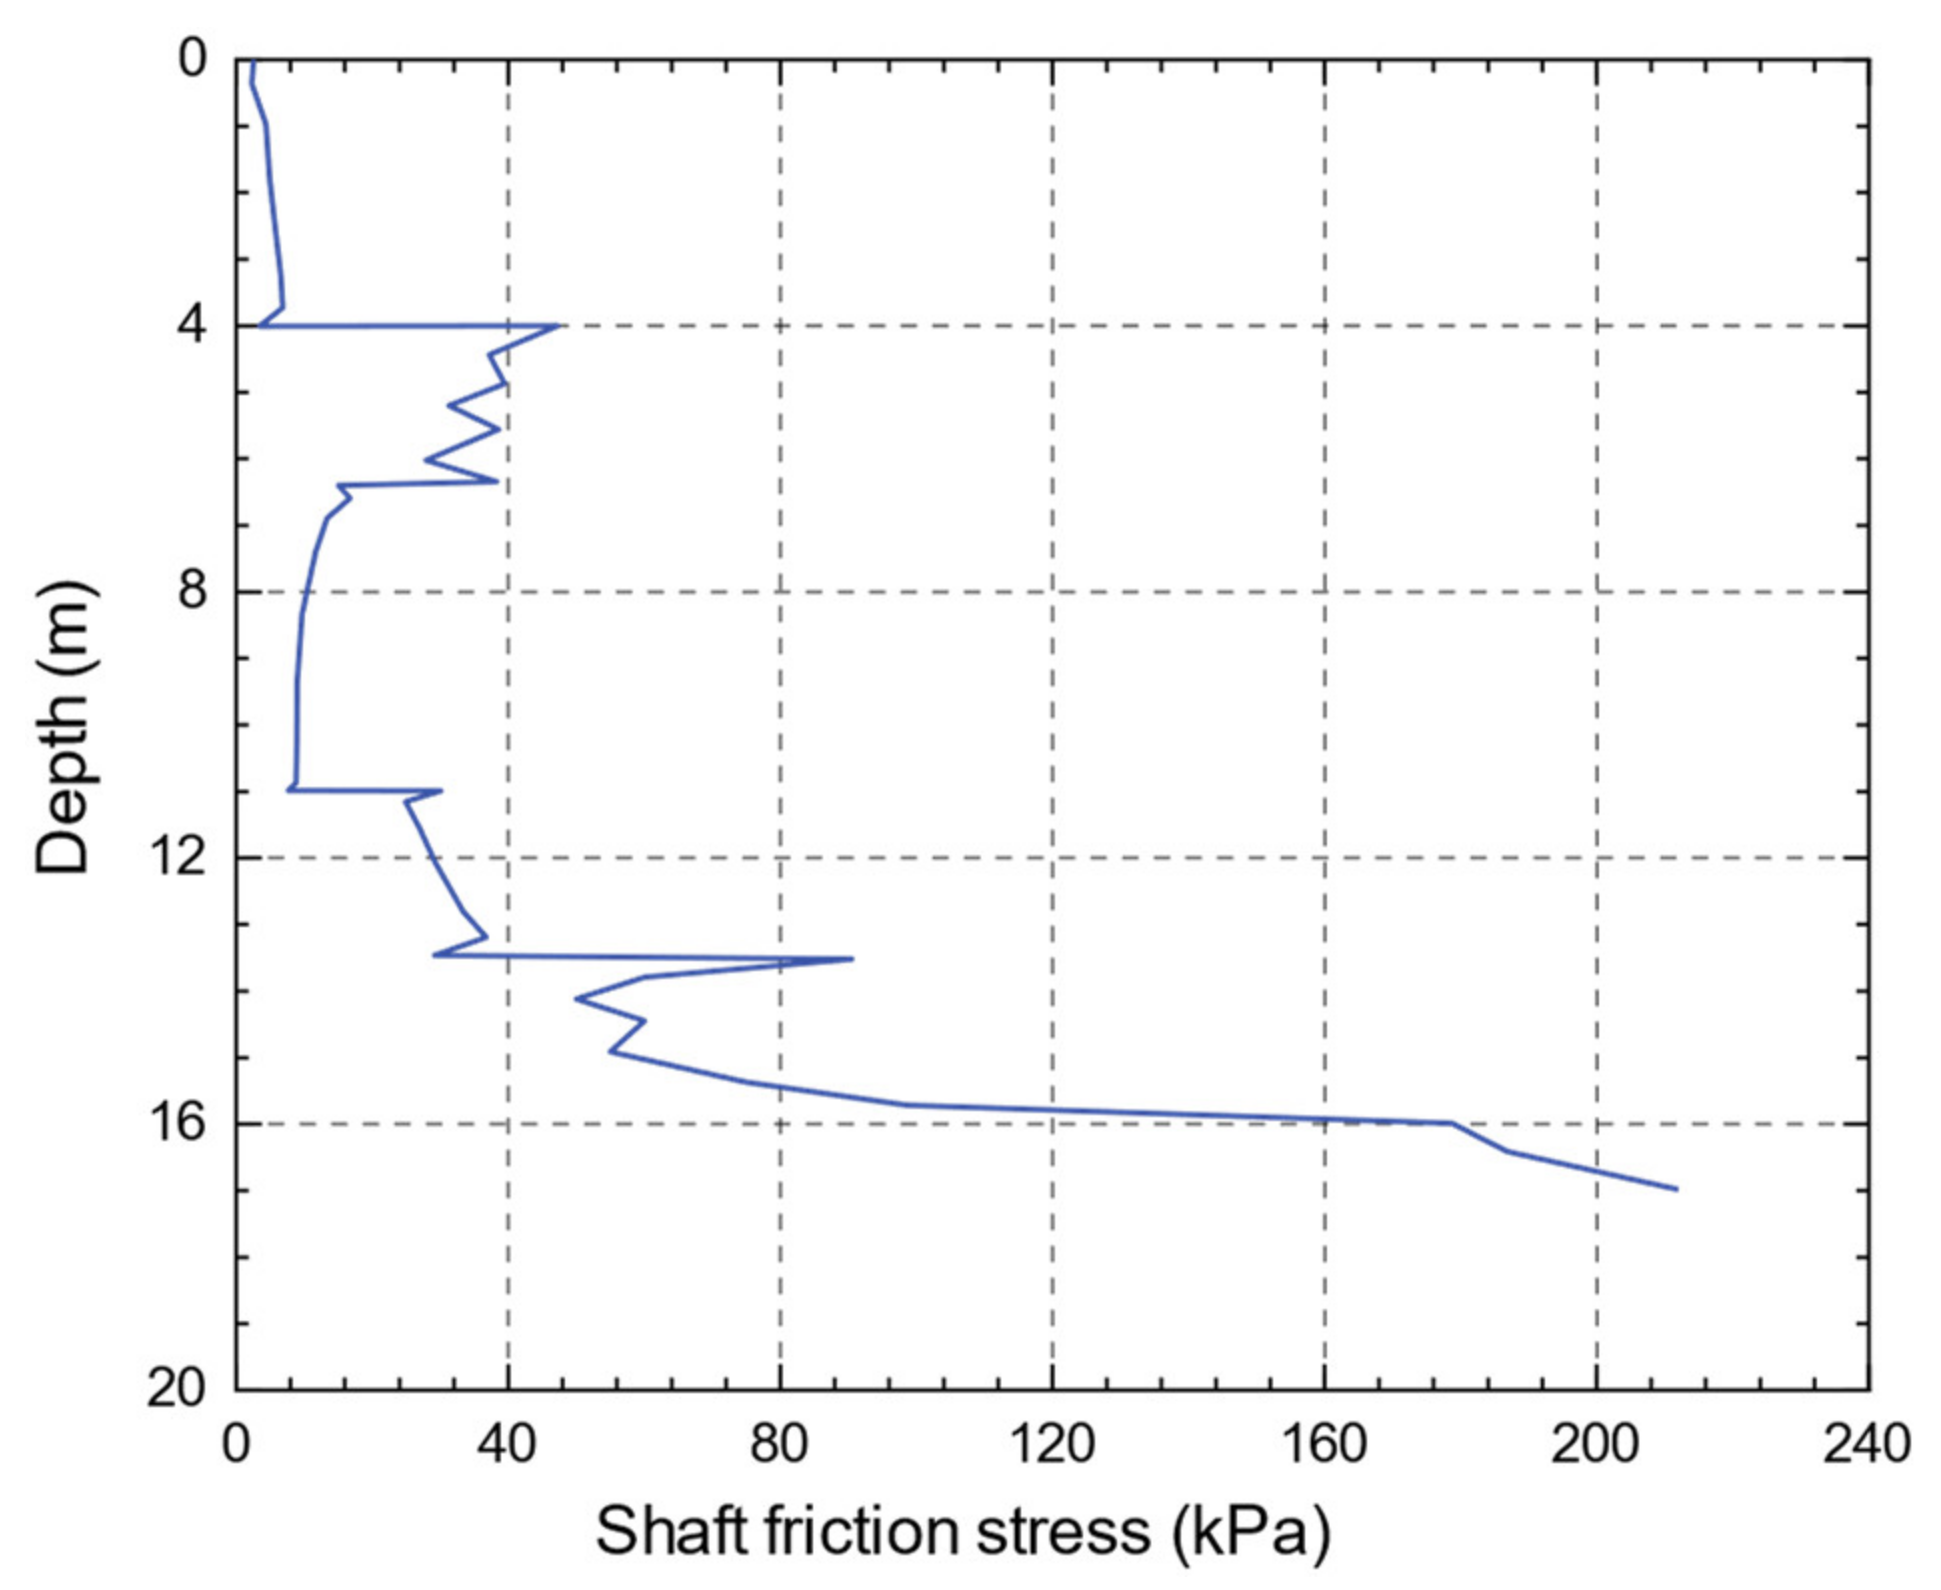
At the last load increment (1275 kN), the friction resistance carried by the pile shaft and the bearing resistance at the pile tip are about 78% and 22%, respectively, with values of 994 kN and 281 kN. The friction load is calculated by integrating the shear stresses at the interface elements over the pile surface, while the pile bearing resistance is calculated by the integration of normal stresses at the interface elements over the pile base area. The shaft friction stress distribution along with the pile depth is presented in Figure 11.
4.1. Stress–Strain Curves
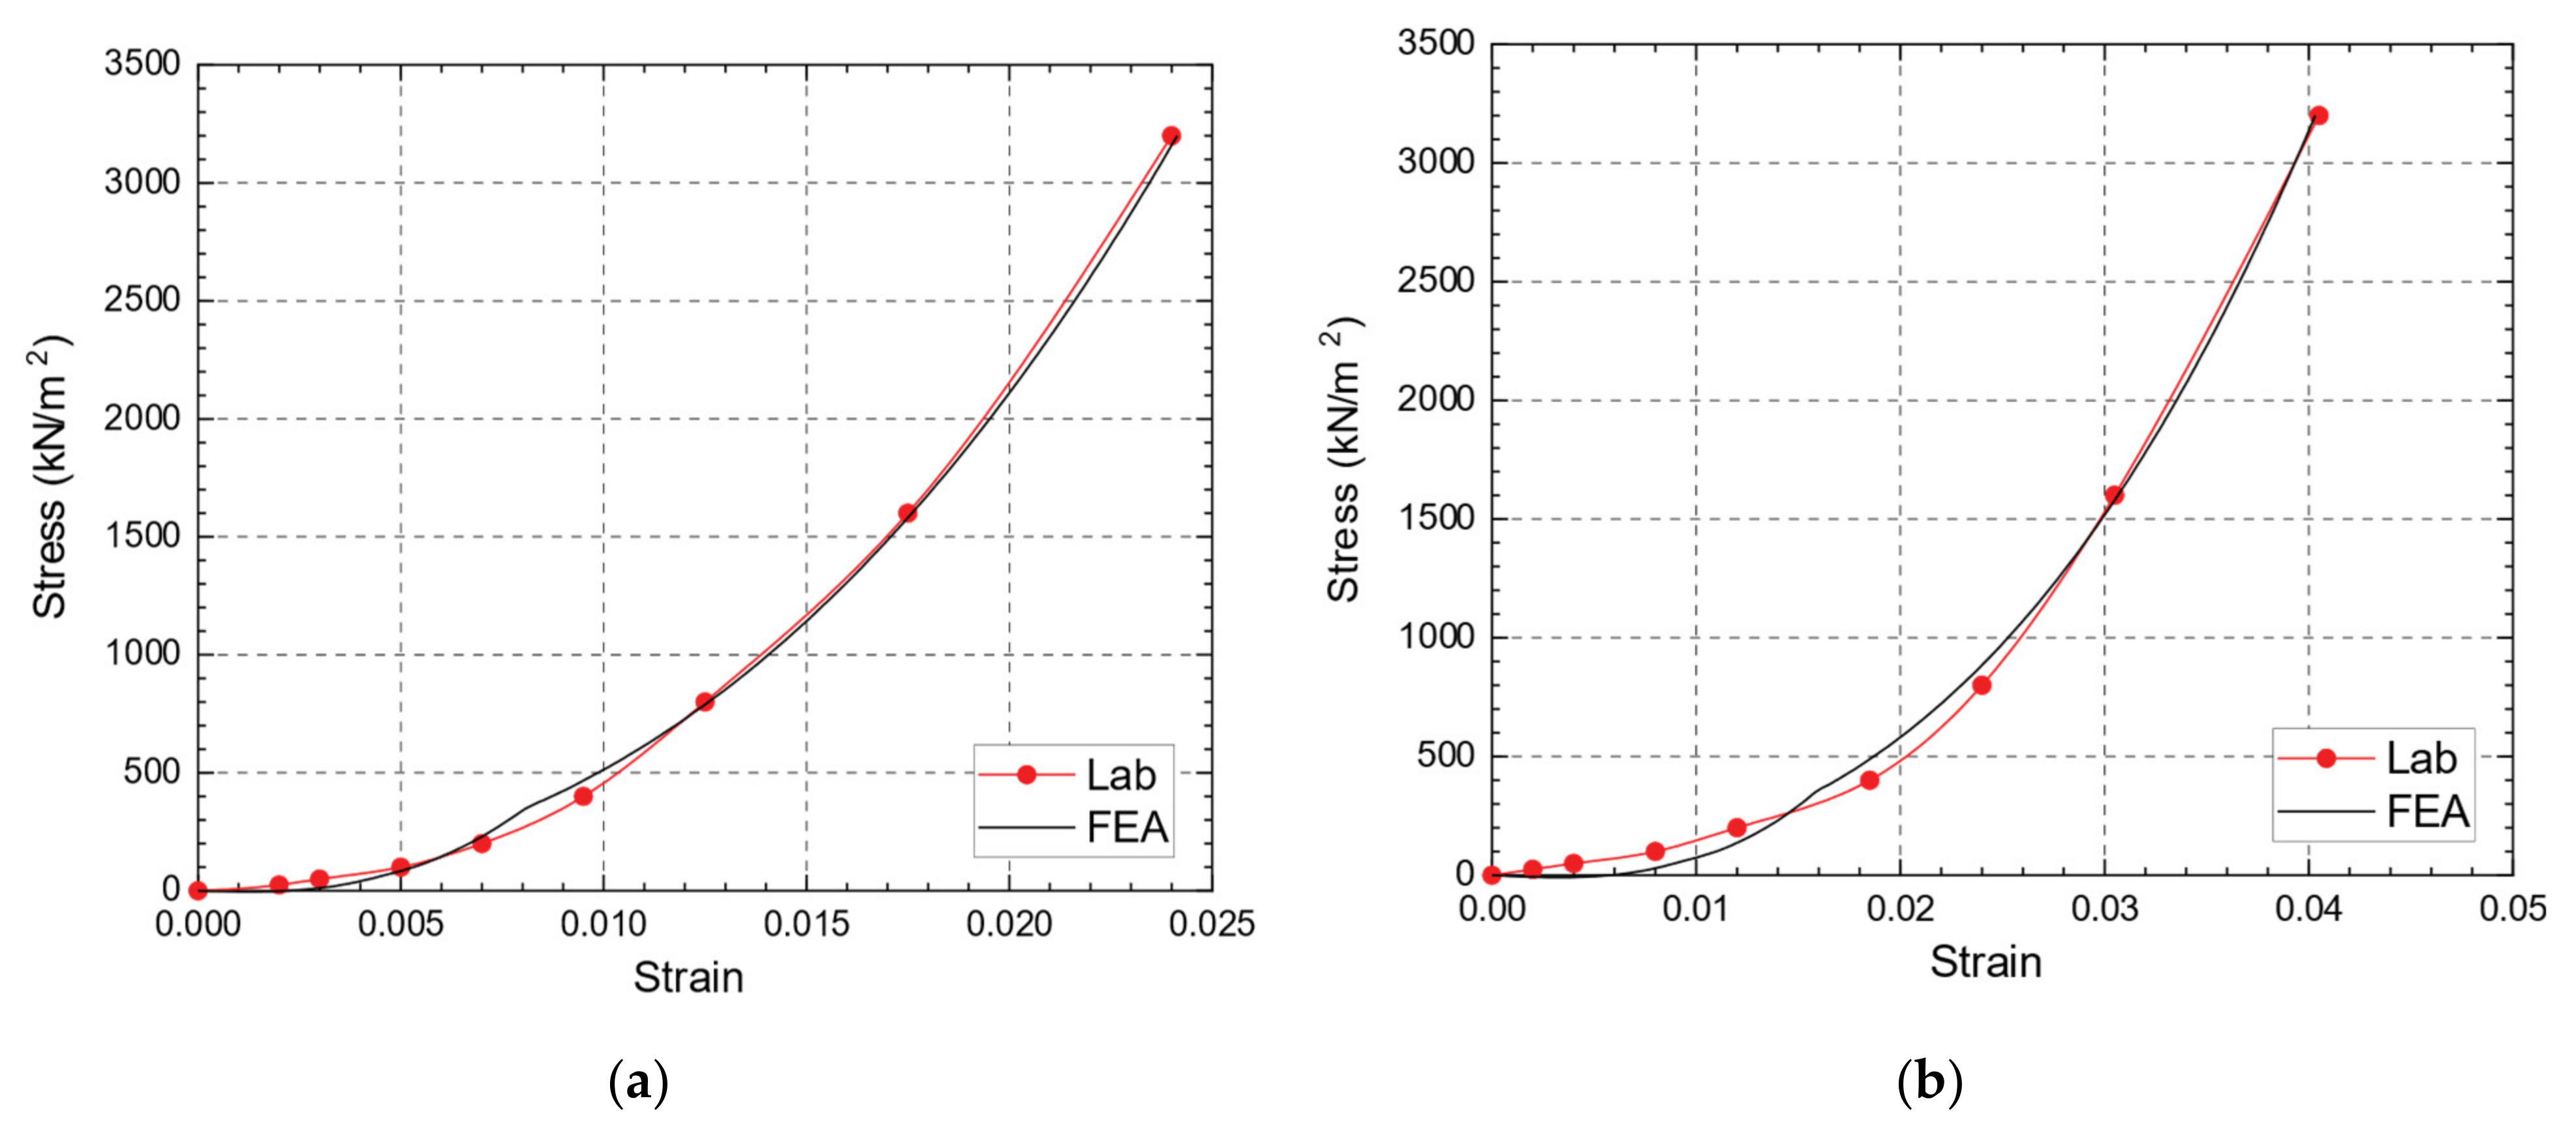
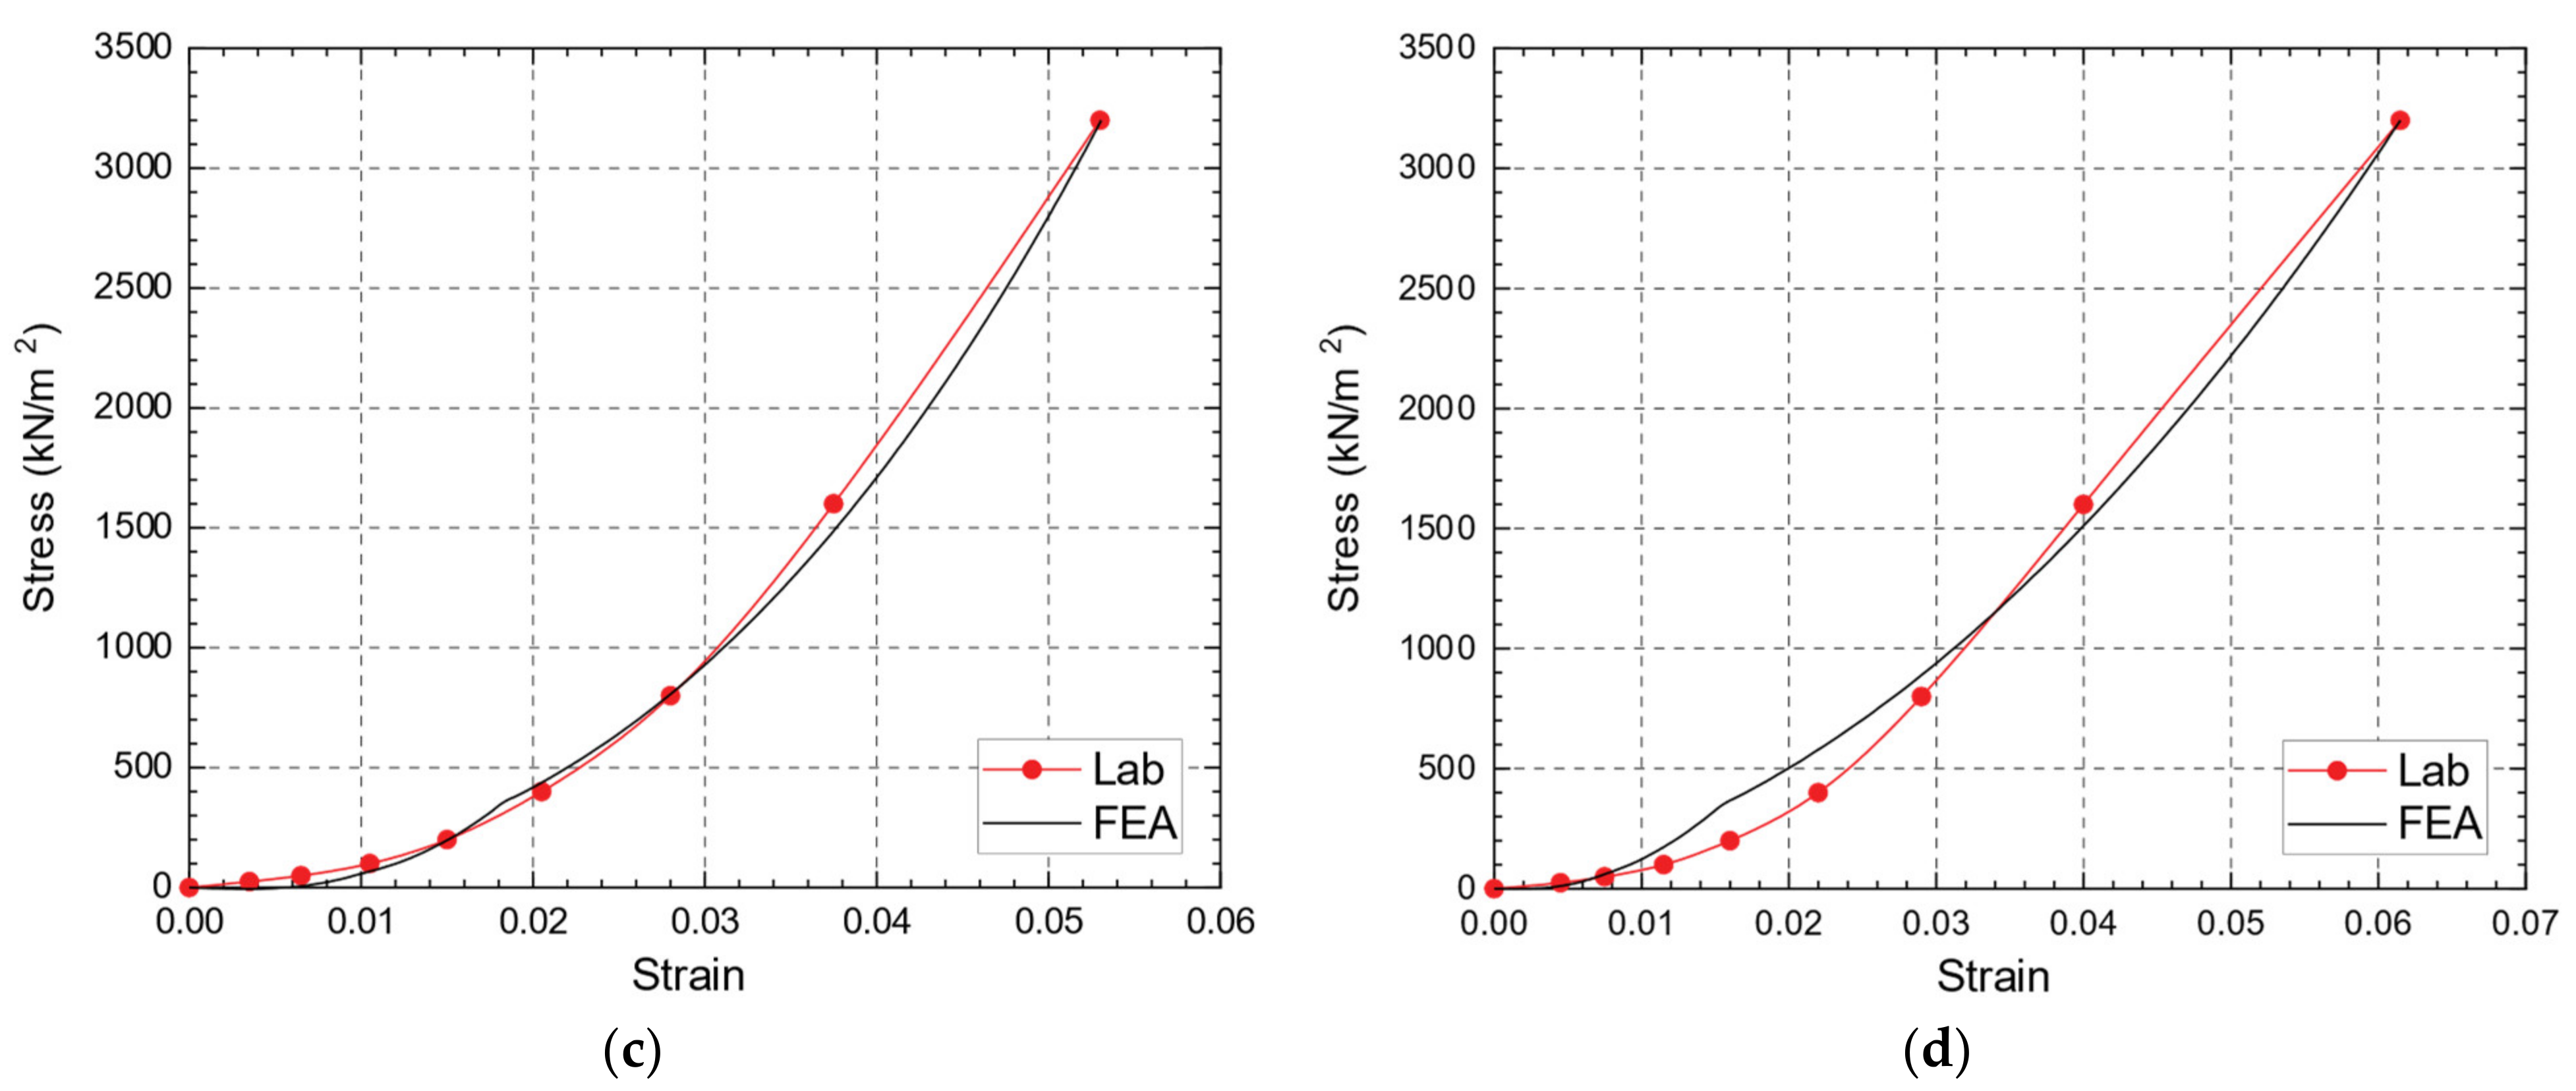
An additional verification step is performed in modeling the stress–strain relationships of the CS using the one-dimensional compression test (oedometer test) using PLAXIS software. A one-dimensional compression test for soil models can be simulated with the oedometer test option in the PLAXIS 3D FE program. As shown in Figure 12, the stress–strain results using the oedometer tests were compared with the numerical model outputs, and it gave a good agreement for CS and CS + BS mixture. The input parameters for the FEA are extracted from the lab test results and listed in Table 4. The angle of internal friction values presented in Table 4 are taken for the loose state to match the actual borehole condition, which was loose to medium dense.
To use the appropriate value of the soil modulus in the FEM, many attempts and runs are made using different E values to obtain the most appropriate value, which guarantees a close matching between numerical and laboratory results. The previous verification is conducted to determine the CS characteristic parameters that can be used in the FEA for the pile loading model presented in the following section.
4.2. Parameters Affecting Pile Capacity in CS
In this section, the input parameters for the FEM analyses are those obtained from the aforementioned stress–strain curve for the verification test specimens. The influence of the change of the bearing layer is studied for the four soil types, CS, CS + 10% BS, CS + 30% BS, and CS + 50% BS, besides the effect of changing the pile length and diameter. The sand properties with different percentages of BS as the input variables are summarized in Table 5.
The soil and the open-ended pipe pile are modeled as 10-node tetrahedral and plate elements, respectively. The mesh is generated using the built-in PLAXIS meshing procedure and is refined until a satisfactory mesh quality index is achieved. The pile is defined as steel linear elastic material with a Young’s modulus, , of , Poisson’s ratio, , and a unit weight, γ, of . Interface elements are used at the pile-soil contact interface. A strength reduction factor, , is taken equal to 0.7 to allow slippage at the pile-soil interface joints. The presented diameter is the outer diameter (D), and wall thickness is the minimum piling wall thickness according to Equation (5) [39].
where, is the pile wall thickness (mm) and is the pile diameter (mm).
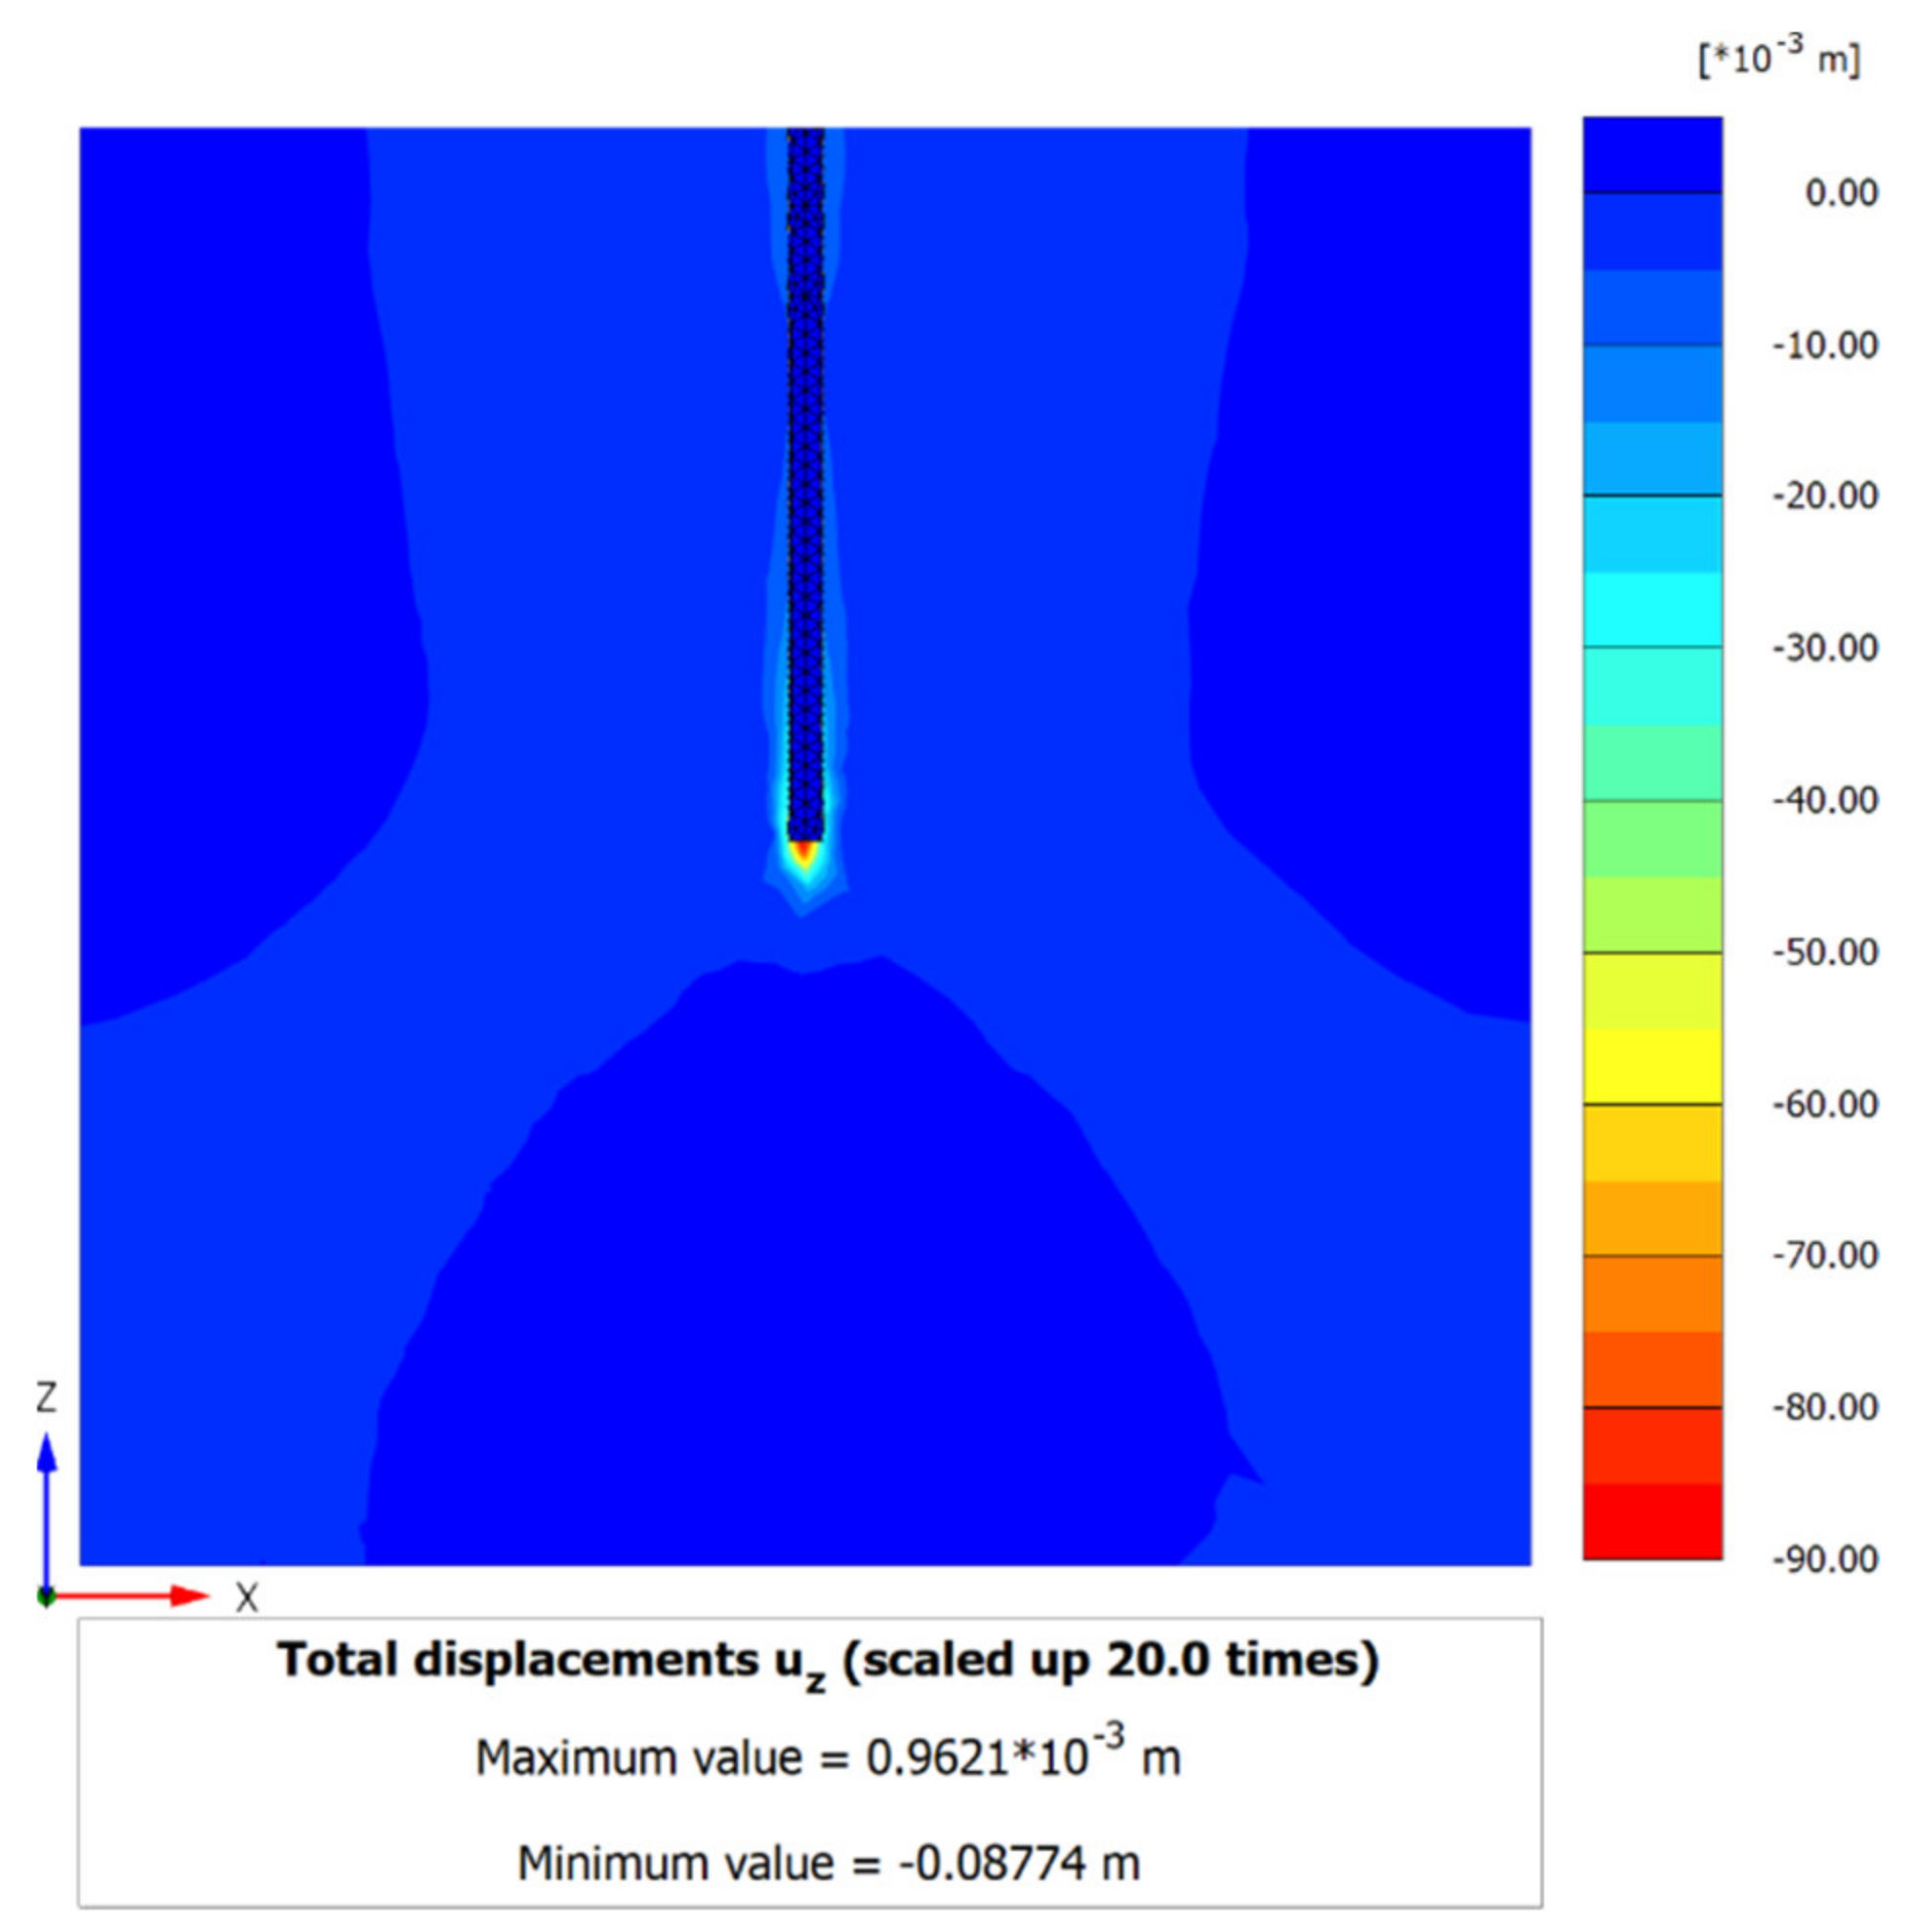
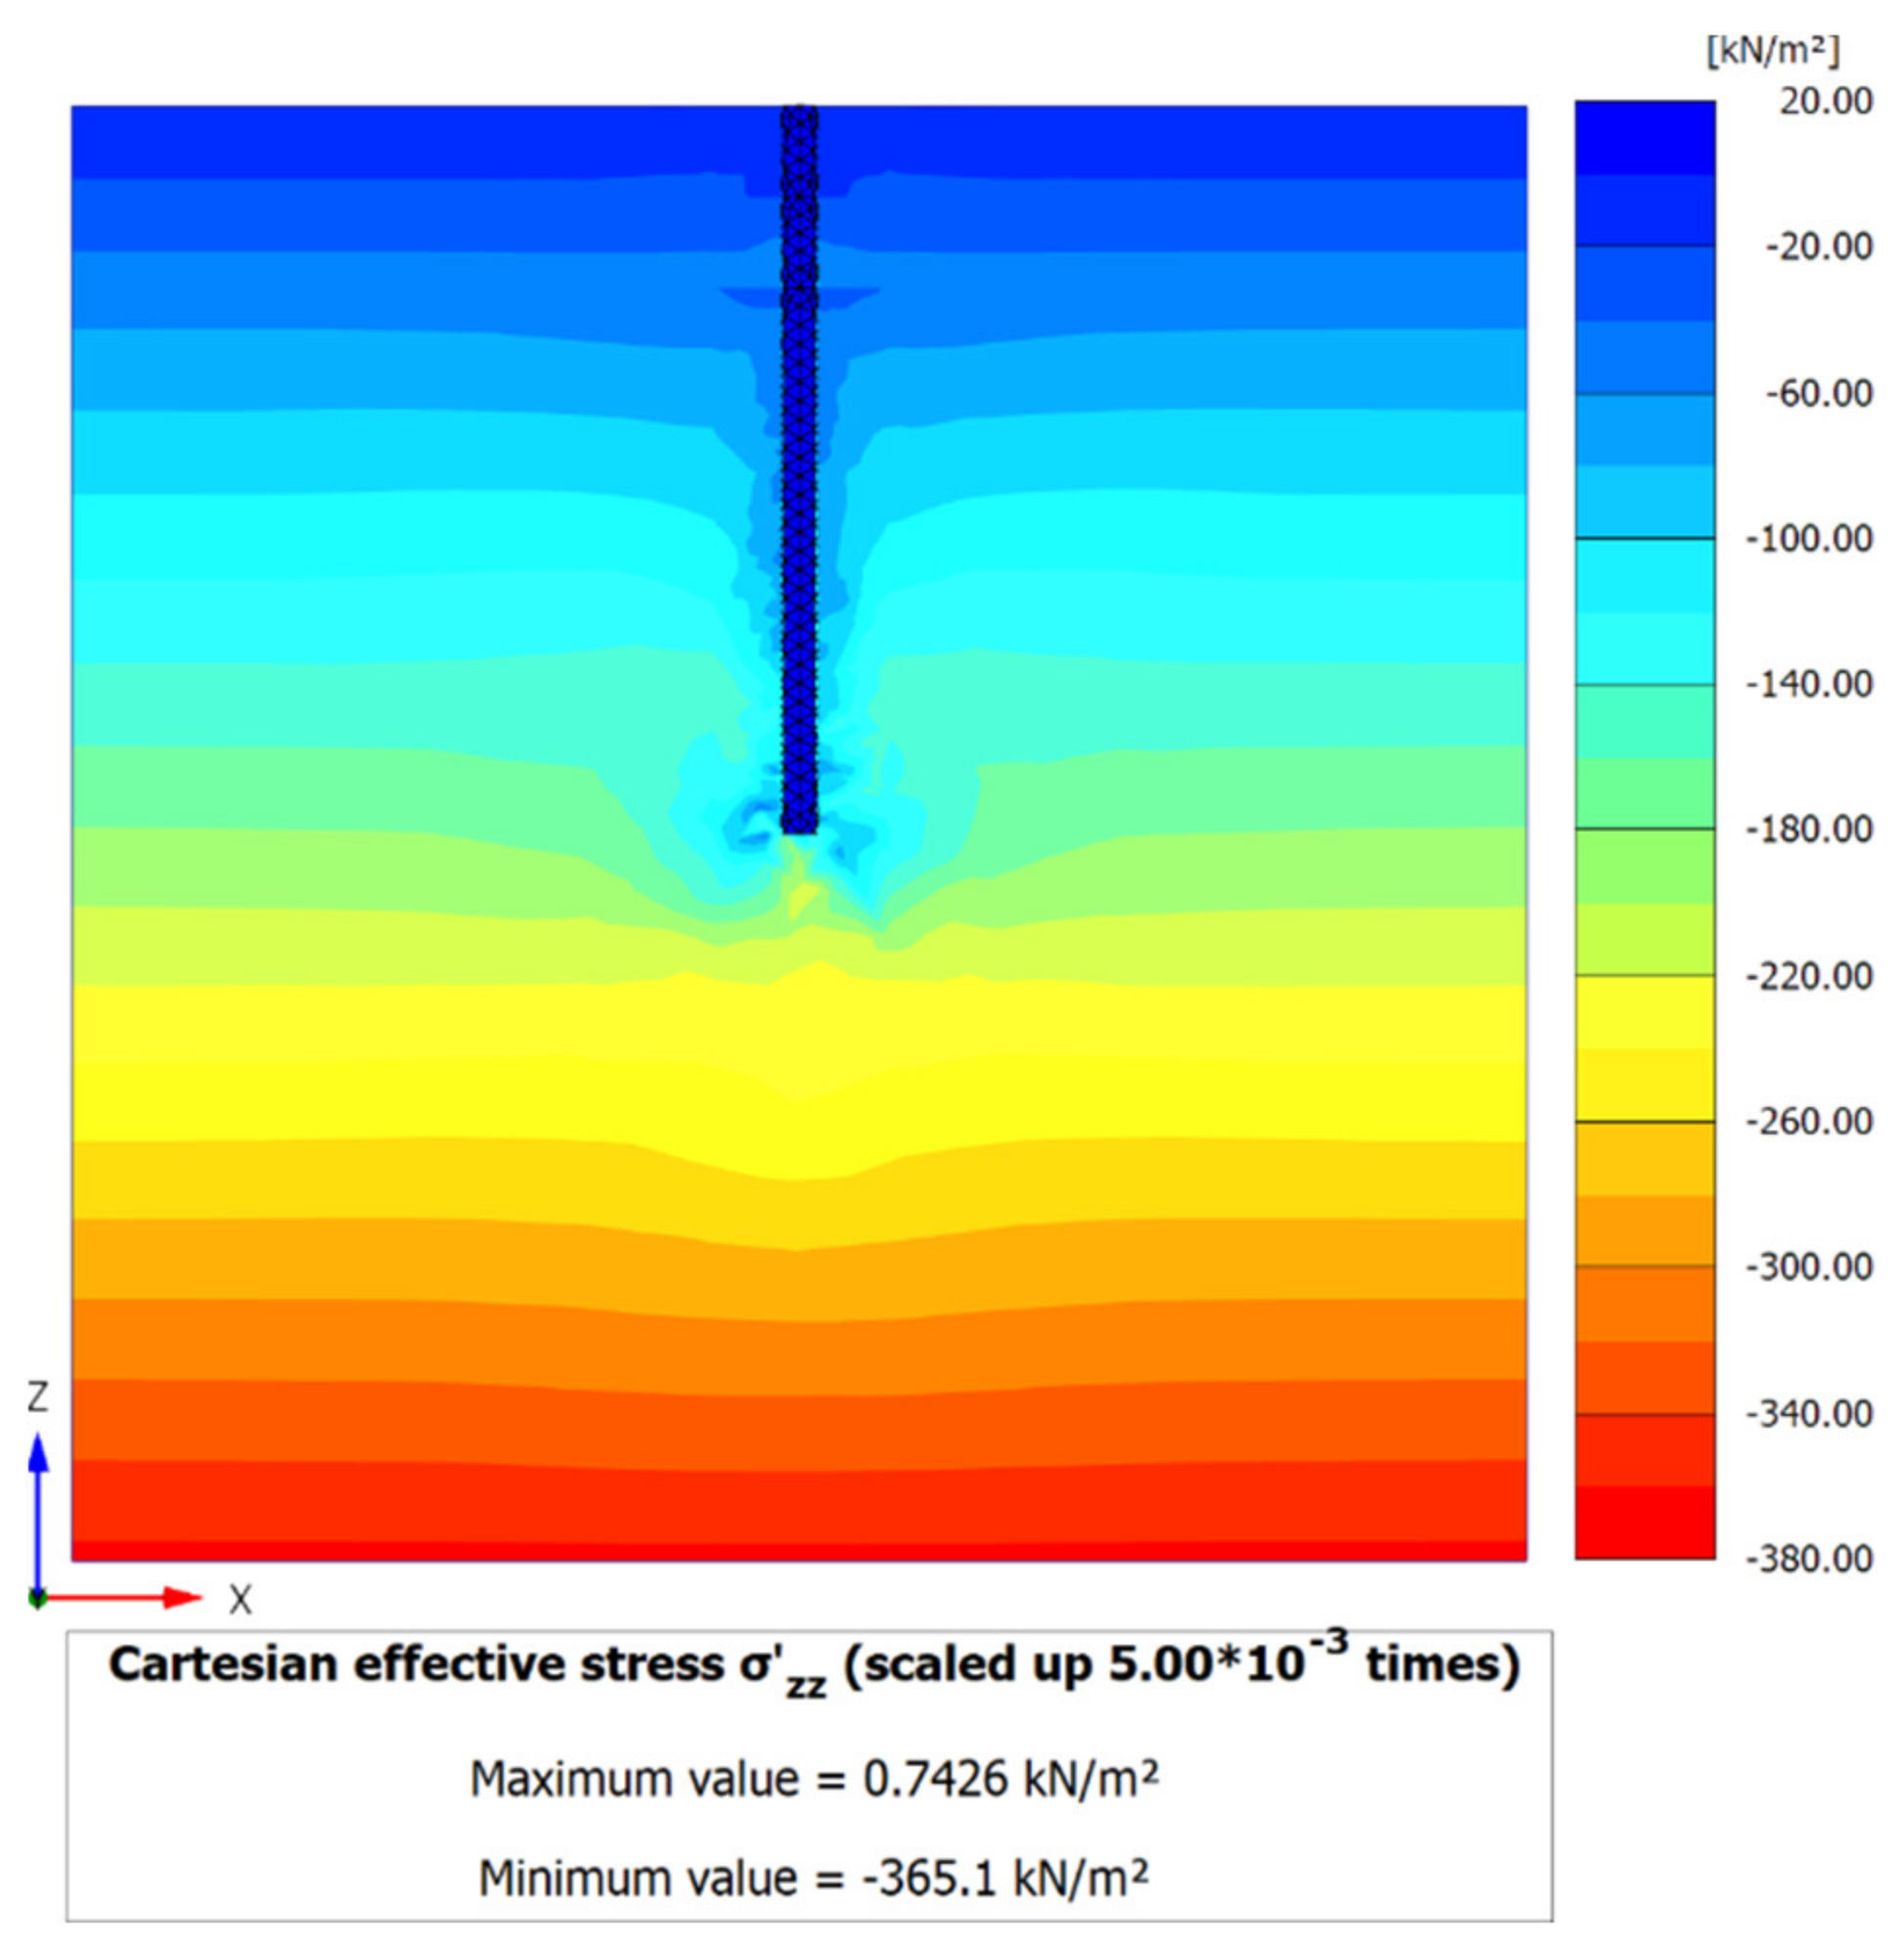
The analysis is conducted in three stages; the first stage is setting up the initial stress state, namely, the geostatic pressure, the second stage includes modeling the pile and contact surfaces, and applying the prescribed vertical load is defined in the last stage. The installation process can be simulated using a dynamic analysis for driven pile type, which needs complex sequences besides specific equations for such analysis. What is simulated in this paper is only the change in the materials before and after the pile installation. The pile is axially loaded at its head. Figure 13 shows the 3D FE mesh for the pile model. The soil continuum extends 20 m in both directions around the pile and 40 m deep to minimize the boundary effect on the pile response. Figure 14 shows shading of soil displacements along the pile length and within the soil domain. Figure 15 shows the Z-direction’s stress distribution at the failure load, which is equal to 4000 kN. Vertical stresses within the soil domain are observed to be concentrated along the pile, with a stress concentration around and under the pile tip.
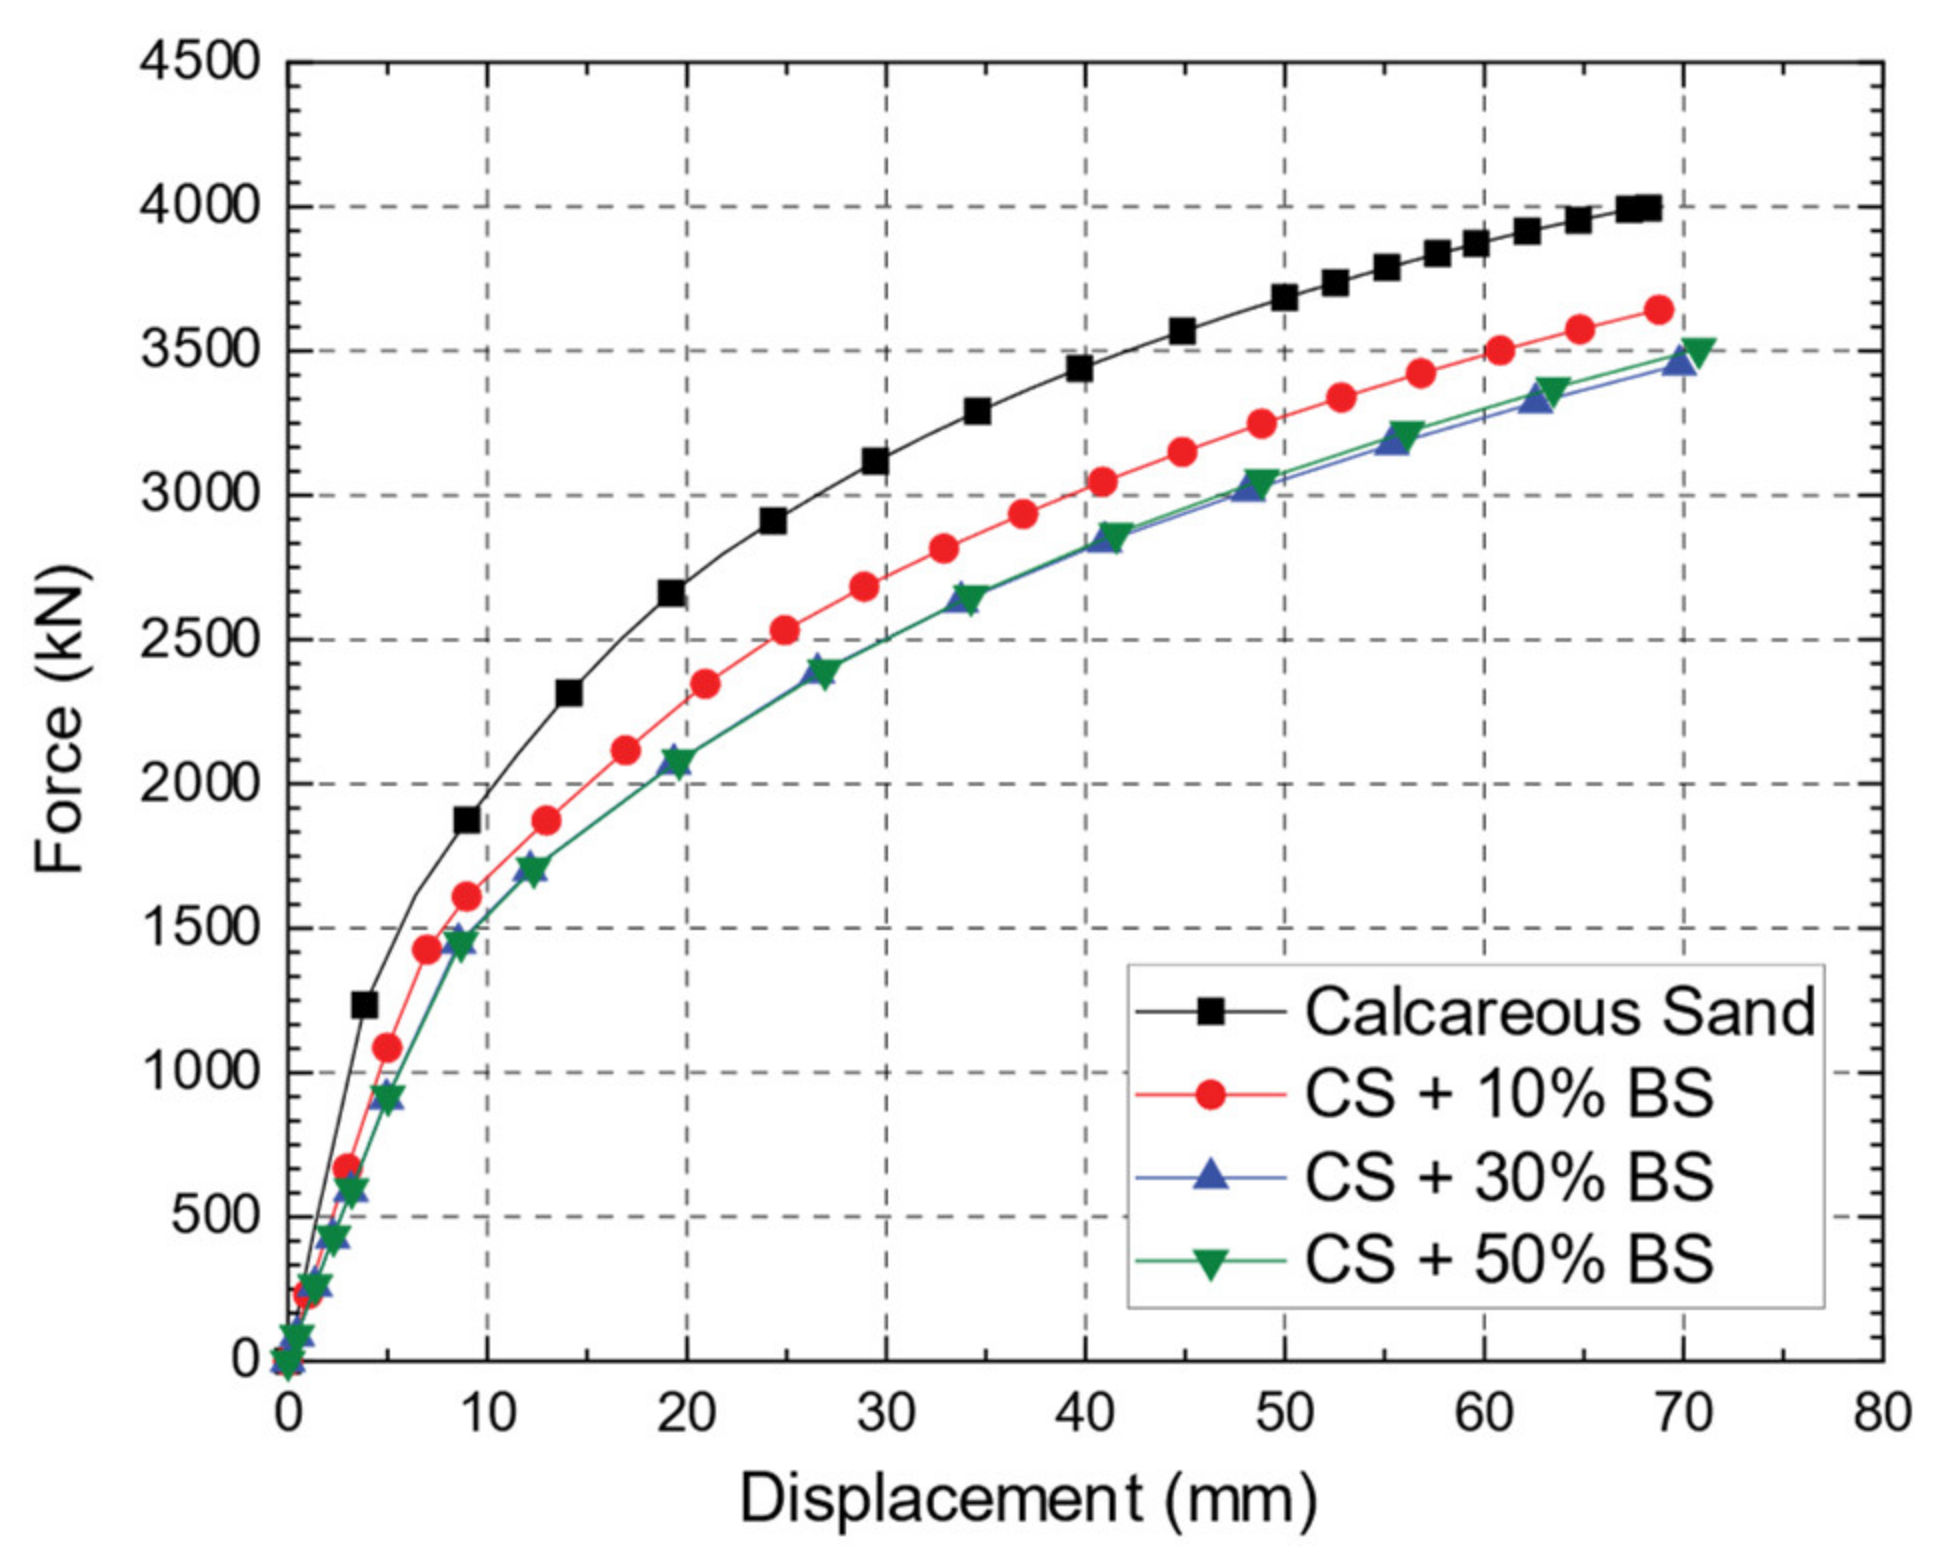
The load-displacement relation of the numerical analysis for a pile with a length and diameter of 20 m and 1 m, respectively, are presented in Figure 16. The higher the BS ratio in the CS, the higher the angle of internal friction, the lower the pile load capacity. The pile ultimate vertical compression load capacity is reduced by 8.8%, 15%, and 16% for CS + 10% BS, CS + 30% BS, and CS + 50% BS soils, respectively, compared with the CS soil. It is noticed that the internal friction had little effect on the pile load-bearing capacity, while the soil modulus is the key factor influencing the pile capacity in the case of the loose state of the soil. Whereas, with the increase in BS ratio in the CS, the Young’s modulus decreases, which corresponds to a decrease in the pile load-carrying capacity.
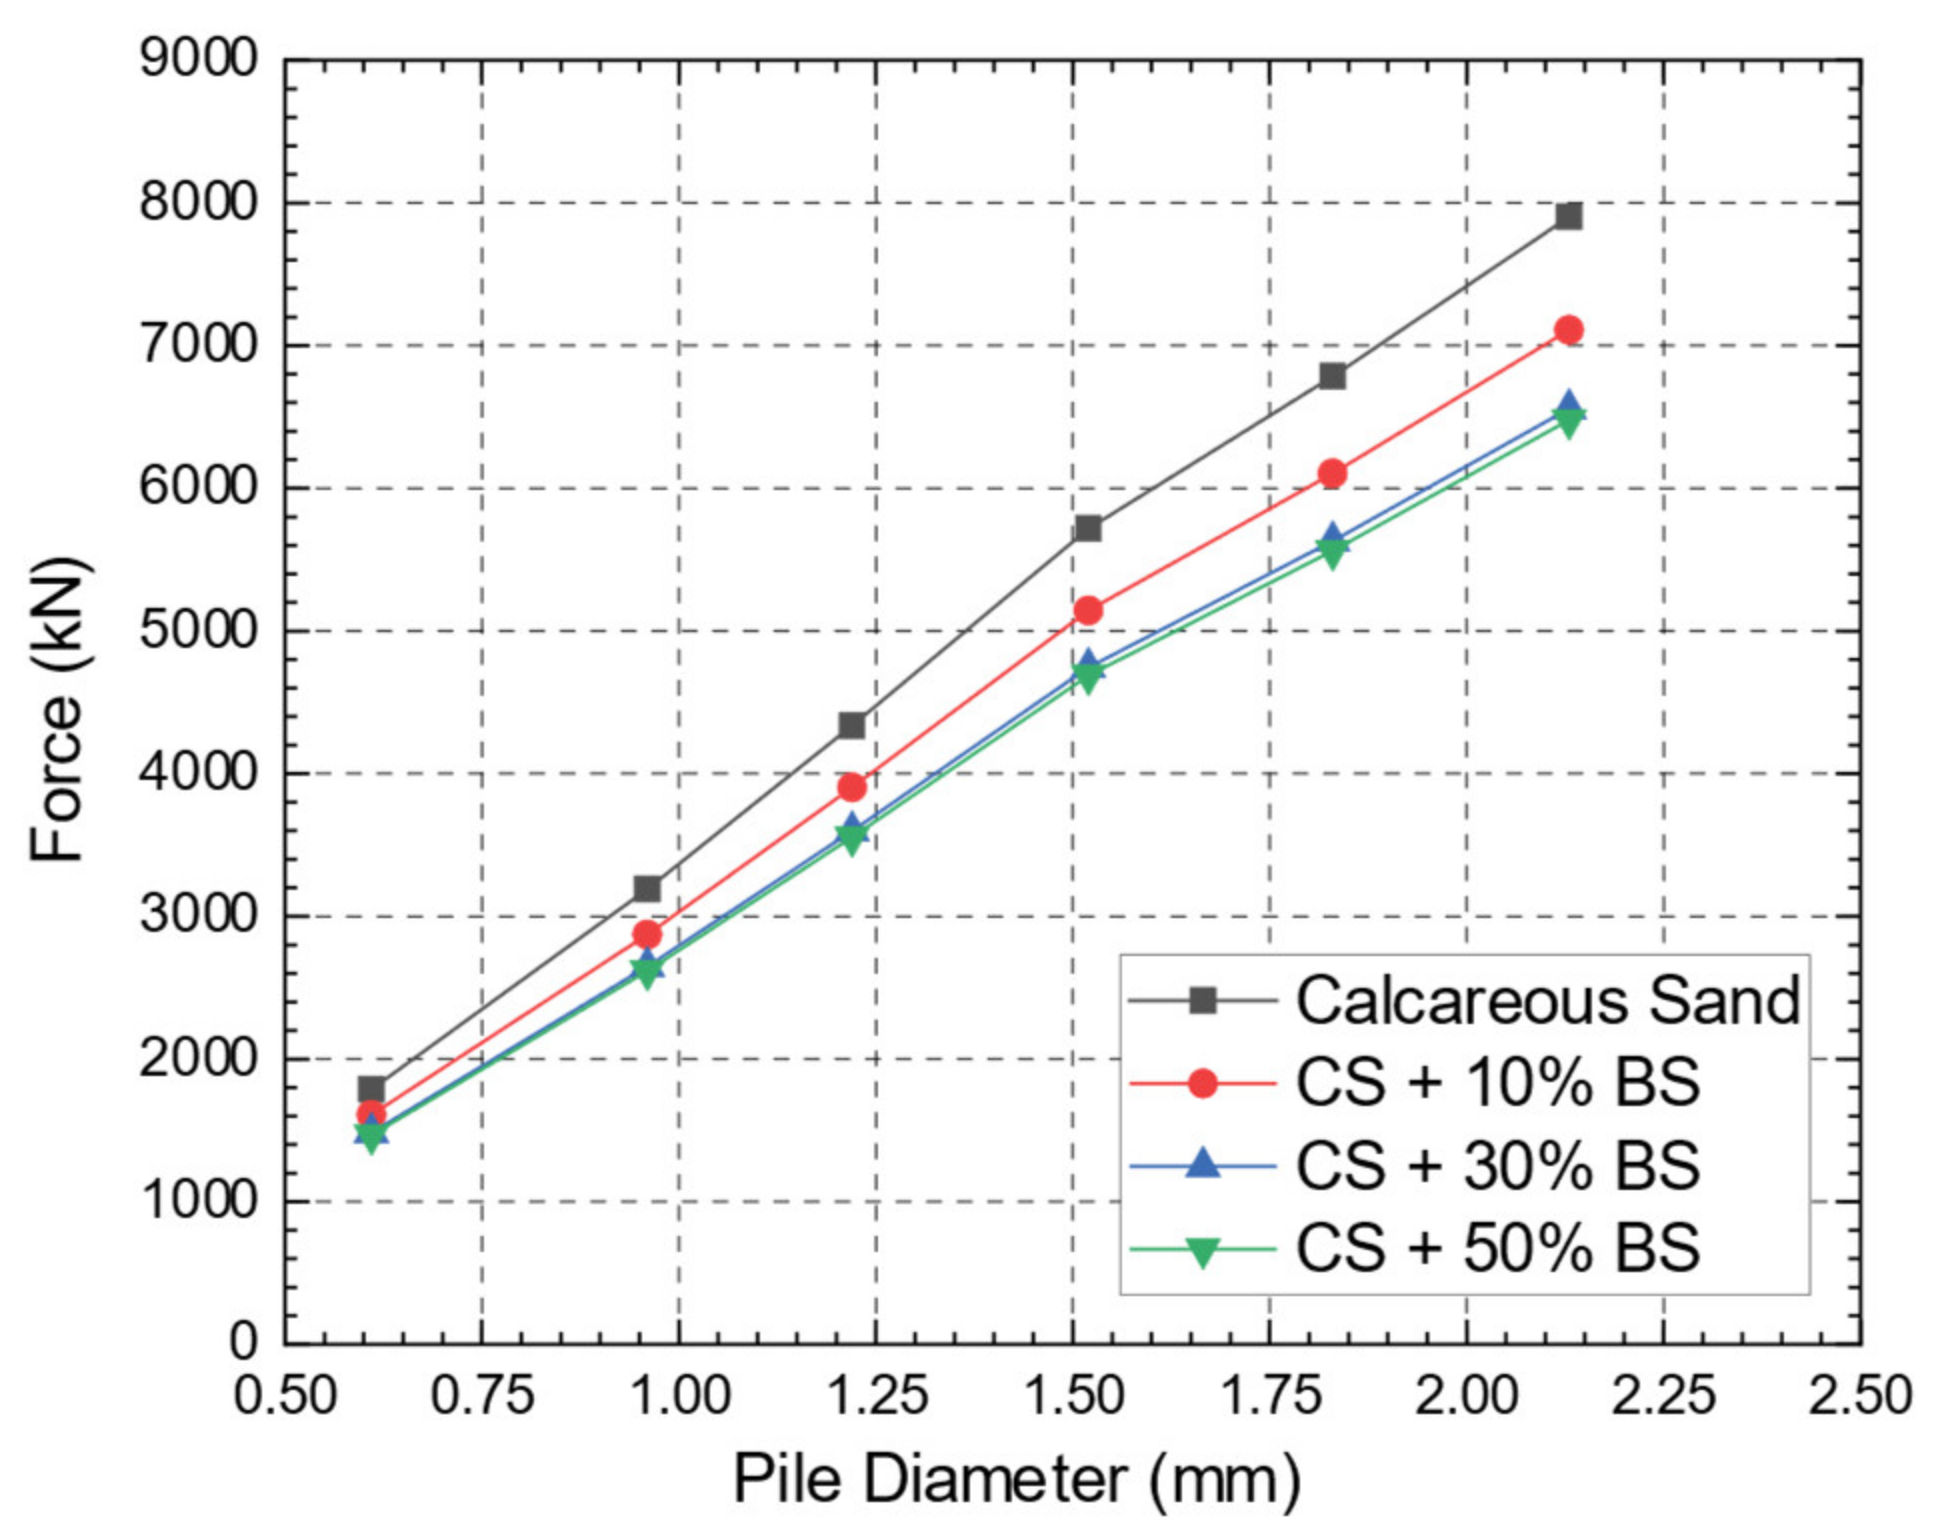
The effect of pile diameter is also investigated. Figure 17 illustrates the relationship between the change of the pile diameter, which ranges from 0.6 to 2.2 m, and pile load for the four mixture ratios of BS in the case of pile embedment depth (L = 20 m). The failure occurs at a vertical pile head displacement () in the range of 5–10% of the pile diameter and the presented data at . Increasing the pile diameter resulted in a continued increase in the pile load. Increasing the contents of the crushable particle reduced the pile capacity generally. Increasing the BS percentage to more than 10% has a negligible effect on the load-carrying capacity. All the presented results are for the bearing layer in the loose state; if the CS layer is dense, it might significantly change the soil stiffness and, consequently, the overall behavior.
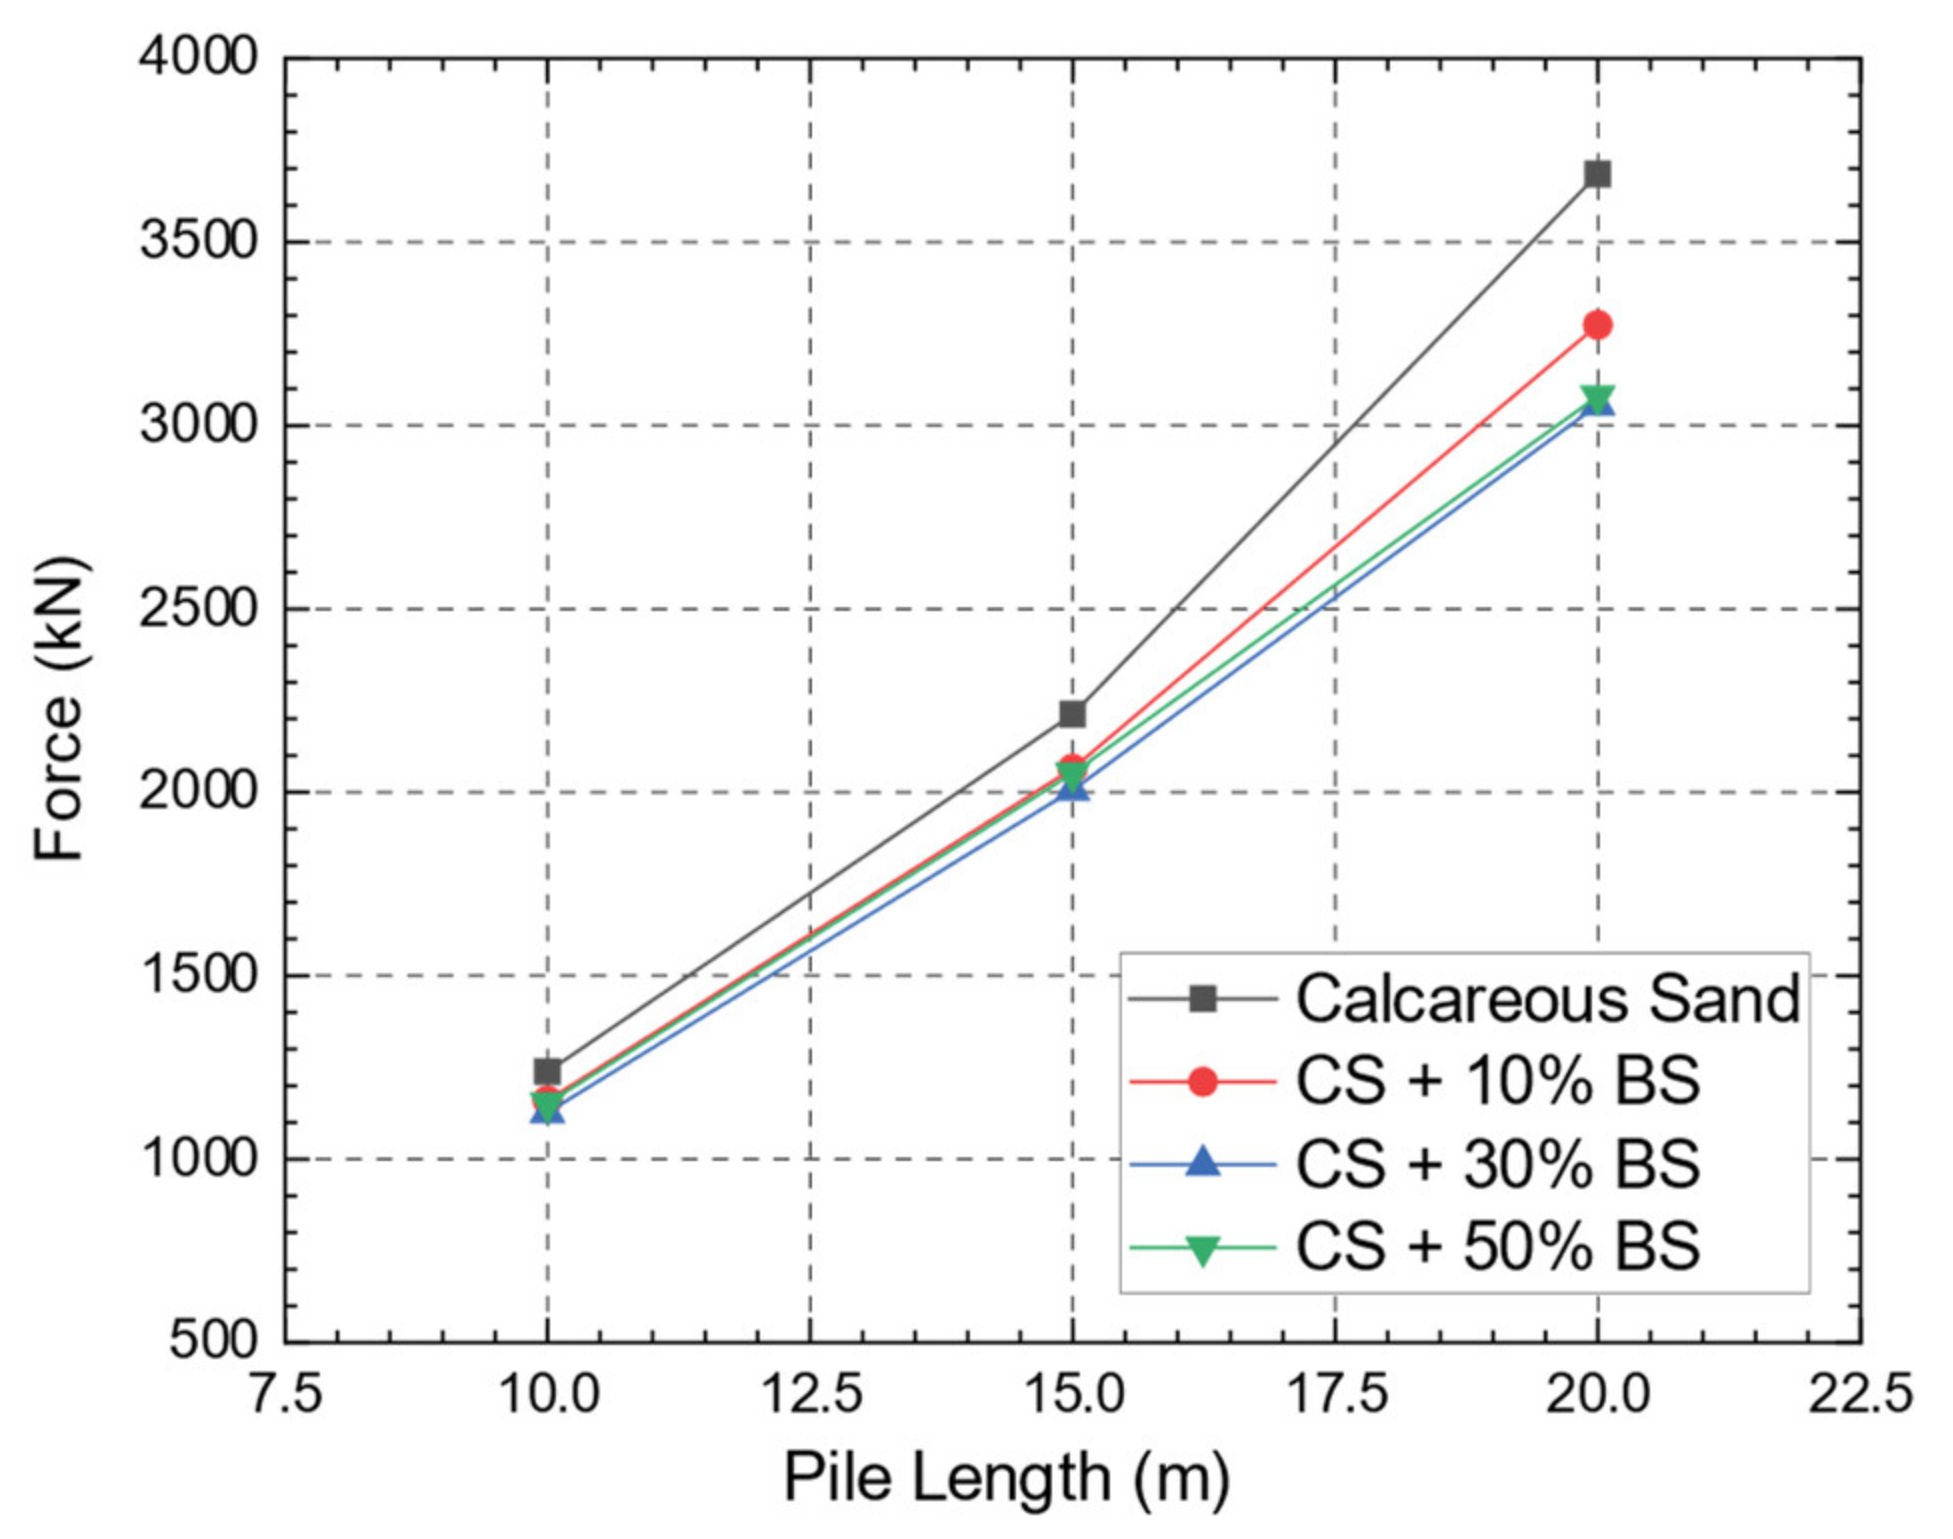
The second investigated parameter is the effect of pile bearing length, 5 m, 10 m, and 15 m, inside the CS layer. Figure 18 illustrates the relationship between pile length and the pile load for the different BS mixtures with an outer diameter of D = 1 m. The data presented in Figure 18 is at . The increase of pile embedment length inside the bearing layer resulted in a rise of the pile capacity due to the rise of the skin frictional resistance along the pile shaft in this layer.
5. Conclusions
This study provides a novel technique to determine the CS characteristic parameters, based on lab test results, that can be used in the FEA for the pile loading model. This research began with obtaining duplicate samples from a borehole as part of the geotechnical investigation at a site in Egypt’s northern coast development project. The physical and mechanical properties of the collected sample are investigated and determined using laboratory tests. Direct shear tests and one-dimensional compression oedometer tests are performed on the original CS samples and other samples with varying ratios of BS that have been collected from the same site.
The angle of internal friction for all samples is determined in the loose and dense states from the direct shear test. The oedometer test data are used to determine the stress–strain curves for all samples. Following that, a numerical study for the tested specimens is performed and verified with the oedometer lab results. Finally, parametric analysis to study pile axial response in the soil under investigation is also presented. The major findings from both experimental and numerical work in the present study are summarized as follows:
- The friction angle increased by 2°, 2.9°, and 4.1° when the broken shells (BS) ratio is raised to 10%, 30%, and 50% by weight, respectively; the modest rise accounted for the angular shape of the broken shell particles.
- Oedometer test results revealed that CS with BSs is more compressible than pure CS since the BSs are weaker than sand particles.
- Under the applied loads used in the recent research (3.20 MN/m2), no significant crushing occurred in particles of CS with BS mixtures specimens.
- Increasing the BS ratio for more than 30% in the CS does not noticeably affect the change of voids ratio in the sample.
- The rise of the BS ratio in the CS soil significantly affects the pile load capacity. The ultimate capacity decreased by 8.8%, 15%, and 16% for CS + 10% BS, CS + 30% BS, and CS + 50% BS, respectively, compared with the CS soil.
- The internal friction of the CS with BS soil had little effect on the pile load-bearing capacity, while soil modulus is the crucial factor influencing the pile capacity in the case of the loose state of the soil. By mixing 10% of the BS with the CS sample, the constrained modulus decreases from 37,900 to 22,000 kN/m2, corresponding to a decrease in the pile load-carrying capacity from 4000 to 3640 kN.
Author Contributions
Conceptualization, N.M.E. and T.N.S.; methodology, N.M.E.; software, N.M.E. and A.M.E.; validation, N.M.E. and A.M.E.; formal analysis, N.M.E.; investigation, N.M.E.; resources, N.M.E. and T.N.S.; data curation, N.M.E. and A.M.E.; writing—original draft preparation, A.M.E. and N.M.E.; writing—review and editing, A.M.E. and T.N.S.; visualization, N.M.E.; supervision, N.M.E., A.M.E. and T.N.S.; project administration, T.N.S. All authors have read and agreed to the published version of the manuscript.
Funding
This research received no external funding.
Acknowledgments
Special appreciation goes to the members of the Geotechnical Engineering laboratory, Zagazig University. The authors thank the reviewers for their constructive comments that improved the paper.
Conflicts of Interest
The authors declare no conflict of interest.
References
- Smith, D.A. Effect of Particle Shape on Grain Size, Hydraulic, and Transport Characteristics of Calcareous Sand. Ph.D. Thesis, University of Hawaii at Manoa, Honolulu, HI, USA, 2003. [Google Scholar]
- Poulos, H.G.; Chua, E.W. Bearing Capacity of Fooundations on Calcareous Sand. In Proceedings of the 11th International Conference on Soil Mechanics and Foundations Engineering, Cambridge, MA, USA, 12–16 August 1985; pp. 1619–1622. [Google Scholar]
- Abdeltawab, S.; El Mashad, M.; El Shinawi, A. Geoengineering Properties of Calcareous and Quartzite Sand Collected from West Alexandria Coastal Line and Abo Rawash Quarry Area. Int. J. Sci. Eng. Res. 2013, 4, 934–943. [Google Scholar]
- Angemeer, J.; Carlson, E.G.; Klick, J.H. Techniques And Results Of Offshore Pile Load Testing In Calcareous Soils. In Proceedings of the Offshore Technology Conference, Houston, TX, USA, 28 April 1973. [Google Scholar] [CrossRef]
- Wang, X.-Z.; Jiao, Y.-Y.; Wang, R.; Hu, M.-J.; Meng, Q.-S.; Tan, F.-Y. Engineering Characteristics of The Calcareous Sand in Nansha Islands, South China Sea. Eng. Geol. 2011, 120, 40–47. [Google Scholar] [CrossRef]
- Datta, M.; Gulhati, S.K.; Rao, G.V. Crushing of Calcareous Sands during Drained Shear. Soc. Pet. Eng. J. 1980, 20, 77–85. [Google Scholar] [CrossRef]
- Hardin, B.O. Crushing of Soil Particles. J. Geotech. Eng. 1985, 111, 1177–1192. [Google Scholar] [CrossRef]
- Murff, J.D. Pile Capacity in Calcareous Sands: State If the Art. J. Geotech. Eng. 1987, 113, 490–507. [Google Scholar] [CrossRef]
- Spagnoli, G.; Doherty, P. Comparison of Two Calcareous Sands in Relation to A Novel Offshore Mixed-In-Piace Pile. Oil Gas. Eur. Mag. 2016, 42, 91–94. [Google Scholar]
- Rausche, F.; Hussein, M. Pile driving in calcareous sediments. In Proceedings of the International Conference on Engineering for Calcareous Sediments, Manama, Bahrain, 21–24 February 2000; pp. 345–359. [Google Scholar]
- Yeung, S.K.; Carter, J.P. An Assessment of The Bearing Capacity of Calcareous and Silica Sands. Int. J. Numer. Anal. Methods Geéomeéch. 1989, 13, 19–36. [Google Scholar] [CrossRef]
- Rashad, R.H. Geotechnical characterization of calcareous sand in Egypt. Ph.D. Thesis, Zagazig University, Zagazig, Egypt, 2018. [Google Scholar]
- Randolph, M.; Finnie, I.; Joer, H. Performance of Shallow and Deep Foundations in Calcareous Soil. In Proceedings of the International Seminar in Kagoshima ’93-Regional Soils, Kagoshima, Japan, 1 January 1993; pp. 169–220. [Google Scholar]
- Nauroy, J.; Letirant, P. Driven Piles and Drilled and Grouted Piles in Calcareous Sands. In Proceedings of the Offshore Technology Conference, Houston, TX, USA, 6–9 May 1985. [Google Scholar] [CrossRef]
- Demars, K.R. Unique Engineering Properties and Compression Behavior of Deep-Sea Calcareous Sediments. In Geotechnical Properties, Behaviour and Performance of Calcareous Soils; Chaney, R.C., Ed.; ASTM International: West Conshohocken, PA, USA, 2009; p. 97. [Google Scholar] [CrossRef]
- Beringen, F.; Kolk, H.; Windle, D. Cone Penetration and Laboratory Testing in Marine Calcareous Sediments; ASTM International: West Conshohocken, PA, USA, 2009; p. 179. [Google Scholar] [CrossRef]
- Mccarel, S.C.; Beard, R. Laboratory Investigation on Piles in Calcareous Sediments; Naval Civil Engineering Lab Port: Hueneme, CA, USA, 1984. [Google Scholar]
- Lu, B. Axial Behavior and Capacity of Driven Piles in Calcareous Sands. In Proceedings of the Offshore Technology Conference, Houston, TX, USA, 5–8 May 1986. [Google Scholar] [CrossRef]
- Chin, J.T. Axial Pile Response in Calcareous Sediment. Ph.D. Thesis, University of Sydney, Sidney, Australia, 1992. [Google Scholar]
- Lee, C.Y.; Poulous, H.G. Jacked Model Pile Shafts in Offshore Calcareous Soils. Mar. Geotechnol. 1988, 7, 247–274. [Google Scholar] [CrossRef]
- Abdelmawla, A.M. Characterization of Geogrid Pullout Mechanism for Calcareous Sand Backfill. Master’s Thesis, Cairo University Giza, Cairo, Egypt, 2017. [Google Scholar]
- Arango, J.C. Stress Strain Behavior and Dynamic Properties of Cabo Rojo Calcareous Sands. Ph.D. Thesis, University of Puerto Rico, Mayaguez, Puerto Rico, 2006. [Google Scholar]
- Cai, W.; Rutherford, C.; Zheng, J. Monotonic Behavior of Calcareous Sands with Increasing Particle Crushing. In Geo-Congress 2020: Modeling, Geomaterials, and Site Characterization; American Society of Civil Engineers: Reston, VA, USA, 2020. [Google Scholar] [CrossRef]
- Noorany, I. Side Friction of Piles in Calcareous Sands. In Proceedings of the 11th International Conference of Soil Mechanics and Foundation Engineering, Cambridge, MA, USA, 12–16 August 1985; pp. 12–16. [Google Scholar]
- Li, X.; Liu, J. One-Dimensional Compression Feature and Particle Crushability Behavior of Dry Calcareous Sand Considering Fine-Grained Soil Content and Relative Compaction. Bull. Int. Assoc. Eng. Geol. 2021, 80, 4049–4065. [Google Scholar] [CrossRef]
- Uygar, E.; Doven, A.G. Monotonic and Cyclic Oedometer Tests on Sand at High Stress Levels. Granul. Matter 2005, 8, 19–26. [Google Scholar] [CrossRef]
- Wils, L.; Haegeman, W. One-Dimensional Compression of a Crushable Sand in Dry and Wet Conditions. In 3rd International Symposium on Geomechanics from Micro to Macro; Taylor And Francis Group: London, UK, 2014; pp. 1403–1408. [Google Scholar] [CrossRef] [Green Version]
- Rui, S.; Guo, Z.; Si, T.; Li, Y. Effect of Particle Shape on The Liquefaction Resistance of Calcareous Sands. Soil Dyn. Earthq. Eng. 2020, 137, 106302. [Google Scholar] [CrossRef]
- Salem, T.N.; Ata, A.; Hassan, R. Numerical Analysis of The Effect of Carbonate Particle Crushing on Piles in Calcareous Sand. Int. J. Trend Res. Dev. 2017, 4, 304–309. [Google Scholar]
- Ata, A.; Hassan, R.; Salem, T.N. Numerical Assessment of Piles Behavior in Saturated and Dry Calcareous Sand. Int. J. Trend Res. Dev. 2018, 4, 310–314. [Google Scholar]
- Ata, A.; Salem, T.; Hassan, R. Geotechnical Characterization of The Calcareous Sand in Northern Coast of Egypt. Ain Shams Eng. J. 2018, 9, 3381–3390. [Google Scholar] [CrossRef]
- ASTM D4373 Standard Test Method for Rapid Determination of Carbonate Content of Soils. 2007. Available online: https://www.astm.org/DATABASE.CART/HISTORICAL/D4373-02R07.htm (accessed on 27 July 2021).
- ASTM D2488 standard Practice for Description and Identification of Soils (Visual-Manual Procedure). 2009. Available online: https://www.astm.org/DATABASE.CART/HISTORICAL/D2488-09A.htm. (accessed on 27 July 2021).
- ASTM D4254 standard Test Methods for Minimum Index Density and Unit Weight of Soils and Calculation of Relative Density. 2006. Available online: https://www.astm.org/DATABASE.CART/HISTORICAL/D4254-00R06.htm. (accessed on 27 July 2021).
- ECP 202. “Egyptian Code for Soil Mechanics—Design and Construction of Foundations, Part 1, Site Investigation”. 2005. Available online: https://www.scirp.org/(S(351jmbntvnsjt1aadkposzje))/reference/ReferencesPapers.aspx?ReferenceID=940161 (accessed on 27 July 2021).
- Schanz, T.; Vermeer, P.A.; Bonnier, B.G. The Hardening Soil Model: Formulation and Verification. In Beyond 2000 in Computational Geotechnics; Routledge: London, UK, 1999; pp. 281–296. Available online: https://www.taylorfrancis.com/chapters/edit/10.1201/9781315138206-27/hardening-soil-model-formulation-verification-schanz-vermeer-bonnier (accessed on 27 July 2021).
- El-Mossalamy, Y.M.; El-Nahhas, F.M.; Al-Deab, M.M. Piled Raft Foundation in Calcareous Cemented Sand in Kuwait City. In Proceedings of the 14th International Conference of Structural Geotechnical Engineering (ICSGE 14), New Cairo, Egypt, 20–22 December 2015. Session 3, Paper No: 5. [Google Scholar]
- Bowles, J. Foundation Analysis and Design; Mcgraw-Hill: New York, NY, USA, 1988. [Google Scholar]
- American Petroleum Institute. Recommended Practice for Planning, Designing and Constructing Fixed Offshore Platforms—Working Stress Design. API Recomm Pract 2A-WSD. 2002. Available online: https://www.apiwebstore.org/publications/item.cgi?58bf26e5-8e94-4eb0-97f3-152abb4c1f37 (accessed on 27 July 2021).
Figure 1.
SPT test results for a borehole in the northern coastal region in Egypt, (a) Borehole part-1, (b) Borehole part-2.
Figure 1.
SPT test results for a borehole in the northern coastal region in Egypt, (a) Borehole part-1, (b) Borehole part-2.


Figure 2.
Map of the investigated area and the boring location on the northern coast using Google Earth.
Figure 2.
Map of the investigated area and the boring location on the northern coast using Google Earth.

Figure 3.
SEM and photographs of soil samples.

Figure 4.
Grading curve of the CS.

Figure 5.
Normal-shear stresses relationship for CS in case of (a) loose state, and (b) dense state.
Figure 5.
Normal-shear stresses relationship for CS in case of (a) loose state, and (b) dense state.

Figure 6.
relationship for CS + 30% BS in the dense state.

Figure 7.
Stress and change in void ratio relationship for CS and combinations of CS and BS 10,000.

Figure 8.
Constrained soil modulus versus normal stress.

Figure 9.
Concept of the HS model, (a) yield surfaces in plane, (b) total yield contour in principal stress space for cohesionless soil.
Figure 9.
Concept of the HS model, (a) yield surfaces in plane, (b) total yield contour in principal stress space for cohesionless soil.

Figure 10.
Experimental and numerical pile load-displacement relationships.

Figure 11.
Shaft friction stress distribution.

Figure 12.
Stress–strain curve for (a) CS sample; (b) CS + 10% BS sample; (c) CS + 30% BS sample; (d) CS + 50% BS sample.
Figure 12.
Stress–strain curve for (a) CS sample; (b) CS + 10% BS sample; (c) CS + 30% BS sample; (d) CS + 50% BS sample.


Figure 13.
Finite element mesh for pile in CS.

Figure 14.
Displacement for the soil around the pile at failure.

Figure 15.
Vertical stresses within the soil domain at failure.

Figure 16.
Pile load settlement curve.

Figure 17.
Pile load versus pile diameter.

Figure 18.
Pile load versus pile length.


Table 1.
Grading and density of the northern coast CS.
| Parameter | Gs | ||||||||
|---|---|---|---|---|---|---|---|---|---|
| CS of the northern coast | 0.17 | 0.20 | 0.25 | 0.28 | 1.70 | 0.90 | 16.7 | 18.1 | 2.8 |
Table 2.
Summary of the angle of frictional resistance for northern coast CS and CS + BS samples.
| Shear Box Test | |||||||
|---|---|---|---|---|---|---|---|
| Loose State | Dense State | ||||||
| Peak | Residual | ||||||
() | () | ||||||
| CS | 18.10 | 16.59 | 0.674 | 0.535 | 30.5 | 39.9 | 30.6 |
| CS + 10% | 18.58 | 15.67 | 0.773 | 0.495 | 32.4 | 40.0 | 31.0 |
| CS + 30% | 19.40 | 14.24 | 0.951 | 0.432 | 33.4 | 41.2 | 32.6 |
| CS + 50% | 20.15 | 13.60 | 1.043 | 0.379 | 34.6 | 43.8 | 32.7 |
Table 3.
The input parameters of the soil profile of the pile load test verification using the HS model.
Table 3.
The input parameters of the soil profile of the pile load test verification using the HS model.
| Parameters For Undrained A | Symbol | Unit | Soil Layers | |||||
|---|---|---|---|---|---|---|---|---|
| Fill | Medium Coarse Sand with a Trace of Shells | Soft Clay with a Trace of Shells | Clayey Silt/Clayey Sandy Silt | Medium Fine Silty Sand to Sand with a Trace of Silt | Crushed Calcareous Cemented Sand | |||
| Level | 0.0–4.0 | 4.0–6.30 | 6.30–11.0 | 11.0–13.5 | 13.5–16.0 | 16.0–35 | ||
| Saturated unit weight | kN/m3 | 19.0 | 19.0 | 19.0 | 19.0 | 19.0 | 19.0 | |
| Dry unit weight | kN/m3 | 16.0 | 16.0 | 14.0 | 16.0 | 16.0 | 15.5 | |
| Secant stiffness | kN/m2 | 600 | 45,000 | 1000 | 2500 | 30,000 | 56,000 | |
| Tangent stiffness | kN/m2 | 600 | 45,000 | 1000 | 2500 | 30,000 | 45,000 | |
| Unloading/reloading stiffness | kN/m2 | 1800 | 135,000 | 3000 | 7500 | 90,000 | 163,000 | |
| Power for a stress-level | m | - | 0.5 | 0.5 | 0.5 | 0.5 | 0.5 | 0.5 |
| Cohesion | kN/m2 | 0.0 | 0 | 20.0 | 20.0 | 15.0 | 0.0 | |
| Friction angle | - | 20 | 34 | 0 | 15 | 30 | 36 | |
| Dilatancy angle | - | 0 | 4.0 | 0 | 0 | 0 | 0 | |
| Poisson ratio | - | 0.3 | 0.2 | 0.3 | 0.3 | 0.2 | 0.2 | |
| Interface strength | - | 1.0 | 1.0 | 1.0 | 1.0 | 1.0 | 1.0 | |
Table 4.
The input parameters of soil for the oedometer test using the HS model.
| Parameters For Undrained A | Symbol | Unit | CS | CS + 10% BS | CS + 30% BS | CS + 50% BS |
|---|---|---|---|---|---|---|
| Saturated unit weight | kN/m3 | 19.0 | 19.0 | 19.0 | 19.0 | |
| Dry unit weight | kN/m3 | 17.0 | 17.0 | 17.0 | 17.0 | |
| Secant stiffness | kN/m2 | 37,900 | 22,000 | 17,200 | 16,500 | |
| Tangent stiffness | kN/m2 | 37,900 | 22,000 | 17,200 | 16,500 | |
| Unloading/reloading stiffness | kN/m2 | 113,900 | 66,000 | 51,600 | 49,500 | |
| Power for a stress-level | m | - | 0.6 | 0.65 | 0.6 | 0.5 |
| Cohesion | kN/m2 | 0.0 | 0 | 0 | 0 | |
| Friction angle | - | 30.5 | 32.4 | 33.4 | 34.6 | |
| Poisson ratio | - | 0.2 | 0.2 | 0.2 | 0.2 | |
| Interface strength | - | 0.7 | 0.7 | 0.7 | 0.7 |
Table 5.
The input parameters of the soil profile for the case study using the HS model.
| Parameters For Undrained A | Symbol | Unit | Calcareous Silty Sand | Calcareous Lean Clay | CS | CS + 10% BS | CS + 30% BS | CS + 50% BS |
|---|---|---|---|---|---|---|---|---|
| Level | 0–2.5 | 2.5–5.0 | 5.0–40 | 5.0–40 | 5.0–40 | 5.0–40 | ||
| Saturated unit weight | kN/m3 | 20.0 | 20.0 | 19.0 | 19.0 | 19.0 | 19.0 | |
| Dry unit weight | kN/m3 | 17.0 | 16.0 | 17.0 | 17.0 | 17.0 | 17.0 | |
| Secant stiffness | kN/m2 | 37,500 | 4200 | 37,900 | 22,000 | 17,200 | 16,500 | |
| Tangent stiffness | kN/m2 | 37,500 | 4200 | 37,900 | 22,000 | 17,200 | 16,500 | |
| Unloading/reloading stiffness | kN/m2 | 112,500 | 12,800 | 113,900 | 66,000 | 51,600 | 49,500 | |
| Power for a stress-level | m | - | 0.5 | 0.5 | 0.6 | 0.65 | 0.6 | 0.5 |
| Cohesion | kN/m2 | 0.0 | 40.0 | 0.0 | 0 | 0 | 0 | |
| Friction angle | - | 33.0 | 0 | 30.5 | 32.4 | 33.4 | 34.6 | |
| Poisson ratio | - | 0.2 | 0.2 | 0.2 | 0.2 | 0.2 | 0.2 | |
| Interface strength | - | 0.7 | 0.7 | 0.7 | 0.7 | 0.7 | 0.7 |
Publisher’s Note: MDPI stays neutral with regard to jurisdictional claims in published maps and institutional affiliations. |
© 2021 by the authors. Licensee MDPI, Basel, Switzerland. This article is an open access article distributed under the terms and conditions of the Creative Commons Attribution (CC BY) license (https://creativecommons.org/licenses/by/4.0/).
Share and Cite
MDPI and ACS Style
Salem, T.N.; Elkhawas, N.M.; Elnady, A.M. Behavior of Offshore Pile in Calcareous Sand—Case Study. J. Mar. Sci. Eng. 2021, 9, 839. https://doi.org/10.3390/jmse9080839
AMA Style
Salem TN, Elkhawas NM, Elnady AM. Behavior of Offshore Pile in Calcareous Sand—Case Study. Journal of Marine Science and Engineering. 2021; 9(8):839. https://doi.org/10.3390/jmse9080839
Chicago/Turabian StyleSalem, Tarek N., Nadia M. Elkhawas, and Ahmed M. Elnady. 2021. "Behavior of Offshore Pile in Calcareous Sand—Case Study" Journal of Marine Science and Engineering 9, no. 8: 839. https://doi.org/10.3390/jmse9080839
Note that from the first issue of 2016, this journal uses article numbers instead of page numbers. See further details here.