
The Efficiency of the Polish Zloty Exchange Rate Market: The Uncovered Interest Parity and Fractal Analysis Approaches


Department of Econometrics and Statistics, Institute of Economics and Finance, Warsaw University of Life Sciences-SGGW, Nowoursynowska 166, 02-787 Warsaw, Poland
*
Author to whom correspondence should be addressed.
Risks 2021, 9(8), 142; https://doi.org/10.3390/risks9080142
Submission received: 7 June 2021
/
Revised: 9 July 2021
/
Accepted: 22 July 2021
/
Published: 1 August 2021
(This article belongs to the Special Issue Quantitative Methods in Economics and Finance II)
Abstract
:The study of the effectiveness of the currency market is one of the most important research problems in the field of finance. The paper aims to assess the efficiency of the Polish zloty exchange rate market. We test the market efficiency by applying two independent approaches, one based on the Uncovered Interest Parity theory, and another based on the fractal analysis of exchange rates series. The research results show that the Uncovered Interest Parity holds only on the USD/PLN market. For EUR/PLN, JPY/PLN, CHF/PLN, MXN/PLN and TRY/PLN, the Uncovered Interest Parity hypothesis is rejected and implies the existence of the forward premium anomaly and market inefficiency. The estimated Hurst coefficient provides insight into the long-range dependence of exchange rates. The MXN/PLN, TRY/PLN and EUR/PLN exchange rates exhibit anti-persistent behaviours suggesting mean-reverting characteristics. For JPY/PLN and CHF/PLN, a high value of the Hurst exponent indicates long memory in the time series. Only for USD/PLN, we achieve the Hurst exponent closest to 0.5, which implies market efficiency. The research results obtained based on the UIP hypothesis and fractal analysis are consistent. The study reveals that the market efficiency hypothesis holds only for the most tradable Polish zloty currency pair, i.e., USD/PLN.
1. Introduction
The Efficient Market Hypothesis assumes that all information available to market participants is immediately reflected in the financial market’s assets’ prices. Fama (1970, 1965) distinguishes three forms of market efficiency. The weak form of market efficiency assumes that current prices reflect all information contained in historical prices. The semi-strong states that current prices reflect all publicly available information, and also information included in historical prices. The strong form of market efficiency assumes that current prices reflect both private and public information.
The term efficiency describes the market in which prices impound relevant information available to market participants. The foreign exchange market is assumed to be efficient when the simple assumption of zero expected profits holds. The well-known parity condition for testing currency market efficiency is represented by the Uncovered Interest Parity (UIP) (Sarno 2005). The failure of UIP implies the opportunity to generate excess returns. The UIP assumes that the expected exchange rate return equals the interest rate differential or the so-called forward premium, i.e., the difference between the forward and spot exchange rates. The rejection of the UIP constitutes one of the most well-known anomalies in the theory of international finance. The phenomenon is called a forward premium bias or forward premium puzzle. There is extensive evidence supporting the rejection of the Uncovered Interest Parity hypothesis (Fama 1984; Froot and Frankel 1989; McCallum 1994; Zhou and Kutan 2005; Clarida et al. 2009). There are many econometric methods used to study the UIP in the currency market. In the literature concerning currency market efficiency and the Uncovered Interest Parity, very often the verification of the UIP hypothesis begins with a simple linear OLS model (Chaboud and Wright 2005; Lothian and Wu 2011), then more advanced methods are used, including GARCH models (e.g., Tai 2001; Karahan and Çolak 2012; Li et al. 2012), smooth transition models (Baillie and Kiliç 2006; Baillie and Chang 2011; Cho 2018) or switching models (Beyaert et al. 2007; Ichiue and Koyama 2011). In the paper, we test the UIP hypothesis and thus the efficiency of the currency market using GARCH models. These models are often used in analysing the financial market (Malliaropulos 1997; Tabasi et al. 2019; Xiao et al. 2020), including their effectiveness (Lean and Smyth 2015; Narayan et al. 2016).
Some researchers claim that the rejection of the UIP hypothesis should not be equalled with the rejection of the currency market efficiency hypothesis. According to Nguyen (2000), holding the UIP is sufficient but not a necessary condition for the currency market’s efficiency. He believes that the forward premium puzzle in the foreign exchange market does not necessarily mean that the market is inefficient. Olmo and Pilbeam (2011) show that the UIP is neither sufficient nor necessary for the currency market’s efficiency. Moreover, in their opinion, the foreign exchange market may be effective even when the UIP does not hold. They believe that the appropriate test of the currency market efficiency should be based on the analysis of the rates of return obtained from various currency investment strategies. However, it should be emphasised that UIP is also associated with the possibility of generating abnormal excess rates of return (Czech 2020). Thus, testing the UIP hypothesis seems to be the correct method of testing the Efficient Market Hypothesis (EMH).
The paper also tests the EMH based on the fractal approach linked to stochastic and deterministic properties of the system generating exchange rate changes. Using, among others, the Generalised Hurst Exponent, we examine the Fractal Market Hypothesis (FMH). The FMH is a reasonable generalisation of the standard Efficient Market Hypothesis (Peters 1994). The fractal and non-linear analysis tools in the currency market are employed by Liu et al. (1994). In their study, four currency futures exhibited both short-term and long-term dependence. Fang et al. (1994) and Evertsz (1995) also find statistically significant evidence of selected exchange rates’ fractal structure. van de Gucht et al. (1996) show that, for analysed currencies, the long-run behaviour deviated from that of a pure random walk in certain periods. Galluccio et al. (1997) state that the Hurst exponent for foreign exchange rates for the U.S. dollar, the German mark and the Japanese yen are not significantly different from 0.5, but that the underlying system is not independent as autocorrelation exists. Corazza and Malliaris (2002) reveal that a Hurst exponent is significantly different from 0.5. Furthermore, they show that the Hurst exponent is not fixed over time series. Rather unexpected results are uncovered by Kristoufek and Vosvrda (2016). They show that the gold prices quoted in the most liquid currencies belong to the least efficient ones. However, smaller and less traded currencies seem to be the most efficient. They state that rather unexpected results might result from a unique study period, i.e., from 2011 to 2014.
Another method applied to test the EMH related to exchange rate non-linearity analysis is the Brock–Dechert–Scheinkman (BDS). Han et al. (2020) emphasise that currency market inefficiency is closely related to the non-linearity of the foreign exchange rate series. Lei and Pan (2012) present some empirical evidence on non-linearity in exchange rates of six emerging markets, which means that the properties of foreign exchange markets do not comply with the requirements of the random walk hypothesis. Serletis and Gogas (1997) present a non-linear dynamical study for seven East European currencies. Using the BDS statistics, they reject the null hypothesis of independent and identically distributed residuals from an Autoregressive (A.R.) process. Chiarella et al. (1994) find significant forms of non-linear behaviour for most realisations of exchange rate series. However, they show that the level of significance and type of non-linearity may vary. Hsieh (1989) also shows that daily exchange rate changes are not independent of past changes. Similarly, Mammadli (2017) rejects the presence of chaos and finds sufficient evidence for non-linearity in the Turkish foreign exchange market.
The paper aims to assess the efficiency of the Polish zloty exchange rate market. Our contribution is to test the market efficiency by applying two approaches, one based on the Uncovered Interest Parity theory, and another based on the non-linear dynamics of exchange rates series. We aim to combine the classic and modern econometric methods in the study. The applicate Hurst exponent is generally used to depict the degree of market efficiency. In this context, this method is useful because the Hurst coefficient allows the description of the properties of currency markets’ characteristics, which can be helpful for investors in choosing their individual strategies. In our opinion, this approach can be treated as a complement to the classical approach to test currency market efficiency, i.e., based on the Uncovered Interest Parity. To our knowledge, there is no such study that tests foreign exchange market efficiency, especially emerging market currency such as Polish zloty, by combining two independent approaches.
2. Methodology
The paper aims to assess the efficiency of the Polish zloty exchange rate market. The study is conducted based on six appropriately chosen spot daily and monthly exchange rates related to Polish zloty. In the analysed exchange rates, the Polish zloty is a quote currency, while the U.S. dollar (USD), the euro (EUR), the Japanese yen (JPY), the Swiss franc (CHF), the Mexican peso (MXN) and the Turkish lira (TRY) are base currencies. The selected currencies represent the most tradable currencies (USD, EUR), low-yielding currencies of developed countries (JPY, CHF) and high-yielding currencies of emerging economies (MXN, TRY) (BIS 2019). The efficiency of the Polish zloty foreign exchange market is tested by applying two different approaches. One approach is related to Uncovered Interest Parity theory, and another one to fractal and non-linear analysis. The UIP is tested based on the analysed countries’ monthly spot exchange rates and monthly interbank interest rates. The fractal and non-linear analyses are conducted for daily spot exchange rates. Exchange rates series data come from the Refinitiv Datastream and covers the period from June 2004 till February 2021, i.e., from Poland’s accession to the European Union to the last available data. Monthly interbank interest rates data come from the Refinitiv Datastream and cover the period from June 2004 till February 2021 for all countries apart from Turkey, for which the series starts in July 2006.
The Uncovered Interest Parity (UIP) constitutes a fundamental condition applied to test foreign exchange market efficiency. The UIP assumes that the interest rate differential equals the expected change in the exchange rate (Isard 2006):
where the logarithm of the spot exchange rate at time t, is the logarithm of expected spot exchange rate at time , based on information known at time , and are interest rates in quote and base currency countries, respectively. Testing of the UIP hypothesis often requires the assumption of rational expectations. According to the assumption of rational expectations, the spot exchange rate at time () equals the expected spot exchange rate plus a white-noise error term which is uncorrelated with information available at time () (Isard 2006).
The fundamental regression model used to test UIP is as follows (Isard 2006):
where and are the model’s coefficients and is an error term uncorrelated with information available at time . Under the UIP condition, the slope coefficient is equal to unity ( = 1) and the intercept coefficient to zero ( = 0).
In the paper, we apply Generalised Autoregressive Conditional Heteroscedasticity (GARCH) models to test the UIP hypothesis, i.e., test the efficiency of the foreign exchange market. Developed by Engle (1982) and Bollerslev (1990), GARCH models are applied to model the time-varying volatility structure of financial markets’ prices. In the paper, we apply GARCH(,) and asymmetric TGARCH(,), depending on the properties of analysed time series. The TGARCH model was created independently by Zakoian (1994) and Glosten et al. (1993). The fundamental goal of the TGARCH model is to include the asymmetries by adding into a variance equation a multiplicative dummy variable which allows checking whether there is a significant difference when shocks are positive or negative. The only difference in the TGARCH models introduced by Zakoian (1994) and Glosten et al. (1993) is that the first one analyses the effect of bad and good news on conditional standard deviation, while the other is on conditional variance. This paper applies the asymmetric TGARCH model developed by Glosten et al. (1993). Hamilton (1994) stresses that the financial time series’ unconditional distribution has fatter tails than the Gaussian distribution. In the applied GARCH models, we use Generalised Error Distribution (GED) to capture the fat tails of the conditional distribution. The GARCH(,) model used in the study to test the UIP hypothesis is described as follows:
where is the error term, is the conditional variance, are the model coefficients and is the Generalised Error Distribution parameter.
When asymmetry effects characterise the exchange rate returns series, i.e., when negative shocks (negative innovations) contribute to an increase in volatility more than positive innovations, we apply the threshold GARCH model (5).
where represents the asymmetry term coefficient.
The fractal analysis is conducted based on the Hurst exponent. To our knowledge, this is one of the first currency market studies that applies the STL (Seasonal-Trend decomposition using Loess) procedure to decompose time series before computing the Hurst exponent. For this reason, this method is described in more detail. In the first step, we decompose the foreign exchange returns time series using STL decomposition based on the Loess smoother (Cleveland et al. 1990). After decomposition, we achieve three elements, i.e., deterministic trends (), seasonal components () and stochastic remainder components () (Laib et al. 2018):
where
The STL method comprehends two procedures, i.e., an inner loop and an outer loop. In general, the STL decomposition procedure is iterative and consists of alternating estimation of the trend and the seasonal component (Laib et al. 2018). We apply the R stats packages to compute the remainder components (for more details see Cleveland et al. (1990)). Since we are interested in a robust investigation of the time dependence in exchange rates returns series, the stochastic component constitutes the most important one. Thus, we calculated the Hurst exponent for the remainders. Removing the seasonal components enhances the reliability of the results.
The STL procedure seems to be superior to other time series decomposition methods (e.g., TRAMO/SEATS and X11). Firstly, the procedure can be applied to any type of seasonality. Second, this method allows for the changing of seasonal components over time. Additionally, we can specify some unique characteristics of time series, such as the rate of change in the seasonal element or the smoothness of the trend cycle. Last but not least, the method is more robust when there are outliers in the time series (Miloş et al. 2020).
The Hurst exponent for one-dimensional time series can be determined in a few methods, i.e., long-range analysis method (R/S), Detrended Moving Average (DMA), Detrended Fluctuation Analysis (DFA), Generalised Hurst Exponent (GHE) or multidimensional, Multifractal Detrended Fluctuation Analysis (MF-DFA) and Wavelet Transform Module Maxima (WTMM). The Multifractal Detrended Fluctuation Analysis (MF-DFA) is a robust method, which was developed by Kantelhardt et al. (2002) and is the effective procedure for detecting multifractality (Laib et al. 2018). MF-DFA generalises the Detrended Fluctuation Analysis (DFA) method, which is applied to determine mono-fractal scaling properties. Furthermore, the MF-DFA method can be applied to non-stationary time series (Kantelhardt et al. 2002). In the literature, we can find the successful application of the MF-DFA method to prove the multifractal behaviour of financial time series of both developed and emerging markets. In the paper, we apply the MF-DFA method to calculate the Generalised Hurst Exponent and to investigate the fractal properties of the Polish zloty exchange rates. The standard MF-DFA procedure consists of five steps, the first three related to the DFA method. The analysis’ main steps and general formulas are described below (Laib et al. 2018).
Step 1: Let for be a time series of logarithmic returns, where indicates series length. The first step of the MF-DFA is to construct the “profile” (random walk), , by integration (cumulative increments) after subtracting from the time series, its average, :
Step 2: The second step of the procedure is the profile is subdivided into non-overlapping sub-periods with length equal to . Because in some cases the length of the vector may not be an integer multiple of , we repeat the division into Nτ segments starting at the end of the series to obtain a total of segments.
Step 3: In each of the obtained segments, we subtract the trend determined by the fitting of the polynomial of the degree by the least-squares procedure and calculate the variance of the obtained fluctuations using the following formula:
For and
Step 4: We calculate the -th moment of each fluctuation and average thus obtained values according to the formula:
For
Steps 2–4 must be repeated for different values of time scales , to determine the behaviour of the dependent fluctuation functions , for various , which is included in the last step.
Step 5: We determine the scaling exponent of the fluctuation function for various :
The exponent is the so-called Generalised Hurst Exponent and is applied to measure market efficiency. The Hurst exponent in the range suggests the existence of a positive autocorrelation, i.e., a persistent behaviour of time series. It indicates that the process is characterised by long memory effects (for the various time scale), data are fractal and the Efficient Market Hypothesis is not confirmed. The Hurst exponent in the range implies negative autocorrelation, i.e., an anti-persistent behaviour. It means that returns are negatively autocorrelated and are characterised by frequent direction changes. In such a situation, the Efficient Market Hypothesis is not confirmed, and investments are riskier. The Hurst exponent equal to 0.5 means that the returns are uncorrelated, the data are random and financial market prices seem to follow a random Brownian motion. It implies that the Efficient Market Hypothesis cannot be rejected, and the analysed financial market is effective (Peters 1994).
3. Results
The Efficient Market Hypothesis was verified based on both the Uncovered Interest Parity approach and fractal analysis approach. The UIP was tested based on the analysed countries’ monthly spot exchange rates and monthly interbank interest rates. In the GARCH(,) model (4 and 5), the dependent variable was the Polish zloty exchange rates returns (), while the independent variable was the interest rates differential ( in analysed countries. The analysis was conducted for six Polish zloty exchange rates, i.e., USD/PLN, EUR/PLN, JPY/PLN, CHF/PLN, TRY/PLN and MXN/PLN, where the U.S. dollar (USD), the euro (EUR), the Japanese yen (JPY), the Swiss franc (CHF), the Mexican peso (MXN) and the Turkish lira (TRY) were base currencies, and the Polish zloty (PLN) was a quote currency. The Polish zloty exchange rates return series and interest rates differential series were tested for stationarity. The stationarity was checked based on the Augmented Dickey–Fuller (ADF) test (Dickey and Fuller 1979) and the Kwiatkowski, Phillips, Schmidt and Shin test (KPSS) (Kwiatkowski et al. 1992). Table 1 presents estimated t-statistics of the ADF unit root test and the Kwiatkowski–Phillips–Schmidt–Shin test statistics of the KPSS stationarity test. The results are presented for exchange rates return series and interest rates differential series for six selected currency pairs. Columns in Table 1 contain only the abbreviation of the base currency in the analysed exchange rates.
The ADF and KPSS tests show that the exchange rate returns series are stationary for all six Polish zloty exchange rates. However, both tests confirm the non-stationarity of the interest rate differential. According to Goh et al. (2006) and Li et al. (2012), this non-stationarity may result from capital control in the money market or some changes in the structure of interest rates series. Li et al. (2012) show that tests that consider structural changes, e.g., the Zivot and Andrews test (Zivot and Andrews 2002), indicate that the time series of interest rates are stationary. Cerrato et al. (2013) also prove the stationarity of interest rates time series. The Zivot and Andrews test results in Table 1 confirm the stationarity of the analysed interest rates differential series.
The orders and in the GARCH(,) model (4) were selected based on the Akaike Information Criterion (AIC) (Akaike 1976) and the significance of variance equations coefficients. Additionally, when the exchange rate returns series were characterised by asymmetry effects, we applied the threshold GARCH(,) model (5). We chose the GARCH(2,2) model for the USD/PLN exchange rate, GARCH(1,1) for EUR/PLN, GARCH(1,1) for JPY/PLN, TGARCH(1,1) for CHF/PLN, GARCH(2,2) for MXN/PLN and ARCH(1) for TRY/PLN. The models were estimated based on the maximum likelihood method using Marquardt’s algorithm (Marquardt 1963). The results of estimated GARCH models are presented in Table 2.
We apply the Wald test to verify the UIP hypothesis in the Polish exchange rate market. The null hypothesis states that slope coefficient equals unity () and the intercept coefficient to zero (). The results presented in Table 1 show that for all analysed exchange rates, apart from USD/PLN, the null hypothesis is rejected at a 5% significance level. We cannot reject the hypothesis that UIP holds for U.S. dollars to Polish zloty exchange rates. Moreover, the estimated slope coefficients are negative for EUR/PLN, JPY/PLN, CHF/PLN, MXN/PLN and TRY/PLN and positive for USD/PLN. According to the UIP theory, the relationship between exchange rate return and interest rate differential should be positive. Thus, the positive value of coefficient for the USD/PLN market is also consistent with the UIP theory. It implies that only the USD/PLN market, characterised by the highest liquidity, is efficient. As far as other analysed exchange rates are concerned, the UIP does not hold. This may suggest that the foreign exchange markets with the highest transaction volume are the most efficient. Shahzad et al. (2018) reveal that trading volume impacts the currency market efficiency levels. Kitamura (2017) shows that high liquidity enhances currency market efficiency. He claims that a foreign exchange liquid market strengthens competition among traders and the speed of price discovery.
The fractal and non-linear analysis is conducted for daily spot exchange rates. Daily data stationarity is verified based on the ADF unit root test and the KPSS stationarity test (Table 3). ADF test statistics and corresponding critical values suggest the rejection of the hypothesis of a unit root in exchange rate returns series (at the significance level 0.05). Only for the TRY/PLN exchange rate, the ADF test shows the series are non-stationary. The results of the KPSS test suggest that all analysed time series are stationary.
We reject the hypothesis of no serial correlation in the analysed time series (Table 3). Moreover, based on the results of the McLeod–Li test, we reject the hypothesis of homoscedasticity in the square returns of Polish zloty exchange rates. The Engle’s ARCH test’s results also imply the occurrence of heteroscedasticity (Table 4). The results presented in Table 3 and Table 4 suggest the existence of a non-linear relationship in both Polish zloty exchange rates returns and square of returns.
Before detecting time dependence, we test the exchange rate returns series for the presence of non-linearity. We use a test proposed by Theiler et al. (1992), in which the null hypothesis assumes that a linear (Gaussian) process generates the time series. Firstly, we apply different algorithms, e.g., Fourier transformation, to generate surrogate data sets that match the null hypothesis. Then, we compute statistical discrimination for the original and each surrogate data set. The non-linearity is detected when the original data estimated value is significantly different from the surrogate data computed values (Theiler et al. 1992). Table 3 and Table 4 show that the null hypothesis is rejected for mean and variance. The statistic for the original data set significantly differs from the statistics for each of the surrogate sets.
The Terasvirta and the White tests do not provide clear results, particularly for USD/PLN and JPY/PLN exchange rates. Thus, we apply a more robust test proposed by Broock et al. (1996) to test for non-linearity in residuals (after application of the best fit ARMA model). The obtained results imply the rejection of the hypothesis that the time series is independently and identically distributed. The results are consistent for all applied embedding dimensions, i.e., and all epsilon values for close points (Table 3). Furthermore, to enhance the robustness of research results, we calculate the BDS statistics also for shuffled residuals, which allow us to remove any non-linear dependence in the residuals time series (Pietrych et al. 2021). For all analysed Polish zloty exchange rate returns series, time dependence disappears in the shuffled time series residuals.
Subsequently, the squared residuals from the fitted GARCH models are tested for any leftover non-linear structure using the BDS test again. According to the results presented in Table 4, the BDS test implies the rejection of the null hypothesis that the squared residuals are an independent and identically distributed process. It confirms that the GARCH process does not capture all the non-linearity in the series of square exchange rates returns. Similar to the results presented in Table 3, the BDS test for shuffled square standardised residuals, and for the original time series residuals, reveals robust evidence of non-linear dependence in the variance.
Finally, we apply the MF-DFA method to the remaining components of the exchange rates return time series. We use the mfdfa library for R (Laib et al. 2017). We adopt the first-degree detrending polynomial () because the STL decomposition already isolates the time trend component. We assume that time scales range from 10 to days (where is the number of observations in the analysed time series). For stationary time series, the Hurst exponent is calculated by setting for the scaling exponent (Generalised Hurst Exponent). Table 5 summarises the calculated Hurst exponents for the six analysed Polish zloty exchange rates. The results reveal a positive autocorrelation behaviour for two exchange rates, i.e., JPY/PLN and CHF/PLN (a consistent behaviour). It suggests that an exchange rate increase (decrease) in the previous period would be followed by an increase (decrease) in the subsequent period. The other three exchange rates, i.e., EUR/PLN, MXN/PLN and TRY/PLN, are characterised by a negative autocorrelation. It implies that an increase (decrease) in the previous period would be followed by a decrease (increase) in the subsequent period. For USD/PLN, the Hurst exponent is close to 0.5. It means the data are random, and the EMH cannot be rejected.
Similarly to the BDS test procedure, we calculate the Hurst exponent also for the shuffled time series in order to remove long-range correlations in the data. For the time series after the shuffle, the Hurst exponent is almost equal to 0.5 (Table 5). Evidence for long-range dependence in the variance is also clear.
The results should be interpreted with a disclaimer that the long memory characteristics of the time series change with the length of time period used (Šonje et al. 2011). Furthermore, the Hurst exponent can change over time. To take into account possible changes, we apply the BDS recursive test. The analysis of Polish zloty exchange rates in the years 2004–2020 shows that there were large fluctuations in this period, caused by, e.g., exogenous factors. As a consequence, currency returns may have different properties in different subperiods (Appendix A). To check whether there were any possible changes of dynamics in systems generating time series in the period under study, BDS test statistics are calculated. This test is sensitive to non-stationarities due to potential shifts in the unconditional variance over time. The BDS is calculated starting from the 100 observation data set and adding 300 observations to analysed observations (Díaz et al. 2002).
Figures presented in Appendix B show the evolution of the BDS test statistics values. First of all, the BDS value has been steadily increasing during the analysed period for almost all studied Polish zloty exchange rates. For exchange rates USD/PLN, JPY/PLN and CHF/PLN, we can see a common point around September 2008. In this case, the BDS value increased after that date. Therefore, it can be assumed that in September 2008 there was a change in the dynamics of exchange rates returns. Finally, we calculate the Hurst exponent once again for the subperiod, ranging from the end of the crisis, i.e., from 01.01.2010. For this case, we obtain similar results, but the exponent is closer to 0.5. It implies that after the global financial crisis of 2008–2009, the foreign exchange market is less inefficient (Table 5).
The changes in foreign exchange market efficiency over time may be driven by the investors’ herd behaviours, especially in times of crisis or concerns about certain economic foundations’ stability. The study on UIP and currency market efficiency reveals that market efficiency changes over time and UIP works systematically better in the time of crisis (Flood and Rose 2002; Clarida et al. 2009; Cho et al. 2019; Czech 2020). Current research directions underline that the fractals models can, with success, explore the effects for the price of financial assets caused by some exogenous shocks, such as crisis or disease. Moreover, this approach can be useful to understand the psychological aspects of investment behaviours (Aslam et al. 2020).
4. Discussion
The research results indicate that the Uncovered Interest Parity holds only in the USD/PLN market. For the remaining analysed exchange rates, the UIP hypothesis was rejected, indicating the so-called forward premium anomaly and market inefficiency. The research results are in line with the vast majority of published studies that imply the rejection of the Uncovered Interest Parity hypothesis (Fama 1984; Froot and Frankel 1989; McCallum 1994; Zhou and Kutan 2005; Clarida et al. 2009.)
The study results obtained based on the non-linearity and long memory analysis are in line with the previous studies. Most studies show that the foreign exchange market is characterised by non-linearity and long memory. Gould et al. (2015) find strong evidence of long memory, with a Hurst exponent of H > 0.5, for each of the three currency pairs (EUR/USD, GBP/USD and EUR/GBP). Han et al. (2019) show that long-range correlations cause multifractal properties for four currencies (EUR, GBP, CAD and JPY). Similar results are achieved (Shahzad et al. 2018) by employing high frequency (5 min interval) data spanning. They found evidence of higher efficiency levels in the JPY and CHF currency markets. The GBP currency appears to be the least efficient, followed by the EUR. However, it should be emphasised that the above-mentioned studies analyse the markets of the most tradable currencies. Our study refers to the emerging-market currency such as the Polish zloty.
Some authors point out the existence of structural changes in the forward premium persistence (Cho and Chun 2019). They reveal the existence of three to four structural breaks over the analysed 30-year period and find evidence of long memory in sub regimes. They show that break dates are related mainly to such disturbances as macroeconomic shocks or changes in monetary policy. Our research partially takes this aspect into account by dividing the time series into two periods before and after the global financial crisis of 2008–2009. We are the first to use the BDS recursive test for this purpose. A similar approach, including few periods, was also applied by Han et al. (2020).
To sum up, the study reveals that the market efficiency hypothesis holds only in the USD/PLN market. The U.S. dollar market is the most liquid one (BIS 2019). This suggests that the foreign exchange markets with the highest transaction volumes are the most efficient, which is in line with the study results of Kitamura (2017) and Shahzad et al. (2018).
Nguyen (2000) and Olmo and Pilbeam (2011) claim that the rejection of the UIP hypothesis does not necessarily mean the rejection of the market efficiency hypothesis. In their opinion, the foreign exchange market may be efficient even when the UIP does not hold. We show that the study results obtained based on both the UIP hypothesis and the fractal analysis are consistent. It may imply that the UIP hypothesis constitutes a proper method for testing the foreign exchange market hypothesis. However, we believe that examining the market efficiency should be based on various methods, which enhances the research robustness.
5. Conclusions
The Uncovered Interest Parity constitutes an important parity condition for testing foreign exchange market efficiency. The article verifies the UIP for six selected Polish zloty exchange rates. The research results show that the UIP holds only in the U.S. dollar to the Polish zloty foreign exchange market. For EUR/PLN, JPY/PLN, CHF/PLN, MXN/PLN and TRY/PLN exchange rates, the estimated slope coefficients in the UIP equation are negative and significantly different than one which is opposite to UIP theory and thus implies market inefficiency.
Additionally, we test the effectiveness of the Polish currency market based on fractal analysis. The paper studies Polish zloty exchange rate market efficiency using the MF-DFA method and estimated Hurst coefficient ) to investigate long memory in the analysed exchange rates. Our results can be helpful for investors in choosing investment strategies. MXN/PLN, TRY/PLN and EUR/PLN exchange rates exhibit anti-persistent behaviours suggesting mean-reverting characteristics. This may suggest that the higher value of the financial asset observed in previous periods may decline in subsequent periods. For JPY/PLN and CHF/PLN, the value of the Hurst exponent in the range between 0.5 and 1 indicates the existence of long memory in the process. It means that the future exchange rate depends (to a certain extent) on its values from previous periods. Only for USD/PLN, we achieve the Hurst exponent closest to 0.5, which implies that this market is the most efficient.
The research results obtained based on the UIP hypothesis and fractal analysis are consistent. The study reveals that the market efficiency hypothesis holds only in the USD/PLN market. This may suggest that the foreign exchange markets with the highest transaction volume are the most efficient.
The application of a Hurst exponent to seeking evidence of informational efficiency offers an alternative to traditional econometric methods. However, our results should be interpreted with caution because the long memory character of financial time series (including foreign exchange rates) changes with the length of time period used (Šonje et al. 2011). It constitutes a challenge for our future research. The application of a Hurst exponent with different window lengths may allow us to assess the evolution of the long memory for exchange rates and, finally, answer which of the exchange rates have become more or less efficient over time.
Our results could be important for policymakers as their main goal is to ensure financial markets’ sustainable growth and individual investors as they search for market inefficiencies to implement suitable market strategies that allow them to generate extraordinary profits. Further research could also focus on the source of market inefficiency and the possible policies that could contribute to markets’ development. Some authors claim the market inefficiency is even more important than the problem of market efficiency. It is, however, a broader research problem, and it constitutes a challenge for our future research.
Author Contributions
Conceptualisation, K.C. and Ł.P.; methodology, K.C. and Ł.P.; software, K.C. and Ł.P.; validation, K.C. and Ł.P.; formal analysis, K.C. and Ł.P.; investigation, K.C. and Ł.P.; resources, K.C. and Ł.P.; data curation, K.C. and Ł.P.; writing—original draft preparation, K.C. and Ł.P.; writing—review and editing, K.C. and Ł.P.; visualisation, K.C. and Ł.P.; supervision, K.C. and Ł.P.; project administration, K.C.; funding acquisition, K.C. and Ł.P. All authors have read and agreed to the published version of the manuscript.
Funding
This research received no external funding.
Institutional Review Board Statement
Not applicable.
Informed Consent Statement
Not applicable.
Data Availability Statement
Not applicable.
Conflicts of Interest
The authors declare no conflict of interest.
Appendix A
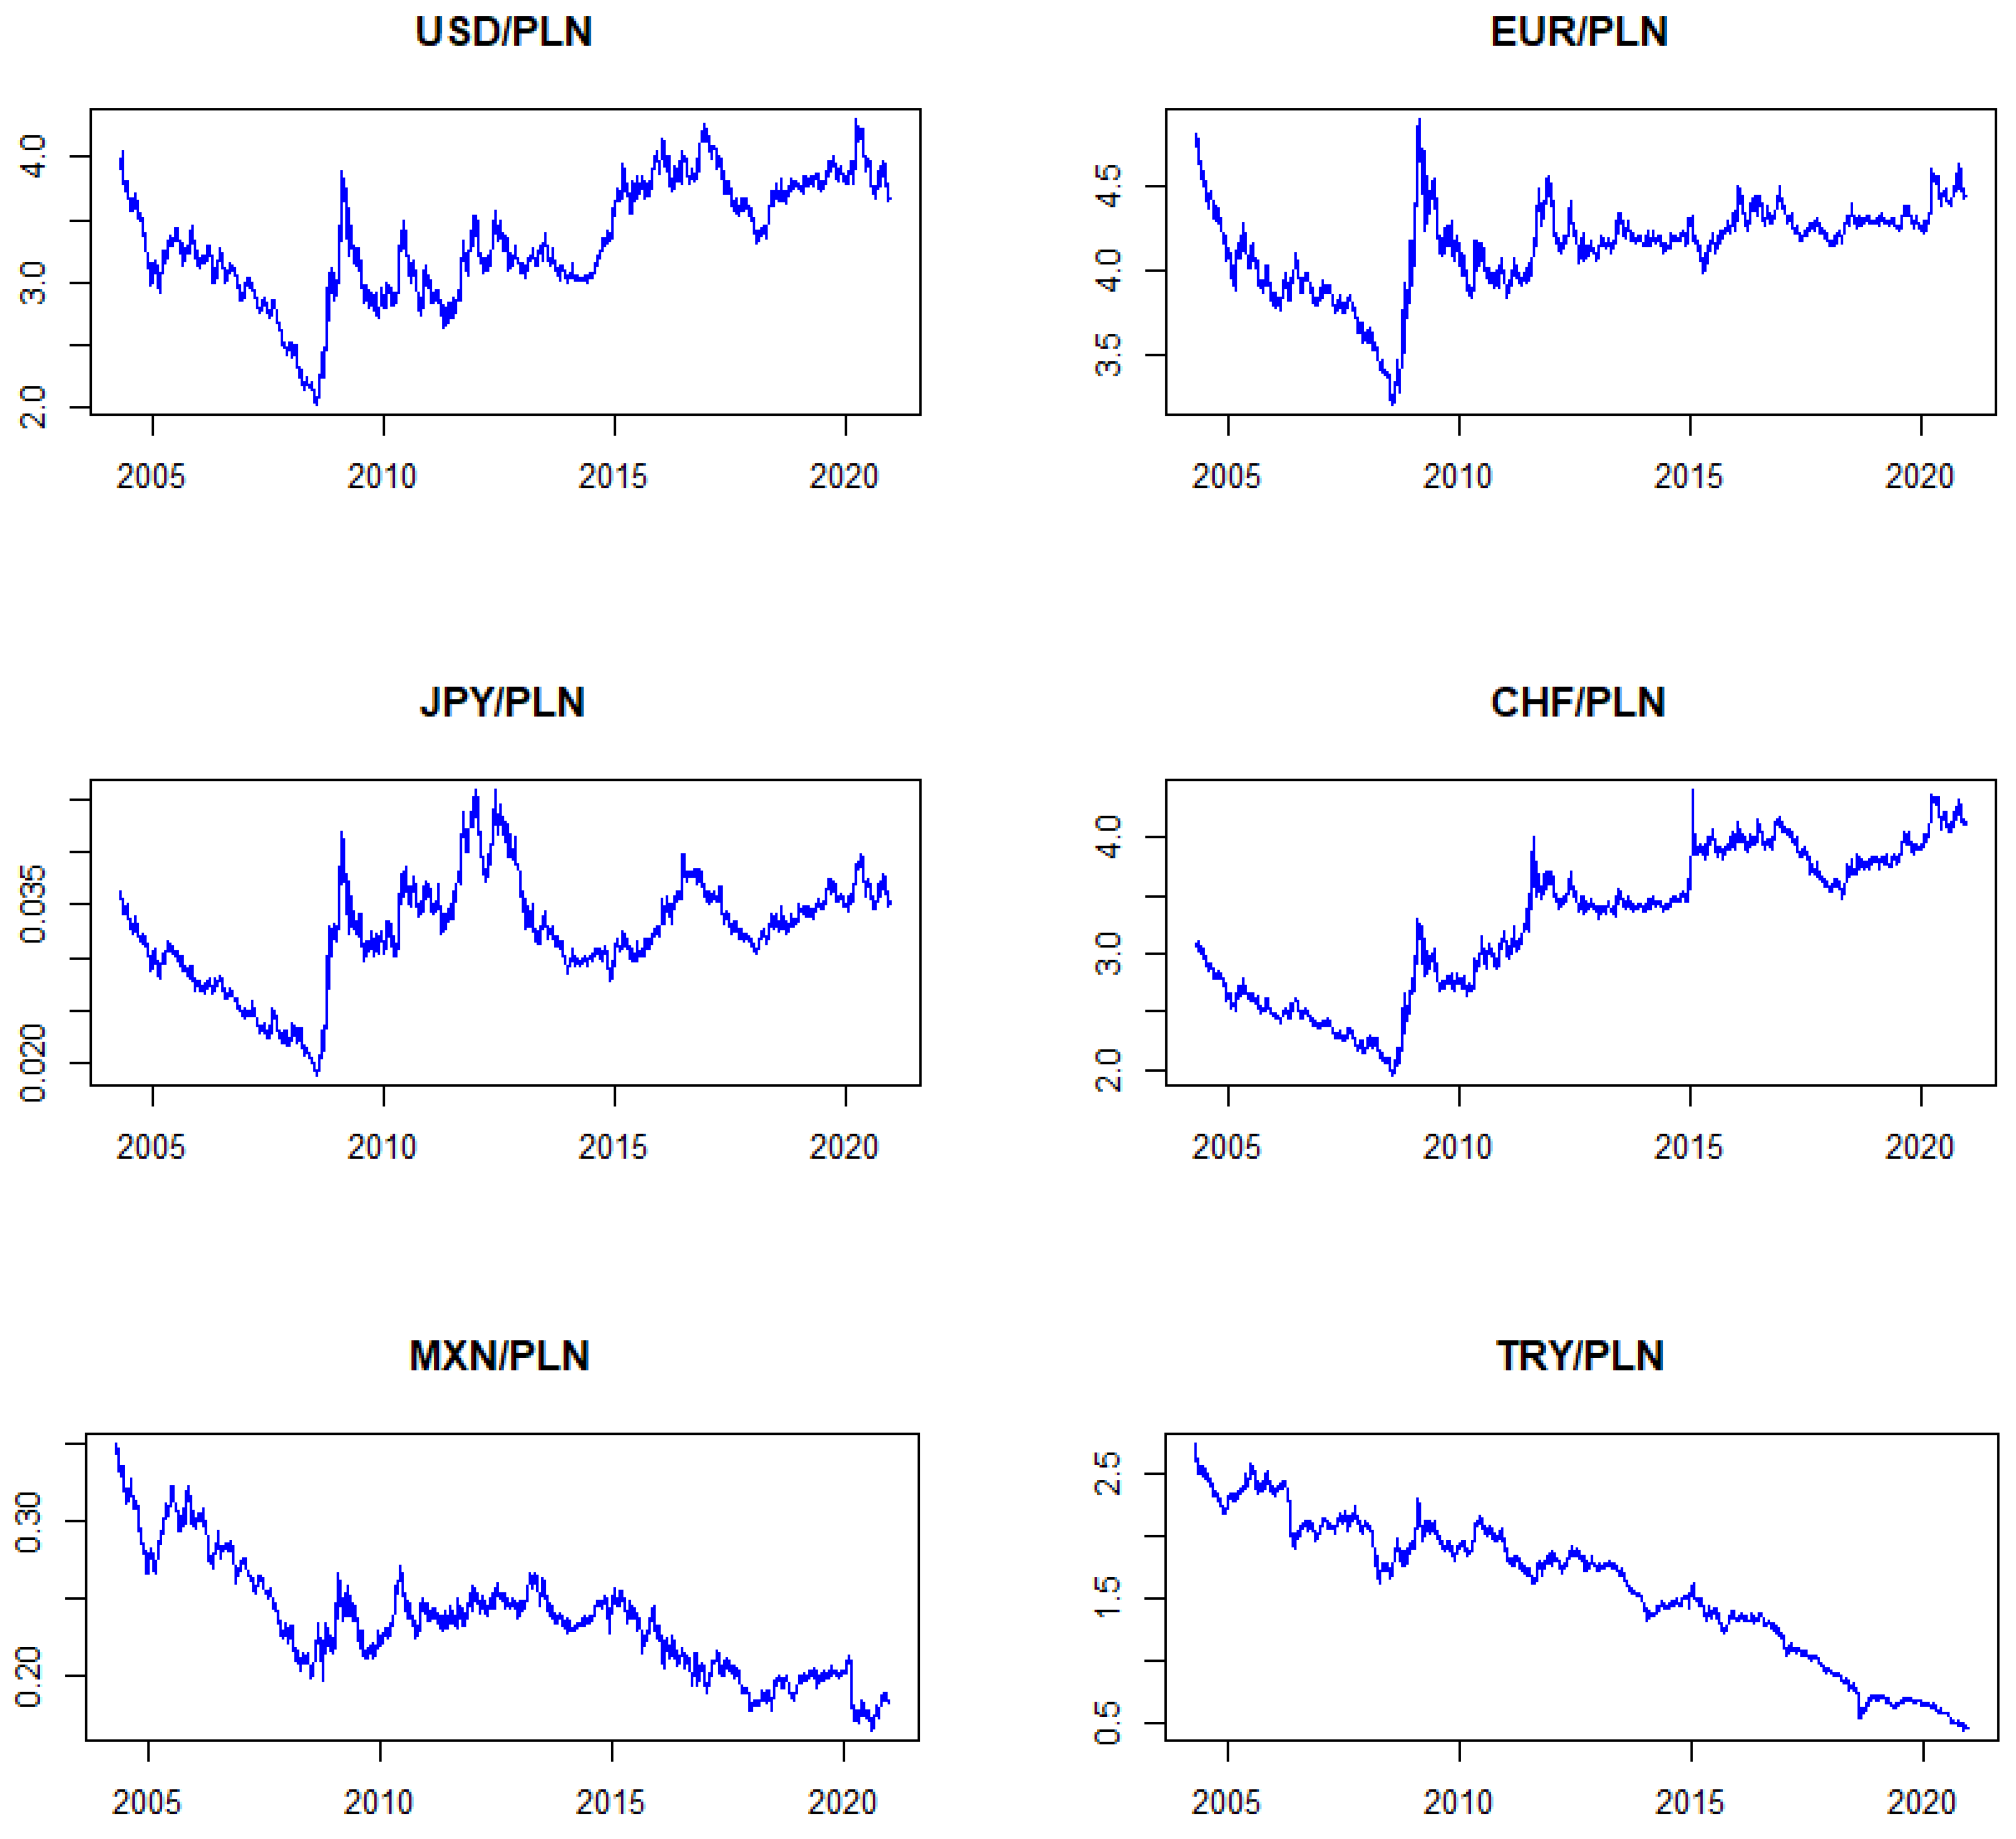
Figure A1.
The Polish zloty exchange rates in the period from June 2004 till February 2021.

Appendix B
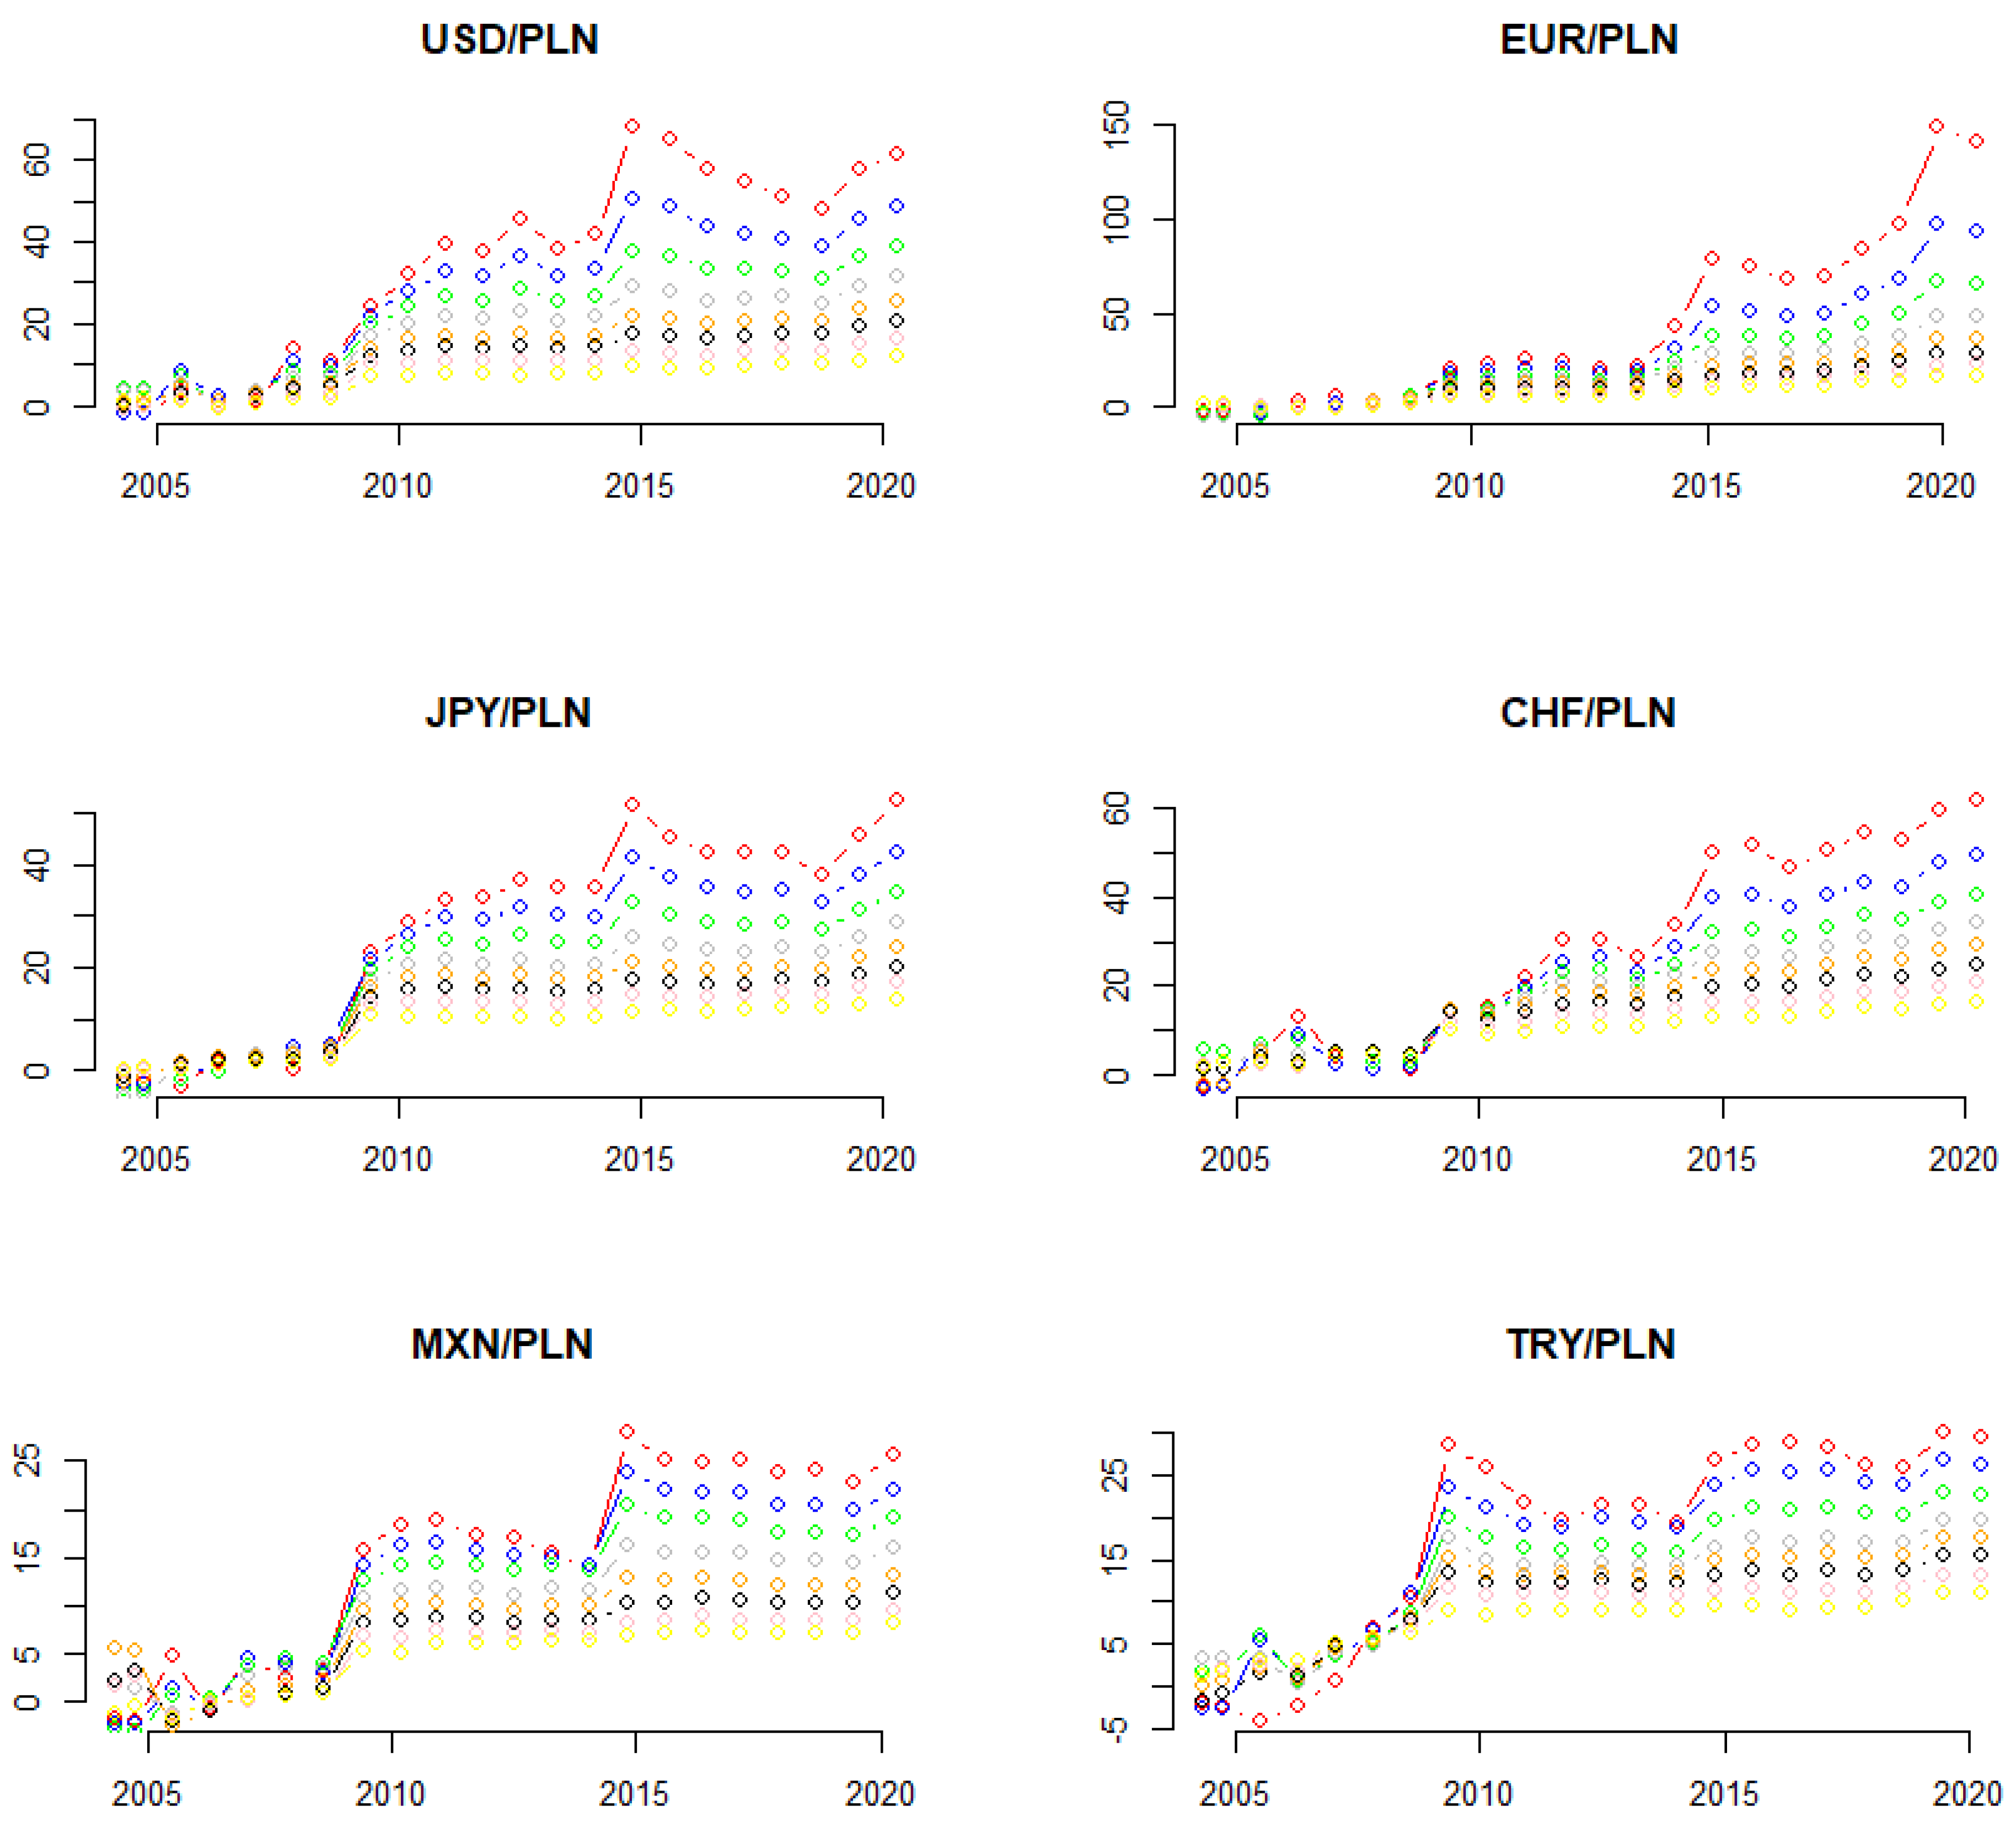
Figure A2.
BDS test results (for various embedding dimension: from m = 2 (bottom yellow line) to m = 9 (upper red line)).
Figure A2.
BDS test results (for various embedding dimension: from m = 2 (bottom yellow line) to m = 9 (upper red line)).

References
- Akaike, Hirotugu. 1976. Canonical Correlation Analysis of Time Series and the Use of an Information Criterio. In Mathematics in Science and Engineering. Amsterdam: Elsevier, pp. 27–96. [Google Scholar] [CrossRef]
- Aslam, Faheem, Saqib Aziz, Duc Khuong Nguyen, Khurrum Mughal, and Maaz Khan. 2020. On the efficiency of foreign exchange markets in times of the COVID-19 pandemic. Technological Forecasting and Social Change 161: 120261. [Google Scholar] [CrossRef] [PubMed]
- Baillie, Richard, and Sanders Chang. 2011. Carry trades, momentum trading and the forward premium anomaly. Journal of Financial Markets 14: 441–64. [Google Scholar] [CrossRef]
- Baillie, Richard, and Rehim Kiliç. 2006. Do asymmetric and nonlinear adjustments explain the forward premium anomaly? Journal of International Money and Finance 25: 22–47. [Google Scholar] [CrossRef] [Green Version]
- Beyaert, Arielle, Jose García-Solanes, and Juan Pérez-Castejón. 2007. Uncovered interest parity with switching regimes. Economic Modelling 24: 189–202. [Google Scholar] [CrossRef]
- BIS. 2019. FX and OTC Derivatives Markets through the Lens of the Triennial Survey. BIS Quarterly Review. International Banking and Financial Market Developments. Basel: BIS. [Google Scholar]
- Bollerslev, Tim. 1990. Modelling the Coherence in Short-Run Nominal Exchange Rates: A Multivariate Generalized Arch Model. The Review of Economics and Statistics 72: 498. [Google Scholar] [CrossRef]
- Broock, William, Jose Scheinkman, Davis Dechert, and Blake LeBaron. 1996. A test for independence based on the correlation dimension. Econometric Reviews 15: 197–235. [Google Scholar] [CrossRef]
- Cerrato, Mario, Hyusok Kim, and Ronald MacDonald. 2013. Nominal interest rates and stationarity. Review of Quantitative Finance and Accounting 40: 741–45. [Google Scholar] [CrossRef] [Green Version]
- Chaboud, Alain, and Jonathan Wright. 2005. Uncovered interest parity: It works, but not for long. Journal of International Economics 66: 349–62. [Google Scholar] [CrossRef] [Green Version]
- Chiarella, Carl, Maurice Peat, and Max Stevenson. 1994. Detecting and modelling nonlinearity in flexible exchange rate time series. Asia Pacific Journal of Management 11: 159–86. [Google Scholar] [CrossRef]
- Cho, Dooyeon. 2018. On the persistence of the forward premium in the joint presence of nonlinearity, asymmetry, and structural changes. Economic Modelling 70: 310–19. [Google Scholar] [CrossRef]
- Cho, Dooyeon, and Sungju Chun. 2019. Can structural changes in the persistence of the forward premium explain the forward premium anomaly? Journal of International Financial Markets, Institutions and Money 58: 225–35. [Google Scholar] [CrossRef]
- Cho, Dooyeon, Heejoon Han, and Na Kyeong Lee. 2019. Carry trades and endogenous regime switches in exchange rate volatility. Journal of International Financial Markets, Institutions and Money 58: 255–68. [Google Scholar] [CrossRef]
- Clarida, Richard, Josh Davis, and Niels Pedersen. 2009. Currency carry trade regimes: Beyond the Fama regression. Journal of International Money and Finance 28: 1375–89. [Google Scholar] [CrossRef] [Green Version]
- Cleveland, Robert, William Cleveland, and Irma Terpenning. 1990. STL: A seasonal-trend decomposition procedure based on loess. Journal of Official Statistics 6: 3–73. [Google Scholar]
- Corazza, Marco, and Tassos Malliaris. 2002. Multi-Fractality in Foreign Currency Markets. Multinational Finance Journal 6: 65–98. [Google Scholar] [CrossRef]
- Czech, Katarzyna. 2020. Speculative trading and its effect on the forward premium puzzle: New evidence from Japanese yen market. Bank i Kredyt 51: 167–88. [Google Scholar]
- Díaz, Andres Fernandez, Pilar Grau-Carles, and Lorenzo Escot Mangas. 2002. Nonlinearities in the exchange rates returns and volatility. Physica A: Statistical Mechanics and its Applications 316: 469–82. [Google Scholar] [CrossRef]
- Dickey, David, and Wayne Fuller. 1979. Distribution of the Estimators for Autoregressive Time Series with a Unit Root. Journal of the American Statistical Association 74: 427–31. [Google Scholar] [CrossRef]
- Engle, Robert. 1982. Autoregressive Conditional Heteroscedasticity with Estimates of the Variance of United Kingdom Inflation. Econometrica 50: 987. [Google Scholar] [CrossRef]
- Evertsz, Carl. 1995. Self-Similarity of high-frequency USD-DEM exchange rates. Paper Presented at the First International Conference on High Frequency Data in Finance, Zurich, Switzerland, March. [Google Scholar]
- Fama, Eugene. 1965. The Behavior of Stock-Market Prices. The Journal of Business 38: 34–105. [Google Scholar] [CrossRef]
- Fama, Eugene. 1970. Efficient Capital Markets: A Review of Theory and Empirical Work. The Journal of Finance 25: 383–417. [Google Scholar] [CrossRef]
- Fama, Eugene. 1984. Forward and spot exchange rates. Journal of Monetary Economics 14: 319–38. [Google Scholar] [CrossRef]
- Fang, Hsing, Kon Lai, and Michael Lai. 1994. Fractal structure in currency futures price dynamics. The Journal of Futures Markets 14: 169–81. [Google Scholar] [CrossRef]
- Flood, Robert, and Andrew Rose. 2002. Uncovered Interest Parity in Crisis. IMF Staff Papers 49: 252–66. [Google Scholar] [CrossRef]
- Froot, Kenneth, and Jeffrey Frankel. 1989. Forward Discount Bias: Is it an Exchange Risk Premium? The Quarterly Journal of Economics 104: 139. [Google Scholar] [CrossRef] [Green Version]
- Galluccio, Stefano, Guido Caldarelli, Matteo Marsili, and Yicheng Zhang. 1997. Scaling in currency exchange. Physica A: Statistical Mechanics and its Applications 245: 423–36. [Google Scholar] [CrossRef] [Green Version]
- Glosten, Lawrence, Ravi Jagannathan, and David Runkle. 1993. On the Relation between the Expected Value and the Volatility of the Nominal Excess Return on Stocks. The Journal of Finance 48: 1779–801. [Google Scholar] [CrossRef]
- Goh, Soo Khoon, Guay Lim, and Nills Olekalns. 2006. Deviations from uncovered interest parity in Malaysia. Applied Financial Economics 16: 745–59. [Google Scholar] [CrossRef]
- Gould, Martin, Mason Porter, and Sam Howison. 2015. The Long Memory of Order Flow in the Foreign Exchange Spot Market. SSRN Journal. [Google Scholar] [CrossRef] [Green Version]
- Hamilton, James. 1994. Time Series Econometrics. Princeton: Princeton Unviersity Press. [Google Scholar]
- Han, Chenyu, Yiming Wang, and Ye Ning. 2019. Comparative analysis of the multifractality and efficiency of exchange markets: Evidence from exchange rates dynamics of major world currencies. Physica A: Statistical Mechanics and Its Applications 535: 122365. [Google Scholar] [CrossRef]
- Han, Chenyu, Yiming Wang, and Yingying Xu. 2020. Nonlinearity and efficiency dynamics of foreign exchange markets: Evidence from multifractality and volatility of major exchange rates. Economic Research-Ekonomska Istraživanja 33: 731–51. [Google Scholar] [CrossRef] [Green Version]
- Hsieh, David. 1989. Testing for Nonlinear Dependence in Daily Foreign Exchange Rates. The Journal of Business 62: 339–68. [Google Scholar] [CrossRef]
- Ichiue, Hibiki, and Kentaro Koyama. 2011. Regime switches in exchange rate volatility and uncovered interest parity. Journal of International Money and Finance 30: 1436–50. [Google Scholar] [CrossRef]
- Isard, Peter. 2006. Uncovered Interest Parity. IMF Working Papers. International Monetary Fund WP/06/96. pp. 1–12. Available online: https://ssrn.com/abstract=901883 (accessed on 20 May 2021).
- Kantelhardt, Jan, Stephan Zschiegner, Eva Koscielny-Bunde, Shlomo Havlin, Armin Bunde, and Eugene Stanley. 2002. Multifractal detrended fluctuation analysis of nonstationary time series. Physica A: Statistical Mechanics and Its Applications 316: 87–114. [Google Scholar] [CrossRef] [Green Version]
- Karahan, Özcan, and Olcay Çolak. 2012. Does Uncovered Interest Rate Parity Hold in Turkey? International Journal of Economics and Financial Issues 2: 386–94. [Google Scholar]
- Kitamura, Yoshihiro. 2017. Simple measures of market efficiency: A study in foreign exchange markets. Japan and the World Economy 41: 1–16. [Google Scholar] [CrossRef]
- Kristoufek, Ladislav, and Miloslav Vosvrda. 2016. Gold, currencies and market efficiency. Physica A: Statistical Mechanics and Its Applications 449: 27–34. [Google Scholar] [CrossRef] [Green Version]
- Kwiatkowski, Denis, Peter Phillips, Peter Schmidt, and Yongcheol Shin. 1992. Testing the null hypothesis of stationarity against the alternative of a unit root. Journal of Econometrics 54: 159–78. [Google Scholar] [CrossRef]
- Laib, Mohamed, Luciano Telesca, and Mikhail Kanevski. 2017. MFDFA: MultiFractal Detrended Fluctuation Analysis. Available online: https://mlaib.github.io/MFDFA/ (accessed on 20 May 2021).
- Laib, Mohamed, Jean Golay, Luciano Telesca, and Mikhail Kanevski. 2018. Multifractal analysis of the time series of daily means of wind speed in complex regions. Chaos, Solitons & Fractals 109: 118–27. [Google Scholar] [CrossRef] [Green Version]
- Lean, Hooi Hooi, and Russell Smyth. 2015. Testing for weak-form efficiency of crude palm oil spot and future markets: New evidence from a GARCH unit root test with multiple structural breaks. Applied Economics 47: 1710–21. [Google Scholar] [CrossRef]
- Lei, Qiang, and Ying-li Pan. 2012. Nonlinear analyses of exchange rates of six emerging markets. Journal of Shanghai Jiaotong University (Science) 17: 108–13. [Google Scholar] [CrossRef]
- Li, Dandan, Atanu Ghoshray, and Bruce Morley. 2012. Measuring the risk premium in uncovered interest parity using the component GARCH-M model. International Review of Economics & Finance 24: 167–76. [Google Scholar] [CrossRef] [Green Version]
- Liu, Angela, Ming-Shiun Pan, and Paul Hsueh. 1994. A Modified R/S Analysis of Long-Term Dependence in Currency Futures Prices. Journal of International Financial Markets, Institutions & Money 3: 97–113. [Google Scholar] [CrossRef]
- Lothian, James, and Liuren Wu. 2011. Uncovered interest-rate parity over the past two centuries. Journal of International Money and Finance 30: 448–73. [Google Scholar] [CrossRef] [Green Version]
- Malliaropulos, Dimitrios. 1997. A multivariate GARCH model of risk premia in foreign exchange markets. Economic Modelling 14: 61–79. [Google Scholar] [CrossRef]
- Mammadli, Sadig. 2017. Analysis of chaos and nonlinearities in a foreign exchange market. Procedia Computer Science 120: 901–7. [Google Scholar] [CrossRef]
- Marquardt, Donald. 1963. An Algorithm for Least-Squares Estimation of Nonlinear Parameters. Journal of the Society for Industrial and Applied Mathematics 11: 431–41. [Google Scholar] [CrossRef]
- McCallum, Bennett. 1994. A reconsideration of the uncovered interest parity relationship. Journal of Monetary Economics 33: 105–32. [Google Scholar] [CrossRef] [Green Version]
- Miloş, Laura Raisa, Cornel Haţiegan, Marius Cristian Miloş, Flavia Mirela Barna, and Claudiu Boțoc. 2020. Multifractal Detrended Fluctuation Analysis (MF-DFA) of Stock Market Indexes. Empirical Evidence from Seven Central and Eastern European Markets. Sustainability 12: 535. [Google Scholar] [CrossRef] [Green Version]
- Narayan, Paresh Kumar, Ruipeng Liu, and Joakim Westerlund. 2016. A GARCH model for testing market efficiency. Journal of International Financial Markets, Institutions and Money 41: 121–38. [Google Scholar] [CrossRef]
- Nguyen, Tin. 2000. Foreign Exchange Market Efficiency, Speculators, Arbitrageurs and International Capital Flows. CIES Working Paper 0033. pp. 1–47. Available online: https://ssrn.com/abstract=239452 (accessed on 15 May 2021).
- Olmo, Jose, and Keith Pilbeam. 2011. Uncovered interest parity and the efficiency of the foreign exchange market: A re-examination of the evidence. International Journal of Finance & Economics 16: 189–204. [Google Scholar] [CrossRef]
- Peters, Edgar. 1994. Fractal Market Analysis. Applying Chaos Theory to Investment and Economics. New York: John Wiley & Sons, Inc. [Google Scholar]
- Pietrych, Łukasz, Julio Sandubete, and Lorenzo Escot. 2021. Solving the chaos model-data paradox in the cryptocurrency market. Communications in Nonlinear Science and Numerical Simulation 102: 105901. [Google Scholar] [CrossRef]
- Sarno, Lucio. 2005. Viewpoint: Towards a solution to the puzzles in exchange rate economics: Where do we stand? Canadian Journal of Economics/Revue canadienne d’économique 38: 673–708. [Google Scholar] [CrossRef]
- Serletis, Apostolos, and Periklis Gogas. 1997. Chaos in East European black market exchange rates. Research in Economics 51: 359–85. [Google Scholar] [CrossRef] [Green Version]
- Shahzad, Syed Jawad, Jose Areola Hernandez, Waqas Hanif, and Ghulam Mujtaba Kayani. 2018. Intraday return inefficiency and long memory in the volatilities of forex markets and the role of trading volume. Physica A: Statistical Mechanics and its Applications 506: 433–50. [Google Scholar] [CrossRef]
- Šonje, Velimir, Denis Alajbeg, and Zoran Bubaš. 2011. Efficient market hypothesis: Is the Croatian stock market as (in)efficient as the U.S. market. Financial Theory and Practice 35: 301–26. [Google Scholar] [CrossRef]
- Tabasi, Hamed, Vahidreza Yousefi, Jolanta Tamošaitienė, and Foroogh Ghasemi. 2019. Estimating Conditional Value at Risk in the Tehran Stock Exchange Based on the Extreme Value Theory Using GARCH Models. Administrative Sciences 9: 40. [Google Scholar] [CrossRef] [Green Version]
- Tai, Chu-Sheng. 2001. A multivariate GARCH in mean approach to testing uncovered interest parity: Evidence from Asia-Pacific foreign exchange markets. The Quarterly Review of Economics and Finance 41: 441–60. [Google Scholar] [CrossRef]
- Theiler, James, Stephen Eubank, Andre Longtin, Bryan Galdrikian, and Doyne Farmer. 1992. Testing for nonlinearity in time series: The method of surrogate data. Physica D: Nonlinear Phenomena 58: 77–94. [Google Scholar] [CrossRef] [Green Version]
- van de Gucht, Linda, Marnik Dekimpe, and Chuck Kwok. 1996. Persistence in foreign exchange rates. Journal of International Money and Finance 15: 191–220. [Google Scholar] [CrossRef]
- Xiao, Ling, Gurjeet Dhesi, Eduard Gabriel Ceptureanu, Kevin Lin, Claudiu Herteliu, Babar Syed, and Sebastian Ion Ceptureanu. 2020. Liquidity transmission and the subprime mortgage crisis: A multivariate GARCH approach. Soft Comput 24: 13871–78. [Google Scholar] [CrossRef]
- Zakoian, Jean-Michel. 1994. Threshold heteroskedastic models. Journal of Economic Dynamics and Control 18: 931–55. [Google Scholar] [CrossRef]
- Zhou, Su, and Ali Kutan. 2005. Does the forward premium anomaly depend on the sample period used or on the sign of the premium? International Review of Economics & Finance 14: 17–25. [Google Scholar] [CrossRef]
- Zivot, Eric, and Donald Andrews. 2002. Further Evidence on the Great Crash, the Oil-Price Shock, and the Unit-Root Hypothesis. Journal of Business & Economic Statistics 20: 25–44. [Google Scholar] [CrossRef]

Table 1.
The ADF unit root test and KPSS stationarity test results for monthly Polish zloty exchange rate returns and interest rate differential.
Table 1.
The ADF unit root test and KPSS stationarity test results for monthly Polish zloty exchange rate returns and interest rate differential.
| USD | EUR | JPY | CHF | MXN | TRY | |
|---|---|---|---|---|---|---|
| ) | ||||||
| Augmented Dickey–Fuller test (ADF) | ||||||
| 5% Critical Value: Test statistic: | −1.94 −12.90 | −1.94 −12.22 | −1.94 −12.41 | −1.94 −12.96 | −1.94 −14.22 | −1.94 −13.10 |
| Kwiatkowski, Phillips, Schmidt and Shin test (KPSS) | ||||||
| 5% Critical Value: Test statistic: | 0.463 0.127 | 0.463 0.154 | 0.463 0.079 | 0.463 0.136 | 0.463 0.088 | 0.463 0.214 |
| ) | ||||||
| Augmented Dickey–Fuller test (ADF) | ||||||
| 5% Critical Value: Test statistic: | −1.94 −1.88 | −1.94 −2.28 | −1.94 −1.58 | −1.94 −1.60 | −1.94 −0.36 | −1.94 −0.72 |
| Kwiatkowski, Phillips, Schmidt and Shin test (KPSS) | ||||||
| 5% Critical Value: Test statistic: | 0.463 0.459 | 0.463 0.232 | 0.463 1.510 | 0.463 0.851 | 0.463 0.644 | 0.463 0.484 |
| Zivot–Andrew test | ||||||
| Test statistic: p-value: | −5.12 <0.001 | −3.43 <0.001 | −3.75 0.017 | −3.14 0.032 | −4.06 0.003 | −4.90 0.001 |
Table 2.
Testing the Uncovered Interest Parity hypothesis on the Polish exchange rate market. The results of the GARCH models (4), (5).
Table 2.
Testing the Uncovered Interest Parity hypothesis on the Polish exchange rate market. The results of the GARCH models (4), (5).
| Coefficients | USD | EUR | JPY | CHF | MXN | TRY |
|---|---|---|---|---|---|---|
| mean equation | ||||||
| 0.001 | −0.001 | 0.005 | 0.009 * | −0.008 *** | −0.013 ** | |
| 0.055 | −0.187 | −3.993 ** | −3.667 ** | −0.997 ** | −0.692 | |
| variance equation | ||||||
| 0.001 | 0.001 * | 0.001 ** | 0.001 ** | 0.002 *** | 0.001 *** | |
| 0.065 * | 0.237 ** | 0.406 *** | 0.573 ** | 0.043 *** | 0.291 *** | |
| 0.075** | - | - | - | 0.051*** | - | |
| - | - | - | −0.583 ** | - | - | |
| 0.135 * | 0.637 *** | 0.418 ** | 0.412 *** | 0.552 *** | - | |
| 0.890 *** | - | - | - | 0.048 *** | - | |
| 1.426 *** | 1.728*** | 1.504*** | 1.494*** | 1.948 *** | - | |
| Wald test () | ||||||
| F test statistic: | 0.207 | 2.335 * | 8.999 *** | 4.299 ** | 19.448 *** | 3.410 ** |
Notes: ***, ** and * denote statistical significance at the 1%, 5% and 10% significance level, respectively.
Table 3.
Summary of the stationarity, time-dependence and non-linearity analysis of the daily Polish zloty exchange rate returns series.
Table 3.
Summary of the stationarity, time-dependence and non-linearity analysis of the daily Polish zloty exchange rate returns series.
| USD | EUR | JPY | CHF | MXN | TRY | |
|---|---|---|---|---|---|---|
| Time series stationarity tests | ||||||
| ADF test | ||||||
| 5% Critical Value: Test Statistic: | −1.94 −3.821 | −1.94 −2.067 | −1.94 −3.868 | −1.94 −2.831 | −1.94 −2.725 | −1.94 −0.740 |
| KPSS test | ||||||
| 5% Critical Value: Test Statistic: | 0.463 0.169 | 0.463 0.227 | 0.463 0.104 | 0.463 0.157 | 0.463 0.094 | 0.463 0.270 |
| Ljung–Box Q test for autocorrelation (21 retards ~ 1 month) | ||||||
| p-value: | 0.006 | 0.007 | 0.057 | 0.000 | 0.000 | 0.067 |
| Nonlinearity tests: | ||||||
| Surrogate Test (p-value): | <0.05 | <0.05 | <0.05 | <0.05 | <0.05 | <0.05 |
| Terasvirta Test (p-value): | 0.386 | 0.000 | 0.681 | 0.067 | 0.000 | 0.000 |
| White Test (p-value): | 0.671 | 0.028 | 0.611 | 0.024 | 0.066 | 0.214 |
| BDS Test (ARMA fit, p-value): | 0.000 | 0.000 | 0.000 | 0.000 | 0.000 | 0.000 |
| BDS Test (shuffled data): | >0.1 | >0.1 | >0.1 | >0.1 | >0.1 | >0.1 |
Table 4.
Summary of the time-dependence and non-linearity analysis of the daily volatility time series.
Table 4.
Summary of the time-dependence and non-linearity analysis of the daily volatility time series.
| USD | EUR | JPY | CHF | MXN | TRY | |
|---|---|---|---|---|---|---|
| Heteroscedasticity tests | ||||||
| McLeod–Li (p-value): | 0.000 | 0.000 | 0.000 | 0.000 | 0.000 | 0.000 |
| Engle ARCH (p-value:) | 0.000 | 0.000 | 0.000 | 0.000 | 0.000 | 0.000 |
| Variance nonlinearity tests | ||||||
| Surrogate Test (p-value): | <0.05 | <0.05 | <0.05 | <0.05 | <0.05 | <0.05 |
| Terasvirta Test (p-value): | 0.004 | 0.000 | 0.024 | 0.000 | 0.276 | 0.000 |
| White Test (p-value): | 0.004 | 0.001 | 0.032 | 0.000 | 0.000 | 0.000 |
| BDS Test (ARMA fit, p-value): | 0.000 | 0.000 | 0.000 | 0.000 | 0.000 | 0.000 |
| BDS Test (shuffled data, p-value): | >0.1 | >0.1 | >0.1 | >0.1 | >0.1 | >0.1 |
Table 5.
The Generalised Hurst Exponent results.
| The Period from Access to the E.U. (3 May 2004, n = 4336) | Periods Since the End of the Crisis (1 January 2010, n = 2857) | |||||||||||
|---|---|---|---|---|---|---|---|---|---|---|---|---|
| Returns | Variance | Returns | Variance | |||||||||
| Hurst DFA | Hurst DFA_SHUFF | BDS | BDS SHUFF | Hurst DFA | Hurst DFA_SHUFF | Hurst DFA | Hurst DFA_SHUFF | BDS | BDS SHUFF | Hurst DFA | Hurst DFA_SHUFF | |
| USD | 0.4944 | 0.4968 | <0.05 | >0.05 | 0.6520 | 0.4814 | 0.5039 | 0.5147 | <0.05 | >0.05 | 0.7168 | 0.5117 |
| EUR | 0.4750 | 0.5206 | <0.05 | >0.05 | 0.6511 | 0.5023 | 0.4851 | 0.4713 | <0.05 | >0.05 | 0.6954 | 0.4855 |
| JPY | 0.5382 | 0.5003 | <0.05 | >0.05 | 0.7222 | 0.4958 | 0.5233 | 0.4826 | <0.05 | >0.05 | 0.7172 | 0.5273 |
| CHF | 0.5419 | 0.5027 | <0.05 | >0.05 | 0.6174 | 0.5291 | 0.5543 | 0.5005 | <0.05 | >0.05 | 0.7633 | 0.5146 |
| MXN | 0.4242 | 0.5272 | <0.05 | >0.05 | 0.6249 | 0.4996 | 0.4339 | 0.4964 | <0.05 | >0.05 | 0.6533 | 0.4871 |
| TRY | 0.4593 | 0.5020 | <0.05 | >0.05 | 0.6157 | 0.5015 | 0.4832 | 0.4962 | <0.05 | >0.05 | 0.7303 | 0.4952 |
Publisher’s Note: MDPI stays neutral with regard to jurisdictional claims in published maps and institutional affiliations. |
© 2021 by the authors. Licensee MDPI, Basel, Switzerland. This article is an open access article distributed under the terms and conditions of the Creative Commons Attribution (CC BY) license (https://creativecommons.org/licenses/by/4.0/).
Share and Cite
MDPI and ACS Style
Czech, K.; Pietrych, Ł. The Efficiency of the Polish Zloty Exchange Rate Market: The Uncovered Interest Parity and Fractal Analysis Approaches. Risks 2021, 9, 142. https://doi.org/10.3390/risks9080142
AMA Style
Czech K, Pietrych Ł. The Efficiency of the Polish Zloty Exchange Rate Market: The Uncovered Interest Parity and Fractal Analysis Approaches. Risks. 2021; 9(8):142. https://doi.org/10.3390/risks9080142
Chicago/Turabian StyleCzech, Katarzyna, and Łukasz Pietrych. 2021. "The Efficiency of the Polish Zloty Exchange Rate Market: The Uncovered Interest Parity and Fractal Analysis Approaches" Risks 9, no. 8: 142. https://doi.org/10.3390/risks9080142
Note that from the first issue of 2016, this journal uses article numbers instead of page numbers. See further details here.