
A Study of Microplastic Particles in Danish Tap Water

1
Department of Bioscience, Aarhus University, Frederiksborgvej 399, DK-4000 Roskilde, Denmark
2
Department of Environmental Engineering, Technical University of Denmark, DK-2800 Kongens Lyngby, Denmark
*
Author to whom correspondence should be addressed.
Water 2021, 13(15), 2097; https://doi.org/10.3390/w13152097
Submission received: 29 June 2021
/
Revised: 28 July 2021
/
Accepted: 29 July 2021
/
Published: 30 July 2021
(This article belongs to the Section Wastewater Treatment and Reuse)
Abstract
:Microplastics (MPs) are omnipresent in our surroundings and in the environment, with drinking water being a potential pathway for human exposure. This study investigated the presence of MPs in Danish drinking water from 17 different households and workplaces in Denmark. Samples of tap water were collected using a closed sampling system to decrease airborne contamination, and QA/QC measurements were performed to assess background contamination. Particles > 100 µm were visually analysed by stereomicroscopy in combination with spectroscopy analysis (µ-FTIR) to evaluate morphology and chemical composition. An assessment of MP particles down to 10 µm was performed on water samples from three locations using hyperspectral image analysis. The results indicate a low level of MPs in Danish drinking water, with a total of seven MP particles across all samples, comprising PET, PP, PS, and ABS. Microfibers were the most common type of MP-like particles in both drinking water and blanks, but the concentration for all samples was below the limit of detection and could not be differentiated from background contamination. Most of the particles analysed by µ-FTIR were identified as cellulose fibres and a smaller subset as protein. Based on this work, we discuss the status of MP drinking water studies and address challenges and limitations regarding the analysis of MP in drinking water.
1. Introduction
Microplastic (MP) represents a diverse range of synthetic and semi-synthetic polymer particles ranging from few micrometres and up to 5 mm [1]. These particles are highly persistent and recognized as emerging pollutants that are broadly present in our everyday surroundings and in all compartments of the environment [2]. This includes aquatic and terrestrial environments, with MP particles reported in samples of fresh- and seawater, sediment, soil and biota [3,4,5,6] in all parts of the world. However, the potential long-term impacts of MP on wildlife and human health are not well known and further investigation in this aspect is needed [7].
In order to understand the potential human health impacts, the MP concentrations and type of exposure, as well as the pathways through which these particles interact with humans must be determined. One of the potential exposure pathways for MP is through drinking water [8]. An international study performed by Kossuth et al. analysed tap water collected from different countries and reported widespread MP contamination in 83% of 159 samples with an average of 4.3 MPs L−1 [9]. Likewise, a Danish study of tap water with samples collected from 16 households around Copenhagen reported significant concentrations of MP in all samples with an average of 18 MPs L−1 [10]. Both these studies received large public interest and raised a debate internationally about the presence of MP particles in drinking water and the levels of human exposure. However, a discussion was also initiated concerning the reliability of the MP analyses, and recommendations were made for implementation of better quality control with rigorous analytical standards. Since then, no further study has been conducted to evaluate the MP concentration in Danish drinking water from households.
The use of quality assurance and quality control (QA/QC) measurement is arguably needed for MP analysis to control the background contamination in sampling and sample processing. This practice is vital to ensure reliability in the reported results and must be applied throughout the entire sample handling process. For instance, Uhl et al. performed a study in Norwegian drinking water, where effort was made to reduce the background contamination during sampling and analysis, and a high degree of QA/QC measurements was documented. In that study, the concentration of MPs in water at the end user was below the limit of detection (LoD) in 67% of the samples. Furthermore, only a single sample was found to be above the limit of quantification (LoQ) with 4.1 MP L−1, and this was believed to be the result of contamination during sampling [11]. Another study performed by Kirstein et al. assessed the concentration of MP particles in water from a Swedish high-performance drinking water treatment plant, also applying contamination measurements. The authors applied robust analytical methods for particle characterization and mass quantification, describing an annual uptake of less than one MP particle per person from drinking water [12]. These studies clearly indicates the importance of QA/QC methods and the use of efficient analytical methods to assess MPs, providing trustable results and experience to be used for method standardization. So far, no internationally harmonized guideline has been adopted for MP analysis in drinking water, though this is important to produce comparable data. Instead, the use of different methods and protocols for data assessment are still prevail, as also highlighted by a recently published international interlaboratory study [13]. In addition, the lack of a harmonized protocol for MP quantification hampers a firm conclusion on exposure levels from drinking water and other exposure routes [14].
Besides the QA/QC measurements to control sample contamination, a common pipeline for characterization of MP > 100 µm consists of visual inspection of the collected particles with validation of their chemical composition. Visual assessment provides morphological information about the collected particles, where these can be categorised by size, shape, and structure [15]. This visual classification is commonly applied as a screening method, generally employing optical microscopes to assess MP-like particles followed by mandatory chemical characterization to validate whether the particles are polymers. Several analytical techniques are available to chemically characterize MP-like particles with the most common technique being infrared microscopy (µ-FTIR), which is currently considered state-of-art for MP identification. This technique provides hyperspectral imaging measurements, where infrared spectra and spatial information from the analysed sample are obtained simultaneously. This brings several advantages for MP analysis, where the MP particles can be placed in a membrane for imaging, collection of chemical spectra and spatial information from several particles at the same time by sample mapping [16]. The spectral information can be further compared with a reference spectra library for polymer identification, and particles quantification can be automatically obtained [17]. µ-FTIR instruments are flexible and different measurement modes can be applied according to the particle size, e.g., µ-transmittance, µ-reflectance, and µ-Attenuated Total Reflectance (µ-ATR) [16]. Therefore, one single instrument can be used for a wide range of particle sizes and features.
The purpose of this study was to assess the presence of MP in Danish drinking water applying QA/QC measurements to control background contamination for reliable results. The samples represented tap water collected from private households and workplaces at 17 geographically widespread locations with different water abstraction areas. This study assessed a wide size range of MP particles down to 10 µm, applying visual classification and µ-FTIR chemical characterization.
2. Materials and Methods
2.1. Sampling Sites
Samples of tap water were collected from 17 different locations in Denmark, in the period April–June 2018 (Figure 1). The sampling sites represents a broad geographical area and cover different water abstraction zones with a large diversity in aquifer geology, groundwater age, and materials used for the water supply networks and piping. The majority of the samples were collected from taps used for drinking water on a daily basis, either in private households (n = 9), in private workplaces (n = 3), or in private or public institutions (n = 5). For more detailed information of sampling sites, see Supplementary Table S1.
2.2. Sampling Method
Sampling of tap water was performed by the direct coupling of a stainless steel column mounted with a stainless steel filter of 10 µm pore size directly to the tap, using a customized sampling system first presented by Strand [18]. The sampling equipment was attached to the tap using a small pipe with an appropriate thread, which was coupled directly to the sampling column with a fitting. Before sampling, a short flushing of the tap was performed for about 2 min with by-passing of the filter through a secondary outlet tube attached to the water column. During sampling, the taps were opened to full water pressure, and the flow through the sampling column was adjusted to 2.0 L per minute, while the residual water was led via the tube directly to the sink. For each sample, a volume of 50 L was passed through the sampling column and potential MPs in the water were retained on the steel filter for quantification and chemical analysis.
Upon sampling, the columns were sealed with aluminium foil to avoid contamination and brought to the laboratory for an assessment of MP > 100 µm by direct stereomicroscopy of the filters. Following visual inspection, chemical analysis of a representative subset of potential MP particles were performed by micro-Fourier Transform Infrared Spectrometer (µ-FTIR). A wider assessment of MP particles including the size fraction down to 10 µm was performed on replicates of 50 L water samples from three sampling locations (Site 1, 6, 8) using extended chemical µ-FTIR analysis on aluminum oxide filters (Anodisc 25 mm, Whatman, UK) with 0.2 µm pore size.
2.3. Cleaning and Preparation of Sampling Equipment
All equipment used for sampling and treatment of samples consisted of stainless steel or glass, whenever possible. This was to ensure optimal cleaning and reduction of background contaminants. All individual parts were cleaned before usage by washing in a dish washer and heating at 550 °C for at least 2 h to evaporate/burn off potential contaminants. A few parts of the equipment consisted of, or contained, rubber material that are not resistant to heating, such as the O-rings used for sealing the sampling and filtration system. These parts were manually cleaned first in a 5% detergent and then in distilled water, both previously filtrated using 0.5 µm glass filter. The sampling equipment was assembled in a laminar air flow bench and sealed with aluminum foil until used on the sampling site. This allowed for quick deployment of the gear on site and thus minimized handling in the open air and potential contamination of the sample. In the laboratory used for handling the samples, an air filtration system was installed (Dustbox Typ 1000, Möcklingshoff, Germany) to reduce airborne contamination.
2.4. Pre-Treatment and Extraction of Filter Samples for Analysis
Pre-treatment and extraction of filter samples for quantification and characterization of particles was based on a procedure previously developed [18]. The pre-treatment and extraction of the sample was done by adding 32% acetic acid to the sample column and allowing the treatment to continue for an hour to dissolve inorganic particles such as CaCO3. Potential MP particles attached within the sides of the column were then carefully flushed by the addition of 500 mL ethanol to the column sides and the particles were collected directly onto the steel filter. The sample column was subsequently disconnected, and the steel filter was carefully transferred to a clean glass petri dish and immediately closed to avoid contamination from the air.
For the samples analysed for MP particles down to 10 µm, backwashing the sample column was necessary in order to release the MPs from the stainless steel filter and collect them on the Anodisc filter. For these samples, a pre-treatment with acetic acid was also first performed, as described above, and then flushed briefly with water to wash away the acetic acid. The Anodisc filter was mounted in a stainless steel column (25 mm diameter), which was then coupled directly to the sample column, and the system was subsequently inverted. Back-flushing with 4 × 25 mL of a 5% detergent solution followed by approximately 20 mL water and 20 mL ethanol was performed during vacuum suction. The Anodisc filters were carefully removed from the column with forceps and placed in a clean glass petri dish until analysis. All solutions applied in this procedure were pre-filtrated using glass filter with 0.5 µm pore size to remove any contaminant particles.
2.5. Recovery Experiments
The recovery efficiency of the sampling for MP was assessed using MP reference fiber and particles. For the protocol without backwashing (used for MP > 100 µm), green fluorescent PET fibers (≈500 µm) were applied and a recovery of 90% was found. The reference fibers were added directly to a clean steel filter, which was assembled within the sample column. The column was then mounted to a water tap and 60 L of filtrated water was flushed through the column, initially with full water pressure (4–5 L per min and high water swirling) and subsequently with a lower flow (2 L per min). Finally, the column was disconnected from the tap, and treatment with acetic acid and ethanol was performed, according to the procedure described above. By inspection with stereomicroscopy, 90 out of the 100 fluorescent fibers were recovered on the steel filter. The remaining fibers were either retained in the column and could be washed out following disconnection of the system (5 fibers), attached to the rubber-membrane (O-ring) (1 fiber) or could not be accounted for (4 fibers). The sampling for MP down to 10 µm included a final backwashing step to transfer MPs from the steel filter to the Anodisc. Recovery efficiencies for the backwashing procedure was assessed using 5 different types of MP reference particles including various PE beads, PP fragments, and PET fibers. The determined recovery efficiencies were: PE beads 60–70 µm = 98% ± 2; PE beads 210–220 µm = 96% ± 4; PE beads 500–600 µm = 98% ± 4; PP fragments ~80 × ~500 µm = 87% ± 11; and PET fibers 10 × ~1000 µm = 75% ± 14.
2.6. Visual Quantification of MP-Like Particles by Microscopy
All filters were visually examined with a stereomicroscope (Nikon SMZ18 fluorescent microscope, magnification 10–135×) for the quantification and characterization of MP-like particles > 100 µm. This characterization was performed according to the recommendations from the Joint Research Center for description of potential MP in aquatic environments, i.e., in relation to the type (fiber, fragment, film etc.), colour and size of the particles [19]. In general, this approach is recommended only for particles > 100 µm, as visual identification of MP < 100 µm is too indeterminate. A quantification of all MP-like particles > 100 µm was performed and this amount represented the worst-case concentration of MP in the drinking water, as all MP-like particles (i.e., potential MPs) were counted.
The quantification and characterization of MP-like particles by stereomicroscopy relies on a subjective evaluation, as the filters contained a range of other organic and inorganic particle types that were not MP. Particles that were regarded as MP-like were fibers with strong colours, such as blue, pink, or black. Furthermore, all fragments and films with MP features were also counted as likely MPs. The most dominant group of particles that were regarded as MP-like were fibers or filaments with white to transparent colours. Particles that were disregarded as MPs were all white to transparent fragments with characteristics of either organic or inorganic material (e.g., salts, crystalline material, quarts, skin). In addition, all protein-like, rust-like, and metallic-like particles were also disregarded. For examples of characteristic particle types detected in the filters, see Supplementary Figure S1.
From each sample, a representative number of MP-like particles was selected for validation by µ-FTIR analysis. These particles were manually picked from the stainless steel filter and transferred with forceps to a ZnSe transmission window for analysis. In order to minimize the interference of air contaminants on the results during visual analysis, the quantification and characterization of micro particles was performed with the filter in a closed petri dish. After this visual inspection, the transfer of representative MP-like particles for µ-FTIR analysis was carried out.
2.7. Chemical Identification of MP-Like Particles by µ-FTIR Analysis
Particles in the tap water samples were characterized by infrared microscopy. µ-FTIR hyperspectral images were collected using a Cary 620 FTIR microscope coupled with a Cary 670 FTIR spectrometer from Agilent Technologies. This microscope has a focal plane array (FPA) detector with 128×128 pixels and all measurement were performed using a 15× Cassegrian objective with pixel resolution of 5.5 µm. Measurements were carried out with spectral resolution of 8 cm−1, applying 32 scans.
For the particles analysed in the ZnSe window, reflectance mode were applied in the spectral range of 3800–875 cm−1. Transmittance measurements were applied for the particles placed in Anodics in the spectral range of 3800–1300 cm−1. For the Anodisc samples, the final hyperspectral images were as square collection of 25 mosaic tiles (5 × 5 tiles) with 640 × 640 pixel in total. For each filter, four different areas were collected amounting to 10% of the total filter area, where each square mosaic contained 12 mm2. Both the ZnSe sample window and Anodisc filter are infrared transparent at the analysed spectral range. Clean membranes were used as the background throughout the acquisition process, applying 128 scans.
The collected data set were compared to a reference spectral library of various types of plastic polymers, rubbers, and natural matter for characterization. For the ZnSe dataset, spectra from each individual particles were compared with the reference library using Knowitall spectroscopy software. The hyperspectral image collected from the Anodisc filters was analysed using siMPle software [17], designed specifically to perform automated identification and quantification of MP particles, applying a library search. The reference spectra library used in the work was developed using various plastic and natural materials from different sources, such as food packaging and construction materials.
2.8. Determination of LoD for MP-Like Particles
Five blank samples were set-up, in order to determine the background contamination of MP in the samples. The sample column was mounted and the protocol for extraction and analysis was performed similarly to the drinking water samples, but without filtration of water through the column filter. In the five blank samples, an average of 13.2 ± 9.4 MP-like particles > 100 µm were observed (Supplementary Table S2). The limit of detection (LoD) for MP-like particles was calculated according to the recommendation from AOAC International (LoD = mean blank + 2 × 1.645 × SD for blank) [20,21]. The LoD was applied to determine whether the detected potential MP particles could be discriminated from background contamination. The LoD was 44 MP-like particles per sample, corresponding to 0.88 MP-like particles per L water. A subset of 32 out of 66 (48%) MP-like particles from the blanks were validated by µ-FTIR to determine the chemical composition, and four particles (12.5%) were verified as MP. The polymers identified in the blanks represented two fragments of poly(methyl methacrylate) (PMMA) and polyethylene terephthalate (PET), and two fibers of ethylene-vinyl acetate (EVA) (Supplementary Table S2). The majority of the particles were characterized as cellulose or protein and categorised as fibers (86%).
Two additional blanks were carried out to evaluate background contamination in the Anodisc method applied for particles down to 10 µm. This smaller particle size was covered by including at least two neighbor-lying pixels in the µ-FTIR image. Having reliable polymer assignments based on only one pixel is generally more challenging due to the diffraction limit for µ-FTIR transmission analyses being between 20 and 10 µm [22]. The blank µ-FTIR images were acquired similarly to the drinking water samples, as well as the same data analysis procedure. One single PET particle was observed in the blank samples and rubber particles.
3. Results and Discussion
3.1. Microplastic > 100 µm
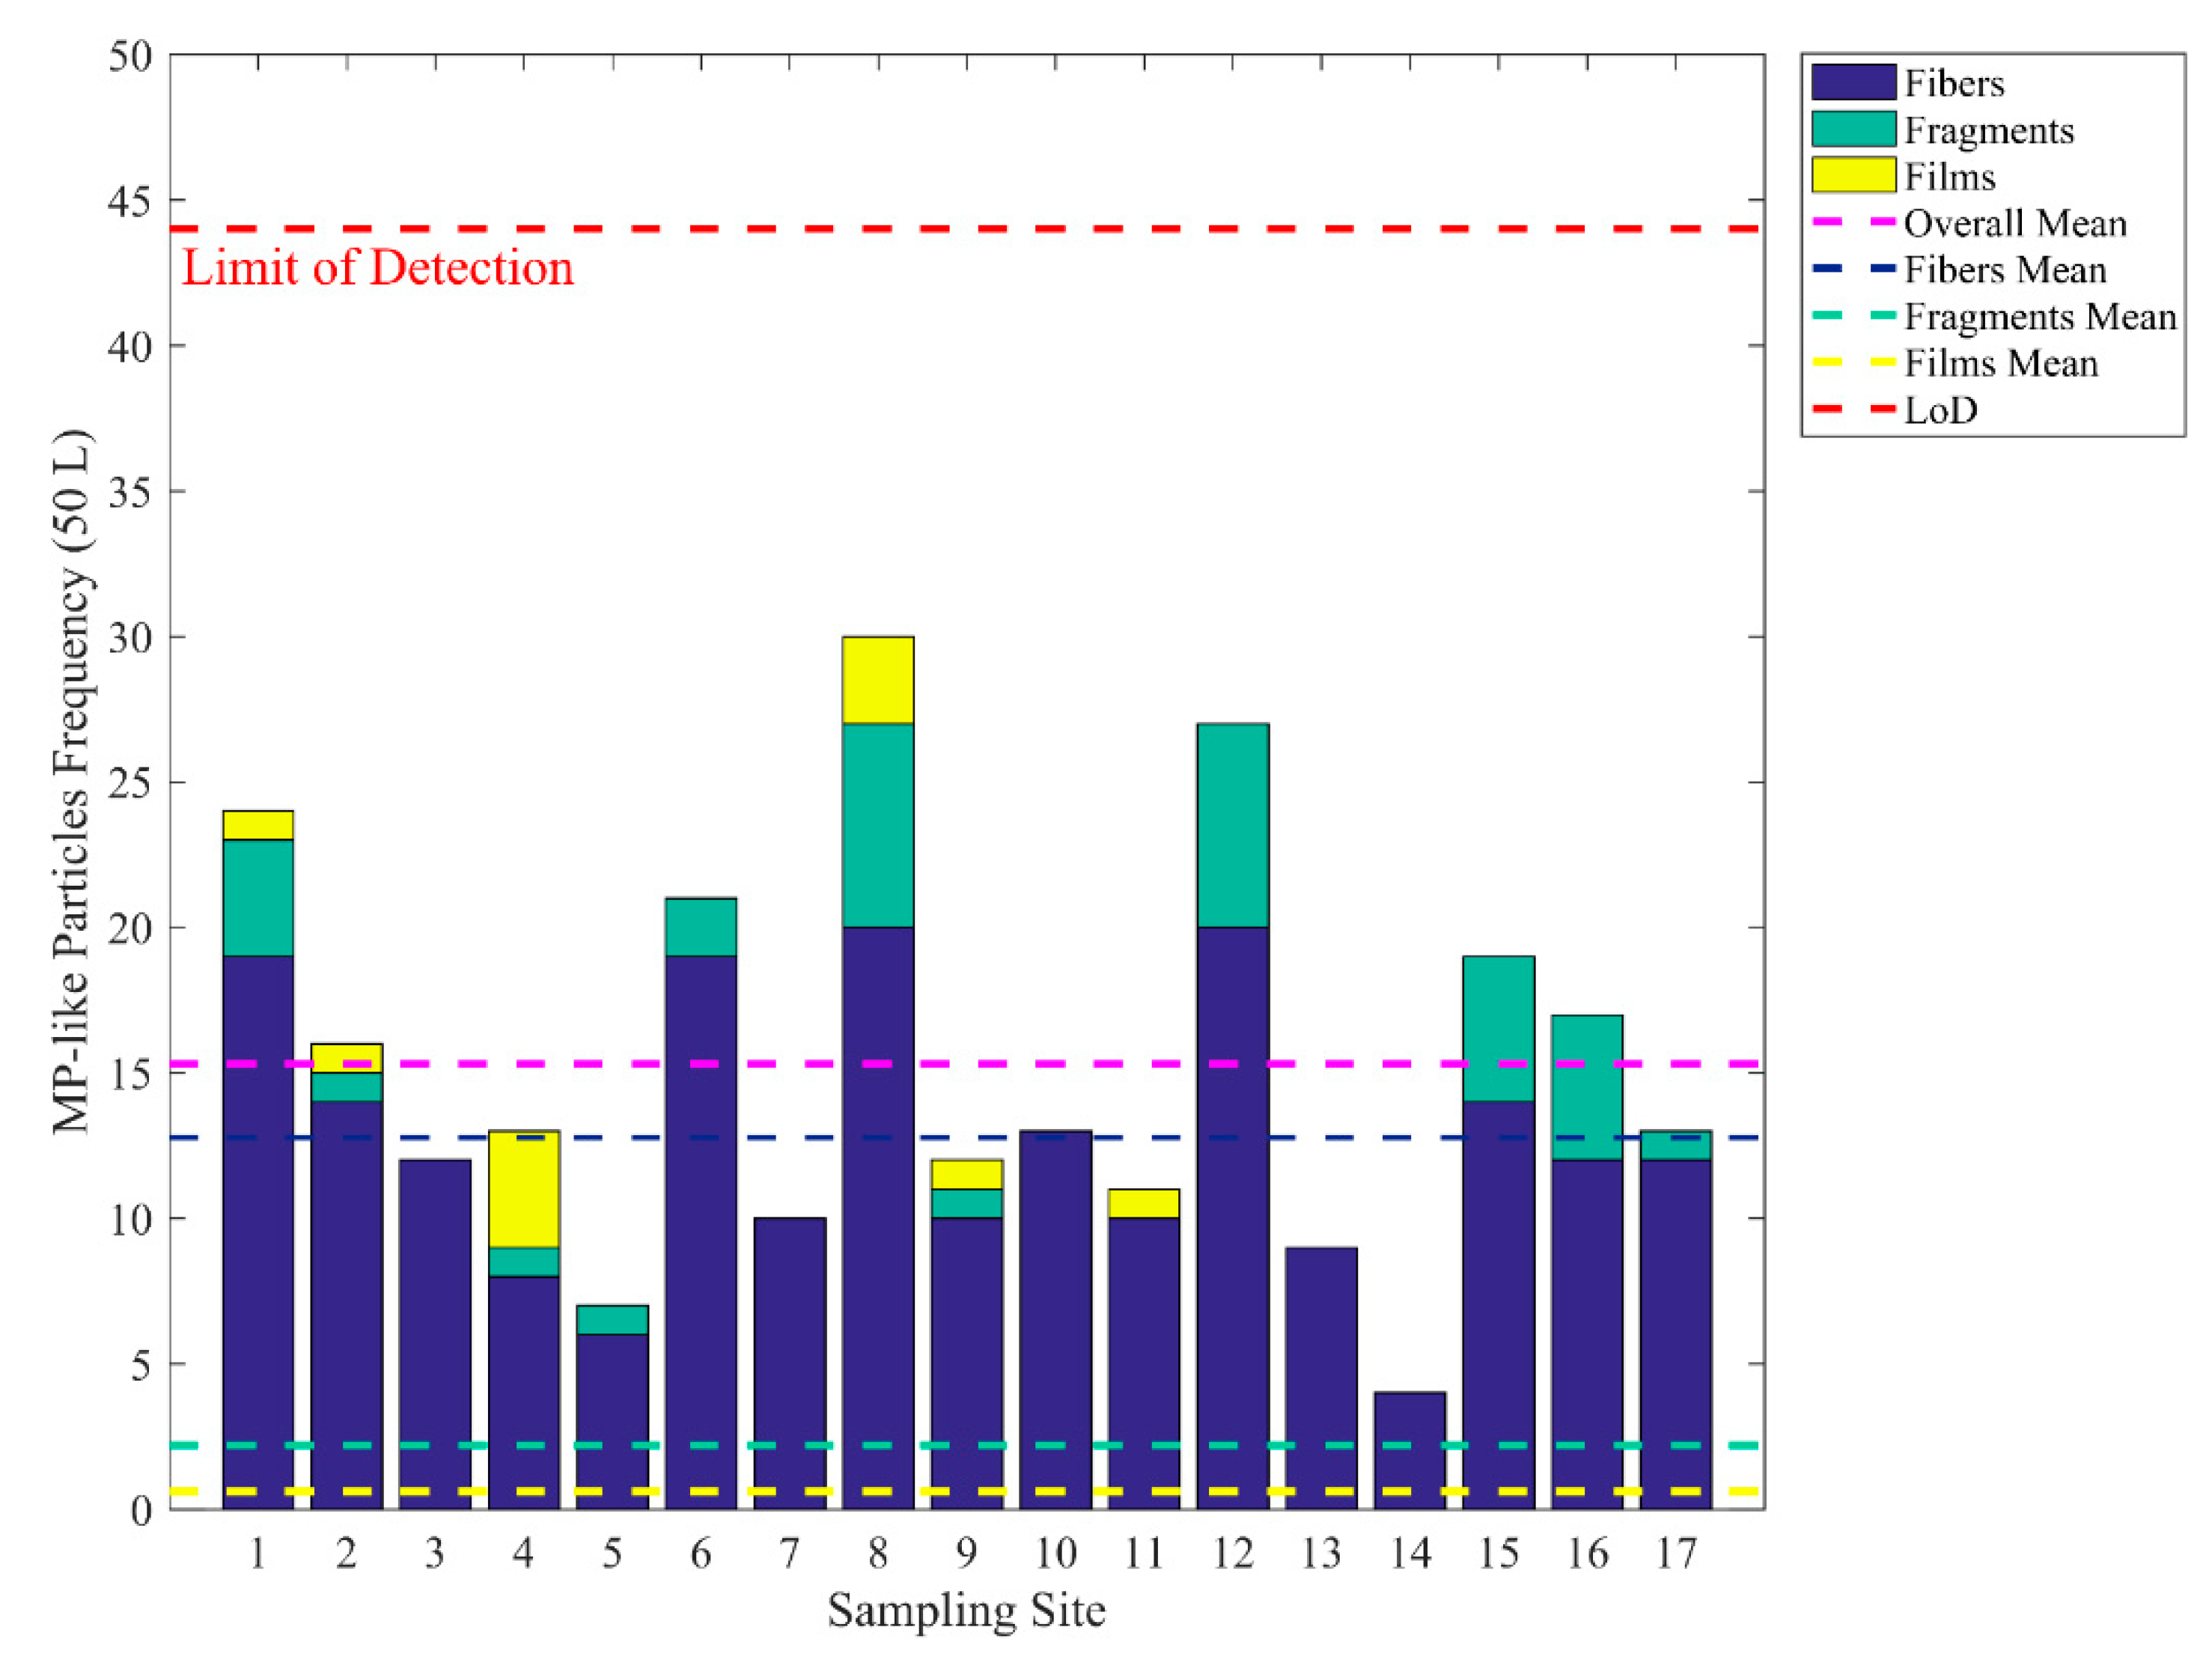
The concentration and distribution of different types of MP-like particles observed in Danish drinking water from the 17 different locations is shown in Figure 2. Detailed information about the results observed for each individual analysed site is presented in Supplementary Table S3.
In all of the 17 Danish drinking water samples analysed by stereomicroscopy, the number of MP-like particles > 100 µm were below the LoD (i.e., 44 MP-like particles per 50 L). The highest number of MP-like particles observed in a sample was 30 MP-like particles (site 8), and the mean number was 15.6 ± 7.1 MP-like particles, corresponding to 0.31 ± 0.14 MP-like particles per L (Figure 2). Hence, the number of MP-like particles observed in the samples could not be discriminated from blank samples, and detected MP-like particles could be either background contamination or derive from the drinking water.
In total, 281 MP-like particles were observed in all the drinking water samples, where microfibers were the predominant category with a total of 231 (82%) fibers detected, in comparison to only 39 (14%) fragments and 11 (4%) films (Table S3). Therefore, microfibers were the most common type of particle observed in the analysed filters and the only common category observed in all samples. Fibers presented an average of 12.8 MP-like particles per water sample, and the majority of the observed fibers were white or transparent, while 13% were coloured.
In order to determine whether the MP-like particles consisted of synthetic polymers, chemical characterization by µ-FTIR was performed on a subset of particles for each category, corresponding to 44% of the total number of particles. The chemical analysis showed that only four particles (3%) were confirmed as MP, consisting of polypropylene (PP), polystyrene (PS) and polyethylene terephthalate (PET), corresponding to 1.6%, 0.8% and 0.8% of the 124 validated particles, respectively (Figure 3). A large part of the visually identified MP-like particles were found to consist of cellulose. A subset of the particles was unknown, with no matches in library searches, or the µ-FTIR spectra were too poor for identification (Figure 3). These results confirms that visual analysis can provide false positive results and that validation of results by chemical characterization is compulsory to identify the polymeric particles.
Among the confirmed MP particles, two transparent fibers were identified as PP and PET from site 7 and site 16, respectively. The majority of the observed fibers, which showed a characteristic white colour, as well as all the bright coloured fibers, were identified as cellulosic by µ-FTIR analysis. The two remaining confirmed MP particles were transparent PS and PP fragments from sites 8 and 15, respectively. Fragments were observed in the majority of the water samples (12 sites), and the number of MP-like fragments ranged from 0 to 7 per sample. Most of the fragments categorised as MP-like were either white/transparent or black, while the occurrence of fragments with strong colours in the water samples was very low. MP-like films were the least frequently occurring type of particles observed in the water samples and none of them were verified as MP by spectroscopy analysis. Figure 4 shows the MP particles/fibers and the respective µ-FTIR spectrum observed in the Danish drinking water.
In all water samples from the 17 different analysed sites, the number of MP-like particles > 100 µm were below the LoD and the mean concentrations of 0.31 MP-like particles per L observed in this study are very low and cannot be differentiated from background contamination (0.88 MP-like particles per L). It is important to note that fibers were the most dominant group of particles found in both the water samples and the blanks, demonstrating that microfibers found in the samples likely were from contamination. Contamination by fibers is commonly derived from synthetic clothing abrasion, insufficiently cleaned laboratory equipment, poorly sealed specimens or ambient air [23]. In this work, we suggest that the fiber contamination may have been introduced during the digestion process, which was performed by opening of the sampling column. During this process clothing abrasion from lab coats or particles from ambient air could potentially enter the samples, although the latter was reduced, since an air filtration system was implemented in the laboratory to avoid airborne contamination. Optimization of the sampling device to enable pre-treatment of the samples in a closed system could be a measure to prevent introduction of contamination via this step.
Compared to a previous study of Danish tap water a where mean concentration of 18 MPs per L was reported [10], the much lower level of MP found in this work presumably reflects the stricter quality control procedures put in place to reduce the incidence of background contamination. This highlights the necessity of appropriate sampling equipment, cleaning and laboratory handling procedures, as well as representative blank measurements to establish levels of background contamination in MP analyses. Furthermore, the sample-size used in this study was larger (50 L) in comparison to the previous Danish study, which analysed 1 L samples. As background contamination predominantly reflect the sample handling and thus is relatively volume-independent, then a lower LoD can generally be achieved by sampling larger water volumes. Therefore, larger sample volumes decrease the significance of contamination and ensure more robust and reproducible measurements.
Few studies have been published recently regarding the amounts of MP in drinking water from waterworks (raw water and potable water) or from drinking water taps at the consumer site [12,21,24,25]. Relatively large amounts of water (200–2500 L) were analysed in these surveys, and the background contamination of MP per L sampled water was found to be low. Keeping background concentrations low is particularly important for quantitative studies of MP in such relatively clean samples as drinking water, and determination of LoD is an essential parameter for documentation of performance in MP analyses. However, currently, no standardized international guidelines exist for the determination of MP in water samples and accordingly no standardized protocols are available either for measurements of blanks or calculation of LoD. Although most recent studies share common characteristics in method application then several differences exist, and the data are not directly comparable. Furthermore, different methods for the assessment of background contamination, as well as the use of various statistical analyses (or the lack of these), lead to dissimilar ways of interpreting data.
3.2. Microplastic > 10 µm
Analysis of MPs down to 10 µm were carried out on drinking water samples from three of the investigated Danish sampling locations. A total number of three MP-particles were identified in the three analysed water samples (Table 1). These three MPs were found in samples from site 1 (PP) and site 6 (PET and ABS). MP particles were not found in site 8, though rubber particles were identified in this site and they might be from the O-rings used in the sampling gear, since rubber particle was also found in one blank sample. This rubber particle was found only in one blank sample together with one PET particle, while no particles were observed in the other blank sample. Moreover, this PET particle was 17 µm long and this particle size is close to the lateral resolution of µ-FTIR, providing poor spectra and a low signal-to-noise ratio that can underestimate its identification and diameter determination. The three identified MP particles were all fragments in the size-range 20–100 µm (PP and PET) and 100–150 µm (ABS).
The analysis of MP down to 10 µm supported the conclusion that levels of MP in Danish tap water are very low and cannot be distinguished from exterior contamination. However, the analysis of smaller MP particles was only performed from a subset of locations, and a wider assessment is required to provide more knowledge on geographical or local differences that may affect water MP content in this low size-range. Furthermore, the analysis was performed on 10% of the Anodisc filter area, corresponding to a sample volume of 5 L water, and thus a lower detection limit would be achieved by assessment of the whole filter area. Hence, for future studies, we would recommend a full analysis of the small-size range MP in drinking water samples from a larger number of samples. The 17 sample sites analysed in this study represent a comprehensive selection of Danish tap water, encompassing several geographical regions with different water abstraction zones, diversity in aquifer geology, groundwater age, water works, as well as materials of the water supply networks and piping. Thus, analysis of MP down to 10 µm from all the 17 sites would provide a broader knowledge of MP in Danish drinking water. The partial assessment of the filter area may also explain why no MP or cellulose fibers were observed in these analyses, since on average only one fiber per Anodisc analysis would be expected based on the concentrations found in analyses for particles > 100 µm, where fibers were dominating. In addition, the recovery test of the backwashing procedure showed that fibers had a lower recovery efficiency (75%) compared to beads (>96%) and fragments (>87%). This could indicate that fibers to some extent could be retained in the sampling system used for analysis of the smaller size particles.
Overall, the results of this study show that levels of MPs > 10 µm in Danish tap water are generally very low. A method for quantification of MP > 100 µm were applied, representing a worst-case scenario of pollution levels with quantification of all potential MPs, based on full thorough sample screenings by stereomicroscopy. By combination of this visual quantification with a qualitative validation of the MP-like particles by µ-FTIR, only 3% were found as polymers, and the reported concentration of MP-like particles thus represents an overestimation of the actual MP-concentration.
In this study, a correction for particle counts of specific polymer types was not performed for the >100 µm particles, as the quantification was based on MP-like particles from visual identification. However, a distinctive quantification or evaluation of each polymer type represented in the blank samples is advantageous, as performed by Kirstein et al. [12]. The determination of LoD for the specific MP quantification method should be an integrated part of MP analyses, as also recommended in the GESAMP guidelines [1]. Implementation of this QA/QC procedure would ensure a lower risk of false positive or negative samples and hence more reliable results. Furthermore, establishing international guidelines for the processing of blanks and calculating LoD (as well as Limit of Quantification, LoQ) would result in more harmonized data assessment and interpretation of MP results, irrespective of different analytical methods applied. Furthermore, international guidelines for MP monitoring recommends stereomicroscopy as a valid method for analysis of MP particles in the larger size range. However, this also highlights the need for a combination of the analysis with chemical validation [1,19]. Stereomicroscopy is a relatively laborious procedure which requires skilled qualifications in MP identification, in addition to time-consuming manual handling and transfer of particles to u-FTIR microscope for chemical validation. This also implies that the results are to some extent subjective and dependent on the expertise of the personal. In contrast, the u-FTIR analysis of Anodiscs performed for three of the water samples in this study (MPs >10 µm), is independent of subjective visual pre-screening of particles, and can also be used for the smaller size-range particles.
Different sample windows exist for spectroscopic analysis, e.g., silver metal membrane filters [21], Silicon filters [26], Anodiscs [27], or ZnSe slide. In this study, we applied ZnSe slide for analysis of MP > 100 µm and Anodiscs for the direct sample transfer and analysis of MP ≥ 10 µm. These filters have different IR-transparency, which means that a full range spectrum was obtained with the ZnSe filter (3800–875 cm−1), whereas a shorter spectral range was available with Anodiscs (3800–1300 cm−1). Although full spectra range could not be measured using Anodisc, the main characteristic spectra information from polymers are observed in the applied spectra region. Alternatively, silicon filters can be used for a broader spectrum range. These filters have the advantages of allowing the samples to be filtered directly to it for MP analysis. Finally, the reference library applied for spectra characterization has in important role, because the confidence of the results depends on the library quality and composition. In the present study, different types of polymers from different sources and representing different weathering states were applied in the library, thus enabling better identification of MPs exposed to environmental conditions. The hyperspectral images can also be analysed by multivariate data analysis, which brings advantages to increase throughput analysis with a fully automated pipeline. Furthermore, multivariate models are faster than library searching with results obtained in few minutes and, can in addition, can reduce bias in MP identification by the implementation of statistical evaluation of the models. Some methods have already been developed to apply this approach for MP analysis [28,29], and they could be a future alternative to retrieve MP information from spectroscopy data obtained in this field.
4. Conclusions
The analyses of MP in tap water from 17 sites around Denmark show that MPs occur in very low concentrations that cannot be distinguished from background levels. In all tap water samples, the number of MP-like particles were below the LoD of 44 particles per 50 L sample, corresponding to 0.88 MP-like particles per L tap water. µ-FTIR analysis was used to identify 44% of the visually characterized MP-like particles. The identification showed that 3% (four out of 124) of the MP-like particles were verified as MP, while the majority of the particles consisted of cellulosic material (76%). The remaining of analysed particles were identified as proteinaceous material (4%), had spectra too poor for identification (10%), or no matches were found in the applied spectra library (7%). Fibers constituted the majority of particles found in both drinking water and blank samples, which may indicate that the fibers detected in the water samples were from contamination. For the water samples analysed down to 10 µm, three MP fragments were identified (PET, PP, and ABS) and rubber particles were also observed in the sample and blanks. The development of a robust sampling methodology and the implementation of quality assurance and quality control procedures are of key importance to in ensuring the reliability of results in future MP research aiming at harmonized analytical protocols enabling a comparison of results. This is also necessary to provide more accurate information on the human exposure to polymeric particles, which is critical for the assessment of the risk of such exposure.
Supplementary Materials
The following are available online at https://www.mdpi.com/article/10.3390/w13152097/s1, Figure S1: Stereomicroscopy and classification of characteristic particles > 100 µm, Table S1: Description of sampling sites, Table S2: Quantification of MP-like particles > 100 µm in blank samples, Table S3: Quantification of MP-like particles > 100 µm in 50 L tap water samples.
Author Contributions
Conceptualization, J.S. and N.B.H.; methodology, J.S. and F.M.; investigation, L.F., V.H.d.S. and F.M.; writing—original draft preparation, L.F., V.H.d.S. and F.M.; writing—review and editing, L.F., V.H.d.S., F.M., N.B.H. and J.S.; supervision, J.S.; project administration. All authors have read and agreed to the published version of the manuscript.
Funding
This research was funded by the Danish Environmental Protection Agency, Ministry of Environment and Food of Denmark. The Danish Centre for Environment and Energy provided co-funding for method development and reporting of the study.
Data Availability Statement
Initial data presented in this study are available in [Strand, J., Feld, L., Murphy, F., Mackevica, A. & Hartmann, N.B. 2018. Analysis of microplastic particles in Danish drinking water. Aarhus University, DCE—Danish Centre for Environment and Energy, 34 pp. Scientific Report No. 291].
Acknowledgments
We would like to acknowledge Berit Langkilde Møller for excellent technical assistance with preparation of MP samples and stereomicroscopy analyses.
Conflicts of Interest
The authors declare no conflict of interest. The funders had no role in the design of the study; in the collection, analyses, or interpretation of data; in the writing of the manuscript, or in the decision to publish the results.
References
- GESAMP. Guidelines for the monitoring and assessment of plastic litter in the ocean. GESAMP Rep. Stud. 2019, 99, 130. [Google Scholar]
- Wu, P.; Huang, J.; Zheng, Y.; Yang, Y.; Zhang, Y.; He, F.; Chen, H.; Quan, G.; Yan, J.; Li, T.; et al. Environmental occurrences, fate, and impacts of microplastics. Ecotoxicol. Environ. Saf. 2019, 184, 109612. [Google Scholar] [CrossRef] [PubMed]
- González-Pleiter, M.; Velázquez, D.; Edo, C.; Carretero, O.; Gago, J.; Barón-Sola, Á.; Hernández, L.E.; Yousef, I.; Quesada, A.; Leganés, F.; et al. Fibers spreading worldwide: Microplastics and other anthropogenic litter in an Arctic freshwater lake. Sci. Total Environ. 2020, 722, 137904. [Google Scholar] [CrossRef] [PubMed]
- Strand, J.; Tairova, Z. Microplastic particles in North Sea sediments 2015. In Scientific Report from DCE—Danish Centre for Environment and Energy No. 178; Aarhus University: Roskilde, Denmark, 2016. [Google Scholar]
- Rummel, C.D.; Löder, M.G.J.; Fricke, N.F.; Lang, T.; Griebeler, E.M.; Janke, M.; Gerdts, G. Plastic ingestion by pelagic and demersal fish from the North Sea and Baltic Sea. Mar. Pollut. Bull. 2016, 102, 134–141. [Google Scholar] [CrossRef] [PubMed]
- Karlsson, T.M.; Vethaak, A.D.; Almroth, B.C.; Ariese, F.; van Velzen, M.; Hassellöv, M.; Leslie, H.A. Screening for microplastics in sediment, water, marine invertebrates and fish: Method development and microplastic accumulation. Mar. Pollut. Bull. 2017, 122, 403–408. [Google Scholar] [CrossRef]
- Wright, S.L.; Kelly, F.J. Plastic and Human Health: A Micro Issue? Environ. Sci. Technol. 2017, 51, 6634–6647. [Google Scholar] [CrossRef]
- Zhang, Q.; Xu, E.G.; Li, J.; Chen, Q.; Ma, L.; Zeng, E.Y.; Shi, H. A Review of Microplastics in Table Salt, Drinking Water, and Air: Direct Human Exposure. Environ. Sci. Technol. 2020, 54, 3740–3751. [Google Scholar] [CrossRef] [PubMed]
- Kosuth, M.; Mason, S.A.; Wattenberg, E.V. Anthropogenic contamination of tap water, beer, and sea salt. PLoS ONE 2018, 13, e0194970. [Google Scholar] [CrossRef]
- Cphbusiness Miljøteknologer Har fundet mikroplast i Dansk Drikkevand. Available online: https://www.cphbusiness.dk/om-cphbusiness/nyheder/2017/09/miljoeteknologer-har-fundet-mikroplast-i-dansk-drikkevand (accessed on 22 April 2021).
- Uhl, W.; Eftekhardadkhah, M.; Svendsen, C. Mapping microplastic in Norwegian drinking water. Atlantic 2018, 185, 491–497. [Google Scholar]
- Kirstein, I.V.; Hensel, F.; Gomiero, A.; Iordachescu, L.; Vianello, A.; Wittgren, H.B.; Vollertsen, J. Drinking plastics?—Quantification and qualification of microplastics in drinking water distribution systems by µFTIR and Py-GCMS. Water Res. 2021, 188, 116519. [Google Scholar] [CrossRef]
- van Mourik, L.; Crum, S.; Martinez-Frances, E.; van Bavel, B.; Leslie, H.; de Boer, J.; Cofino, W. Results of WEPAL-QUASIMEME/NORMANs first global interlaboratory study on microplastics reveal urgent need for harmonization. Sci. Total Environ. 2021, 772, 145071. [Google Scholar] [CrossRef]
- Zhang, S.; Wang, J.; Liu, X.; Qu, F.; Wang, X.; Wang, X.; Li, Y.; Sun, Y. Microplastics in the environment: A review of analytical methods, distribution, and biological effects. TrAC Trends Anal. Chem. 2019, 111, 62–72. [Google Scholar] [CrossRef]
- Lusher, A.L.; Bråte, I.L.N.; Munno, K.; Hurley, R.R.; Welden, N.A. Is It or Isn’t It: The Importance of Visual Classification in Microplastic Characterization. Appl. Spectrosc. 2020, 74, 1139–1153. [Google Scholar] [CrossRef] [PubMed]
- Xu, J.-L.; Thomas, K.V.; Luo, Z.; Gowen, A.A. FTIR and Raman imaging for microplastics analysis: State of the art, challenges and prospects. TrAC Trends Anal. Chem. 2019, 119, 115629. [Google Scholar] [CrossRef]
- Primpke, S.; Cross, R.K.; Mintenig, S.M.; Simon, M.; Vianello, A.; Gerdts, G.; Vollertsen, J. Toward the Systematic Identification of Microplastics in the Environment: Evaluation of a New Independent Software Tool (siMPle) for Spectroscopic Analysis. Appl. Spectrosc. 2020, 74, 1127–1138. [Google Scholar] [CrossRef]
- Strand, J. Forslag til målemetode til brug for undersøgelser af mikroplast i taphanevand. In Note from DCE—Danish Centre for Environment and Energy; Aarhus University: Roskilde, Denmark, 2018. [Google Scholar]
- Hanke, G.; Galgani, F.; Werner, S.; Oosterbaan, L.; Nilsson, P.; Fleet, D.; Kinsey, S.; Thompson, R.; Van Franeker, J.; Vlachogianni, T.; et al. Guidance on Monitoring of Marine Litter in European Seas. JRC Sci. Policy Rep. EUR 2013, 10, 99475. [Google Scholar] [CrossRef]
- AOAC International. Standard Format and Guidance for AOAC Standard Method Performance Requirement (SMPR) Documents; AOAC International: Rockville, MD, USA, 2011. [Google Scholar]
- Johnson, A.C.; Ball, H.; Cross, R.; Horton, A.A.; Jürgens, M.D.; Read, D.S.; Vollertsen, J.; Svendsen, C. Identification and Quantification of Microplastics in Potable Water and Their Sources within Water Treatment Works in England and Wales. Environ. Sci. Technol. 2020, 54, 12326–12334. [Google Scholar] [CrossRef]
- Primpke, S.; Christiansen, S.H.; Cowger, C.W.; De Frond, H.; Deshpande, A.; Fischer, M.; Holland, E.B.; Meyns, M.; O’Donnell, B.A.; Ossmann, B.E.; et al. Critical Assessment of Analytical Methods for the Harmonized and Cost-Efficient Analysis of Microplastics. Appl. Spectrosc. 2020, 74, 1012–1047. [Google Scholar] [CrossRef] [PubMed]
- Wesch, C.; Elert, A.M.; Wörner, M.; Braun, U.; Klein, R.; Paulus, M. Assuring quality in microplastic monitoring: About the value of clean-air devices as essentials for verified data. Sci. Rep. 2017, 7, 1–8. [Google Scholar] [CrossRef] [PubMed]
- Mintenig, S.M.; Löder, M.G.J.; Primpke, S.; Gerdts, G. Low numbers of microplastics detected in drinking water from ground water sources. Sci. Total Environ. 2019, 648, 631–635. [Google Scholar] [CrossRef]
- Weber, F.; Kerpen, J.; Wolff, S.; Langer, R.; Eschweiler, V. Investigation of microplastics contamination in drinking water of a German city. Sci. Total Environ. 2021, 755, 143421. [Google Scholar] [CrossRef] [PubMed]
- Käppler, A.; Windrich, F.; Löder, M.G.J.; Malanin, M.; Fischer, D.; Labrenz, M.; Eichhorn, K.-J.; Voit, B. Identification of microplastics by FTIR and Raman microscopy: A novel silicon filter substrate opens the important spectral range below 1300 cm−1 for FTIR transmission measurements. Anal. Bioanal. Chem. 2015, 407, 6791–6801. [Google Scholar] [CrossRef]
- Löder, M.G.J.; Kuczera, M.; Mintenig, S.; Lorenz, C.; Gerdts, G. Focal plane array detector-based micro-Fourier-transform infrared imaging for the analysis of microplastics in environmental samples. Environ. Chem. 2015, 12, 563–581. [Google Scholar] [CrossRef]
- Da Silva, V.H.; Murphy, F.; Amigo, J.M.; Stedmon, C.; Strand, J. Classification and Quantification of Microplastics (<100 μm) Using a Focal Plane Array–Fourier Transform Infrared Imag-ing System and Machine Learning. Anal. Chem. 2020, 92, 13724–13733. [Google Scholar] [PubMed]
- Wander, L.; Vianello, A.; Vollertsen, J.; Westad, F.; Braun, U.; Paul, A. Exploratory analysis of hyperspectral FTIR data obtained from environmental microplastics samples. Anal. Methods 2020, 12, 781–791. [Google Scholar] [CrossRef]
Figure 1.
Map of the 17 sites in Denmark selected for sampling and analysis of MP in Danish drinking water.
Figure 1.
Map of the 17 sites in Denmark selected for sampling and analysis of MP in Danish drinking water.

Figure 2.
Number of MP-like particles > 100 µm identified by visual stereomicroscopy for each tap water sample. The results are categorised in relation to their type and the average results are also presented.
Figure 2.
Number of MP-like particles > 100 µm identified by visual stereomicroscopy for each tap water sample. The results are categorised in relation to their type and the average results are also presented.

Figure 3.
Categorisation of the MP-like particles (>100 µm) selected for characterization by µ-FTIR.
Figure 3.
Categorisation of the MP-like particles (>100 µm) selected for characterization by µ-FTIR.

Figure 4.
Verification and identification of MP-particles >100 µm by µ-FTIR. Specific µ-FTIR spectrum and corresponding photos from microscopy are shown for: (A) a transparent fragment (~600 µm) from site 8 identified as PS; (B) a transparent fragment (~400 µm) from site 15 as PP; (C) a transparent fiber (~450 µm) from site 7 identified as PP; (D) a transparent fiber (~1500 µm) from site 16 identified as PET.


Table 1.
Number and ID of MP-particles (>10 µm) in tap water detected by Anodisc analysis. Anodisc analysis was performed on three randomly selected water samples from location 1, 8 and 6, respectively. The analysis was performed on 10% of the sample disc area from each of the water samples, corresponding to examination of 5 L of the sampled water volume. Number of rubber particles are shown in parenthesis. PET = polyethylene terephthalate, PP = polypropylene, PA = polyamide, ABS = acrylonitrile butadiene.
| Site | PET | PP | ABS | Rubber | Total MP-Particles Identified (Rubber) | Estimated MP-Particles in 50 L | Estimated MP-Particles in 1 L |
|---|---|---|---|---|---|---|---|
| 1 | 0 | 1 | 0 | 0 | 1 (0) | 10 (0) | 0.2 (0) |
| 6 | 1 | 0 | 1 | 0 | 2 (0) | 20 (0) | 0.4 (0) |
| 8 | 0 | 0 | 0 | 2 | 0 (2) | 0 (20) | 0.0 (0.4) |
| Total | 1 | 1 | 1 | 2 | 3 (2) | 10 (6.7) | 0.2 (0.1) |
Publisher’s Note: MDPI stays neutral with regard to jurisdictional claims in published maps and institutional affiliations. |
© 2021 by the authors. Licensee MDPI, Basel, Switzerland. This article is an open access article distributed under the terms and conditions of the Creative Commons Attribution (CC BY) license (https://creativecommons.org/licenses/by/4.0/).
Share and Cite
MDPI and ACS Style
Feld, L.; Silva, V.H.d.; Murphy, F.; Hartmann, N.B.; Strand, J. A Study of Microplastic Particles in Danish Tap Water. Water 2021, 13, 2097. https://doi.org/10.3390/w13152097
AMA Style
Feld L, Silva VHd, Murphy F, Hartmann NB, Strand J. A Study of Microplastic Particles in Danish Tap Water. Water. 2021; 13(15):2097. https://doi.org/10.3390/w13152097
Chicago/Turabian StyleFeld, Louise, Vitor Hugo da Silva, Fionn Murphy, Nanna B. Hartmann, and Jakob Strand. 2021. "A Study of Microplastic Particles in Danish Tap Water" Water 13, no. 15: 2097. https://doi.org/10.3390/w13152097
Note that from the first issue of 2016, this journal uses article numbers instead of page numbers. See further details here.