


Introduction
Growth rate can be considered as a metric of performance of an organism (Pörtner et al., Reference Pörtner, Storch and Heilmayer2005), being influenced by both abiotic and biotic factors (Richardson, Reference Richardson2001). Invertebrate skeletons, particularly of molluscs, frequently provide a continuous record of ontogenetic growth and an archive of environmental variation during the lifespan of an individual (Rhoads & Lutz, Reference Rhoads and Lutz1980). In shelled molluscs, such as limpets, the shell is accreted incrementally as the animal grows (MacClintock, Reference MacClintock1967). This incremental growth is separated by growth rings or growth lines (Richardson, Reference Richardson2001), which may be observed on both the surface (rings) and in cross-sections of the shell (lines; Rhoads & Lutz, Reference Rhoads and Lutz1980). As such, they can used to estimate individual growth rates and hence population performance within the distribution of a species.
Growth line formation reflects responses to a variety of abiotic and biotic conditions (Richardson, Reference Richardson2001). Seasonal patterns of seawater temperature can have substantial impacts on growth in benthic molluscs (Surge et al., Reference Surge, Wang, Gutiérrez-Zugasti and Kelley2013). Winter conditions inhibit normal limpet shell and somatic growth, resulting in slower growth rates (Lewis & Bowman, Reference Lewis and Bowman1975), manifested in narrower annual and tidally related shell growth increments (Crisp et al., Reference Crisp, Wieghell and Richardson1990; Richardson & Liu, Reference Richardson, Liu and Morton1994; Lomovasky et al., Reference Lomovasky, de Aranzamendi and Abele2020). By contrast, rapid shell growth, as illustrated by wider increments, is driven by more favourable conditions. Fast growth associated with warmer seawater temperatures and greater food availability yields increments that are easily distinguishable when compared with finer increments accreted during colder, less favourable conditions (Picken, Reference Picken1980; Surge et al., Reference Surge, Wang, Gutiérrez-Zugasti and Kelley2013; Lomovasky et al., Reference Lomovasky, de Aranzamendi and Abele2020). For instance, seasonal variation in shell deposition in the bivalve Arctica islandica (Butler et al., Reference Butler, Richardson, Scourse, Witbaard, Schöne, Fraser, Wanamaker, Bryant, Harris and Robertson2009) and in limpet species such as Patella vulgata (Surge et al., Reference Surge, Wang, Gutiérrez-Zugasti and Kelley2013; Ambrose et al., Reference Ambrose, Locke, Bigelow and Renaud2016; Gutiérrez-Zugasti et al., Reference Gutiérrez-Zugasti, Suárez-Revilla, Clarke, Schöne, Bailey and González-Morales2017) and Patella rustica (Prusina et al., Reference Prusina, Peharda, Ezgeta-Balić, Puljas, Glamuzina and Golubić2015) results in annual growth line formation, but marine benthic molluscs often also show increments at daily (Bock & Miller, Reference Bock and Miller1994; Schöne et al., Reference Schöne, Houk, Freyre, Castro, Oschmann, Kröncke, Dreyer and Gosselck2005) and tidal scales (Richardson et al., Reference Richardson, Crisp and Runham1979, Reference Richardson, Crisp, Runham and Gruffydd1980; Bock & Miller, Reference Bock and Miller1994).
Growth line formation in molluscs depends on processes internal to the individual (e.g. reproduction). Reproduction requires a large, and often exclusive, energy investment (Blackmore, Reference Blackmore1969), thereby reducing the budget for somatic and shell growth (Wright & Hartnoll, Reference Wright and Hartnoll1981; Sato, Reference Sato1995; Pörtner et al., Reference Pörtner, Storch and Heilmayer2005) and leads to slower growth during the reproductive season (e.g. in P. vulgata, Hawkins & Hartnoll, Reference Hawkins and Hartnoll1982). Thus, an annual line is commonly formed at the end of the gonadal development and spawning periods as, for example, in the top shell Phorcus lineatus (García-Escárzaga et al., Reference García-Escárzaga, Gutiérrez-Zugasti, Schöne, Cobo, Martín–Chivelet and González-Morales2019). Cessation of shell growth produces a discernible break in the microstructure of the shell, which may be recognized as a thick line in both cross-section and external features of these gastropod (García-Escárzaga et al., Reference García-Escárzaga, Gutiérrez-Zugasti, Schöne, Cobo, Martín–Chivelet and González-Morales2019, Reference García-Escárzaga, Gutiérrez-Zugasti, González-Morales, Arrizabalaga, Zech and Roberts2020) and bivalve shells (Sato, Reference Sato1995). In the northern hemisphere, annual line formation in bivalve species usually occurs during winter in species growing at high latitudes (Surge & Schöne, Reference Surge, Schöne, Rink and Thompson2014), although factors such as habitat depth and interaction with the dynamics of mixed seawater layers may play a role in changing the timing of increment growth in deeper-water species (Estrella-Martínez et al., Reference Estrella-Martínez, Schöne, Thurstan, Capuzzo, Scourse and Butler2019). Hence, these seasonal influences and reproductive traits imprinted in shells can be recognizable and thus quantifiable as records of species' growth rates.
Patellid limpets play a major role in controlling and structuring intertidal communities by the consumption of microbial biofilms, which are composed of cyanobacteria, microalgae, propagules and juveniles of macroalgae, thereby regulating algal cover (Hawkins, Reference Hawkins1981; Hawkins & Hartnoll, Reference Hawkins and Hartnoll1983; Hartnoll & Hawkins, Reference Hartnoll and Hawkins1985; Jenkins et al., Reference Jenkins, Coleman, Santina, Hawkins, Burrows and Hartnoll2005; Coleman et al., Reference Coleman, Underwood, Benedetti–Cecchi, Åberg, Arenas, Arrontes, Castro, Hartnoll, Jenkins, Paula, Santina and Hawkins2006). Due to their simple geometric morphology (Ekaratne & Crisp, Reference Ekaratne and Crisp1983) as well as their sessile nature and homing behaviour (Santini et al., Reference Santini, Ngan, Burrows, Chelazzi and Williams2014), limpets have been used as a tractable species to investigate population parameters such as growth rates (Jenkins & Hartnoll, Reference Jenkins and Hartnoll2001; Henriques et al., Reference Henriques, Sousa, Pinto, Delgado, Farias, Alves and Khadem2012; Sousa et al., Reference Sousa, Delgado, Pinto and Henriques2017), age structure (Fenberg & Roy, Reference Fenberg and Roy2012; Borges et al., Reference Borges, Doncaster, Maclean and Hawkins2015, Reference Borges, Hawkins, Crowe and Doncaster2016; Martins et al., Reference Martins, Borges, Vale, Ribeiro, Ferraz, Martins, Santos and Hawkins2017), sexual maturity (Guerra & Gaudencio, Reference Guerra and Gaudencio1986; Ribeiro et al., Reference Ribeiro, Xavier, Santos and Hawkins2009), recruitment and mortality (Henriques et al., Reference Henriques, Sousa, Pinto, Delgado, Farias, Alves and Khadem2012, Reference Henriques, Delgado, Sousa and Ray2017; Sousa et al., Reference Sousa, Delgado, Pinto and Henriques2017), including recent work testing hypotheses about the relative performances of overlapping species of cold- and warmer-water limpet species in various parts of their geographic distributions (e.g. Lima et al., Reference Lima, Gomes, Seabra, Wethey, Seabra, Cruz, Santos and Hilbish2016; Aguilera et al., Reference Aguilera, Valdivia, Jenkins, Navarrete and Broitman2018; Oróstica et al., Reference Oróstica, Hawkins, Broitman and Jenkins2020). External limpet shell rings (annuli) are often preserved and quantifiable with the naked eye (Bretos, Reference Bretos1980; Picken, Reference Picken1980) although distinguishing between disturbance rings and those of annual origin can be problematic. However, annual increments are frequently clearly visible in limpet shell cross-sections (e.g. Prusina et al., Reference Prusina, Peharda, Ezgeta-Balić, Puljas, Glamuzina and Golubić2015; Gutiérrez-Zugasti et al., Reference Gutiérrez-Zugasti, Suárez-Revilla, Clarke, Schöne, Bailey and González-Morales2017; Prendergast & Schöne, Reference Prendergast and Schöne2017; García-Escárzaga et al., Reference García-Escárzaga, Gutiérrez-Zugasti, González-Morales, Arrizabalaga, Zech and Roberts2020), enabling estimation of the lifespan and growth rates of Patella species to be determined at different locations within their geographic distribution.
Patella depressa, a warm water limpet species, is distributed from North Africa to the British Isles (Figure 1A; Orton & Southward, Reference Orton and Southward1961; Guerra & Gaudencio, Reference Guerra and Gaudencio1986; Southward et al., Reference Southward, Hawkins and Burrow1995; Ribeiro et al., Reference Ribeiro, Xavier, Santos and Hawkins2009). It has two separate leading edges as it has spread northwards after the last Ice Age (Figure 1; Southward et al., Reference Southward, Hawkins and Burrow1995), in north Wales (N Wales; Crisp & Knight-Jones, Reference Crisp and Knight–Jones1954) and in south and south-east England (S/SE England; Crisp & Southward, Reference Crisp and Southward1958). In S/SE England, the English Channel has been described as analogous to a poleward gradient (Herbert et al., Reference Herbert, Southward, Clarke, Sheader and Hawkins2009) for multiple intertidal species; the eastern Channel and southern North Sea are colder in winter than the western side due to continental influences from central Europe (for details see Crisp & Southward, Reference Crisp and Southward1958; Lewis, Reference Lewis1964). Different patterns of abundance (Kendall et al., Reference Kendall, Burrows, Southward and Hawkins2004; Oróstica, Reference Oróstica2018), individual growth and population mortality rates have recently been reported at the two range limits of P. depressa (Oróstica et al., Reference Oróstica, Hawkins, Broitman and Jenkins2020). The last northerly and easterly breeding populations of P. depressa occur at Abersoch in N Wales and Southsea in S/SE England (Figure 1B; S. J. Hawkins & M. H. Oróstica pers. obs.).
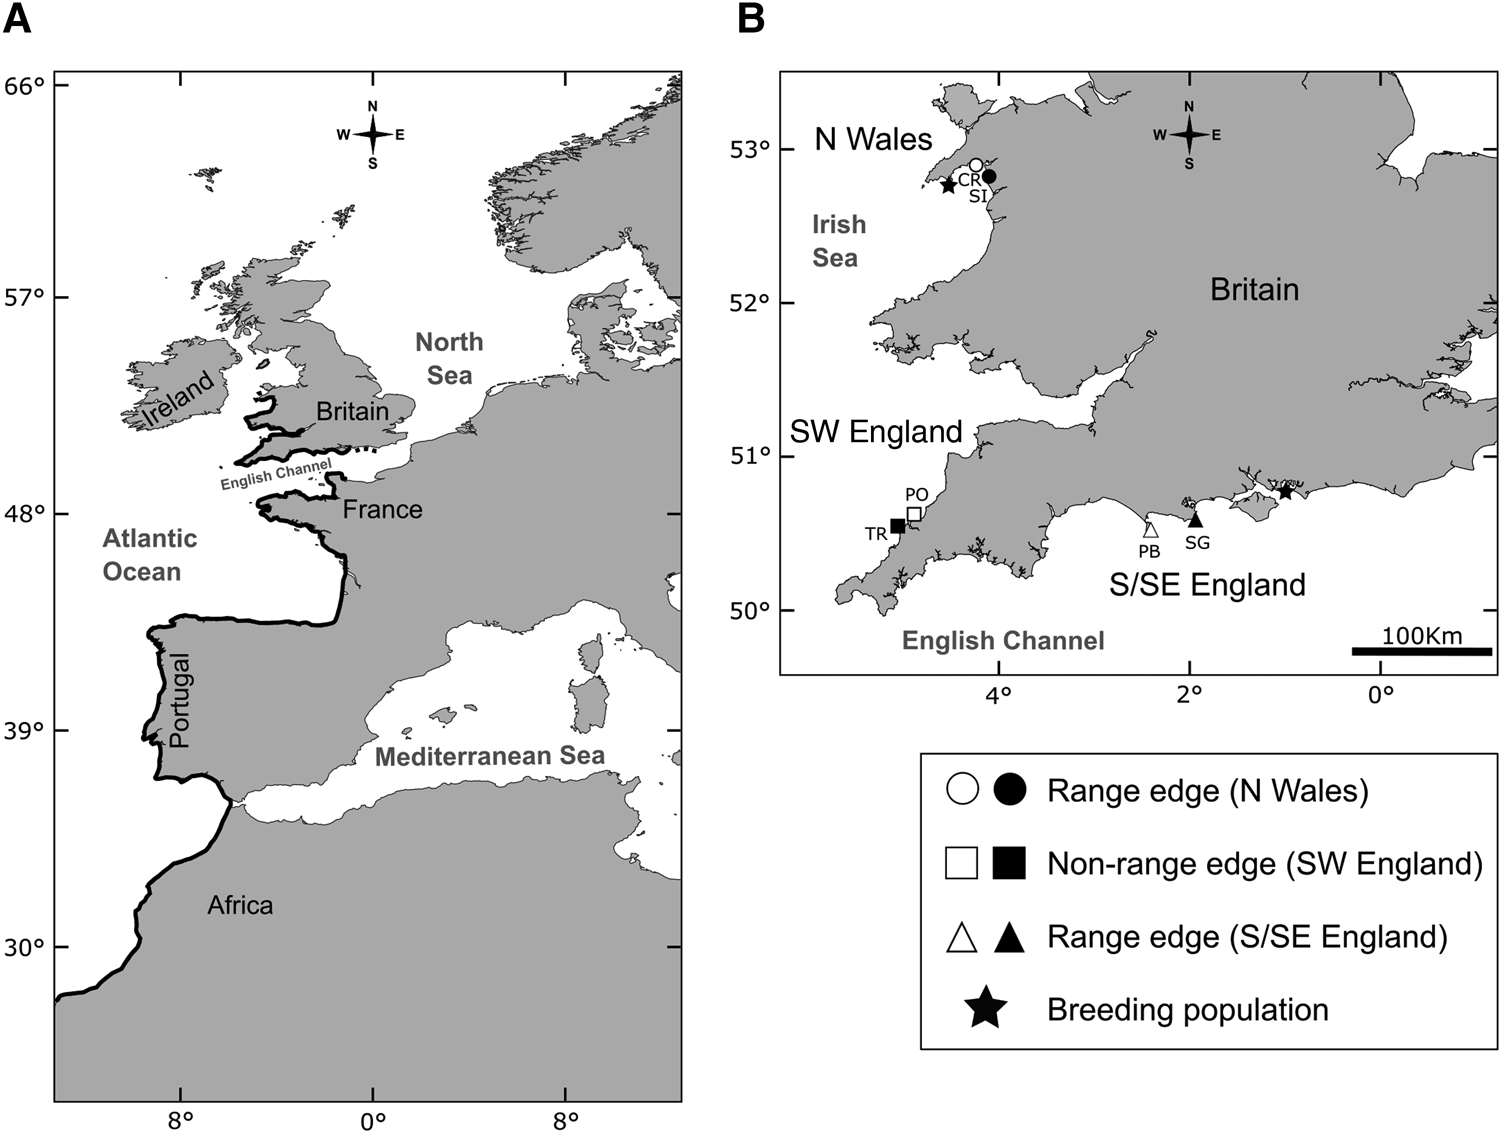
Fig. 1. (A) Geographic range of Patella depressa (black line; from N Wales to S/SE England to Senegal [not shown on map], Africa). (B) Regions (N = 3) and locations (N = 6) selected to measure growth and age at three regions defined by two leading edges of the range of P. depressa: (1) northern (N Wales: ○ Criccieth [CR]; ● Shell Island [SI]), and (2) eastern (S/SE England: △ Portland Bill [PB]; ▴ Swanage [SG]), and by non-range-edge populations in (3) SW England (□ Polzeath [PO]; ■ Trevone [TR]). In (B), the 2 black stars indicate last breeding populations of P. depressa towards both range edges in Britain (S. J. Hawkins & M. H. Oróstica pers. obs.).
Our goal was to investigate the age and growth rate of individual P. depressa, through validation of the putative annual growth lines seen in shell sections of in situ marked and re-measured limpets in the field. We compared the age and growth of P. depressa in populations at its two poleward range edges with non-range-edge populations in south-west England (SW England; Figure 1B). Here, P. depressa populations resemble those further south in Europe (France, Spain or Portugal) making up over 50% of the total limpet population on the mid-shore, with occasional patches where up to 100% can be found in a 50 × 50 cm quadrat (see Hawkins et al., Reference Hawkins, Moore, Burrows, Poloczanska, Mieszkowska, Herbert, Jenkins, Thompson, Genner and Southward2008; S. J. Hawkins unpubl. data). The number of growth lines were counted to estimate their longevity and mean length at age measured; von Bertalanffy growth curves were fitted to these data to estimate shell growth rate. We expected that at both range edges, individuals of P. depressa would grow more slowly. In addition, since unsuitable thermal conditions will curtail species reproduction, we expect limited or variable recruitment at species' range edges (Helmuth et al., Reference Helmuth, Mieszkowska, Moore and Hawkins2006), and hence a greater proportion of older individuals representing sporadic year class success. Additionally, we examined biotic control of growth. Density-dependent processes such as competition can influence limpet growth patterns (Thompson et al., Reference Thompson, Roberts, Norton and Hawkins2000; Boaventura et al., Reference Boaventura, da Fonseca and Hawkins2002, Reference Boaventura, da Fonseca and Hawkins2003). Thus, we also tested the influence of population density on growth performance of P. depressa at the scale of the habitat-patch.
Materials and methods
Morphological traits of P. depressa
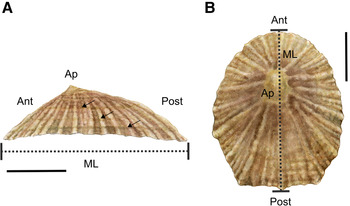
The shell of P. depressa is usually flatter than P. vulgata and Patella ulyssiponensis with distinctive orange-brown marginal rays on the inner surface (Evans, Reference Evans1947; Bowman, Reference Bowman1981). The apex (Ap) is located towards the anterior (Ant) end of the central axis of the shell (Figure 2A). Shells have fine radiating ribs and a markedly oval or triangular shape at their posterior (Post) end (Figure 2B; Bowman, Reference Bowman1981). The maximum length (ML) of P. depressa is usually between 30–35 mm (Figure 2A; Bowman, Reference Bowman1981) and although larger individuals have been found (Orton & Southward, Reference Orton and Southward1961; Borges et al., Reference Borges, Doncaster, Maclean and Hawkins2015), it never grows as large as P. vulgata in Britain (Evans, Reference Evans1947; Borges et al., Reference Borges, Doncaster, Maclean and Hawkins2015).

Fig. 2. Morphology of Patella depressa: (A) lateral and (B) dorsal views of the shell. Ant = anterior, Post = posterior and Ap = apex. Dashed black lines indicate maximum length (ML) of the shell. In (A) black arrows indicate potential annual growth rings or annuli. Scale bars: A–B, 10 mm.
Field validation of growth line formation
To validate the periodicity of growth lines seen in the shells of P. depressa, 80 specimens between 19–25 mm in ML were selected on rock boulders at mid tide level (MTL) on the exposed rocky shore at Shell Island in N Wales (Figure 1B), between the 22–29 June 2015. Each limpet was dried in situ with absorbent paper and labelled using a small (5 × 5 mm) waterproof numerical label (Brady®, TMM-0-49-PK model, https://www.bradyid.com) affixed to their shell with superglue. The ML of each tagged limpet was measured initially and again on three different occasions: 3 August 2015, 23 November 2015 and 21 March 2016. All field measurements were made with callipers to a resolution of 0.1 mm. After a two-year period had elapsed (Date: 13 June 2017), 18 limpets with their labels still attached were located. ML was measured in situ and they were carefully removed from the rock surface. Their soft tissues were removed in the laboratory and shells rinsed clean with fresh water and air-dried at ambient temperature. A subgroup of 10 shells with the least epibionts or least damage to the growing edge was selected for embedding in resin and growth line validation analysis (Table S1).
Geographic variation in longevity and shell growth rate
Shells of P. depressa were studied from six locations in the British Isles (Figure 1B). They were located at both range edges in N Wales (Criccieth and Shell Island) and S/SE England (Portland Bill and Swanage); and from non-range-edge populations in SW England (Polzeath and Trevone; see Figure 1B).
The abundance of P. depressa and P. vulgata was estimated between June and July 2016 from approximately mean high water neap (HWN) to mean tide level (MTL), where P. depressa reaches its maximum abundances on both semi-exposed and exposed shores (Orton & Southward, Reference Orton and Southward1961; Oróstica et al., Reference Oróstica, Hawkins, Broitman and Jenkins2020). At each location, the total numbers of Patella species were counted in each of ten 0.5 × 0.5 m quadrats along a transect parallel to the coastline, ~1 m apart. From each quadrat, the largest P. depressa with the best-preserved shell was collected. The ML was measured, and the quadrat number of each shell recorded in the field. In the laboratory, the soft tissues were removed, the shells rinsed clean with fresh water and air-dried at ambient temperature before embedding in resin. A subgroup of five shells per location was selected for further age and growth analyses (total shells = 30; Table S2).
Shell embedding and growth line analysis
Shells collected were heavily eroded and thus many samples were excluded from the approach because of the difficulty of counting increments near the shell apex. Thus, 10 shells were used for annual line validation (see Table S1), and 30 shells for age and growth analysis (see Table S2). Each shell was embedded in epoxy resin (Kleer–Set Type FF, Polyester Casting Resin, MetPrep Ltd, UK). Embedded shells were processed using a standard procedure described by Ekaratne & Crisp (Reference Ekaratne and Crisp1982, Reference Ekaratne and Crisp1984). The shells were sectioned using a Buehler ISOMET 5000 precision saw (cut rate 14 mm min−1 at 5000 rpm) along their maximum growth axis from the anterior to posterior side of the shell (see Figure 2B). One half of each resin block was polished using progressively finer grades of abrasive papers (P120, P400, P1200 and P1200/4000; MetPrep Ltd, UK) and finally polished using 2 μm diamond paste (Maiapul Polishing Cloth Diamond, Spectrographic Ltd, UK). Polished shell sections were thoroughly cleaned using detergent and rinsed in tap water, etched for 30 s by immersion in 5% HCl, rinsed with distilled water and air-dried at ambient temperature for 24 h in a fume hood. Dry shell section surfaces were flooded with ethyl acetate and a 0.35 μm thick sheet of acetate film (Replication Material G255, Agar Scientific Ltd, UK) applied to the etched shell surface, then air-dried at ambient temperature for 45 min (see also Richardson et al., Reference Richardson, Crisp and Runham1979). Dry acetate peels were gently removed from the polished shell section, trimmed, and mounted between microscope slides for visual analysis of shell increments under transmitted light microscopy.
High-resolution photographs (5× magnification) of the entire shell section seen in reflected light or acetate peels viewed in transmitted light were taken using a Lumenera Infinity 3 camera (Infinity3–3URC 00199474, Canada) attached to a Meiji Techno Co. MT8100, Ltd, Japan microscope. ImagePro Premier® 9.1.4 (Built 5368, Media Cybernetics®) was used to generate photomontages and to catalogue each sample. Each peel (i.e. a replicate of each shell) was stored and referenced for further measurements.
Identification, determination of periodicity and timing of growth line formation
Shell sections were observed in reflected light whilst acetate peels were viewed in transmitted light to highlight the structural features of the shells. Using both approaches, prominent growth lines were observed in the apex region of the shell and these lines were followed through into the anterior and posterior sides of the shell and the positions of the lines noted and labelled (i.e. line 1, line 2, line 3, etc.; see Figure 3). Only those lines that could be observed both in shell section and acetate peel and traced into both the anterior and posterior sides of the shell were considered to be ‘true’ lines (see Figure 3A, B). Similar growth lines in the apex of the shell of the related species P. vulgata have been validated as forming annually (e.g. Ambrose et al., Reference Ambrose, Locke, Bigelow and Renaud2016).

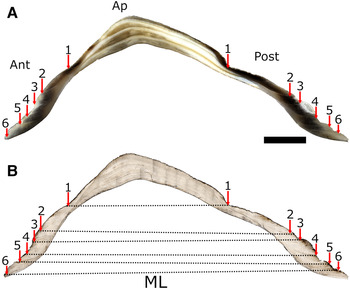
Fig. 3. Photomicrograph of a cross-section of a six-year-old Patella depressa shell showing prominent (annual) lines (arrows) identified in both: (A) reflected light on the resin-embedded shell and (B) transmitted light through an acetate peel. From the apex (Ap) to the shell margin, increment number 6 indicates the last major growth line observed in (A) and (B). Growth rates were calculated by measuring the maximum length (ML, dotted line) at each annual line. Scale bar: A & B, 4 mm.
To establish the periodicity of growth line formation in P. depressa, the position on the shell where they were initially measured at Shell Island (i.e. their initial ML in June 2015, see Table S1) was first identified in the acetate peels of the shell sections of the marked, measured and recovered limpets (N = 10). When the initial ML recorded at Shell Island was transposed onto the matching shell section–acetate peel (see Figure 3) it conveniently corresponded to a distinct line deposited when the shell was disturbed during labelling and initial measurement. The number of distinct growth lines deposited in the anterior and posterior sides of each shell was counted. Without exception, two lines corresponding to 2015–16 and 2016–17 were observed in all 10 shells, demonstrating unequivocally that the lines observed in the shell were formed annually. Timing of growth line deposition was established by transposing the ML measurements taken on the three other occasions in the field (see above), i.e. in August and November 2015, and in March 2016 onto the relevant shell section–acetate peel (Table S1). In all shells, the growth line in 2015–16 was deposited between the November 2015 and March 2016 measurements, indicating winter line deposition.
Growth rate estimations
Five P. depressa shells from each location were selected to study their shell growth (see above; Table S2). Annual lines in these shells were identified in both the anterior and posterior growing edges, counted to determine age and their positions marked on a photomicrograph image of the shell section–acetate peel. To check that the growth lines had been correctly identified in both growing edges, the cumulative distance between the shell apex and each annual line was measured in both growing edges of shells, from each population-region, and compared using a paired samples t-test (Gotelli & Ellison, Reference Gotelli and Ellison2013). No significant difference between the annual shell growth of the anterior and posterior growing shell-edges was observed (N Wales: t-value = −1.99, df = 143.85, P = 0.053; SW England: t-value = −1.87, df = 148.89; P = 0.062; S/SE England: t-value = −1.97, df = 143.88, P = 0.052), demonstrating that the positions of the annual lines had been identified consistently and correctly in both growing shell-edges.
To evaluate if the number of annual lines (i.e. limpet age) varied between the two range-edges and non-range-edge populations of P. depressa, analysis of variance with two factors was performed (ANOVA; Gotelli & Ellison, Reference Gotelli and Ellison2013). The two factors included were: (1) Region as a fixed factor, with three levels: N Wales, SW England and S/SE England; and (2) Location as a random factor, nested within Region. Subsequently maximum length (ML) between the anterior and posterior growing edges at each growth line was measured directly from the shell section–acetate peels and/or photomicrographs (Figure 3). Von Bertalanffy growth (VBG) curves were fitted to the mean ML at age data for each limpet population at each location. The VBG parameters were estimated following the equation defined by:
 $$L_{\rm t}\,{\rm} = L_\infty ( {{\rm 1\ }\ndash e [ {\ndash K ( {t \ndash t_ 0} ) } ] } ) $$
where L t is the length at time t, L ∞ is the theoretical ML that species would reach, the K parameter is a growth coefficient estimating how fast the individual approaches L ∞ and t 0 is the theoretical age at zero length. Ford–Walford plots were used to estimate L ∞ and K (King, Reference King2007). A Ford–Walford plot shows the linear relationship between L t against the length at t + 1 (L t +1). From this relationship, L ∞ and K can be calculated from the straight-line equation where L ∞ = y − intercept/(1−slope) and K = − ln (slope) (King, Reference King2007). The remaining parameter in the von Bertalanffy growth equation, t 0, can be estimated if length at a particular annual line is known (King, Reference King2007). Therefore, from the von Bertalanffy equation, t 0 may be calculated as follows:
 $$t_0 = t + ( {1 / K} ) \times ( {{\rm ln\ }[ {( {L_\infty - L_t} ) / L_\infty } ] } ) $$
In addition, comparisons based on these parameters between locations and regions were made. Furthermore, as in fishes and invertebrates, whose growth can also be described by the von Bertalanffy function, comparisons were also made through the overall growth performance index, i.e. Ø’ = log K + 2log L ∞ (see Clarke et al., Reference Clarke, Prothero–Thomas, Beaumont, Chapman and Brey2004; Pörtner et al., Reference Pörtner, Storch and Heilmayer2005 for details). According to Pauly (Reference Pauly1979), Ø’ describes the growth rate at the point of inflection of the von Bertalanffy growth curve (i.e. maximum growth rate; Heilmayer et al., Reference Heilmayer, Grey and Pörtner2004). The TropFishR package was used to build Ford–Walford plots and estimate von Bertalanffy parameters in the CRAN R project environment (R Core Team, 2019, v3.5.3; Mildenberger et al., Reference Mildenberger, Taylor and Wolff2017).
Effect of limpet density on shell growth
Variation in the growth coefficient (VBG–K) among regions, was determined using analysis of covariance (ANCOVA; Gotelli & Ellison, Reference Gotelli and Ellison2013), with two factors: Region (three levels: N Wales, SW England and S/SE England) and Location (two levels) nested in Region, and a covariate of total limpet density, i.e. total limpet number recorded in the individual quadrats where shells were collected for age and growth analysis (June–July 2016; see above). Density-dependent competition, both inter-specific (based on the density of P. vulgata) and intra-specific effects (based on the density of P. depressa) was examined by determining the relationship of density with the VBG–K of each individual (N = 5) collected at each location. In addition, R 2 was calculated for each relationship between individual K values of P. depressa and the total density of limpet species (i.e. total limpets, see above) and the density of P. vulgata and P. depressa when considered singly (Gotelli & Ellison, Reference Gotelli and Ellison2013). Bartlett's tests were used to check the normality of the residual variances before using both ANOVA and ANCOVA (Gotelli & Ellison, Reference Gotelli and Ellison2013). Tukey's post hoc tests were carried out for pairwise comparisons.
Results
Under low power magnification all the sectioned limpet shells revealed pronounced annual growth lines in both reflected light on the shell sections and in transmitted light through the acetate peels (Figure 3A, B). Viewed at high magnifications many fine bands were observed in the acetate peels between the obvious strongly defined annual lines (Figure 3B). In some limpet species these fine bands are deposited tidally (see Ekaratne & Crisp, Reference Ekaratne and Crisp1984; Crisp et al., Reference Crisp, Wieghell and Richardson1990; Richardson & Liu, Reference Richardson, Liu and Morton1994). In P. depressa shell sections, the low-contrast, weakly defined bands radiate from the apex towards the edges of the shells (Figure 3A). The separation between these bands becomes reduced as they gradually merge to form a single high-contrast growth line. From the seasonal shell samples it was possible to constrain the timing of line formation to the winter period between November 2015 and March 2016 when shell growth ceased. This growth cessation is characterized by a change in the orientation of the micro-growth bands towards the shell surface (Figure 3B). A similar pattern has been observed in P. depressa, and in the top shell P. lineatus (see García-Escárzaga et al., Reference García-Escárzaga, Gutiérrez-Zugasti, Schöne, Cobo, Martín–Chivelet and González-Morales2019, Reference García-Escárzaga, Gutiérrez-Zugasti, González-Morales, Arrizabalaga, Zech and Roberts2020).
Age patterns in P. depressa
Shells displayed significant geographic differences in the number of annual lines among the two range-edges and non-range-edge populations (two-way ANOVA: F (2,24) = 13.8, P < 0.05). Limpets collected from the poleward edge in N Wales had a significantly greater number of annual lines (between nine and ten lines; see also growth curves in Figure 4), when compared with individuals at non-range-edge populations in SW England (six and eight lines per shell) and those at the range-edge populations in S/SE England (between six and seven lines per shell; Tukey's post hoc test, P < 0.05).

Fig. 4. Von Bertalanffy growth (VBG) curves fitted to maximum length (ML) at age-data for shells of Patella depressa from two range edges populations: (A) N Wales (CR = Criccieth and SI = Shell Island) and (C) S/SE England (PB = Portland Bill and SG = Swanage); and (B) from non-range-edge populations in SW England (PO = Polzeath and TR = Trevone). See Table 1 for parameters of each VBG curve.
Growth rate in P. depressa
The 18 tagged and measured P. depressa from Shell Island (N Wales) displayed an average increase in ML of ~6 mm over the 2-year period in the field (2015–17). The Von Bertalanffy growth (VBG) plots of limpets showed different growth patterns between the two range-edge populations (Table 1; Figure 4A–C). Patella depressa from S/SE England (Figure 4C) had higher K values and higher growth performance indices (Ø’) compared with shells from N Wales (Table 1, Figure 4A). Rapid growth was identified in shells collected from range-edge populations in S/SE England, where most individuals reached over 30 mm in ML by the fourth or fifth annual line at Portland Bill and by the sixth line at Swanage (Figure 4C). By contrast, shells collected from the poleward populations in N Wales showed slower shell growth to reach their asymptotic maximum (i.e. flatter growth curves) with most shells only reaching a ML > 30 mm between the seventh and tenth annual line (Figure 4A). Individuals collected from the non-range-edge populations (Figure 4B), showed both faster (i.e. Trevone) and slower (i.e. Polzeath) annual shell growth than individuals from both range edges, where individuals reached over 30 mm ML in 5 or 6 years with the greatest L ∞ in shells from Trevone (Table 1).
Table 1. Summary of calculated von Bertalanffy growth (VBG) parameters (i.e. K, L ∞ and t 0) using Ford–Walford plots for five shells selected in June/July 2016 at each location

There are three regions, defined by two range edges of Patella depressa: N Wales and S/SE England; and by non-range-edge populations in SW England. L ∞ (mm) is the theoretical maximum length that species can reach; K (year −1) is a measurement of the rate at which the maximum size can be reached; and t 0 is the theoretical age at zero length. Maximum length (L max) and Growth Performance index, i.e. Ø’ = log K + 2log L ∞ are also indicated (see Clarke et al., Reference Clarke, Prothero–Thomas, Beaumont, Chapman and Brey2004 for details). The VBG curves are indicated in Figure 4.
Density-dependent effects on limpet shell growth
At the quadrat scale (50 × 50 cm), the variation in the growth coefficient (K) was significantly negatively affected by the combined total density of P. depressa and P. vulgata present (ANCOVA: F (1, 18) = 62.2, P < 0.05; Figure 5). Patella depressa with higher K values were found amongst lower limpet densities across range-edge and non-range-edge populations (Figure 5). K values also differed significantly among regions (ANCOVA: F (2, 18) = 10.7, P < 0.05; Figure 5), but the interaction between limpet density and region was not significant (P > 0.05). Furthermore, inter- and intra-specific relationships across sites indicated that K values of P. depressa shells were more negatively affected by P. depressa density than P. vulgata density (Figure 6). High intra-specific effects amongst P. depressa were observed across all the selected regions, especially in the range-edge populations in N Wales (R 2 = 0.51; P = 0.02; Figure 6A) when compared with the range-edge in S/SE England (R 2 = 0.46; P = 0.03; Figure 6C). Although the relationship between K values of P. depressa with density of P. vulgata was not significant in range-edge populations in S/SE England (R 2 = 0.33; P = 0.08; Figure 6C), it was in N Wales (R 2 = 0.58; P = 0.01; Figure 6A), with both species showing strong and similar intra- and inter-specific relationship at non-range-edge populations in SW England (P < 0.05; Figure 6B).
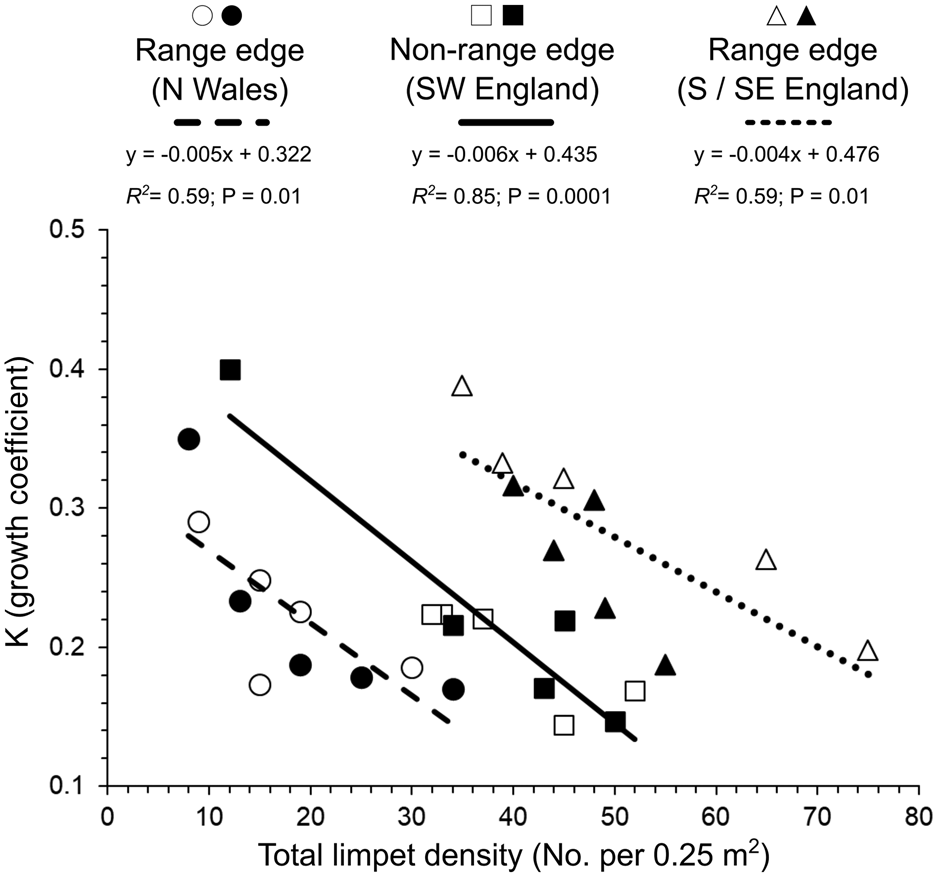
Fig. 5. Relationship between individual Patella depressa growth coefficients (K) and total limpet density (combined number of P. depressa and Patella vulgata in 0.25 m2) measured in June–July 2016 at each region, defined by two range edges of P. depressa: N Wales (Criccieth = ○; Shell Island = ●) and S/SE England (Portland Bill = △; Swanage = ▴); and by non-range-edge populations in SW England (Polzeath = □; Trevone = ■). Linear regression lines fitted to the data and R 2 are indicated for each region.

Fig. 6. Negative relationships between individual Patella depressa growth coefficients (K; calculated from five shells) and P. depressa density (double black outline on symbols, N = 10) and Patella vulgata density (single outline on symbols, N = 10) at each location. Limpet density was measured in June–July 2016 at each region, defined by two range edges of P. depressa: (A) N Wales (Criccieth = ○; Shell Island = ●) and (C) S / SE England (Portland Bill = △; Swanage = ▴); and by (B) non-range-edge populations in SW England (Polzeath = □; Trevone = ■). Linear regression lines fitted to the data and R 2 are indicated.
Discussion
Our results showed that age, indicated by annual lines in shells, and growth performance, determined by their K values (growth coefficients) differed between the two range-edges of distribution of P. depressa. Our findings do not support the hypothesis that the two separate boundaries of P. depressa have older individuals with slower growth rates than non-range-edge populations. Individuals of P. depressa from the range-edge in S/SE England grew faster and had fewer annual growth lines than individuals from the poleward edge in N Wales. This suggests rapid annual growth rates in shells collected from the range-edge in S/SE England, indicating less long-lived individuals than individuals in N Wales. In addition, there was no clear variation in age and growth patterns between non-range-edge populations in SW England and those at either of the range edges. These observations suggest that both range-edge and non-range-edge populations of P. depressa could be characterized by different individual performance traits, which can be imprinted in shells as growth records (García-Escárzaga et al., Reference García-Escárzaga, Gutiérrez-Zugasti, González-Morales, Arrizabalaga, Zech and Roberts2020). Furthermore, density-dependent processes negatively affected individual growth performance (K values) of P. depressa at the scale of the habitat-patch (i.e. individual quadrats).
Shell growth of P. depressa at poleward boundaries
Our study has shown that shell growth of P. depressa has different patterns at their two leading poleward edges of distribution that occur within Britain. This can be explained by regional differences in seawater temperature (Hiscock et al., Reference Hiscock, Southward, Tittley and Hawkins2004) and inter-individual variations in the duration and intensity of both growth cessation and slow-down periods because of reproduction (e.g. see Gutiérrez-Zugasti et al., Reference Gutiérrez-Zugasti, Suárez-Revilla, Clarke, Schöne, Bailey and González-Morales2017 for P. vulgata; García-Escárzaga et al., Reference García-Escárzaga, Gutiérrez-Zugasti, González-Morales, Arrizabalaga, Zech and Roberts2020 for P. depressa). Regional differences in sea surface temperatures suggest that faster growth rates recorded in limpets at the range edge of P. depressa in S/SE England may be a consequence of warmer summer temperatures when compared with conditions in N Wales (Oróstica et al., Reference Oróstica, Hawkins, Broitman and Jenkins2020), enabling early onset of the growth season and longer duration into the autumn. In addition, there is evidence of earlier onset of maturation in P. depressa during early spring and a prolonged spawning season into the autumn in recent years as a response to global warming (Orton & Southward, Reference Orton and Southward1961; Moore et al., Reference Moore, Thompson and Hawkins2011). The complex interaction between the energetic cost of gonad maturation (Blackmore, Reference Blackmore1969; Wright, Reference Wright1977; Wright & Hartnoll, Reference Wright and Hartnoll1981), seasonal foraging activity patterns and microbial food availability (Jenkins et al., Reference Jenkins, Arenas, Arrontes and Bussell2001; Thompson et al., Reference Thompson, Norton and Hawkins2004) need further exploration throughout the range of limpets and other gastropod species.
Shells from non-range-edge populations in SW England showed both faster and slower annual growth patterns than individuals from both range-edges of P. depressa, depending on the specific location. In this context, sclerochronological approaches in shells have shown that the patterns of annual lines can vary even within individuals of the same species (see Surge et al., Reference Surge, Wang, Gutiérrez-Zugasti and Kelley2013 for P. vulgata; García-Escárzaga et al., Reference García-Escárzaga, Gutiérrez-Zugasti, González-Morales, Arrizabalaga, Zech and Roberts2020 for P. depressa). For instance, Surge et al. (Reference Surge, Wang, Gutiérrez-Zugasti and Kelley2013) found a mix between summer and winter annual lines in P. vulgata shells from the English Channel, where the biogeographic boundary between the cold- and warm-temperate regions can be found (Hiscock et al., Reference Hiscock, Southward, Tittley and Hawkins2004). Conversely, in regions with cooler sea temperatures, shells have a slow growth rate and form a prominent annual line during winter (Fenger et al., Reference Fenger, Surge, Schöne and Milner2007; Surge et al., Reference Surge, Wang, Gutiérrez-Zugasti and Kelley2013). A similar pattern has been found for P. depressa in northern Spain (nearer the centre of its geographic distribution), where individuals had growth cessations in winter, during the coldest months of the year, and occasionally also in summer, perhaps associated with strong upwelling (García-Escárzaga et al., Reference García-Escárzaga, Gutiérrez-Zugasti, González-Morales, Arrizabalaga, Zech and Roberts2020). Our annual growth line validation using tagged individuals of P. depressa from N Wales agrees with these findings and multiple shell measurements at intervals throughout the year indicated that the annual line formed at the end of the year (i.e. winter, between November 2015 and March 2016, in N Wales, UK), when the seawater temperatures are at their coldest (see Oróstica et al., Reference Oróstica, Hawkins, Broitman and Jenkins2020, their fig. 2). By contrast, individuals of P. vulgata inhabiting the north of Spain (toward the equatorward range-edge of its geographic distribution), form a noticeable annual line in mid-summer, presumably due to heat stress (Surge et al., Reference Surge, Wang, Gutiérrez-Zugasti and Kelley2013). Further growth analysis using sclerochronological techniques on shells of P. depressa could elucidate annual growth line patterns across poleward edge, central and equatorward edge populations.
Age pattern of P. depressa at poleward boundaries
Populations of P. depressa were shown to have different age patterns at their two leading edges. Further south, in central populations of P. depressa (Silva et al., Reference Silva, Boaventura and Ré2003), growth rates of individuals were slightly higher compared with those individuals at higher latitudes (Oróstica et al., Reference Oróstica, Hawkins, Broitman and Jenkins2020), which could suggest a shorter lifespan for those individuals in Portugal (Guerra & Gaudencio, Reference Guerra and Gaudencio1986; Lewis, Reference Lewis1986). However, the values of growth parameters (K and Ø’) we found were lower when compared with other patellacean species (i.e. Nacella, Scutellastra, Cymbula and Acmaea; see Branch, Reference Branch1981; Clarke et al., Reference Clarke, Prothero–Thomas, Beaumont, Chapman and Brey2004 for review). Northern populations of southern species are characterized by short reproductive periods in summer and frequent recruitment failures (Bates et al., Reference Bates, Pecl, Frusher, Hobday, Wernberg, Smale, Sunday, Hill, Dulvy, Colwel, Holbrook, Fulton, Slawinski, Feng, Edgar, Radford, Thompson and Watson2014). This can generate a latitudinal pattern, whereby marginal regions have an irregular limpet age structure with missing year classes and dominated by older and larger individuals (Lewis et al., Reference Lewis, Bowman, Kendall and Williamson1982; Lewis, Reference Lewis1986). Analysis of the age of P. depressa suggests that the patterns obtained here are not that far from those calculated for other limpet populations in Britain (Lewis & Bowman, Reference Lewis and Bowman1975; Wright, Reference Wright1977), supporting a gradient of increasing age of P. depressa from Portugal (~3 years old; Guerra & Gaudencio, Reference Guerra and Gaudencio1986; Lewis, Reference Lewis1986), to southern England (6–8 years old, this study) and N Wales (9–10 years old, this study). Studies on the northern cold-water species P. vulgata estimated a maximum lifespan in the Isle of Man (UK) of between 12 and 17 years (Wright, Reference Wright1977), and between 15 and 17 years in north-east England (Lewis & Bowman, Reference Lewis and Bowman1975). By contrast, further south at its equatorward limit in Portugal, size-frequency data suggest that P. vulgata has a lifespan of no more than 3 or 4 years (Guerra & Gaudencio, Reference Guerra and Gaudencio1986), indicating that latitudinal effects can influence population age-structure in limpet species (Lewis & Bowman, Reference Lewis and Bowman1975; Wright, Reference Wright1977; Lewis et al., Reference Lewis, Bowman, Kendall and Williamson1982; Guerra & Gaudencio, Reference Guerra and Gaudencio1986; Lewis, Reference Lewis1986).
Density-dependent effects on shell growth of P. depressa
In reconstructing shell growth measurements from the annual growth lines we have clearly shown that an increase in total limpet density negatively affected the growth of P. depressa. This pattern was supported by the negative relationship between growth performance (K values) of P. depressa and total limpet density (P. depressa plus P. vulgata). There are contrasting effects of limpet density on shell growth performance based on the scale used across range-edge and non-range-edge populations (see Oróstica et al., Reference Oróstica, Hawkins, Broitman and Jenkins2020 for details). This is the first time that this population process has been observed at such small spatial resolution in P. depressa from unmanipulated local areas (but see Boaventura et al., Reference Boaventura, da Fonseca and Hawkins2002, Reference Boaventura, da Fonseca and Hawkins2003 and Moore et al., Reference Moore, Hawkins and Thompson2007 for experimental studies). At a quadrat scale, we found localized and negative effects of limpet density on growth performance. In addition, greater intra-specific effects on growth performance between P. depressa individuals were detected, compared with the inter-specific effects with P. vulgata density. There was, however, a stronger inter-specific effect of P. vulgata on the growth of P. depressa in N Wales than at the eastern range-edge in S/SE England. Previous experimental studies show a similar pattern (see Boaventura et al., Reference Boaventura, da Fonseca and Hawkins2002, Reference Boaventura, da Fonseca and Hawkins2003 and Moore et al., Reference Moore, Hawkins and Thompson2007; Firth & Crowe, Reference Firth and Crowe2008, Reference Firth and Crowe2010). Lewis & Bowman (Reference Lewis and Bowman1975) for example suggested that intra-specific competition in P. vulgata arises in areas with densities above 300–450 limpets m−2, which are likely to reduce individual growth rates (Branch, Reference Branch1981). These patterns suggest that growth rates in limpet species are highly variable, subject to abiotic and biotic factors (Branch, Reference Branch1981) at various geographic and temporal scales as well as human impacts (Fenberg & Roy, Reference Fenberg and Roy2012; Borges et al., Reference Borges, Hawkins, Crowe and Doncaster2016; Martins et al., Reference Martins, Borges, Vale, Ribeiro, Ferraz, Martins, Santos and Hawkins2017), with local processes being important to consider at species range edges (Helmuth et al., Reference Helmuth, Mieszkowska, Moore and Hawkins2006).
Conclusions
Our study has measured individual growth rates and determined age using validated annual line deposition in range-edge populations of P. depressa. Von Bertalanffy growth parameters indicated that range-edge individuals in S/SE England performed better (i.e. grew faster) than poleward individuals in N Wales. In addition, annual growth line analysis in P. depressa suggests a population structure consisting of mainly older individuals with slower growth rates in poleward N Wales populations than in range-edge populations in S/SE England. Limpet density at the quadrat scale influenced individual growth performance, with intra-specific effects more important than inter-specific effects. Our field validation of annual line formation in shells of P. depressa has suggested a winter season of formation (i.e. November to March) in populations at their northern boundaries (i.e. N Wales). However, a better understanding of the timing of annual growth line formation in P. depressa over longer temporal as well as larger spatial scales could disentangle the mechanisms that underpin differences in shell growth and age structure seen in this study.
Supplementary material
The supplementary material for this article can be found at https://doi.org/10.1017/S0025315421000539
Acknowledgements
This paper arose from the PhD thesis of M.H.O. under the doctoral programme at Bangor University, UK. M.H.O. is grateful for access to the Sclero–lab (School of Ocean Sciences, Bangor University) and the laboratories of S.R.J. and S.J.H. Funding for this research was provided through a personal PhD scholarship from the Chilean National Commission for Scientific and Technological Research (CONICYT) and funding for fieldwork via the Marine Biological Association of the UK (MBA). J.E.M. received funding from the Seventh Framework Programme of the European Community (FP7 People: Marie Curie Actions; Grant number 604802).


 Open access