
Ecological Study of Aquaponics Bacterial Microbiota over the Course of a Lettuce Growth Cycle

Integrated and Urban Plant Pathology Laboratory, Gembloux Agro-Bio Tech, University of Liège, Passage des Déportés 2, 5030 Gembloux, Belgium
*
Author to whom correspondence should be addressed.
†
These authors contributed equally to this work.
Water 2021, 13(15), 2089; https://doi.org/10.3390/w13152089
Submission received: 24 June 2021
/
Revised: 27 July 2021
/
Accepted: 28 July 2021
/
Published: 30 July 2021
(This article belongs to the Section Water, Agriculture and Aquaculture)
Abstract
:The study of microorganisms in aquaponics is an important topic which requires more research before exploiting the full potential of beneficial microorganisms. In this experiment, we focused on the evolution over time of the bacterial communities in four compartments of an aquaponic system i.e., the sump, the biofilter, the lettuce rhizoplane and lettuce root. We studied these communities over the course of a lettuce growth cycle via regular sampling and sequencing of the 16S rRNA gene of the collected bacteria. We also followed the physicochemical parameters of the aquaponic water throughout the experiment. Results show that a different community could be found in each compartment and that all four communities were stable throughout time and resilient to naturally occurring water parameter changes which characterize functioning aquaponic systems. Furthermore, the communities of the sump and biofilter also seem stable over the years as the predominant taxa (Luteolibacter, Flavobacterium, Nitrospira) observed in our study are similar to the ones previously reported for this aquaponic system. Finally, our results provide proof for similarities between aquaponic and soil borne lettuce root communities (gammaproteobacteria, Flavobacterium, Pseudomonadaceae, Sphingomonadaceae) thus showing that aquaponics can be similar to soil production in terms of microbial life.
1. Introduction
Aquaponics is a combination of hydroponics and recirculating aquaculture, i.e., of plants and fish rearing [1]. However, plants and fish could not thrive without the help of microorganisms which constitute a bridge between the two main types of living organisms of an aquaponic system [2,3,4]. Indeed, in aquaponics, microorganisms are mostly known for their role in the conversion of the potentially toxic ammonia excreted by the fish into nitrite and nitrate, i.e., the nitrification process.
Nevertheless, microorganisms in aquaponics are also assumed to have other beneficial effects on plants such as those observed in soils [3,4], but precise knowledge is currently scarce. Indeed, conversely to soil borne plants [5,6,7,8], the phytobiome of aquaponic crops is barely known while it could prove highly beneficial for plant health and yields in aquaponics. Recent studies are therefore focusing their efforts on the characterization and understanding of the complex microbial communities present in the different compartments of an aquaponic system and the relationships between those communities and plant health and care.
Schmautz et al. [2] have focused on the microbial communities present in the different compartments of an aquaponic system, discovering that each compartment (i.e., biofilter, periphyton, plant roots and fish feces) have quite distinct communities with the fish feces community being utterly different from the others. This observation has been corroborated by Eck et al. [9] whom compared the sump and biofilter compartments of a coupled aquaponic system.
Eck et al. [10] have also analyzed the microbial communities in several diversified aquaponic and aquaculture systems across North Western Europe. According to this study, each aquaponic/aquaculture system has its own microbial community, with an important diversity between systems. This has been confirmed by Bartelme et al. [11] whom have also investigated different aquaponic and aquaculture systems and noticed that the design and the water source greatly influenced the composition of the microbial communities. However, Eck et al. [10] still detected 17 Operational Taxonomic Units (OTUs) common to 5 different aquaponic systems (coupled and decoupled) and 34 OTUs common to 4 decoupled systems.
Finally, Sanchez et al. [3] have started tackling the topic of plant beneficial microorganisms in aquaponics. They have thus discovered that some bacterial strains originating from aquaponic systems were able to produce siderophores and ammonia and to solubilize phosphorus. The genera thus identified were the following: Dietzia, Gordonia, Microbacterium, Mycobacterium, Rhodococcus, Bacillus, Paenibacillus, Myroides, Acidovorax, Chromobacterium, Aeromonas, Plesiomonas and Pseudomonas.
However, most of these studies are one-off and do not follow the microbial communities throughout time. To our knowledge, the only time study of aquaponic microbiota was conducted in our laboratory in which the microbial communities of the sump and biofilter of a coupled aquaponic system were studied for 3 consecutive weeks [9]. Our current study therefore aims at addressing this gap in current knowledge by shedding more light on the kinetics of the microbial communities in one system. Our aquaponic system (described for the first time in Delaide et al. [12]) has thus been surveyed over the course of 9 weeks, at the beginning of the relaunch of the system after the winter fallow period. On the one hand, regular samplings of microbial communities were carried out in several compartments (sump, biofilter, rhizoplane and root) to follow the evolution of these communities throughout time, while on the other hand, the system’s basic parameters were monitored during the whole experiment (pH, temperature (T°), electroconductivity (EC), nutrients) in order to link potential microbiota modifications with changes in those parameters. To follow the evolution of bacterial communities throughout those 9 weeks, i.e., from the introduction of lettuce in the recirculating system to the final harvest, bacterial communities were characterized with partial 16S rRNA gene high throughput sequencing.
2. Materials and Methods
2.1. Description of the Aquaponic System
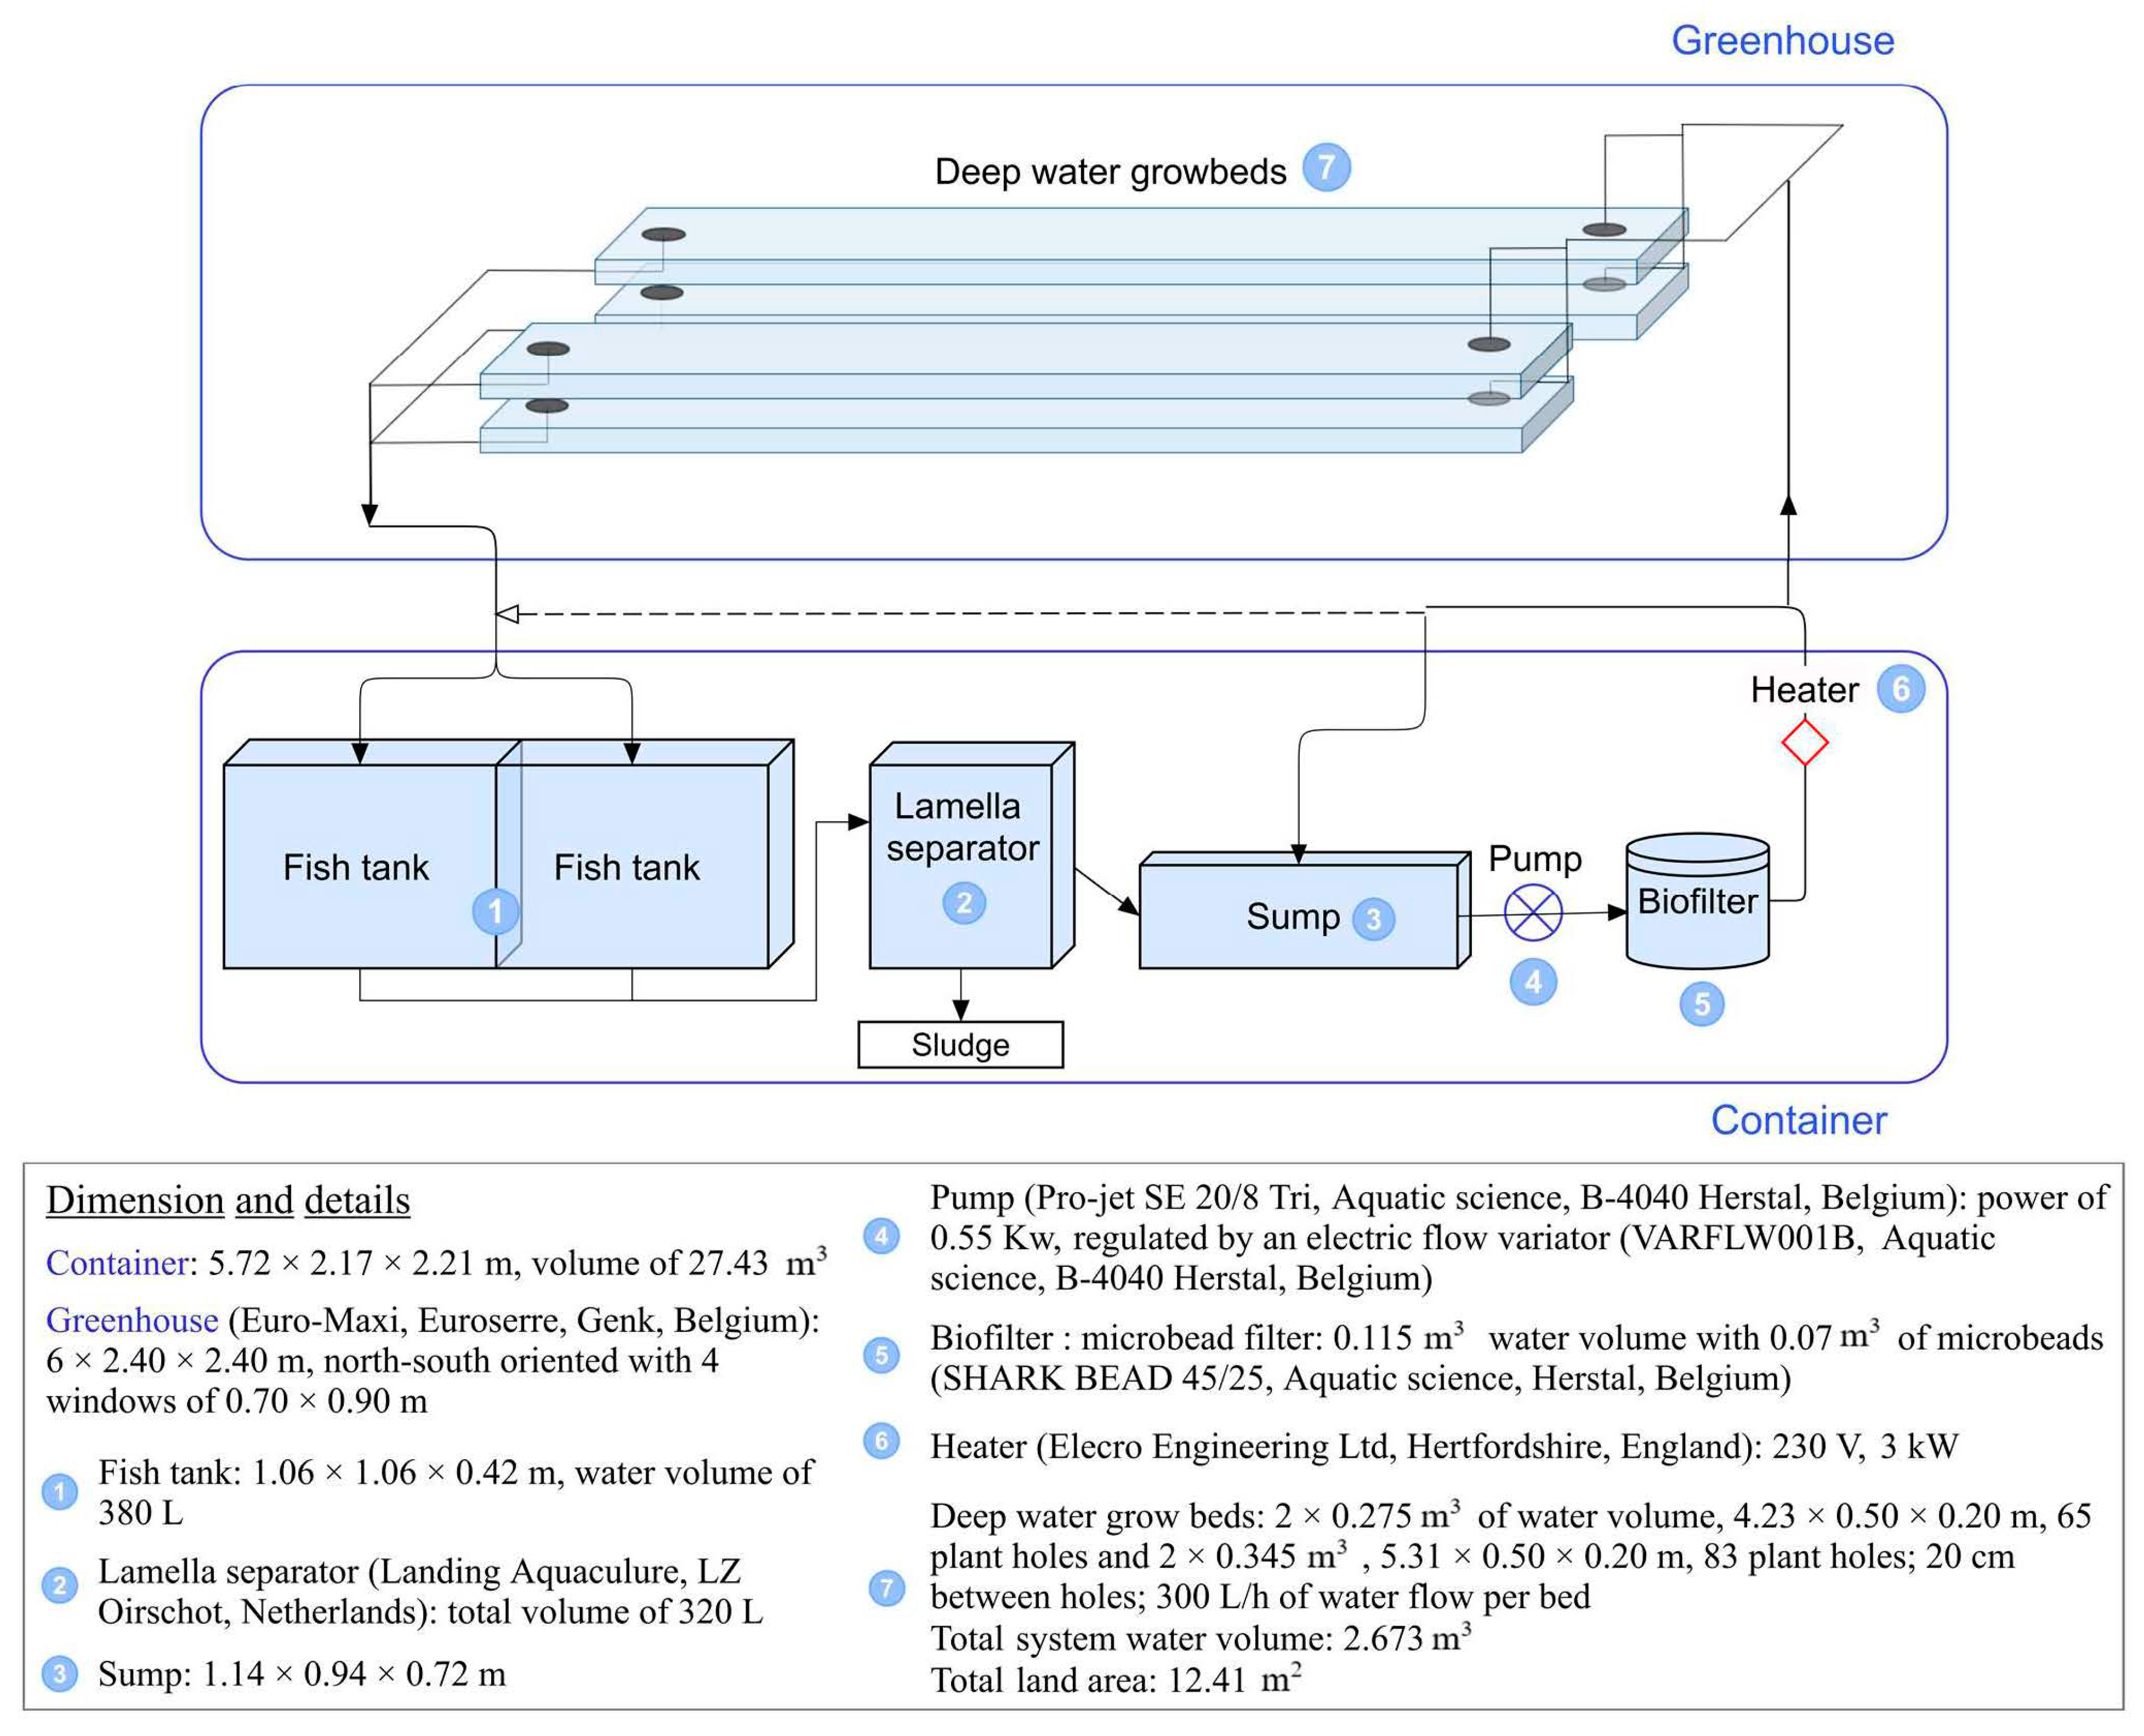
The experiment was conducted in the small scale, closed-loop, aquaponic system of the Integrated and Urban Plant Pathology Laboratory (IUPPL) of Gembloux Agro-Bio Tech (Gembloux, Belgium), named the Plant and Fish Farming box (PAFF Box) and already described in Eck et al. [10]. Figure 1 summarizes the functioning of the PAFF Box and provides additional technical information.
2.2. Experimental Set-Up
Prior to the experiment, the PAFF Box had been running for almost three months without plants, from mid-December 2018 to the end of February 2019 and was operating as a simple recirculating aquaculture system (RAS), using only the compartment containing the fish. The biofilter was maintained by the presence of 34 Nile Tilapia (Oreochromis niloticus L.) in both tanks. Furthermore, the hydroponic compartment went through a fallow period during which the deep water grow beds were entirely emptied, cleaned and bleached. At the end of February 2019, 1000 L of tap water were added to the hydroponic compartment which was then re-connected to the system. The feed (Trouw Nutrition, Putten, The Netherlands) was plant and animal based (processed animal protein from poultry and fish meal).
On 27 February 2019, 90 seeds of Butterhead lettuce (Lactuca sativa var. Lucrecia rz, Rijk Zwaan) were sowed in rockwool plugs (Grodan ROCKWOOL B.V., Roermond, Netherlands) soaked with tap water in a climate and light controlled greenhouse as Resh [13] recommends. After 10 days of germination, on March 8, 80 seedlings (Group 1) were transferred with their rockwool plugs in the two top grow beds of the hydroponic compartment. The 10 remaining seedlings were used for the first root sampling for which the preparation is described hereafter. On the same day, the sump and biofilter samples were also collected and prepared as explained below.
Lettuce seedlings obtained from the same seed lot and germinated in the same conditions than the first group were added once a week starting on the second week of the experiment to the grow beds to counterbalance the loss of plants due to sampling (harvest of 10 lettuces per sampling day). The experiment lasted 9 weeks and ended on 13 May 2019.
2.3. Water and Nutrient Management and Measurements
Several water parameters were monitored throughout the experiment in order to follow the general evolution of the PAFF Box and correlate potential microbiota variations to water parameters’ variations. The temperature (T), pH, dissolved oxygen (DO) and electro-conductivity (EC) of the circulating water were measured with an aquarium probe (IKS Aquastar Industrial Version 2.28, IKS ComputerSysteme GmbH, Karlsbad, Germany). From March 8 to April 4, the four parameters were manually recorded in a heterogeneous frequency, ranging from twice a day to once in 5 days, as a problem occurred and the probe did not save the data. From April 5 to April 25, T, pH and EC were measured every 15 min but the probe did not save the DO data. From April 26 to the end of the experiment, on May 13, the four parameters were measured twice a day, at 12 a.m. and 12 p.m. Nitrate (NO3−) was measured every 15 min with an optical sensor (TriOS Optical sensor, TriOS Mess- und Datentechnik GmbH, Rastede, Germany) throughout the entire experiment, from 8 March to 13 May 2019.
2.4. Sampling
Samples collected for the isolation of bacterial communities were taken from four different compartments of the system: (1) the water entering the hydroponic compartment, after it went through the biofilter; (2) the biofilter itself; (3) the lettuce rhizoplane, i.e., the root surface and (4) the rest of the lettuce root.
Each water sample was composed of two liters of aquaponic water which were vacuum filtered on 0.2 µm filters (PALL Life Science Supor 200, 47 mm diameter) [10]. The collected microorganisms were then re-suspended in 30 mL of sterile 0.05M KPBT buffer (0.005%, tw 80, pH 6.5) and the suspension was centrifuged to collect the pellet. This pellet was then stored at −80 °C in a 30% glycerol solution for later analysis.
Each of the biofilter samples consisted of 15 g of beads in 30 mL of the KPBT buffer which were vortexed for 2 min before undergoing 5 min of ultrasonic bath (Ultrasonic cleaner, model USC600T, VWR, Leuven, Belgium). The beads were then removed and the remaining bacterial suspension centrifuged and the pellet stored in 30% glycerol at −80 °C.
To collect the rhizoplane microorganisms, the roots of 10 lettuces were pooled together. When the lettuces were still small, the entire root system was used while when they were more developed, only 0.2 g of roots per lettuce were kept to reach a total maximum weight of 2 g. The washing step then consisted in placing the root samples in a 0.05 M KPBT buffer and to sonicate them for 10 min in an ultrasonic bath. Roots were then stored aside and the solution was filtered through a sterile cheesecloth to remove root debris. The roots were then rinsed again by vortexing for 30 s in 10 mL of KPBT buffer. The ensuing 10 mL were then filtered again with a cheesecloth and added to the first wash [14]. The total suspension was centrifuged to collect a pellet which was stored at −80 °C in a 30% glycerol solution. Only one washing step was performed as advised by Sare and Stouvenakers et al. [14] as one wash suffices to collect the majority of the rhizoplane microbiota. The washed roots were then instantly frozen in liquid nitrogen and stored at −80 °C for later collection of the remaining microorganisms tightly attached to the roots and endophytes. This second part of the root microbiota will from here on be named as “root microbiota”.
For the extraction of the root microbiota, roots were quickly defrosted at 55 °C for 5 min then ground in a mesh bag with 0.05M KPBT buffer. The resulting solution was then filtered through sterile cheesecloth and 30% glycerol was added before storing at −20 °C.
Samples were taken at higher frequency during the first 3 weeks as the system was expected to undergo important changes right after the introduction of plants, transitioning from a RAS to an aquaponic system.
Disease symptoms appeared on the group 1 plants during the fifth week, i.e., stunted growth, yellowing and wilting of the older leaves, necrosis of the roots (Supplementary Materials, Figure S1). Therefore, the focus of the experiment was shifted to a second group of lettuces aged four weeks also present in the PAFF Box (group 2). Group 1 lettuces were thus used for the 1st, 2nd and 3rd weeks of sampling, group 1 and 2 were used for the 4th week of sampling to ensure a correct overlap (05/04 corresponding to group 1 and 29/04 to group 2). Group 2 lettuces were then used for the 5th and 6th week of sampling. Figure 2 summarizes the sampling dates as well as the other manipulations performed on the system over the course of the experiment.
2.5. DNA Extraction
In order to prepare the samples that had been kept at −80 °C or −20 °C for DNA extraction, a rapid defrosting was made by placing them in a 55 °C heat chamber (Thermoshake, Gerhardt GmbH & Co., Königswinter, Germany) for 5 min. After being vortexed for 15 s and centrifuged 20 min at 2350× g, the pellets of the water, biofilter and rhizoplane samples could be used for DNA extraction. The root microbiota samples, i.e., grinded roots with buffer, were used in their present state. The DNA was extracted with the FAST DNA Spin kit (MP Biomedicals, CA, USA) following the steps described in Eck et al. [10].
2.6. Sequencing
The V1–V3 hypervariable regions of the 16S rRNA gene were amplified with the 2X KAPA HiFi HotStart ReadyMixPCR kit (KAPA Biosystem) and the 27F (5′-TCGTCGGCAGCGTCAGATGTGTATAAGAGACAGAGAGTTTGATCCTGGCTCAG-3′) and 534R (5′-GTCTCGTGGGCTCGGAGATGTGTATAAGAGACAGATTACCGCGGCTGCTGG-3′) primers (Illumina adapters underlined).
PCRs were performed with the following cycling protocol: a pre-heating process of the lid at 110 °C; a denaturation step at 95 °C for 3 min; then, 25 cycles of 30 s at 95 °C; an annealing step of 30 s at 55 °C, and an extension step of 30 s at 72 °C. These cycles were followed by a final extension step of 5 min at 72 °C. The amplicons were then kept at 4 °C until further proceeding.
Amplicons were sent to the DNAVision company (Gosselies, Belgium) for sequencing on an Illumina MiSeq machine in 250 bp × 2.
Sequencing data are available under the accession PRJNA739097 on the Sequence Read Archive database (SRA) of the National Center for Biotechnology Information (NCBI).
2.7. Bioinformatics and Statistics
2.7.1. Statistics for Water Parameters Data
To avoid analyzing the relationships of each water parameter with each variable separately, the four parameters T, pH, EC and nitrate concentration were combined in a principal component analysis using the RStudio software (version 1.2.1335) and R v3.3.2 language. Only those four parameters were kept as the DO data were lost due to a malfunction of the probe. A hierarchical clustering (FactoMineR package, version 1.41 [15]) was then conducted to group the different dates of sampling based on the physicochemical parameters (more details in Supplementary Materials). Those physicochemical clusters could then be characterized and used as a factor in the microbiota analysis since each sampling date could be associated to a certain physicochemical group.
2.7.2. Bioinformatics
Data were processed with the QIIME 2 (q2) software version 2019-4 [16] and following the workflow described in Sare and Stouvenakers et al. [14]. Only the forward sequences were imported under the “Casava One Eight Single Lane Per Sample” format and cleaned with the DADA2 denoise single plug-in with trimming [17]. Taxonomy was assigned with the Vsearch classifier implemented in the q2 feature-classifier plug-in with the SILVA_132 database with 99% similarities as a reference. Then the cytoplasmic contaminations (chloroplasts and mitochondria) were removed with the filter-table plug-in. Alpha and beta diversities were then analyzed with the q2-diversity core-metrics-phylogenetic plug-in, and principal coordinates analysis (PCoA) based on the UniFrac distance matrices were generated. Pairwise Kruskall–Wallis and Permanova pseudo-F tests were performed to compare alpha- and beta-diversity indices, respectively, using the alpha- and beta-diversity_group_significance plug-ins. Spearman correlation indices were also calculated between alpha-diversity indices and water parameters with the alpha_correlation plug-in.
3. Results
3.1. General Information
In total, 44 samples were collected over the course of 9 weeks (Figure 2), with 12 samples collected from the sump and biofilter compartments and 10 samples collected from the root microbiota and the rhizoplane of the lettuces’ roots (2 root microbiota and 2 rhizoplane samples were discarded due to diseased lettuces). Sampling took place twice a week during the first three weeks and once a week during the last weeks. The bacterial communities composing the samples were analyzed using16S rRNA gene deep sequencing with Illumina MiSeq technology. A paired sequencing was conducted on 2 × 250 bp but only the forward reads were kept for the final analysis. The average Q30 of the sequences was of 86%.
3.2. A Different Community in Each Compartment
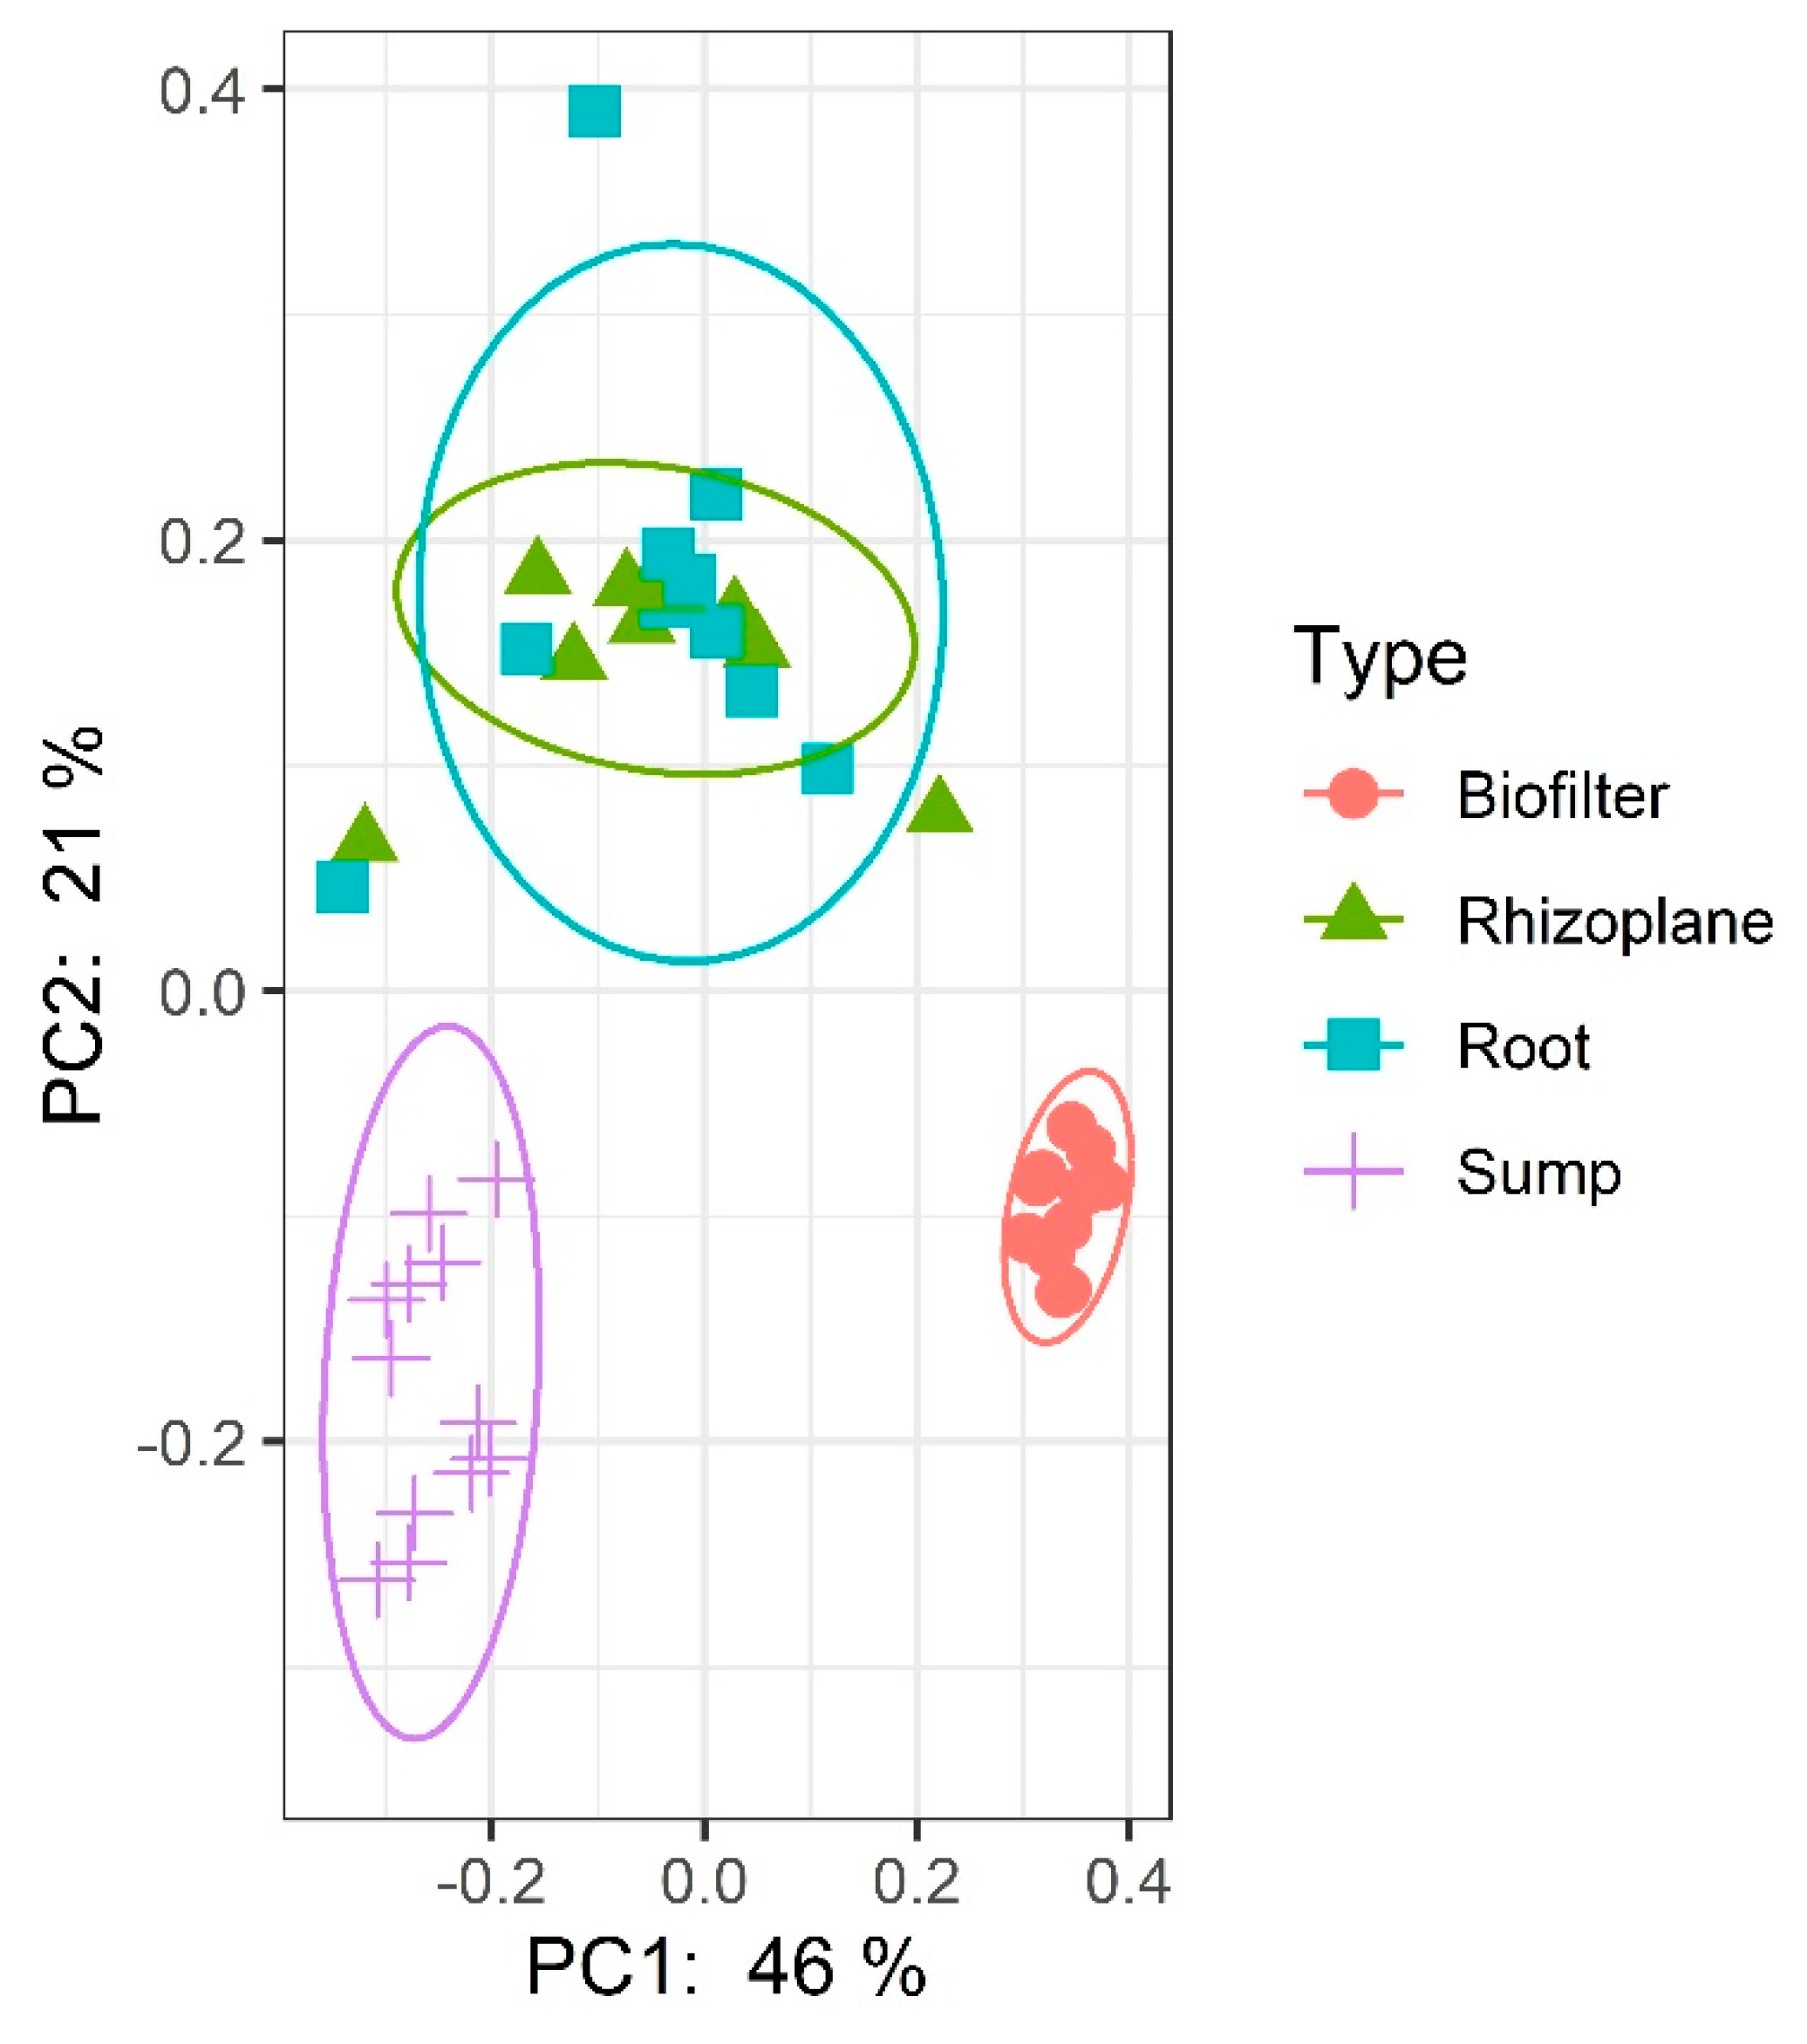
In our experiment, four different compartments were sampled, i.e., the sump, the biofilter, the lettuce rhizoplane and the lettuce root microbiota. Figure 3 clearly displays that each compartment possesses its own community as already shown by Schmautz et al. [2,18] with the rhizoplane and root microbiota communities closely intertwined. This might be linked to the fact that no disinfection was conducted on the roots before the grinding and collection of the root microbiota. A continuum of microorganisms might thus have been collected albeit in two steps.
Visual observations have been confirmed by a Permanova, Pseudo_F test on the weighted Unifrac distance matrix (p-value = 0.001). Significant differences are noted between all groups (q-value = 0.0012) except between root microbiota and rhizoplane (q-value = 0.0830).
In terms of diversity, the four compartments are also very distinct (Table 1). The observed_otus and Shannon indices have been calculated for each compartment and compared with a pairwise Kruskal–Wallis test. The values obtained for both indices are coherent with our previous studies [9,10] and higher than those obtained by Schmautz et al. [2]. Concerning the Shannon index, the rhizoplane diversity is significantly higher than in the other compartments, followed by the root and biofilter compartments which have similar diversities. The sump compartment has a diversity significantly lower than the other three compartments. Concerning the observed-otus index, the rhizoplane is the richest compartment (significantly different from the other three compartments), followed by the biofilter (significantly different from the other three compartments) while the root and sump compartments harbor similar richness (Tables S1 and S2).
The four bacterial communities will from here on be mainly studied separately to allow for a clearer interpretation of the evolution of each community.
3.3. Water Physicochemical Parameters in Relation with Microbial Communities: Monitoring and Analysis
Our main goal aimed at understanding how the bacterial communities in an aquaponic system settled and evolved when the system was first launched after a winter fallow period and over the course of a lettuce growth cycle. Our second objective was to be able to link those potential modifications with the changes in the water physicochemical parameters.
3.3.1. Global Water Parameters’ Relationship with Bacterial Communities
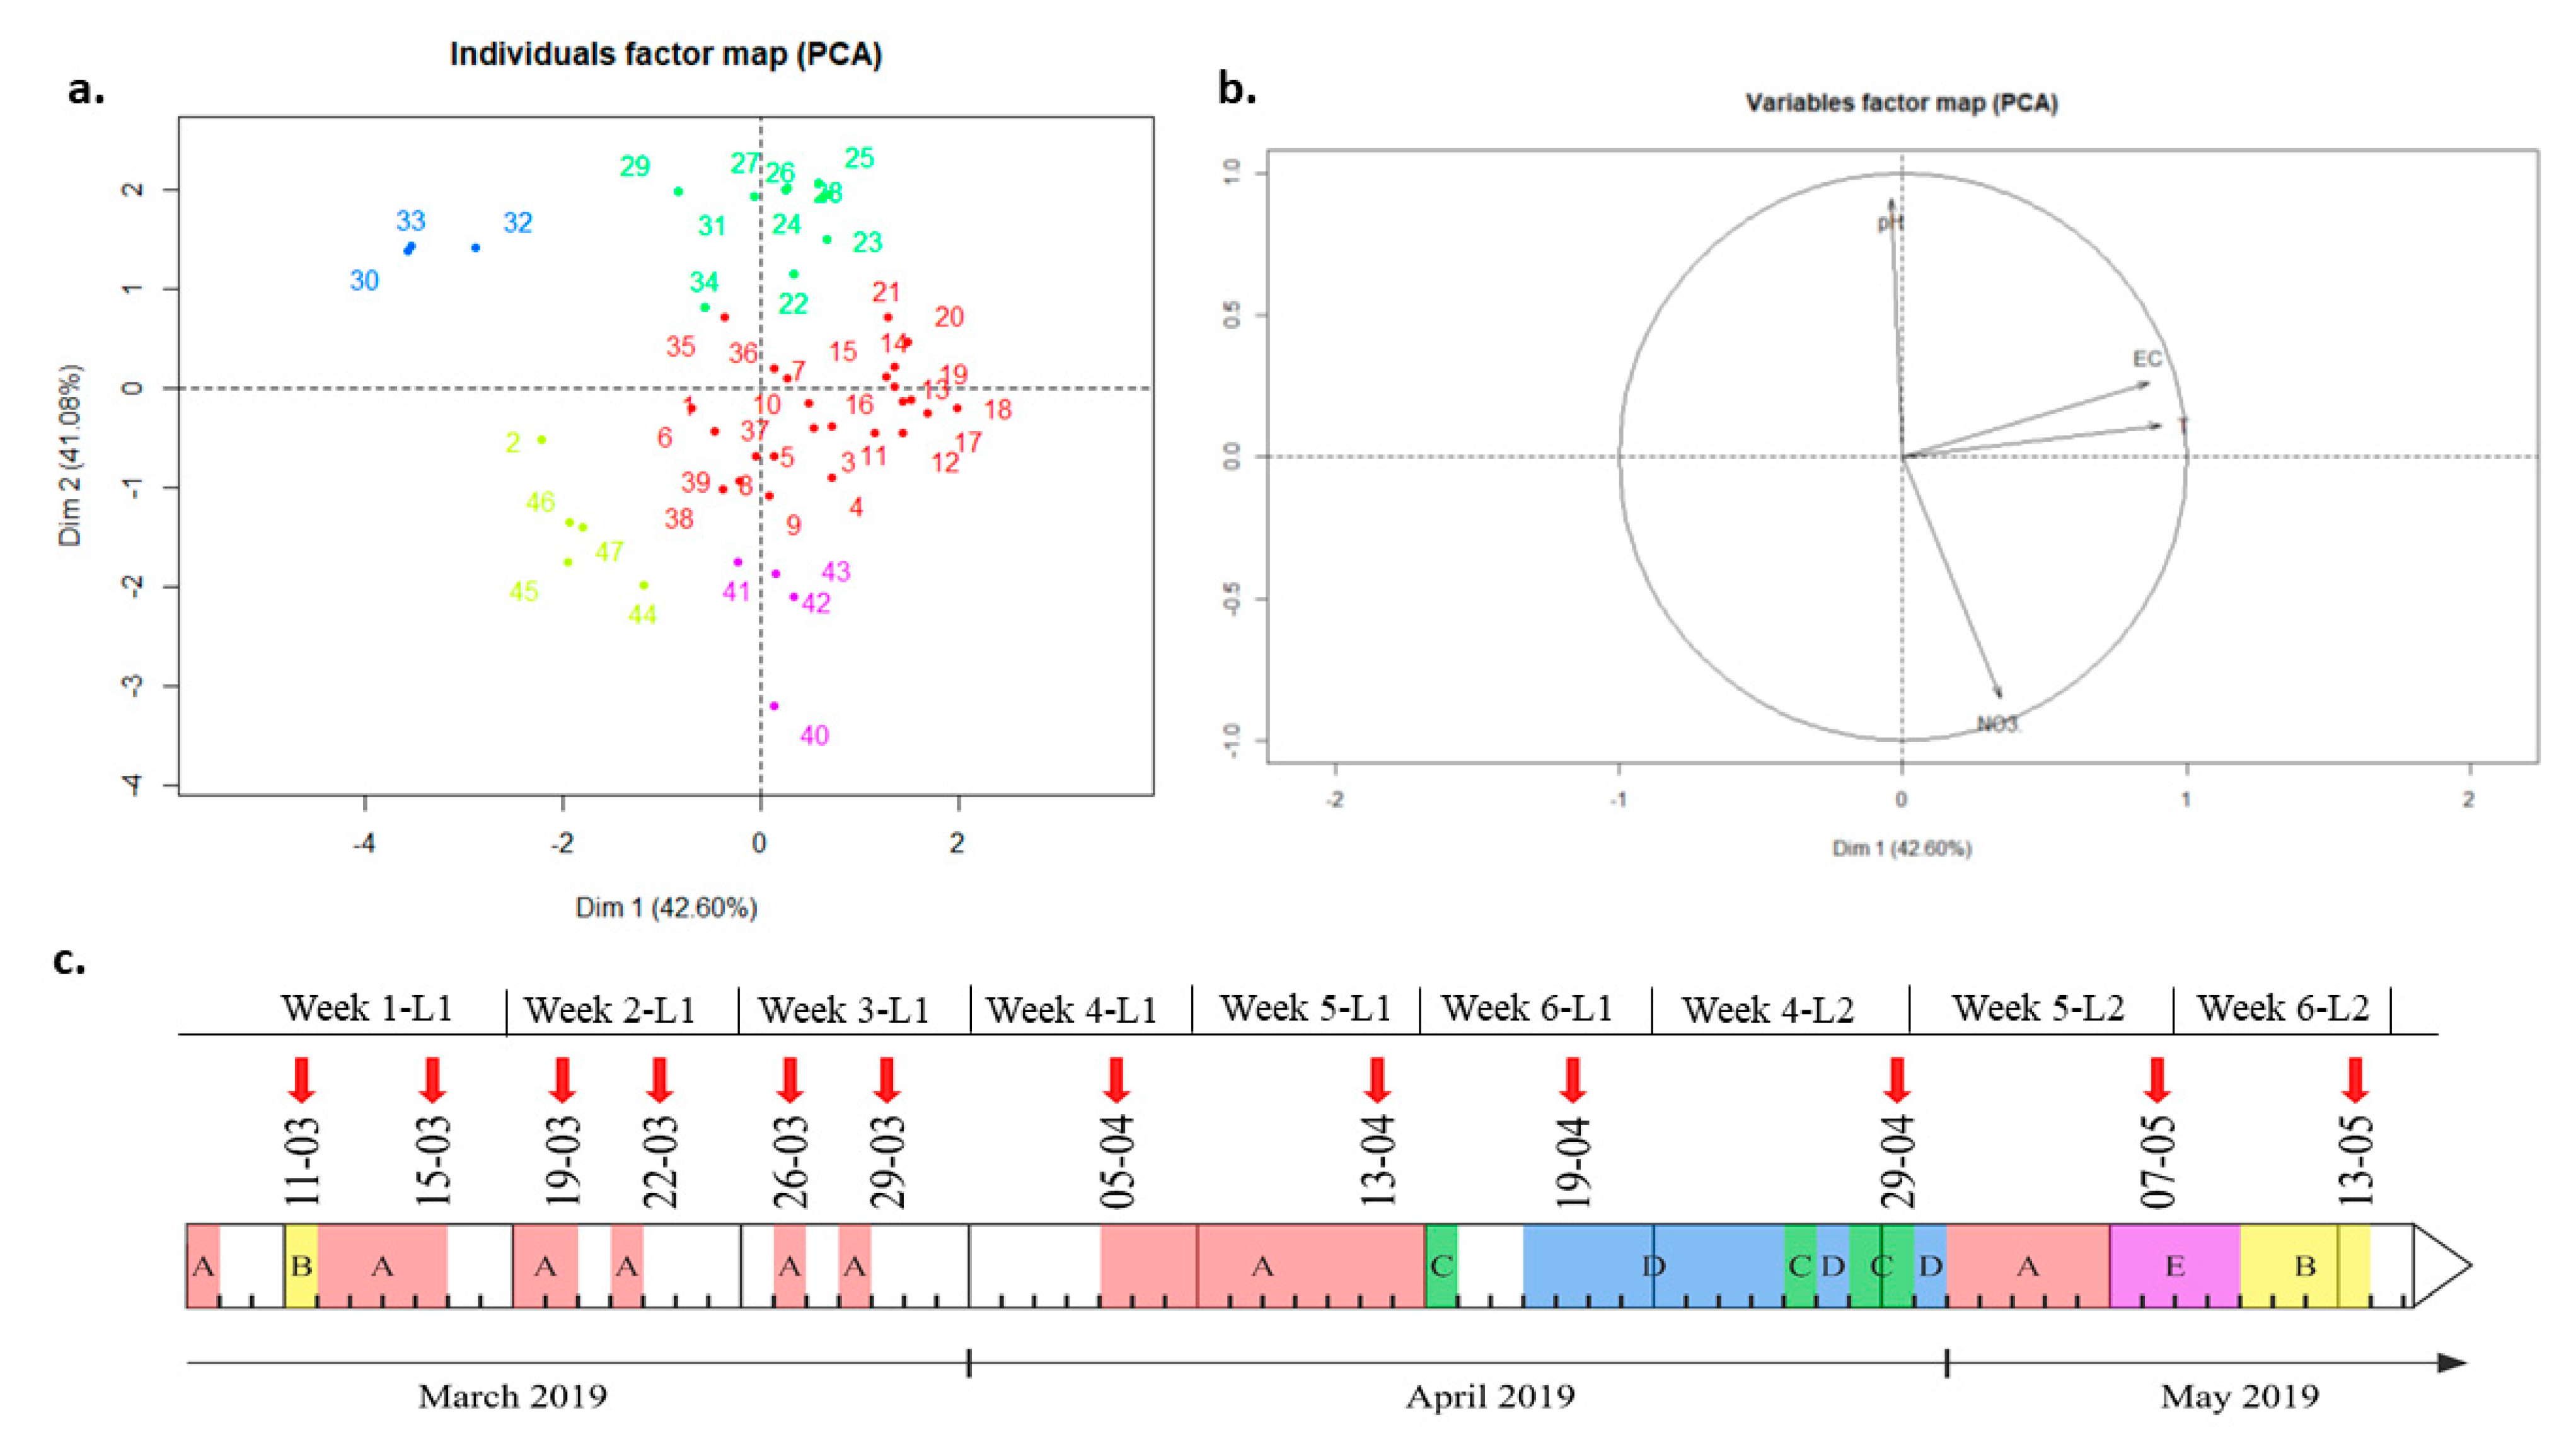
Water parameters (pH, temperature, EC and nitrate concentration) were monitored throughout the experiment with the help of specific probes located in the sump of the aquaponic system. The data obtained were considered valid for the entire system and were thus studied at first on the system scale. The water’s main parameters were followed and grouped utilizing a Principal Components Analysis (PCA) (Figure 4a,b) and a hierarchical clustering (Supplementary Materials, Figure S8). This resulted in 5 groups of sampling dates which, when put onto a timeline give us the following figure (Figure 4c). Details concerning the parameters’ values for each group are given in Supplementary Materials, Table S3.
The coefficients of variation in each group are relatively similar and low, ranging from 0.01 to 0.08, meaning that the clusters were properly established, with highly homogenous dates (Supplementary Materials, Table S3 and Figure S5). Group A included most dates with 25 days out of 47. It dominated the first part of the experiment, from March 8 to April 14. This group was characterized by the highest EC. Its mean temperature was close to the optimal compromise temperature of 25 °C [12,19] and had average levels of pH and nitrate concentrations comparing to the other groups. Coming right after, Group D mostly dominated the period going from April 18 to April 30. This group was characterized by a high EC, a high pH, a nearly optimal temperature and a low concentration of nitrate. This period represents an important shift in the parameters. Late April to early May, an alternation of group D and C occurred. Covering only 3 days, group C was defined by an average to low EC, a high pH, a low temperature and a very low nitrate concentration. This “extreme” group reflects the two heating failures that occurred on April 25, 26 and 29 as well as a steady decline of nitrate concentration. Then, Group A covered the dates from May 1 to May 5. This reflects a period of “return” to normal conditions, in which the temperature went back to the optimal one and nitrate were added in the water. Then, it switched to Group E, characterized by an average EC, a low-to-average temperature, a very low pH comparing to the average pH observed during the experiment and a very high nitrate concentration. This group reflects the impact of HNO3 additions, that reduced the pH and increased even more the nitrate concentration. During that period, pH was actually the closest to the optimal compromise pH, i.e., between 6 and 7 [19]. Finally, the last days of the experiment were covered by Group B, from May 10 to May 13. This period was characterized by the lowest EC observed throughout the experiment, a temperature close to the optimal, a relatively low pH compared to the other periods and an average nitrate concentration. This group may reflect a stabilization of the parameters, i.e., pH and nitrate that were both drastically modified during the previous period (Group D). It can be noticed that Group B also covered the first sampling day, i.e., March 11, bordered by the Group A. Since the data were taken manually and the preceding days did not have any parameters’ data, it is difficult to say if this short period at the beginning of the experiment really had the characteristics of Group B. As a general conclusion, the first part of the experiment, i.e., from March 8 to April 15, seemed quite constant and homogenous in term of temperature, EC, pH and nitrate concentration. Then, the second part of the experiment, i.e., from April 18 to May 15, was way more heterogeneous, undergoing various parameters’ variations such as drops in temperature, pH and nitrate concentration.
The question which now follows is whether the same alternation of groups could be observed in the bacterial communities. All samples were thus grouped based on their water parameters, and a Permanova pseudo-F test was conducted to compare them based on their composition (beta-diversity). No significant difference could be detected based on the physicochemical groups (p-value = 0.921). Considering the timeline, the same reflection was applied to all samples grouped by week of sampling and no significant difference could be noted either (p-value = 0.564). The same results were obtained for each compartment (sump, biofilter, rhizoplane, root microbiota) studied independently and compared by week.
3.3.2. Individual Water and System Parameters’ Influence on the Diversity of the Bacterial Communities
Spearman correlations between alpha-diversity indices and water and system parameters (days since beginning of the experiment, temperature, pH, EC, nitrate) were calculated for each compartment. In Table 2, the correlation coefficients (r) are mentioned only when significant and p-value is given. No significant correlation was found between the water and system parameters and the diversity indices in the sump and root microbiota compartments.
The biofilter bacterial community seems to be the one most influenced by the water parameters and by time. Indeed, the number of amplicon sequence variants (ASVs) observed decreased significantly throughout the experiment. Furthermore, we can see that the Faith_PD index, which is a phylogenetic diversity index, is negatively correlated with the length of the experiment meaning that throughout the experiment, the phylogenetic diversity decreased as well. Both richness and phylogenetic diversity are much higher during the first four sampling dates and significantly decrease after that. Phylogenetic diversity is also positively correlated with the nitrate concentration. On the other hand, evenness is negatively correlated with the temperature indicating that the higher the temperature, the less even the community. Meanwhile, the Shannon diversity index seems to decrease when EC increases. In the rhizoplane, Shannon diversity and Faith_PD are significantly negatively correlated with the nitrate concentration indicating that when nitrate concentration increases, the diversity of the rhizoplane community decreases, with also a phylogenetic diversity decrease. The augmentation of nitrate in water might thus lead to a selection of specific bacteria in the rhizoplane. The evenness, on the other hand, increases throughout the experiment.
3.4. Evolution of the Bacterial Communities throughout Time and Composition of the Compartments at the Genus Level
Figure 5 corroborates the presence of three distinct bacterial communities.
3.4.1. General Observations
3.4.2. Biofilter
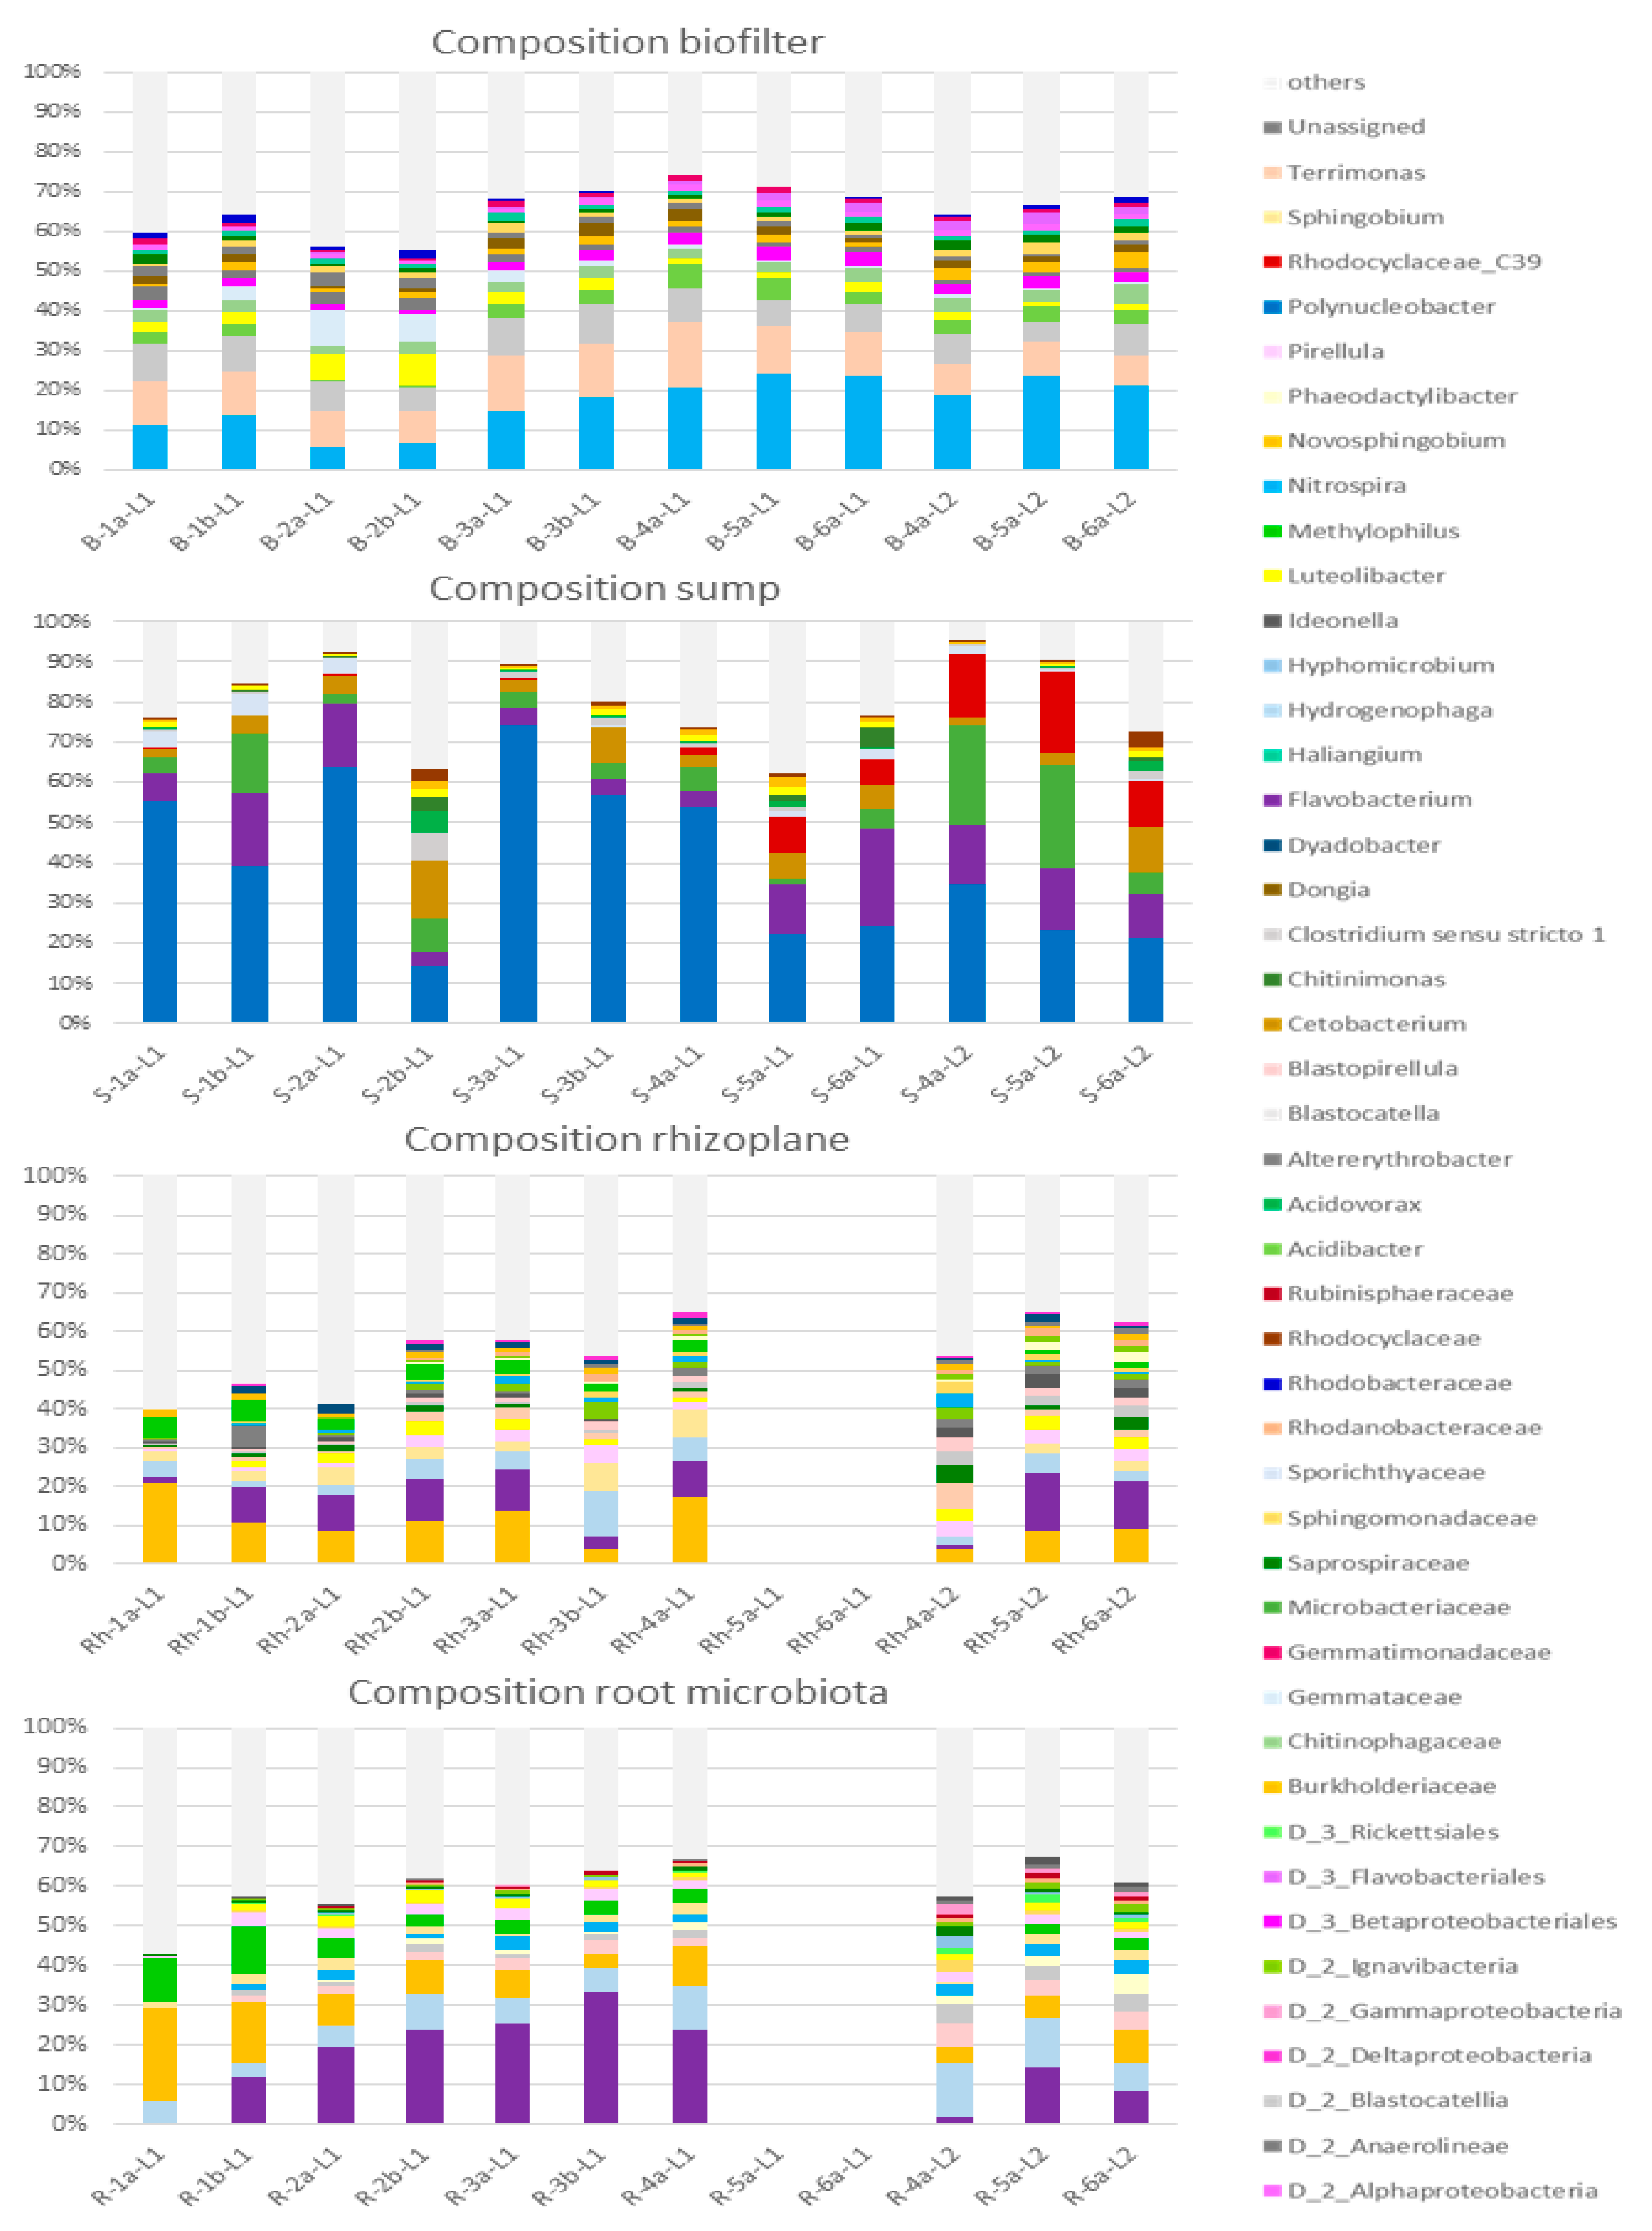
Figure 7 clearly displays that, in the biofilter, samples have different composition depending on the week they were collected on, with the first two weeks being clearly separated from the others. However, this evolution from week to week was not statistically confirmed by a Pseudo F permanova test. Still, week 2 is particularly separated from the other groups and this can be easily observed on the barplot (Figure 5) in which the B-2a-L1 and B-2b-L1 samples harbor lesser proportions of Nitrospira, Terrimonas and Acidobacter and a higher relative abundance of Luteolibacter.
The most important group in the majority of the biofilter samples is the Nitrospira genus which shows a steady increase throughout the experiment (Figure 5). This underlines its crucial role in nitrification as no Nitrobacter or Nitrosomonas could be detected in the biofilter.
3.4.3. Sump
No grouping per week of sampling can be observed in the sump (Figure 7) and this is confirmed by the barplots (Figure 5) which are quite similar from one sample to the other. The second sample of the second week is slightly estranged from the others (Figure 7) and this can also be seen on the barplot (S-2b-L1) with a lesser proportion of Polynucleobacter and a greater portion of the community being occupied by diverse ASVs (others). Other than that, the composition of the community is stable throughout time.
Two groups seem distinguishable, though, on Figure 3, but none of the factors considered in this experiment are able to explain this separation.
In the sump, samples are highly dominated by the Polynucleobacter genus (Figure 5). This genus is more present at the beginning of the experiment and drops importantly in the S-2b-L1 sample. Nothing specific could be noted in the water parameters on that day (March 22). From the S-5a-L1 sample to the end of the experiment, the Polynucleobacter genus represents less than 40% of the community. The second most important taxa in the sump community is the Flavobacterium genus. It is less present in the S-2b-L1, S-3a-L1, S-3b-L1 and S-4a-L1 samples. It is to be noted that the Flavobacterium genus is also a major taxon in both root compartments. The undetermined genus (C39) from the Rhodocyclaceae family presents an increase in relative abundance from the S-5a-L1 sample. To conclude, no major disruption could be observed in the sump during the 9 weeks of the experiment apart from the slight decrease of the Polynucleobacter’s relative abundance and concomitant increase of the Flavobacterium and undetermined C39 presence.
3.4.4. Rhizoplane
Figure 7 shows that no clear grouping per week is present and that even within the same week, the two collected samples can have a very different composition (i.e., in week 1 and 3). It has to be reminded here that the two samples from week 4 belong to two different groups of lettuces with the sample from the first group being closer to the samples from the previous weeks. On the composition barplot (Figure 5), we can see that indeed, the first sample from the second group of lettuce (W-4a-L2) harbors a different and more diversified bacterial community with a lesser proportion of the Burkholderiaceae family and Flavobacterium. However, the W-5a-L2 and W-6a-L2 then present a community again coherent with the beginning of the experiment.
The predominant taxon in the rhizoplane is the Burkholderiaceae family which represents between 5% and 20% of the samples, with Flavobacterium coming as second. However, Flavobacterium is quite less present in sample W-1a-L1, i.e., in the lettuce seedling before transplantation. The Hydrogenophaga genus was also very present in the rhizoplane compartment.
3.4.5. Root Microbiota
In the root compartment, Figure 7 shows that the first three samples are quite different (albeit not significantly) from the rest of the experiment. On the composition barplots, however, only the first sample (lettuce seedlings before transplantation) is visibly different from the other with the utter absence of Flavobacterium and the importance of the Burkholderiaceae family. The Flavobacterium genus proportion steadily increases, reaching a peak of more than 30% in R-3b-L1 then decreases. Similarly to the rhizoplane compartment, a strong difference can be noticed between the fourth week sample from lettuce group 1 (R-4a-L1) and lettuce group 2 (R-4a-L2). Here again, the last two samples are more similar to the ones from the beginning of the experiment despite belonging to two different lettuce groups.
Both root microbial communities are quite similar with Flavobacterium, Hydrogenophaga and the Burkholderiaceae family as the three main taxa, albeit with the Flavobacterium being the most important one in the tight root microbiota.
4. Discussion
4.1. General Remark
It is important to start by discussing the choice of shifting the focus of the experiment onto a second group of lettuces due to the appearance of disease symptoms on the first group. Symptoms such as growth stunt, followed by leaf yellowing and wilting as well as root necrosis were indeed observed on the first group of lettuce during the fifth and sixth weeks of growth. In the meantime, batches of lettuces had been regularly embedded in the aquaponic system to compensate for the regular lettuce loss due to sampling. It was therefore decided to keep the experiment running with a focus on a second group of four-week-old lettuce. Indeed, we had kept the samples of lettuce group 1 until week 4 and starting again with another four-week-old group permitted us to compare the composition of microbial communities of the two groups at this stage and determine whether both groups could be considered similar. Slight differences could be observed between the Rh-4a-L1 and Rh-4a-L2 samples when considering the proportions of the three main taxa of the compartments (Burkholderiaceae family, Flavobacterium and Hydrogenophaga genera) but these differences tended to fade in the following samples. Furthermore, sump and biofilter samples of microbial communities presented no major modifications either during week 5 and 6 of the first lettuce group thus showing that the potential disease affecting the lettuces did not impact the other compartments of the aquaponic system. Finally, no significant modifications appeared throughout time in either compartment confirming that following another lettuce group in the same aquaponic system did not significantly impact the outcome of the study.
4.2. Resilience of the Bacterial Communities to the System’s Parameter Changes and over Time
The global aim of this study was to analyze the evolution of aquaponics bacterial communities throughout time and more specifically over the course of a full lettuce growth cycle. The idea behind the experiment was to follow the normal functioning of our aquaponic system (i.e., without provoking any changes in the system) and see whether the bacterial communities would evolve after the winter fallow period, adapt to the presence of plants or be modified by small shocks such as short temperature modifications due to the climate or a short heating failure. Furthermore, it would have been particularly relevant to compare our results to the same type of experiment conducted in hydroponics to be able to assess the impact of the “soilless” element. However, to our knowledge, very little information is available on the natural evolution of bacterial communities in hydroponic systems and in hydroponic plants’ rhizosphere. Therefore, our data were mainly compared to data from soil borne rhizosphere studies.
4.2.1. No Significant Differences between Bacterial Communities’ Grouping Based on Physicochemical Groups
Microbial communities in our aquaponic system were not influenced by the water’s physicochemical parameter changes. However, this conclusion needs to be qualified in the light of certain biases. Indeed, for parameter groups C, D and E, only one sampling date was included (Figure 4) which means that once separated into compartments, only one sample was left per group. Meanwhile, group A included 7 sampling dates and group B, 2. This could influence the comparison by rendering it less robust than if several samples had composed those groups.
Furthermore, the Permanova pseudo-F test, which was conducted to compare the bacterial communities between physicochemical groups, was performed on the whole system while, when we look at compartments separately, we can notice that in the biofilter, for example, the diversity of the community is still correlated with the water temperature, the EC and the NO3 concentration. The correlation with nitrate concentration may seem coherent as this molecule is part of the nitrification process and may thus directly influence nitrifying bacteria’s welfare. On the other hand, nitrification is highly dependent on oxygen availability [18,20] which is linked to water temperature. Changes in water temperature will thus affect dissolved oxygen levels which would then impact the bacterial community of the biofilter.
Eventually, other water physicochemical parameters might have a stronger influence on the composition of the bacterial communities such as oxygen saturation and total organic carbon [18] which we did not measure. Indeed, Schmautz et al. [18] recently concluded that oxygen level was a most important parameter and that a major difference in terms of diversity could be noticed between the aerobic and anaerobic compartments of an aquaponic system.
However, Chave et al. [21] reported that even the addition of a solution of active free chlorine (0.15 mg/L) in their NFT system did not affect roses’ rhizoplane communities. The robustness of the root microbial communities in hydroponics has also been confirmed in tomato plants by Calvo-Bado et al. [22] but it is yet unclear whether this protection effect is linked to a mechanical or chemical sheltering [21].
4.2.2. Nor between Weeks
No significant difference in the composition of the bacterial communities could be noted between the time points sampled during the experiment thus suggesting that the bacterial communities in each compartment are resilient to water parameter changes and are constant over the full lettuce growth cycle and this, even after the winter fallow period.
To our knowledge, no other such study has yet been conducted on an aquaponic system thus impeding any strong comparison, especially in the sump and biofilter compartments.
However, the evolution of the rhizosphere microbial community has been observed and scrutinized in field studies. Depending on the plant species, variations can be observed [23,24] albeit not always in terms of diversity of the community [25]. Indeed, the variations of microbial communities during the maturation of several plant species observed by Houlden et al. [25] were mostly observed in terms of functions when analyzed through a BIOLOG method even though this technique is limited to cultivable microorganisms. This variation in the functions is justified by the fact that, through their different physiological stages, plants harbor varying needs and therefore recruit different microorganisms via the production of different types of root exudates [25,26].
This explanation brings forward two hypotheses as to why no variations were observed in our root communities. The first hypothesis is linked to the plant species, namely the lettuce. Indeed, in our experiments, the lettuces were followed from seedlings to vegetative stage but were collected before stemming and flowering as it is the use in lettuce cultivation. Meanwhile, in most studies on this topic, the roots’ microbiota is followed from the seedling stage until the flowering or even ripening stages [23,24,26]. The absence of those contrasting physiological stages might explain the lack of differing needs in the plant and thus lack of variation in our rhizoplane and root communities. To our knowledge, no studies following the evolution over time of the lettuce root microbiota could be found in the available literature. An interesting perspective would therefore be to conduct the same experiment on fruiting vegetables such as tomatoes to assess whether different microbiota can be observed throughout plant growth stages also in aquaponics. Such new information would shed light on the respective influences of aquaponic microbiota on the rhizosphere microbiota and vice versa.
The second hypothesis concerns the very nature of aquaponic systems, i.e., soilless systems in which the roots are in direct contact with flowing water. Indeed, contrary to soil, the flowing water does not constitute strata around the plant roots, i.e., no clear limitation between bulk soil, rhizosphere and rhizoplane. Here, the water is in constant movement and might thus dilute the root exudates which can, in soils, be accessed to by the microorganisms of the solid rhizosphere [26]. However, it has been assessed that even in hydroponic systems, root exudates can influence the composition of the rhizosphere community [27,28] and Renault et al. (2008) (cited in [27]) did find modifications in the composition of the root bacterial communities in hydroponics, albeit in tomato plant, which brings us back to our first hypothesis and the lack of contrasting physiological stages in lettuce. Eventually, an interesting perspective to this study would be to follow the microbiota harbored by the rockwool plugs or other inert media over time. Indeed, despite being an inert substrate, rockwool can be colonized by microorganisms once introduced in an aquaponic system and intertwined with plant roots (Carlile and Wilson 1991 cited in [22]). It could thus take the place of the physically concrete rhizosphere and could retain plant exudates more easily.
All in all, these findings suggest that the microbial communities of the sump, biofilter and root compartments in aquaponics are stable throughout time but also to small water parameter modifications. It can therefore be assumed that aquaponics microbial communities could also resist modifications brought by the development of external taxa such as pathogens, for example, and therefore constitute a more resilient environment for soilless plant growth.
Eventually, a possible improvement of the experimental design would be to collect a more important number of samples from the system functioning as a RAS to enable a more robust comparison between the RAS state and the aquaponic state of the system. Indeed, we were here limited by the fact that only one sump and biofilter sample were at disposal before the introduction of the lettuce seedlings.
4.2.3. Nor between Years
The results obtained in this study for the sump and biofilter compartments display the presence of similar predominant families and genera to previous studies conducted on the same system thus highlighting a certain stability throughout experiments and time. This confirms the hypothesis from Eck et al. [10] that each system seems to have a specific bacterial community. Indeed, in a previous experience by Eck et al. [10] the Luteolibacter, C39 (Rhodocyclaceae family), Flavobacterium and Cetobacterium genera as well as the Microbacteriaceae family were already detected as predominant taxa of the PAFF Box sump. In the biofilter, the Luteolibacter and Nitrospira genera as well as the Saprospiraceae family were common members of the predominant taxa between 2017 and 2019.
4.3. Trends Can Still Be Observed and Alpha-Diversity Indexes Were Correlated with Water Parameters
4.3.1. Day 1—Before Transplantation
The first sump and biofilter samples were collected on March 13 before seedlings’ transplantation, i.e., when the PAFF Box was still functioning as a RAS. On this first day, the sump was dominated at 55% by the Polynucleobacter genus. The biofilter harbored two main genera, namely Nitrospira (11%) and Terrimonas (11%). These day 1 samples are not particularly different from the day 2 samples nor from the rest of the sump and biofilter samples thus leading to the hypothesis that both compartments are not strongly influenced by the introduction of plants into the system. For the sump, this could be explained by the fact that such an important volume of water (Figure 1), with an average weekly renewal of 200 liters may present a stability in front of the addition of 80 lettuce seedlings. For the biofilter, the same argument can be applied as it is constantly supplied with water coming out of the mechanical filter. Moreover, as the fish compartment was kept running during the winter period, the biofilter community was still supplied in fish excreted ammonia thus sustaining a healthy nitrifying community. To allow for a better comparison of the PAFF Box microbiota with and without plants, more samples from the “without plants” period should be collected. This would indeed supply a more robust idea of the “aquaculture microbiota” to be then compared to the “aquaponics microbiota”.
Samples were also taken from the lettuce seedlings before their being transferred in the PAFF Box. In the rhizoplane, the predominant taxon was the Burkholderiaceae family representing 21% of the community. The Burkholderiaceae family harbors known plant growth promoting bacteria and is very often found in the rhizosphere of soil cultures [29] as well as in our aquaponics studies [30]. This family was also very present in the first seedlings’ root microbiota sample (23%). In this first root microbiota sample, the Flavobacterium genus which is later very predominant only represents 0.4%.
Flavobacterium are often associated with plants and could prove beneficial for plant health and care [31,32], they have also been identified in aquaculture systems [2,33,34]. Some Flavobacterium present functional traits which could prove highly beneficial for crop yields in aquaponics such as phosphate solubilization, organic matter degradation or auxin and siderophores production [32] or even the fight against pathogens.
4.3.2. After Transplantation—Lettuce Growth Cycle
Biofilter
Concerning the nitrification process, no Nitrosomonas or Nitrobacter could be detected in our biofilter throughout the whole experiment thus confirming the observations of Schmautz et al., Eck et al. and Bartelme et al. [2,10,11] whom did not observe or, only in very small proportion, the presence of Nitrosomonas and Nitrobacter and corroborating Bartelme et al.’s assumption [35] that Nitrospira is a main player in nitrification in freshwater biofilters. The Nitrospira taxa maintains itself steadily throughout the experiment and represents the single component of the Nitrospirea phylum. Nitrospira can be a COMMAMOX [35,36], i.e., a bacteria capable of performing the whole nitrification process on its own. Similarly, the Terrimonas taxa keeps relatively stable proportions.
A negative correlation could be observed between the elapsed time and the number of observed ASVs which means that the number of ASVs composing the biofilter community significantly decreases throughout the experiment. This could be the reason why the first two weeks on the PCoA (Figure 5) are so distant from the samples from the end of the experiment.
We can also note the negative correlations between the evenness and the water temperature, between Shannon and EC and the positive correlation between Faith_PD and NO3. We can thus state that water parameters such as temperature and EC could influence the composition of the microorganism community in a biofilter. However, the variation ranges of these two parameters were quite restrained. It would thus be interesting to apply more marked temperature and EC modifications on an aquaponic system and see the evolution of the communities, all the while respecting the fish welfare. According to Schmautz et al. [18], the most influencing water parameter is the dissolved oxygen available, clearly distinguishing aerobic and anaerobic bacterial communities. The levels of dissolved oxygen were unfortunately lost in our experiment due to probe failure.
Sump
In the sump, no particular variations nor trends could be observed throughout the experiment. The Polynucleobacter genus was always predominant in the samples. This observation correlates with Bartelme et al. [11], who state that Polynucleobacter are common in freshwater aquaponics but also in natural freshwater systems. Their hypothesis explaining the important presence of this genus in aquaponics is that aquaponic systems reproduce natural ecosystems with plant particles being present in the running water [11]. However, we already had a very important proportion of Polynucleobacter in the first sump sample when the PAFF Box had actually been running as a simple RAS for three months. According to Bartelme et al. [11], this taxon is not commonly found in aquaculture albeit other studies [37,38] state that it is a common heterotrophic member of freshwater microbial communities.
No major difference can be observed between the first sample (before transplantation of the lettuce seedling) and the rest of the samples thus leading to think that the bacterial community of the sump is not particularly influenced by the introduction of plants or that the volume of water from the sump is not influenced by the roots. This is different from the soil where the substrate is static and clear zones can be delimited around the roots, i.e., bulk soil, rhizosphere and rhizoplane [26]. The resilience of the sump compartment is also confirmed by the absence of correlation between the water parameters and the alpha-diversity indices.
Rhizoplane and Endosphere: A Typical Lettuce Root Community
The microbial community observed in our rhizoplane and root microbiota samples is coherent with the common soil cultivated lettuce rhizosphere community with a majority of Proteobacteria [6] (gammaproteobacteria) and Bacteroidetes phyla [39]. In our experiment, the third most important phylum is the Planctomycetes conversely from Cardinale et al. [39] who observed Chloroflexi and Actinobacteria. If the Flavobacterium seem to be common members of the lettuce rhizosphere community [6,40], the Burkholderiaceae family is not mentioned by Cardinale et al. [39]. The Pseudomonadaceae family is found both in Cardinale et al. [39] and our study which is encouraging as the Pseudomonadaceae family often contains plant growth promoting bacteria [41]. The Sphingomonadaceae family is also one of the major family in the rhizoplane and endosphere [6] as well as the Chitinophagaceae family. To conclude, the aquaponic environment does not seem to disrupt the “classical” lettuce root microbial community found in soil borne lettuces.
Furthermore, the absence of correlation between the aquaponic water parameters and the tight root microbiota alpha-diversity highlights the strong relationship between the lettuce roots and their typical microbiota.
It is of prime importance to dwell on this information. Indeed, despite being in a soilless system, thus widely different from field grown lettuces, the root bacterial communities, i.e., rhizoplane and root microbiota were very similar to classical soil lettuce rhizosphere community. It is nowadays acknowledged that soil type strongly influences the composition of the root microbial communities [42]. The addition of different designs of soilless systems in studies comparing the effect of soil type on the composition and functions of plant root microbial communities could help expand knowledge and understanding of these communities in production systems.
Yet, a question which might arise is then the origin of these bacteria. Indeed, it seems crucial to understand whether the microorganisms come mainly from the lettuce seed or if the lettuce is able to recruit its usual rhizoplane community in the aquaponic water. This question is even more important as, in a study using the same lettuce seeds as in our experiment and observing the rhizoplane bacterial community in hydroponics, the Burkholderiaceae family also represented 50% of the rhizoplane community while the Sphingomonadaceae and Chitinophagaceae family were also part of the predominant taxa [30] (Supplementary Materials).
Reproducing our experiment with other species such as tomatoes would then enable us to distinguish different physiological stages but also to see whether the root microbiota here observed is typical from the lettuce culture or if we can notice the same root microorganisms in tomatoes which would then plead for a more specific “aquaponic microbiota”.
Eventually, it is important to nuance the similarities and dissimilarities observed between all the cited studies as most of them targeted different regions of the 16S gene or used different primer sets for a same region, thus highly influencing taxonomic assignment and diversity indices [43,44]. For instance, Cardinale et al. [39] focused on the V4 region and Schreiter et al. [40] on the V6–V8 regions which might skew the comparison of lettuce rhizosphere communities.
5. Conclusions and Perspectives
This study aimed at offering a first view of the evolution of microbial communities in an aquaponic system over a crop cycle. The plainest answer it can offer is that, throughout a full lettuce growth cycle, no major modifications of the bacterial communities could be observed in the sump, biofilter and root compartments of the aquaponic system. This observation leads to the supposition that the introduction of lettuce seedlings into the aquaponic system does not bring major disruption into the system (sump and biofilter samples). What is more, the lettuce root communities appeared very similar to typical soil borne lettuce root community thus bringing forward the idea that lettuce seedlings carry their own microbiota inherited from the seeds [45,46] and that it is, reciprocally, less influenced by the surrounding aquaponic environment. Another hypothesis would be that lettuces in aquaponics are able to perform a recruitment process similar to soils. Therefore, another key point is the seeming lack of communication between the root and water (sump) compartments as each tends to keep its own specific bacterial community throughout the experiment. An interesting perspective would be to study concomitantly the community harbored by the rockwool plug which might serve as a proxy for the rhizosphere. Indeed, plants recruit microorganisms via the production of root exudates which attract bacteria and fungi in the root vicinity [40]. Yet in soilless systems, root exudates may be diluted in the nutritive solution and the absence of surrounding physical support may prevent the formation of microbial strata [47,48]. To dig further into the relationships between plant-brought and aquaponic microbiota, several experiments could be set up such as the monitoring of root microbiota from plants originating from the same seed lot in different aquaponic systems or, conversely, the study of root microbiota of different plant species (e.g., lettuce and tomato) in the same aquaponic system. Further experiments focused on other plant species such as tomatoes or cucumbers also ought to be implemented in order to compare their aquaponics and soil root communities as well.
Finally, a curious observation emerged from the study of the biofilter as its population seemed to evolve over the course of the experiment. These changes may be linked to water parameters such as temperature, EC or nitrate concentration as it was shown that those three parameters are significantly correlated with the alpha-diversity in the biofilter. It is, however, impossible to prove any link between this evolution and the introduction of the lettuce seedlings in the system. Still, we can bring forward the hypothesis that the introduction of plants and the ensuing consumption of nitrates by the growing lettuces might play a role in the nitrogen cycle in the system and thus influence the biofilter community. A more in-depth study of this compartment during the RAS period would be necessary to ascertain a potential link.
Supplementary Materials
The following are available online at https://www.mdpi.com/article/10.3390/w13152089/s1. Figure S1: Disease symptoms observed on the shoot (a) and root (b) parts of the first group of lettuces during the fifth week of growth, Details on the hierarchical clustering and PCA procedures (Figures S2–S7), Tables S1 and S2: Q values of pairwise Kruskal–Wallis test performed to compare the diversity indices (Shannon and observed-otus) of the four compartments, Figure S8: Cluster dendrogram showing the repartition in 5 groups (a) of sampling dates based on water parameters and correspondence between date and day number (b) and Table S3: Physicochemical groups’ characteristics.
Author Contributions
Conceptualization, M.E., I.S., S.M. and M.H.J.; methodology, M.E., I.S., S.M. and M.H.J.; software, M.E. and I.S.; validation, S.M. and M.H.J.; formal analysis M.E. and I.S.; investigation, M.E. and I.S.; resources, S.M. and M.H.J.; data curation, M.E. and I.S.; writing—original draft preparation, M.E. and I.S.; writing—review and editing M.E., I.S., S.M. and M.H.J.; visualization, M.E. and I.S.; supervision, S.M. and M.H.J.; project administration, S.M. and M.H.J.; funding acquisition, M.E., S.M. and M.H.J. All authors have read and agreed to the published version of the manuscript.
Funding
This research was funded by F.R.S.-F.N.R.S., grant number 30206153.
Institutional Review Board Statement
Not applicable.
Informed Consent Statement
Not applicable.
Data Availability Statement
Sequencing data are available under the accession PRJNA739097 on the Sequence Read Archive database (SRA) of the National Center for Biotechnology Information (NCBI).
Conflicts of Interest
The authors declare no conflict of interest. The funders had no role in the design of the study; in the collection, analyses, or interpretation of data; in the writing of the manuscript, or in the decision to publish the results.
References
- Rakocy, J.E. Aquaponics—Integrating Fish and Plant Culture. In Aquaculture Production Systems, 1st ed.; Tidwell, J.H., Ed.; John Wiley and Sons: Hoboken, NJ, USA, 2012; pp. 343–386. [Google Scholar]
- Schmautz, Z.; Graber, A.; Jaenicke, S.; Goesmann, A.; Junge, R.; Smits, T.H.M. Microbial diversity in different compartments of an aquaponics system. Arch. Microbiol. 2017, 199, 613–620. [Google Scholar] [CrossRef] [PubMed]
- Sanchez, F.A.; Vivian-Rogers, V.R.; Urakawa, H. Tilapia recirculating aquaculture systems as a source of plant growth promoting bacteria. Aquac. Res. 2019, 50, 2054–2065. [Google Scholar] [CrossRef]
- Bartelme, R.P.; Oyserman, B.O.; Blom, J.E.; Sepulveda-Villet, O.J.; Newton, R.J. Stripping Away the Soil: Plant Growth Promoting Microbiology Opportunities in Aquaponics. Front. Microbiol. 2018, 9, 8. [Google Scholar] [CrossRef] [Green Version]
- Lugtenberg, B.; Kamilova, F. Plant-Growth-Promoting Rhizobacteria. Annu. Rev. Microbiol. 2009, 63, 541–556. [Google Scholar] [CrossRef] [Green Version]
- Berg, G.; Erlacher, A.; Grube, M. The edible plant microbiome: Importance and health issues. In Principles of Plant-Microbe Interactions: Microbes for Sustainable Agriculture; Lugtenberg, B., Ed.; Springer International Publishing: Cham, Switzerland, 2015; pp. 419–426. ISBN 9783319085753. [Google Scholar]
- Vandenkoornhuyse, P.; Quaiser, A.; Duhamel, M.; Le Van, A.; Dufresne, A. The importance of the microbiome of the plant holobiont. New Phytol. 2015, 206, 1196–1206. [Google Scholar] [CrossRef] [PubMed]
- Berg, G. Plant–microbe interactions promoting plant growth and health: Perspectives for controlled use of microorganisms in agriculture. Appl. Microbiol. Biotechnol. 2009, 84, 11–18. [Google Scholar] [CrossRef] [PubMed]
- Eck, M.; Massart, S.; Jijakli, M.H. Study of a bacterial community in the aquaponic closed-loop system of Gembloux Agro Bio-Tech. Acta Hortic. 2020, 1273, 123–128. [Google Scholar] [CrossRef]
- Eck, M.; Sare, A.R.; Massart, S.; Schmautz, Z.; Junge, R.; Smits, T.H.M.; Jijakli, M.H. Exploring bacterial communities in aquaponic systems. Water 2019, 11, 260. [Google Scholar] [CrossRef] [Green Version]
- Bartelme, R.; Sepulveda-Villet, O.J.; Newton, R.J.; Smith, M.C. Component Microenvironments and System Biogeography Structure Microorganism Distributions in Recirculating Aquaculture and Aquaponic Systems. Msphere 2019, 4, e00143-19. [Google Scholar] [CrossRef] [Green Version]
- Delaide, B.; Delhaye, G.; Dermience, M.; Gott, J.; Soyeurt, H.; Jijakli, M.H. Plant and fish production performance, nutrient mass balances, energy and water use of the PAFF Box, a small-scale aquaponic system. Aquac. Eng. 2017, 78, 130–139. [Google Scholar] [CrossRef]
- Resh, H.M. Hydroponic Food Production: A Definitive Guidebook for the Advanced Home Gardener, 7th ed.; CRC Press: Boca Raton, FL, USA, 2013; ISBN 9781439878675. [Google Scholar]
- Sare, A.R.; Stouvenakers, G.; Eck, M.; Lampens, A.; Goormachtig, S.; Jijakli, M.H.; Massart, S. Standardization of plant microbiome studies: Which proportion of the microbiota is really harvested? Microorganisms 2020, 8, 342. [Google Scholar] [CrossRef] [Green Version]
- Husson, F.; Josse, J.; Pagès, J. Principal Component Methods—Hierarchical Clustering—Partitional Clustering: Why Would We Need to Choose for Vizualizing Data? Applied Mathematics Department, Agrocampus Ouest: Rennes, France, 2010. [Google Scholar]
- Bolyen, E.; Rideout, J.R.; Dillon, M.R.; Bokulich, N.A.; Abnet, C.C.; Al-Ghalith, G.A.; Alexander, H.; Alm, E.J.; Arumugam, M.; Asnicar, F.; et al. Reproducible, interactive, scalable and extensible microbiome data science using QIIME 2. Nat. Biotechnol. 2019, 37, 852–857. [Google Scholar] [CrossRef]
- Callahan, B.J.; McMurdie, P.J.; Rosen, M.J.; Han, A.W.; Johnson, A.J.A.; Holmes, S.P. DADA2: High-resolution sample inference from Illumina amplicon data. Nat. Methods 2016, 13, 581–583. [Google Scholar] [CrossRef] [Green Version]
- Schmautz, Z.; Espinal, C.A.; Bohny, A.M.; Rezzonico, F.; Junge, R.; Frossard, E.; Smits, T.H.M. Environmental parameters and microbial community profiles as indication towards microbial activities and diversity in aquaponic system compartments. BMC Microbiol. 2021, 21, 12. [Google Scholar] [CrossRef]
- Somerville, C.; Cohen, M.; Pantanella, E.; Stankus, A.; Lovatelli, A. Small-Scale Aquaponic Food Production. Integrated Fish and Plant Farming; FAO: Roma, Italy, 2014. [Google Scholar]
- Schmautz, Z.; Espinal, C.A.; Smits, T.H.M.; Frossard, E.; Junge, R. Nitrogen transformations across compartments of an aquaponic system. Aquac. Eng. 2021, 92, 102145. [Google Scholar] [CrossRef]
- Chave, M.; Dabert, P.; Brun, R.; Godon, J.J.; Poncet, C. Dynamics of rhizoplane bacterial communities subjected to physicochemical treatments in hydroponic crops. Crop Prot. 2008, 27, 418–426. [Google Scholar] [CrossRef]
- Calvo-Bado, L.A.; Petch, G.; Parsons, N.R.; Morgan, J.A.W.; Pettitt, T.R.; Whipps, J.M. Microbial community responses associated with the development of oomycete plant pathogens on tomato roots in soilless growing systems. J. Appl. Microbiol. 2006, 100, 1194–1207. [Google Scholar] [CrossRef]
- Sugiyama, A.; Ueda, Y.; Zushi, T.; Takase, H.; Yazaki, K. Changes in the Bacterial Community of Soybean Rhizospheres during Growth in the Field. PLoS ONE 2014, 9, e100709. [Google Scholar] [CrossRef] [PubMed] [Green Version]
- Chen, S.; Waghmode, T.R.; Sun, R.; Kuramae, E.E.; Hu, C.; Liu, B. Root-associated microbiomes of wheat under the combined effect of plant development and nitrogen fertilization. Microbiome 2019, 7, 136. [Google Scholar] [CrossRef] [Green Version]
- Houlden, A.; Timms-Wilson, T.M.; Day, M.J.; Bailey, M.J. Influence of plant developmental stage on microbial community structure and activity in the rhizosphere of three field crops. FEMS Microbiol. Ecol. 2008, 65, 193–201. [Google Scholar] [CrossRef] [PubMed] [Green Version]
- Chaparro, J.M.; Badri, D.V.; Vivanco, J.M. Rhizosphere microbiome assemblage is affected by plant development. ISME J. 2014, 8, 790–803. [Google Scholar] [CrossRef] [Green Version]
- Vallance, J.; Déniel, F.; Le Floch, G.; Guérin-Dubrana, L.; Blancard, D.; Rey, P. Pathogenic and beneficial microorganisms in soilless cultures. Agron. Sustain. Dev. 2011, 31, 191–203. [Google Scholar] [CrossRef]
- Rosberg, A.K.; Gruyer, N.; Hultberg, M.; Wohanka, W.; Alsanius, B.W. Monitoring rhizosphere microbial communities in healthy and Pythium ultimum inoculated tomato plants in soilless growing systems. Sci. Hortic. 2014, 173, 106–113. [Google Scholar] [CrossRef]
- Hassani, M.A.; Durán, P.; Hacquard, S. Microbial interactions within the plant holobiont. Microbiome 2018, 6, 58. [Google Scholar] [CrossRef] [PubMed]
- Stouvenakers, G.; Massart, S.; Depireux, P.; Haïssam Jijakli, M. Microbial origin of aquaponic water suppressiveness against pythium aphanidermatum lettuce root rot disease. Microorganisms 2020, 8, 1683. [Google Scholar] [CrossRef]
- Kolton, M.; Erlacher, A.; Berg, G.; Cytryn, E. The Flavobacterium Genus in the Plant Holobiont: Ecological, Physiological, and Applicative Insights. In Microbial Models: From Environmental to Industrial Sustainability; Springer: Singapore, 2016; pp. 189–207. [Google Scholar]
- Soltani, A.-A.; Khavazi, K.; Asadi-Rahmani, H.; Omidvari, M.; Abaszadeh Dahaji, P.; Mirhoseyni, H. Plant Growth Promoting Characteristics in Some Flavobacterium spp. Isolated from Soils of Iran. J. Agric. Sci. 2010, 2, 106–115. [Google Scholar] [CrossRef] [Green Version]
- Itoi, S.; Ebihara, N.; Washio, S.; Sugita, H. Nitrite-oxidizing bacteria, Nitrospira, distribution in the outer layer of the biofilm from filter materials of a recirculating water system for the goldfish Carassius auratus. Aquaculture 2007, 264, 297–308. [Google Scholar] [CrossRef]
- Munguia-Fragozo, P.; Alatorre-Jacome, O.; Rico-Garcia, E.; Torres-Pacheco, I.; Cruz-Hernandez, A.; Ocampo-Velazquez, R.V.; Garcia-Trejo, J.F.; Guevara-Gonzalez, R.G. Perspective for Aquaponic Systems: “omic” Technologies for Microbial Community Analysis. BioMed Res. Int. 2015, 2015, 480386. [Google Scholar] [CrossRef] [PubMed] [Green Version]
- Bartelme, R.P.; McLellan, S.L.; Newton, R.J. Freshwater recirculating aquaculture system operations drive biofilter bacterial community shifts around a stable nitrifying consortium of ammonia-oxidizing archaea and comammox Nitrospira. Front. Microbiol. 2017, 8, 101. [Google Scholar] [CrossRef] [Green Version]
- Daims, H.; Lebedeva, E.V.; Pjevac, P.; Han, P.; Herbold, C.; Albertsen, M.; Jehmlich, N.; Palatinszky, M.; Vierheilig, J.; Bulaev, A.; et al. Complete nitrification by Nitrospira bacteria. Nature 2015, 528, 504–509. [Google Scholar] [CrossRef]
- Watanabe, K.; Komatsu, N.; Ishii, Y.; Negishi, M. Effective isolation of bacterioplankton genus Polynucleobacter from freshwater environments grown on photochemically degraded dissolved organic matter. FEMS Microbiol. Ecol. 2008, 67, 57–68. [Google Scholar] [CrossRef] [PubMed] [Green Version]
- Yildiz, H.Y.; Keskin, E.; Bekcan, S.; Kaynar, S.; Parisi, G. Molecular Identification of Dominant Bacterial Taxa in the Aquaponic System with Co-Culture of Tilapia (Oreochromis aureus) and Tomato (Solanum lycopersicum) Using Environmental DNA. Water 2017, 9, 1–8. [Google Scholar]
- Cardinale, M.; Grube, M.; Erlacher, A.; Quehenberger, J.; Berg, G. Bacterial networks and co-occurrence relationships in the lettuce root microbiota. Environ. Microbiol. 2015, 17, 239–252. [Google Scholar] [CrossRef] [PubMed]
- Schreiter, S.; Ding, G.-C.; Heuer, H.; Neumann, G.; Sandmann, M.; Grosch, R.; Kropf, S.; Smalla, K. Effect of the soil type on the microbiome in the rhizosphere of field-grown lettuce. Front. Microbiol. 2014, 5, 144. [Google Scholar] [CrossRef]
- Hayat, R.; Ali, S.; Amara, U.; Khalid, R.; Ahmed, I. Soil beneficial bacteria and their role in plant growth promotion: A review. Ann. Microbiol. 2010, 60, 579–598. [Google Scholar] [CrossRef]
- Berg, G.; Smalla, K. Plant species and soil type cooperatively shape the structure and function of microbial communities in the rhizosphere. FEMS Microbiol. Ecol. 2009, 68, 1–13. [Google Scholar] [CrossRef] [PubMed] [Green Version]
- Cruaud, P.; Vigneron, A.; Lucchetti-Miganeh, C.; Ciron, P.E.; Godfroy, A.; Cambon-Bonavita, M.-A. Influence of DNA Extraction Method, 16S rRNA Targeted Hypervariable Regions, and Sample Origin on Microbial Diversity Detected by 454 Pyrosequencing in Marine Chemosynthetic Ecosystems. Appl. Environ. Microbiol. 2014, 80, 4626–4639. [Google Scholar] [CrossRef] [Green Version]
- Darwish, N.; Shao, J.; Schreier, L.L.; Proszkowiec-Weglarz, M. Choice of 16S ribosomal RNA primers affects the microbiome analysis in chicken ceca. Sci. Rep. 2021, 11, 11848. [Google Scholar] [CrossRef]
- Barret, M.; Guimbaud, J.F.; Darrasse, A.; Jacques, M.A. Plant microbiota affects seed transmission of phytopathogenic microorganisms. Mol. Plant Pathol. 2016, 17, 791–795. [Google Scholar] [CrossRef] [Green Version]
- Rochefort, A.; Simonin, M.; Marais, C.; Guillerm-Erckelboudt, A.-Y.; Barret, M.; Sarniguet, A. Transmission of Seed and Soil Microbiota to Seedling. mSystems 2021, 6, e0044621. [Google Scholar] [CrossRef] [PubMed]
- Badri, D.V.; Vivanco, J.M. Regulation and function of root exudates. Plant. Cell Environ. 2009, 32, 666–681. [Google Scholar] [CrossRef] [PubMed]
- Kazi, T.G.; Arain, M.B.; Jamali, M.K.; Jalbani, N.; Afridi, H.I.; Sarfaz, R.A.; Baig, J.A.; Shah, A.Q. Assessment of water quality of polluted lake using multivariate statistical techniques: A case study. Ecotoxicol. Environ. Saf. 2009, 72, 301–309. [Google Scholar] [CrossRef] [PubMed]
Figure 1.
Water flow in the closed-loop aquaponic system of Gembloux Agro-Bio Tech, i.e., the PAFF Box.
Figure 1.
Water flow in the closed-loop aquaponic system of Gembloux Agro-Bio Tech, i.e., the PAFF Box.

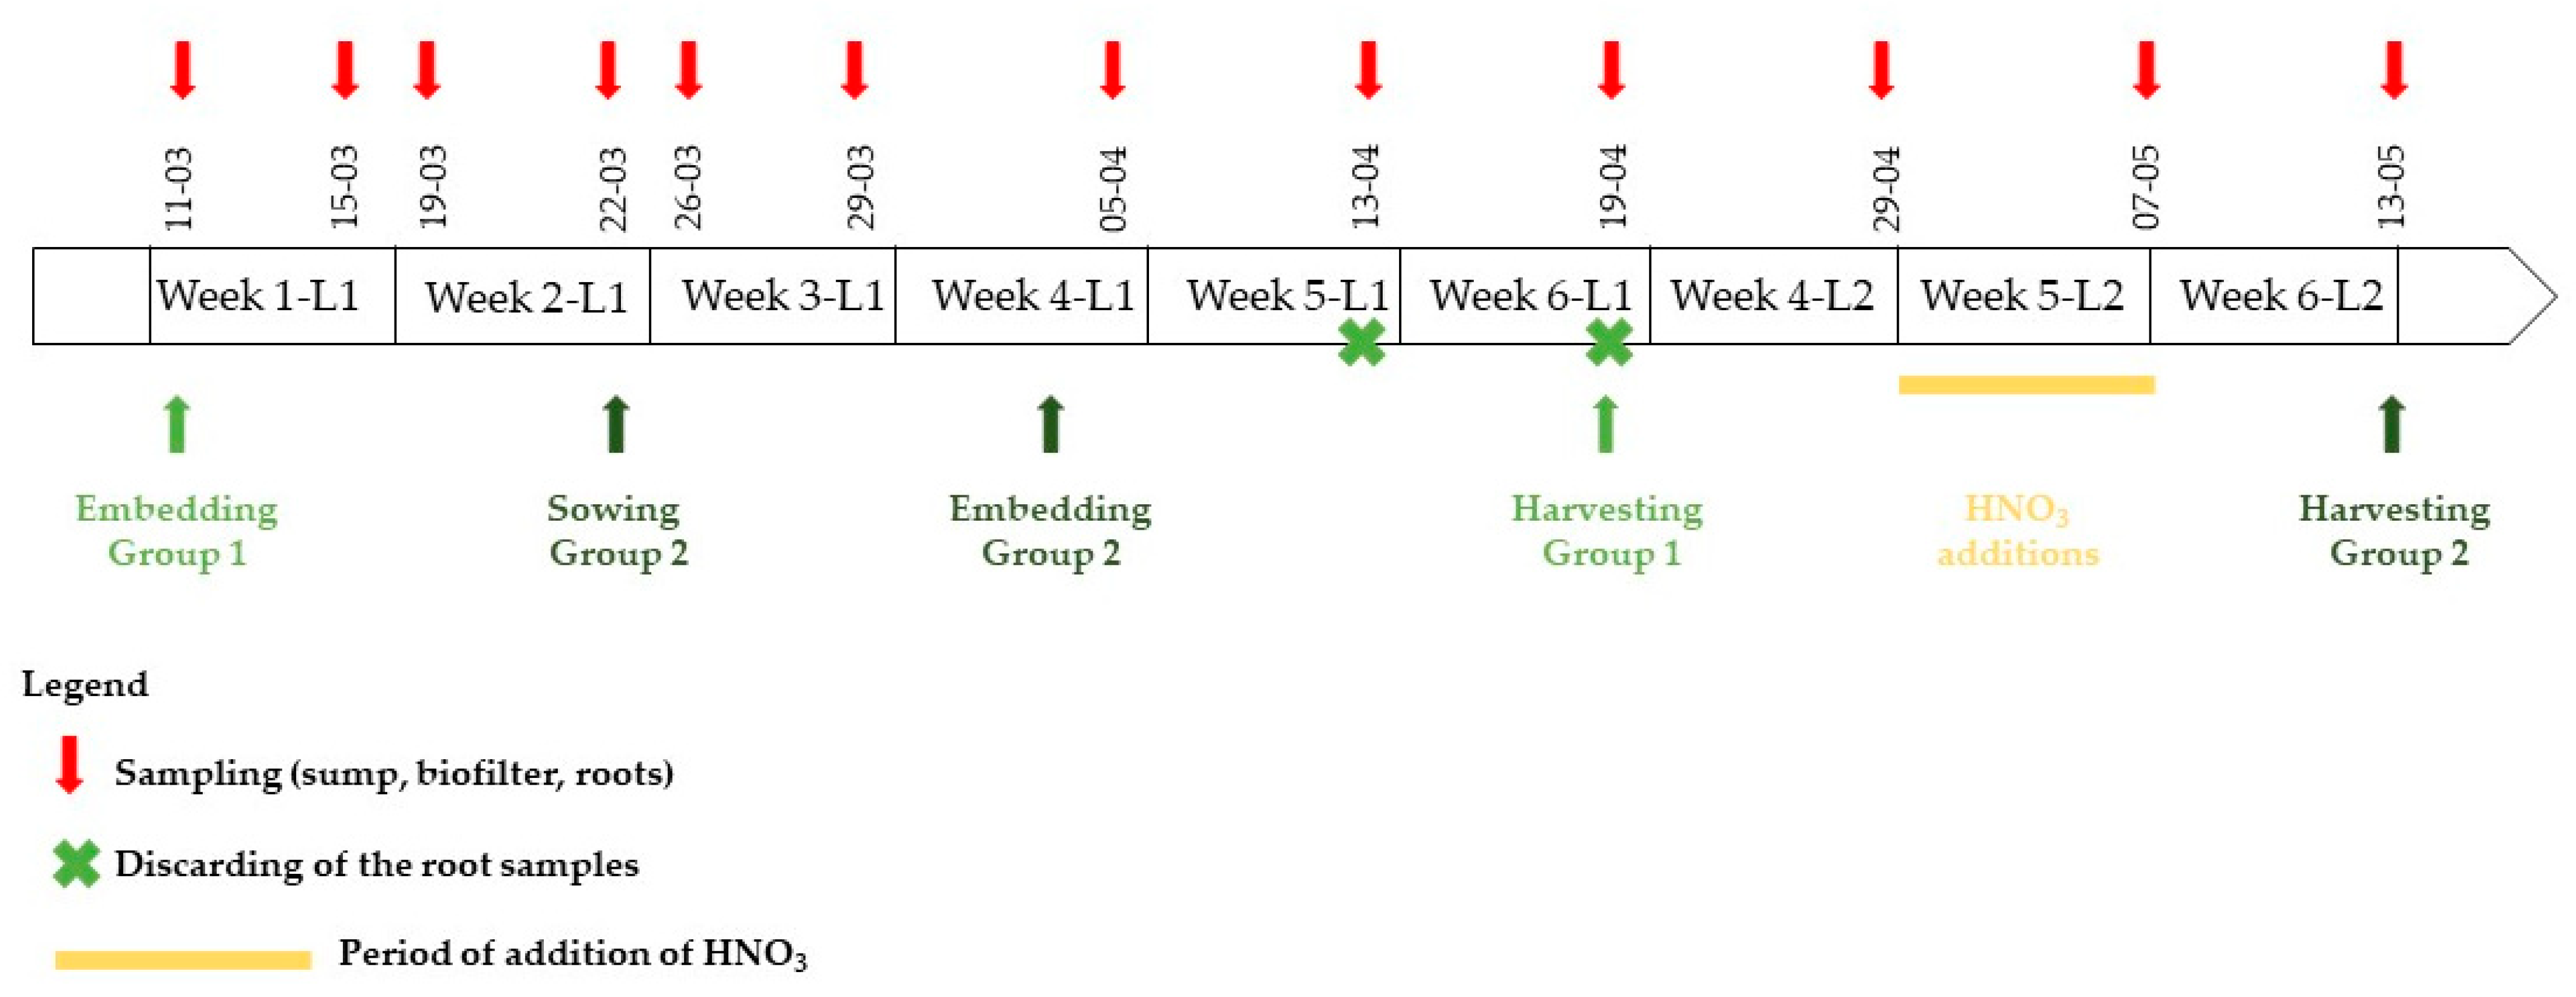
Figure 2.
Timeline of the experiment. Samplings were conducted in the four compartments simultaneously and are indicated by a red arrow. The first lettuce group was sown on 28 February 2019 and embedded on March 11. In parallel, a second group of lettuces was sowed on March 22 and embedded on April 3. Root samples from the first group of lettuce, which were collected on April 13 and 19 were discarded as the lettuces appeared diseased (Supplementary Materials, Figure S1). All lettuces from group 1 were then discarded and the focus of the study was shifted in group 2 starting from April 29.

Figure 3.
Weighted UNIFRAC Principal Coordinates Analysis representing the grouping of samples per compartment.
Figure 3.
Weighted UNIFRAC Principal Coordinates Analysis representing the grouping of samples per compartment.

Figure 4.
PCA representation (a) of the hierarchical clustering of sampling dates based on four water parameters (EC, pH, T, [NO3]). Dimension one represent 42.6% of the variability and distinguishes sampling dates based on EC and T (see variables factor map in (b)) while dimension two represents 47.08% of the variability and separates the samples based on pH and [NO3] (see variables factor map in (b)). Once put into chronological order, the five physicochemical groups are represented on the timeline (c). White intervals on the timeline represent periods where data was lost due to probe problems. Between March 11 and April 5, the lettuce group 1 was sampled. On April 13 and April 19 the, the lettuce group 1 samples were discarded due to disease symptoms and only the sump and biofilter samples were kept. On April 29, May 5 and May 13, the lettuce group 2 was sampled. Red arrows highlight the sampling dates.

Figure 5.
Barplots representing the relative abundances of the taxa representing more than 1% (in average) of each of the four compartments. The taxa representing less than 1% are gathered in the “others” group. In the legend, taxa are classified by taxonomic level and alphabetical order. The Rh-5a-L1, Rh-6a-L1, R-5a-L1 and R-6a-L1 were discarded as the lettuces presented disease symptoms.

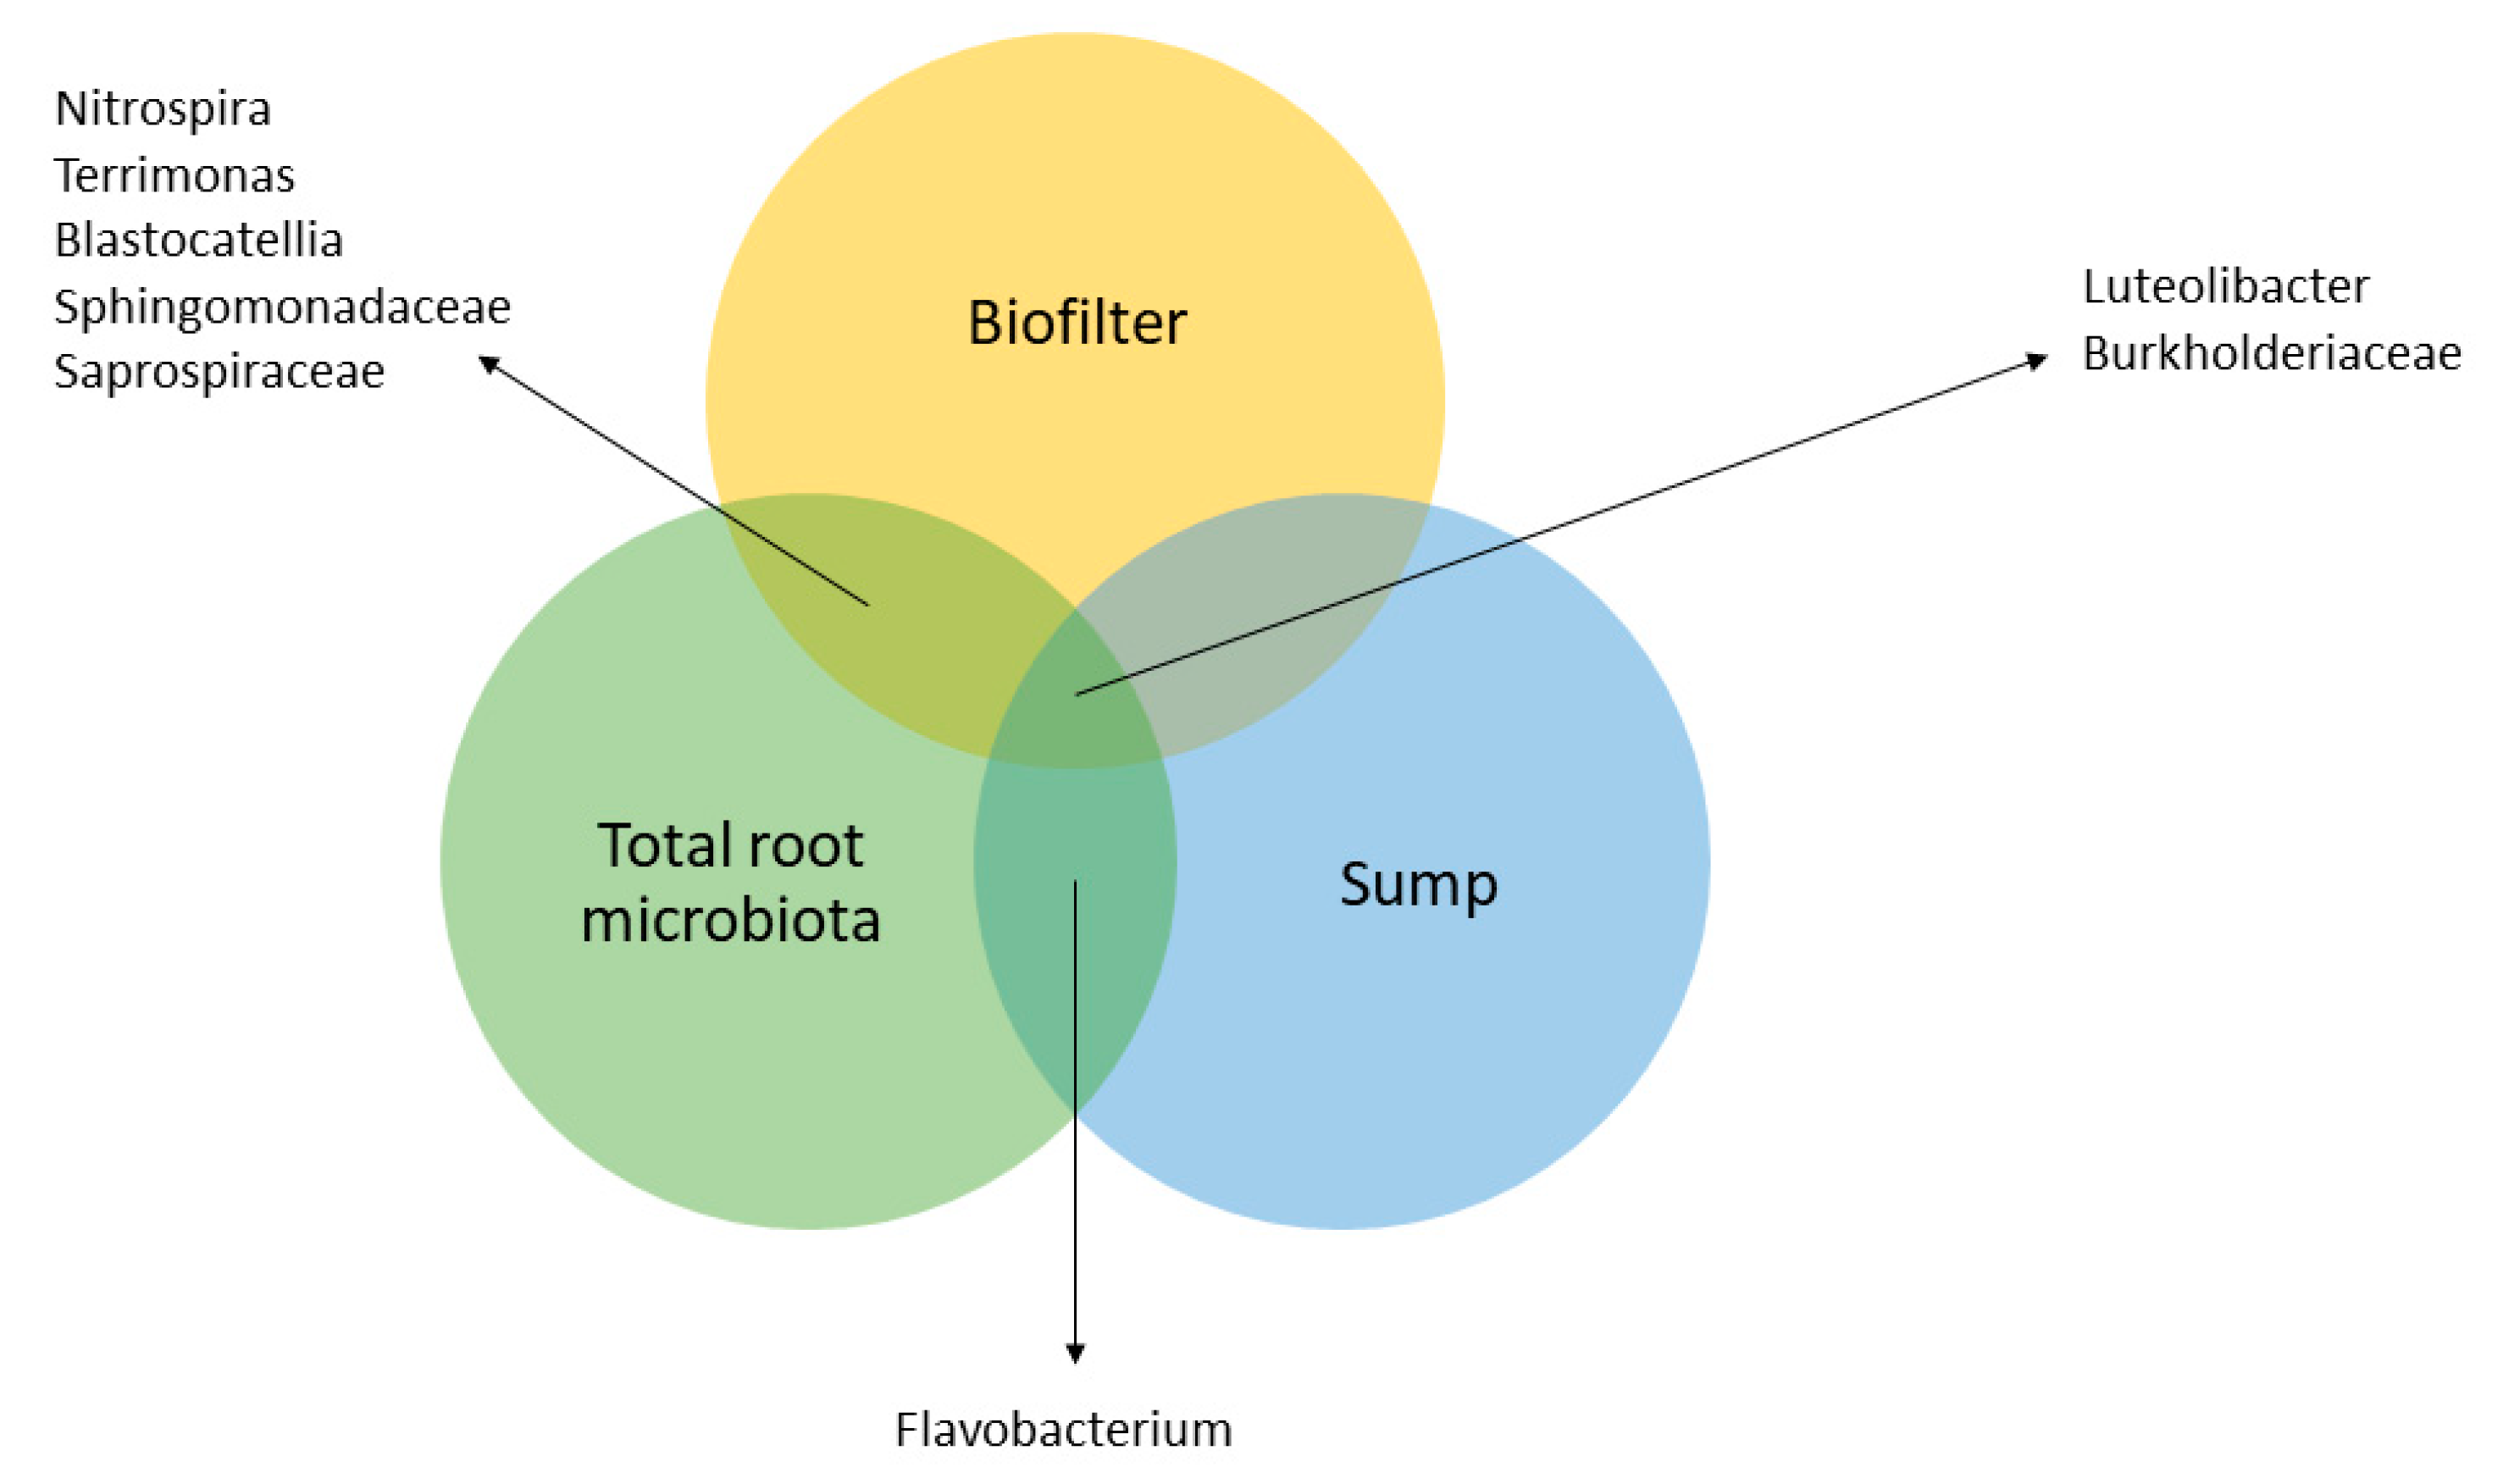
Figure 6.
Venn diagram representing the shared bacterial taxa between the system’s compartments. Rhizoplane and root microbiota are gathered in the total root microbiota circle. Common taxa were identified based on the taxa representing more than 1% (in average) of each compartment.
Figure 6.
Venn diagram representing the shared bacterial taxa between the system’s compartments. Rhizoplane and root microbiota are gathered in the total root microbiota circle. Common taxa were identified based on the taxa representing more than 1% (in average) of each compartment.

Figure 7.
Weighted Unifrac PCoA per compartment showing the repartition of the samples week after week in the sump and biofilter (a) and in the rhizoplane and root (b) compartments. Arrows link the sampling dates in the chronological order. The biofilter, rhizoplane and root compartments seem to present an evolution throughout time.


Table 1.
Observed-otus and Shannon indices for each compartment.
| Biofilter | Sump | Rhizoplane | Root | |
|---|---|---|---|---|
| Observed-otus | 528 | 503 | 655 | 223 |
| Shannon | 6.6 | 4.2 | 7.4 | 6.3 |
Table 2.
Spearman correlations between alpha-diversity indices and water and system parameters when significant (p-value < 0.05). The correlation coefficients are available in the ‘r’ column with the corresponding p-value.
Table 2.
Spearman correlations between alpha-diversity indices and water and system parameters when significant (p-value < 0.05). The correlation coefficients are available in the ‘r’ column with the corresponding p-value.
| Biofilter | Rhizoplane | |||||||||
|---|---|---|---|---|---|---|---|---|---|---|
| Time | T° | EC | NO3 | NO3 | ||||||
| Alpha-Diversity Index | R | P-Value | R | P-Value | R | P-Value | R | P-Value | R | P-Value |
| Shannon | −0.64 | 0.0261 | −0.82 | 0.0038 | ||||||
| Observed_OTUs | −0.73 | 0.0074 | ||||||||
| Faith_PD | −0.82 | 0.0011 | 0.59 | 0.0446 | −0.81 | 0.0049 | ||||
| Evenness | −0.67 | 0.0168 | ||||||||
Publisher’s Note: MDPI stays neutral with regard to jurisdictional claims in published maps and institutional affiliations. |
© 2021 by the authors. Licensee MDPI, Basel, Switzerland. This article is an open access article distributed under the terms and conditions of the Creative Commons Attribution (CC BY) license (https://creativecommons.org/licenses/by/4.0/).
Share and Cite
MDPI and ACS Style
Eck, M.; Szekely, I.; Massart, S.; Jijakli, M.H. Ecological Study of Aquaponics Bacterial Microbiota over the Course of a Lettuce Growth Cycle. Water 2021, 13, 2089. https://doi.org/10.3390/w13152089
AMA Style
Eck M, Szekely I, Massart S, Jijakli MH. Ecological Study of Aquaponics Bacterial Microbiota over the Course of a Lettuce Growth Cycle. Water. 2021; 13(15):2089. https://doi.org/10.3390/w13152089
Chicago/Turabian StyleEck, Mathilde, Iris Szekely, Sébastien Massart, and M. Haïssam Jijakli. 2021. "Ecological Study of Aquaponics Bacterial Microbiota over the Course of a Lettuce Growth Cycle" Water 13, no. 15: 2089. https://doi.org/10.3390/w13152089
Note that from the first issue of 2016, this journal uses article numbers instead of page numbers. See further details here.