
Evolution of Inclusions in Magnesium–Calcium-Treated Liquid Iron

School of Iron and Steel, Soochow University, Suzhou 215137, China
*
Authors to whom correspondence should be addressed.
Metals 2021, 11(8), 1213; https://doi.org/10.3390/met11081213
Submission received: 27 June 2021
/
Revised: 23 July 2021
/
Accepted: 26 July 2021
/
Published: 30 July 2021
Abstract
:With the development of clean steel technology, the control of non-metallic inclusions in steel is of increasing importance. Magnesium–calcium treatment can effectively balance the castability of molten steel and the control on inclusion size, which is an inclusion modification approach with application prospect. In view of this, how three addition methods (i.e., adding Mg before Ca, adding Mg after Ca, and adding Mg together with Ca) influenced the modification effect of inclusions in liquid iron was experimentally studied, and how these inclusions evolved with time was discussed in this paper. The results demonstrated that despite the sharp difference in their inclusion evolution, composite inclusions with a magnesium aluminate spinel (MAS) core and an outer CaO–Al2O3–MgO layer were formed by all the three addition methods, with the average inclusion size of 1–2 μm. Furthermore, thermodynamic calculation was adopted to reveal the transformation relationship between MAS and calcium aluminate in each of the three addition methods, and clarify the formation and disappearance mechanisms of the intermediate product CaS in the process of Mg–Ca treatment. The thermodynamic calculation results agreed well with the experiment data.
1. Introduction
Steel cleanliness plays a vital role in determining the properties of steel, such as toughness, ductility, formability, corrosion resistance, and surface quality. Non-metallic inclusions essentially reflect steel cleanliness, and the defects of steel products are closely related to them. Evidence can always be found to confirm that almost all typical defects of steel are directly associated with inclusions, such as surface defects of cold rolled sheet, fatigue fracture of bearing steel, drawing break of cord steel, and fin crack of can steel. Therefore, in-depth studies on inclusions are necessary to develop clean steel. Inclusions primarily come from the by-products of deoxidation in steelmaking. Since no deoxidation method can take the place of precipitation deoxidation on a large scale so far, inclusions remain a permanent research topic in the field of steelmaking in the foreseeable future.
Due to their complex physical–chemical reactions with atmosphere, molten steel, slags and refractories in the process of steel smelting, inclusions evolve constantly, which poses great challenges to tracking, analysis and control of inclusions. At present, there are three main control strategies on inclusions: (1) Inclusion removal [1,2,3]. By bottom blowing of inert gas and stirring, physical filtration/adsorption, electromagnetic purification, ultrasonic wave and other ways, inclusion particles are promoted to collide each other and form into larger particles, which then move upwards and are absorbed by the top dross; (2) Inclusion modification [4,5,6,7,8]. Active metals such as Ca, Mg and RE are added to the steel to react with inclusions and generate new-type inclusions, thus rendering them insensitive to some properties of steel and mitigating their harm; and (3) Oxide metallurgy [9,10]. A large number of inclusion particles in small size and sufficient quantity are produced in steel or introduced into steel, which can pin austenite grain boundaries, promote massive nucleation of intragranular ferrite (IAF) and improve the toughness of welding heat affected zone (HAZ), such as the HTUFF technology of Nippon Steel. In general, for harmful inclusions in a size of 10–100 μm, how to remove them as much as possible should be considered in the process of steelmaking; for intermediate inclusions in a size of 0.5–10 μm, a reasonable control of size and distribution should be ensured; and for micro-sized inclusions in a size less than 500 nm, the control on inclusion micronization requires further studies to enable their beneficial effects.
However, the aggregation and growth of inclusion particles formed by primary deoxidation is a spontaneous thermodynamic process, and the control on their size growth is still under exploration. Many papers have proved that adding magnesium and calcium into steel can reduce the size of primary Al2O3 inclusions to some extent, which is attributed to the change of behaviors and contact angle of inclusion–steel interface. Calcium treatment [11,12] can change Al2O3 in steel into liquid calcium aluminate inclusions, and prevents submerged nozzle from nodulation, but calcium aluminate is a hard and brittle inclusion, which exerts a negative effect on the fatigue life of steel. In recent years, the magnesium treatment technology for molten steel has attracted continuous attention from researchers [13,14,15]. The main reasons are that the size of inclusions can be reduced significantly by adding magnesium into molten steel; the spinels and MgO formed can be used as the nucleation sites for TiN and MnS; and the formed fine composite inclusions can promote the microstructure transformation of steel and refine the solidification structure of slabs. Nevertheless, the inability of magnesium treatment to realize the liquid phase of inclusions is also an indisputable fact.
In conclusion, combining the advantages of calcium treatment and magnesium treatment is a good choice, which balances the castability of molten steel and the control on inclusion size. N Verma [16,17] and Yang et al. [18] studied the modification of magnesium aluminate spinel (MAS) inclusions in steel by calcium treatment, considering calcium treatment had a good modification effect on MAS inclusions, but this conclusion was based on MAS is an occasional product in steel. In addition, Zhang et al. [12] explored the evolution rules of inclusions in ladle refining process. MAS formed in the refining process of high basicity slag transformed into Al2O3–CaO–MgO composite inclusions in late refining or after calcium treatment, but the mechanism of action remained controversial. However, there are few studies on the magnesium–calcium treatment and inter-transformation between magnesium aluminate spinel and calcium aluminate.
Thus, a hot working simulation test system was employed in this study to investigate the evolution of inclusions in molten steel in the process of Mg–Ca treatment. The composition changes of inclusions at different reaction time points were studied by adjusting the addition sequence of Ca and Mg to reveal the evolution mechanisms of inclusions in molten steel under Mg–Ca composite treatment based on thermodynamic calculations, which provided a research basis for new technology development of Mg–Ca composite treatment, as well as a new idea and method for the harmless control of inclusions.
2. Materials and Methods
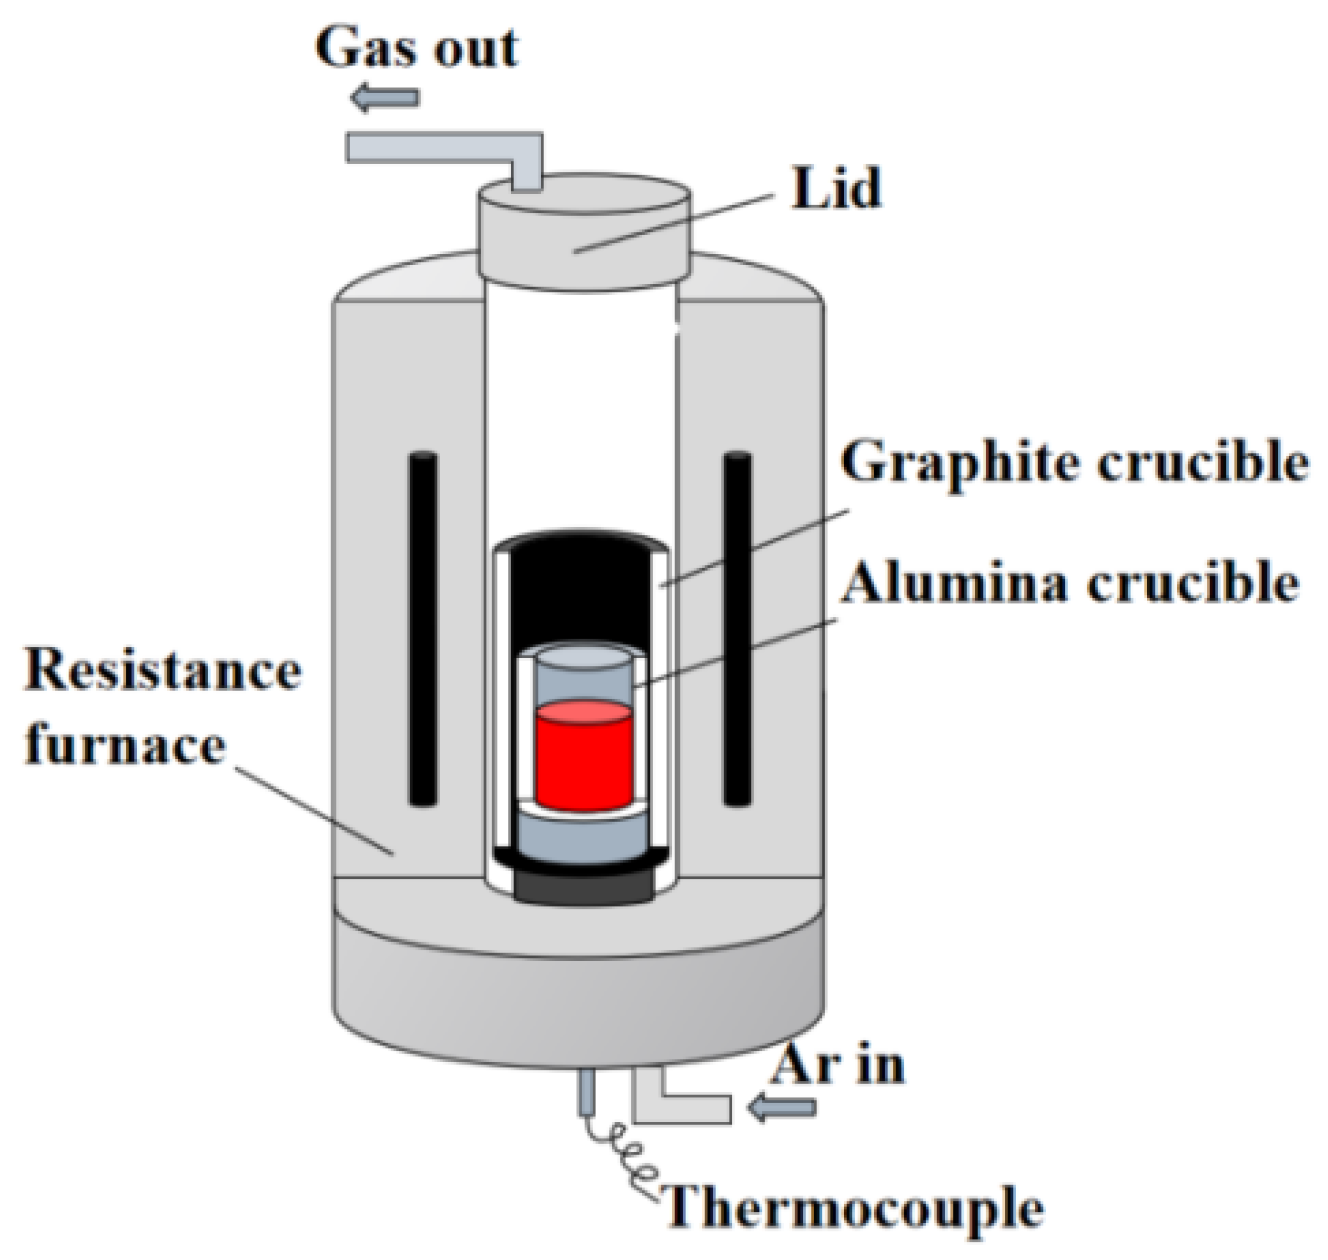
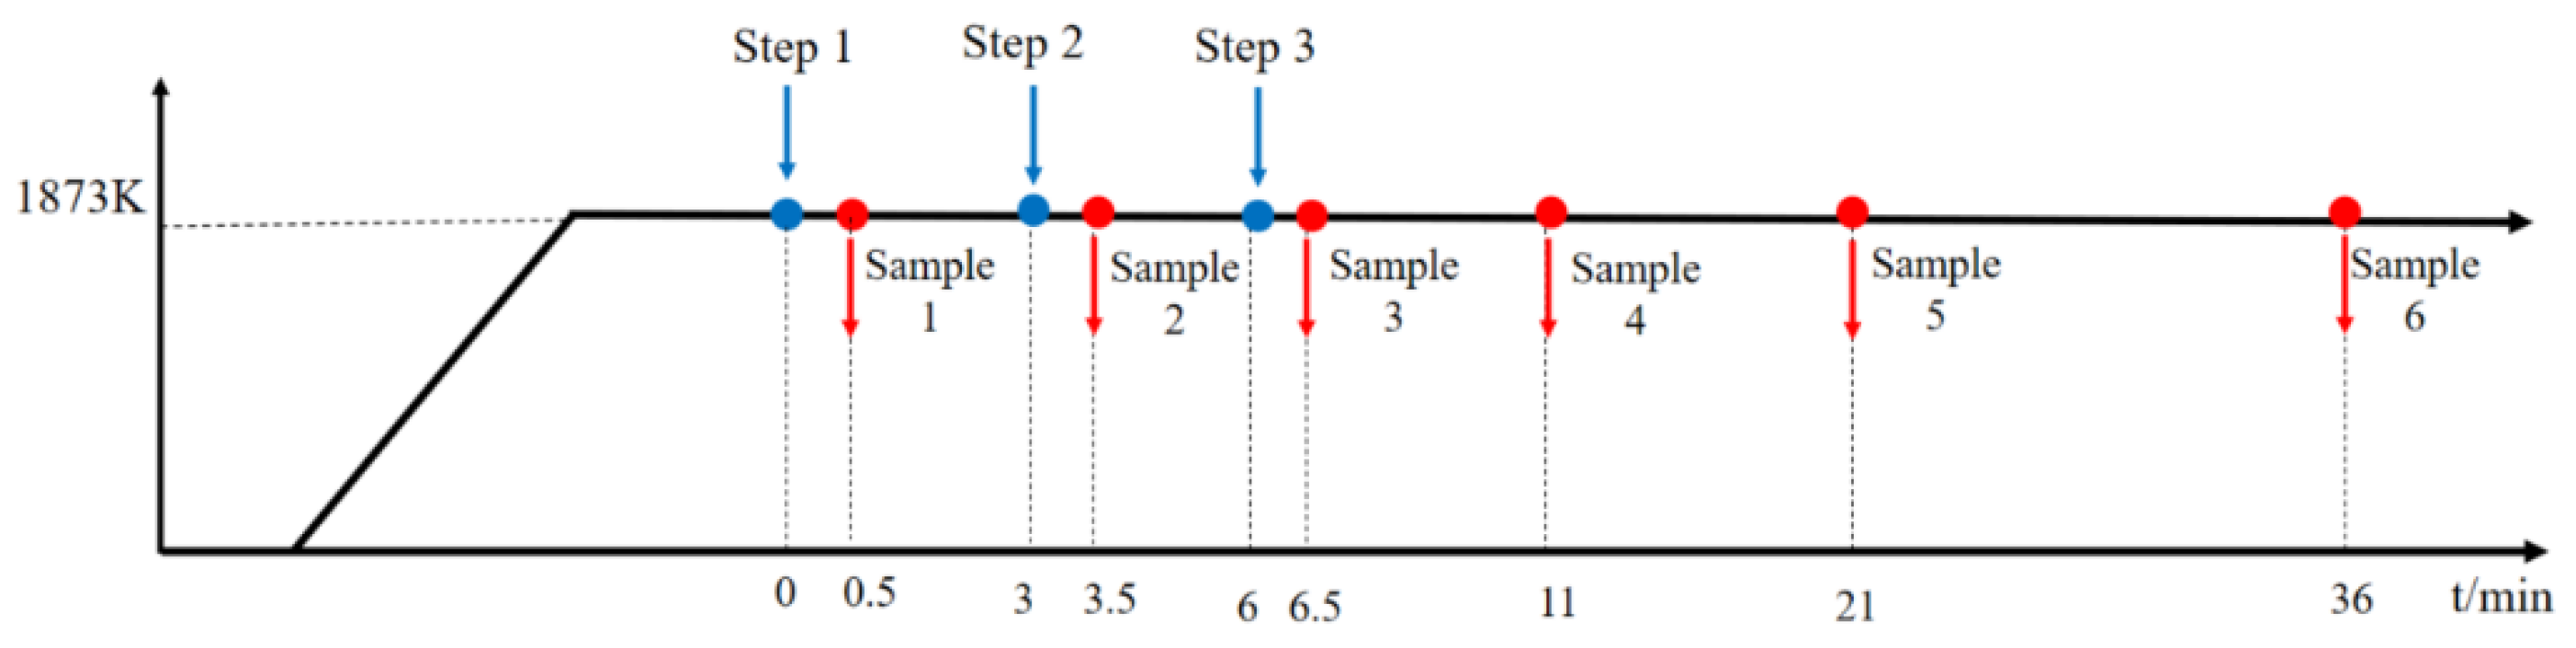
The test materials included industrial pure iron, aluminum metal blocks, pure calcium (Ca > 99%), and nickel–magnesium alloy (80% Ni–20% Mg). We used industrial pure iron as the studied material because we wanted to exclude the influence of alloying elements in steel. The chemical compositions of industrial pure iron are shown in Table 1. The test device was a high-temperature atmosphere protection resistance furnace, as shown in Figure 1. First, 1000 g of industrial pure iron was put into a high-purity alumina crucible (with a graphite crucible placed over it), which was then placed in the constant temperature zone of the resistance furnace. Then the furnace was vacuumed to 10–20 MPa and high-purity argon was injected at a flow rate of 5 L/min into the furnace from bottom; the temperature of the sample was raised to 1873 K at 10 K/min and then held for 30 min to ensure complete melting down of the iron. After that, the furnace lid was opened to insert an aluminum metal block wrapped with mild steel sheet into the liquid iron immediately; a molybdenum rod was used to stir it for 5 s, increase the Al content in iron to 0.02%; and after 30 s, a 10 g liquid iron sample was taken by a quartz ladle (19 mm high, 16 mm inner diameter). The sampling process is illustrated in Figure 2. Case 1: Pure calcium was added into the Al-deoxidized liquid iron, and a sample was taken after 30 s by a quartz ladle for water quenching. Then Ni–Mg alloy was added after 3 min, and samples were taken after 30 s, 5 min, 15 min and 30 min for water quenching. The remaining liquid iron was left in the furnace for air cooling to room temperature under the protection of furnace atmosphere. Case 2: The addition sequence of calcium and Ni–Mg alloy was reversed, while the addition amounts and sampling method remained unchanged. Case 3: After deoxidation with Al, calcium and Ni–Mg alloy were added into the liquid iron simultaneously, with the addition amounts and sampling method unchanged. The addition amounts of deoxidizer and alloy are listed in Table 2. According to the pilot test results, the yields of aluminum metal, pure calcium and magnesium in Ni–Mg alloy were 70%, 5% and 15%, respectively.
The iron sample air cooled in furnace were cut into 1 g slices and dissolved in 20 mL mixed acid (HNO3: HCl: pure water = 1:3:4). A 6300 ICP analyzer (Varian Medical Systems, Salt Lake City, UT, USA) was employed to analyze the contents of Al, Mg and Ca in the sample, a CS-8800C analyzer (Jinyibo Instrument, Wuxi, Jiangsu, China) to analyze the content of S in samples, and an ONH-3000 analyzer (NCS Inc., Beijing, China) to analyze the content of T.O (total oxygen content) in the sample (metal + inclusions). After all the samples were cut and polished, the morphology, composition and size of inclusions were observed and recorded by a SU5000 field emission scanning electron microscope (Hitachi, Tokyo, Japan), and the quantity of analyzed inclusions in each sample was not less than 50.
Table 3 exhibits the test results of chemical composition of the three groups of samples cooled in the furnace. The aluminum content in the iron was basically controlled at the level of 0.02%; the magnesium content was controlled at 0.0012–0.0015%; and the calcium content fluctuated slightly, within the range of 0.0007–0.0012%. Therefore, the chemical composition was accurately controlled, which was generally consistent with the theoretical expectation. In addition, the S content in the iron was basically unchanged, and the T.O. content was approximately 0.002%—slightly higher than the industrial production value. This was mainly due to the slag-free smelting adopted in this experiment and the inability to accurately control the atmosphere in the sampling process.
3. Results
3.1. Evolution of Inclusions in Liquid Iron
3.1.1. Evolution of Inclusions in Liquid Iron When Adding Mg after Ca
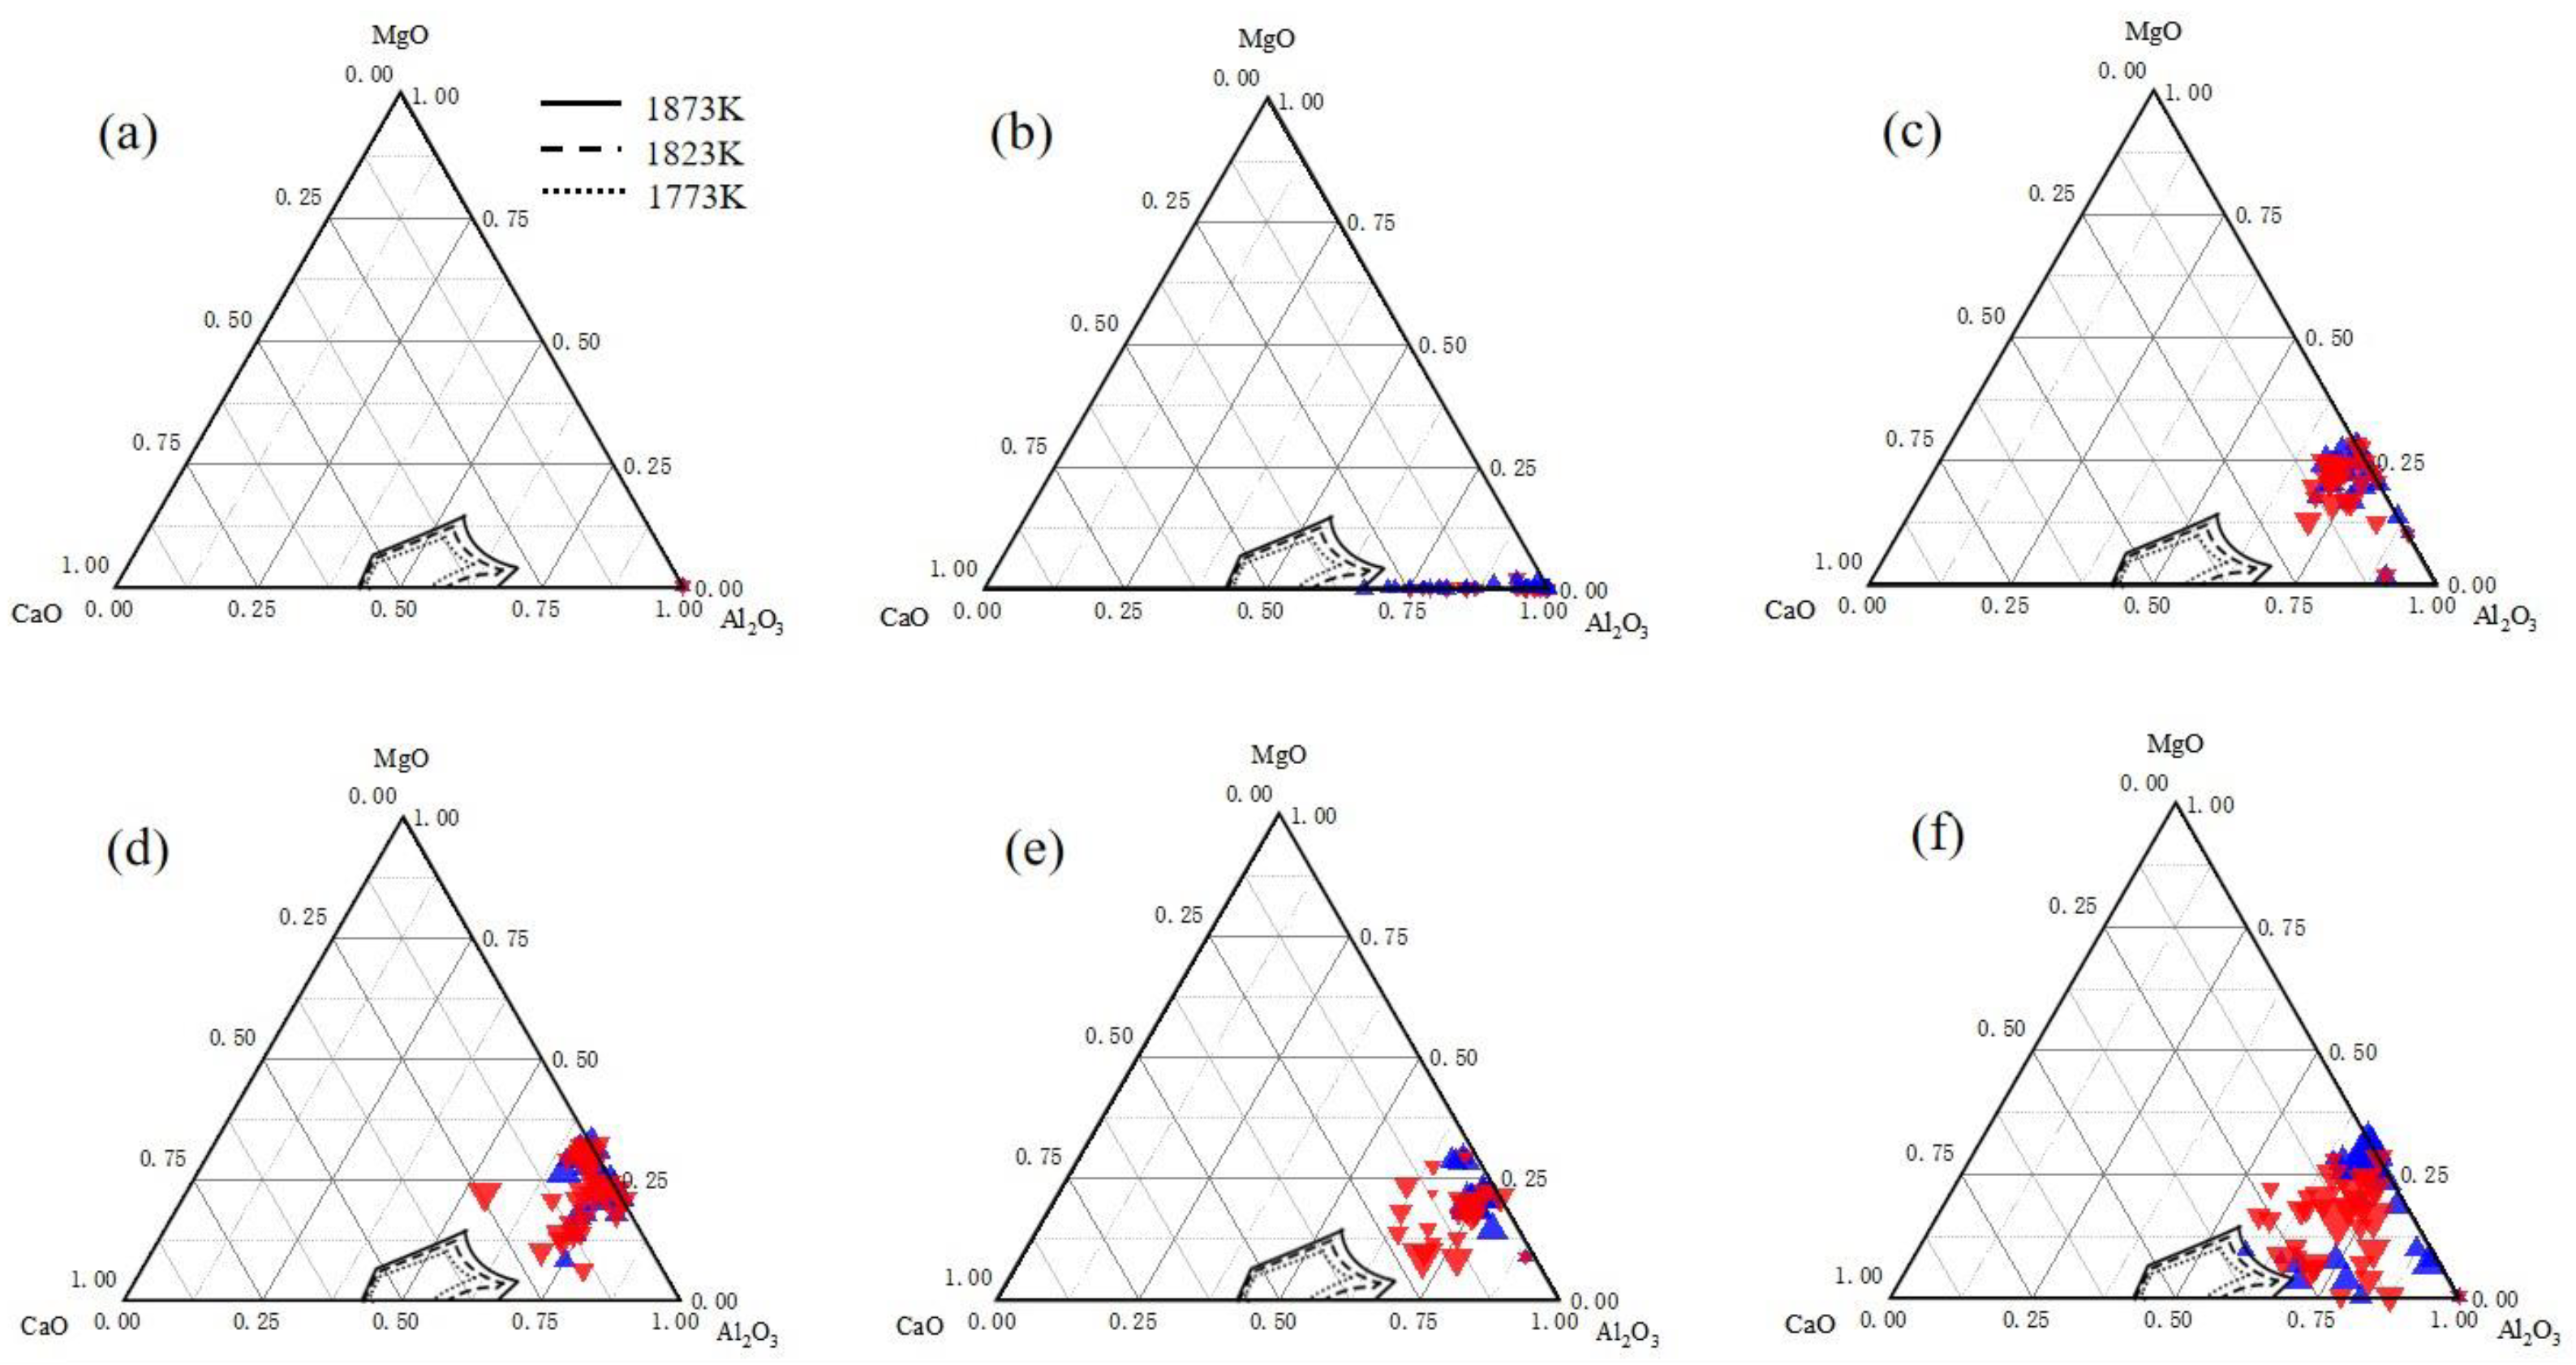
For inclusion analysis, 50 inclusions were randomly selected through the SEM to scan the core and periphery of the inclusions for composition statistics, for which the results are shown in Figure 3. The red triangle represents the composition in periphery of inclusion and the blue one means the composition in core.
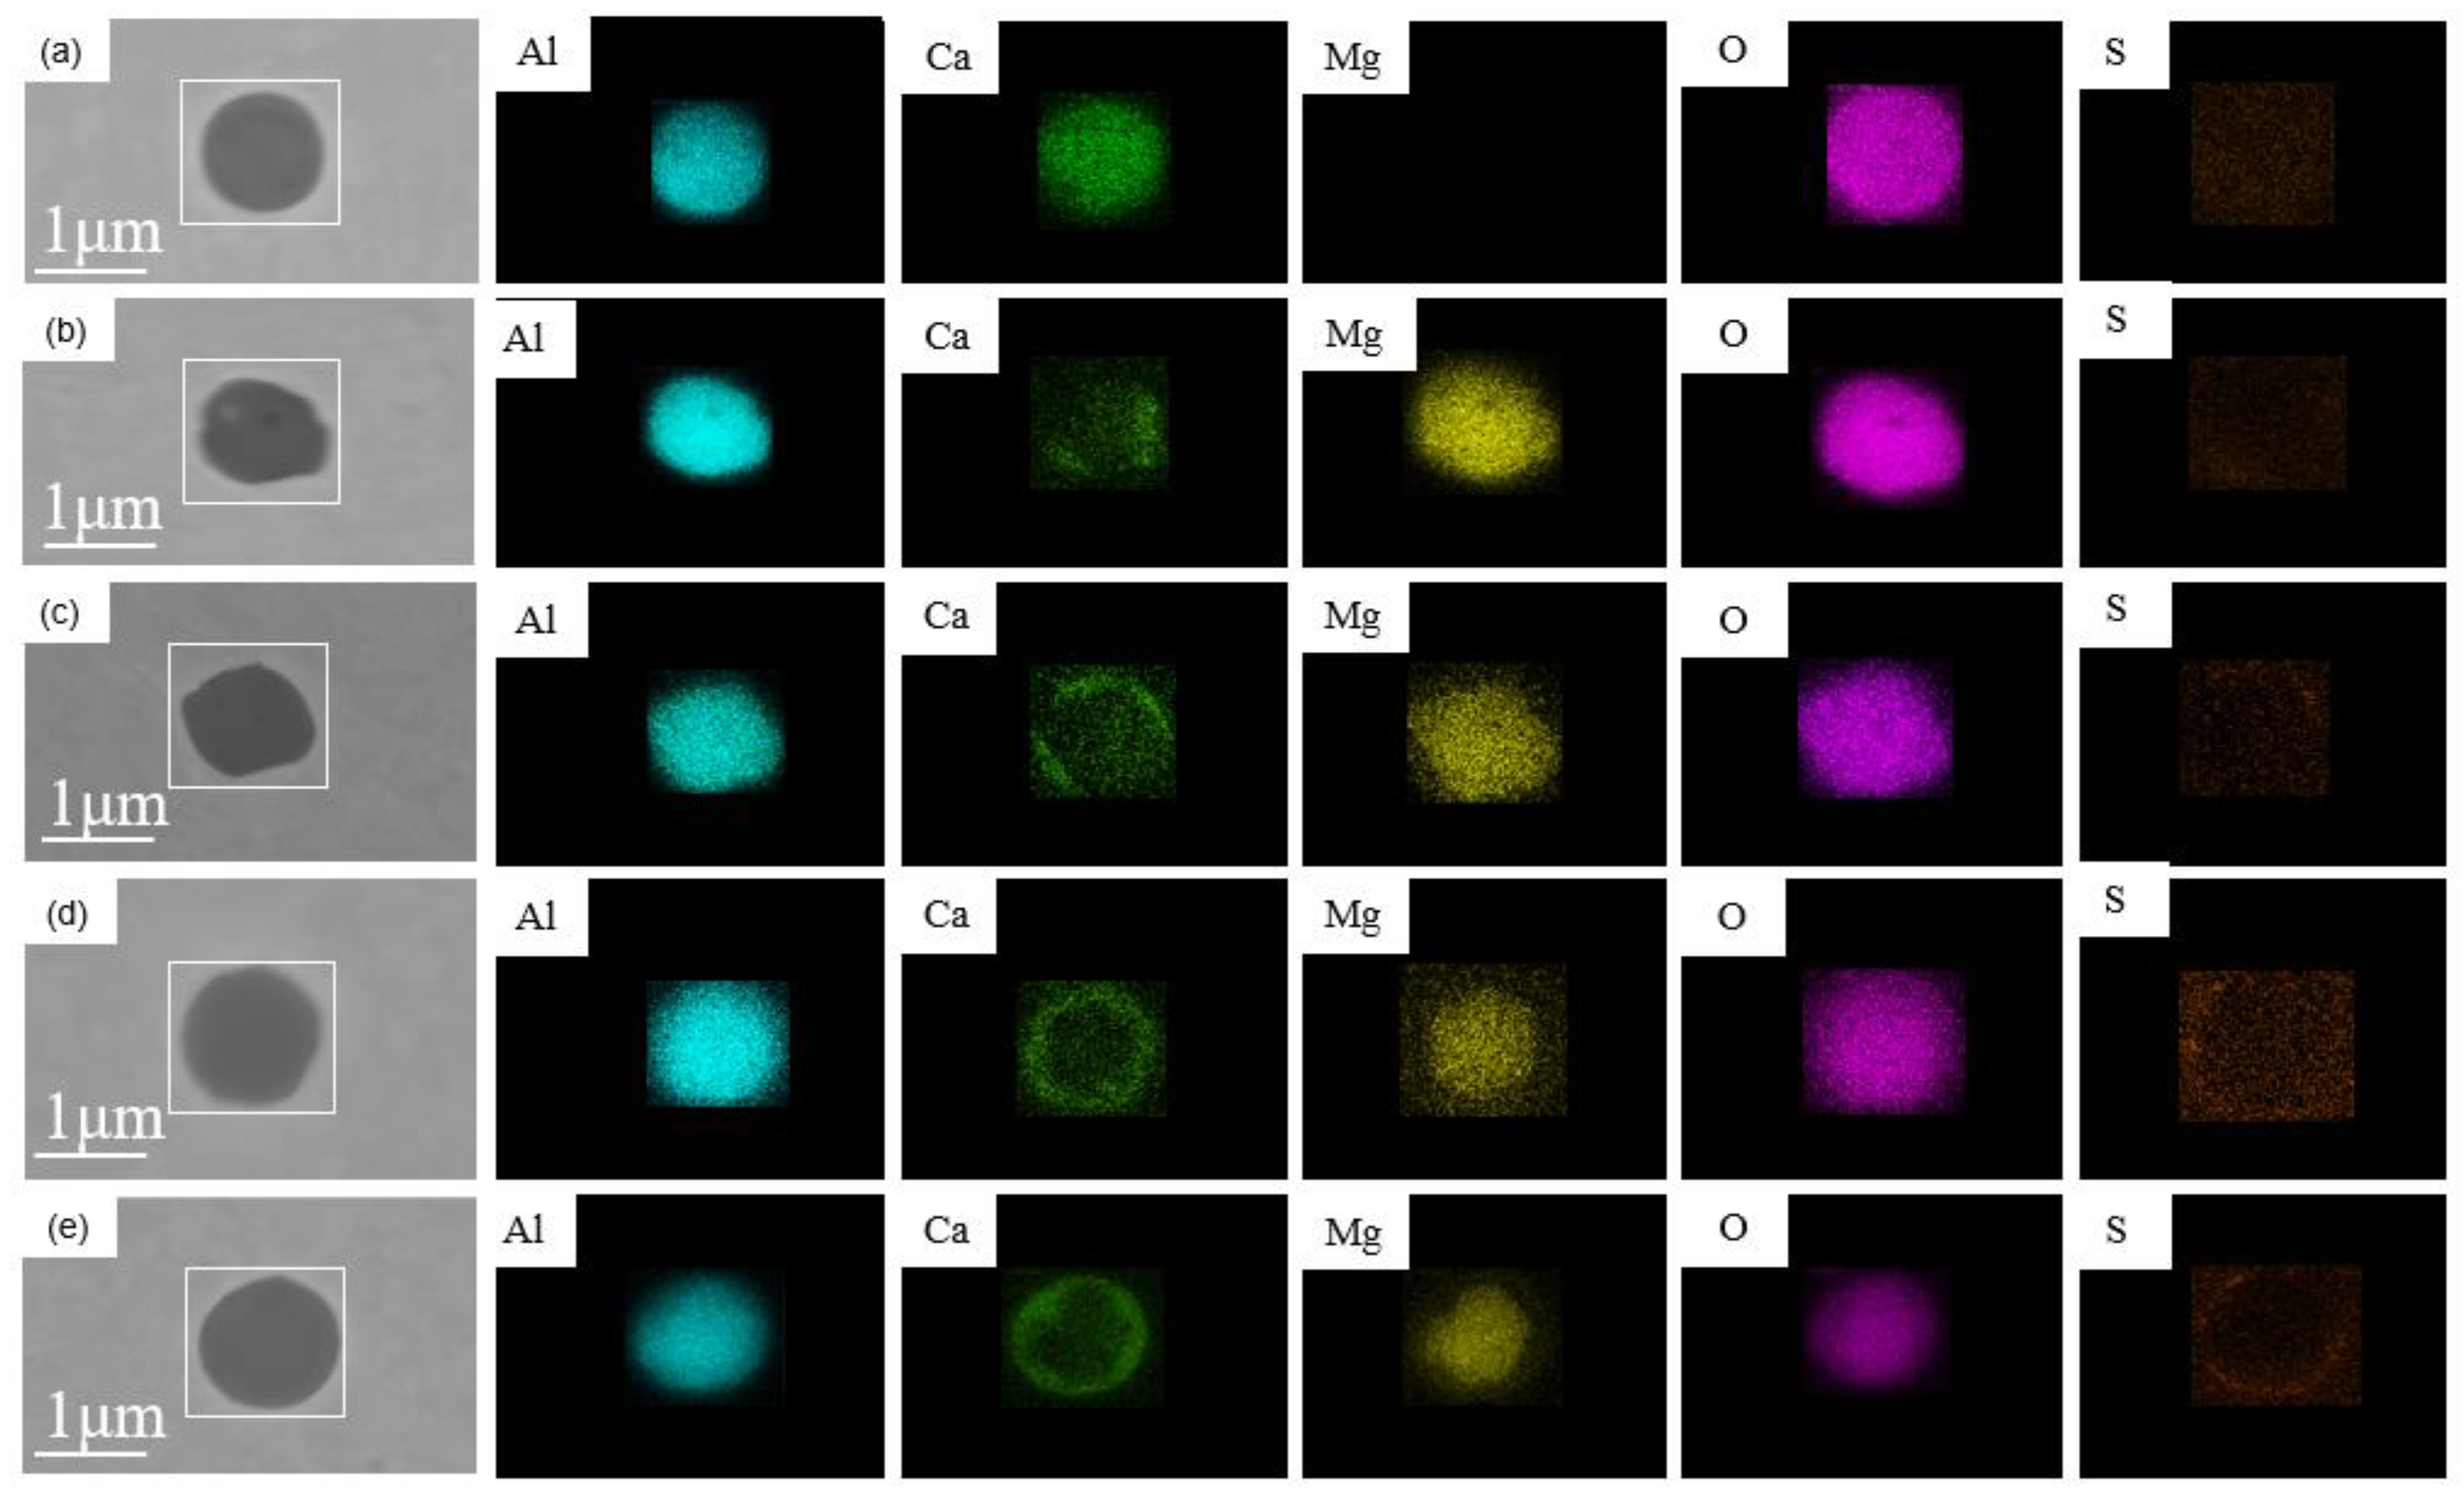
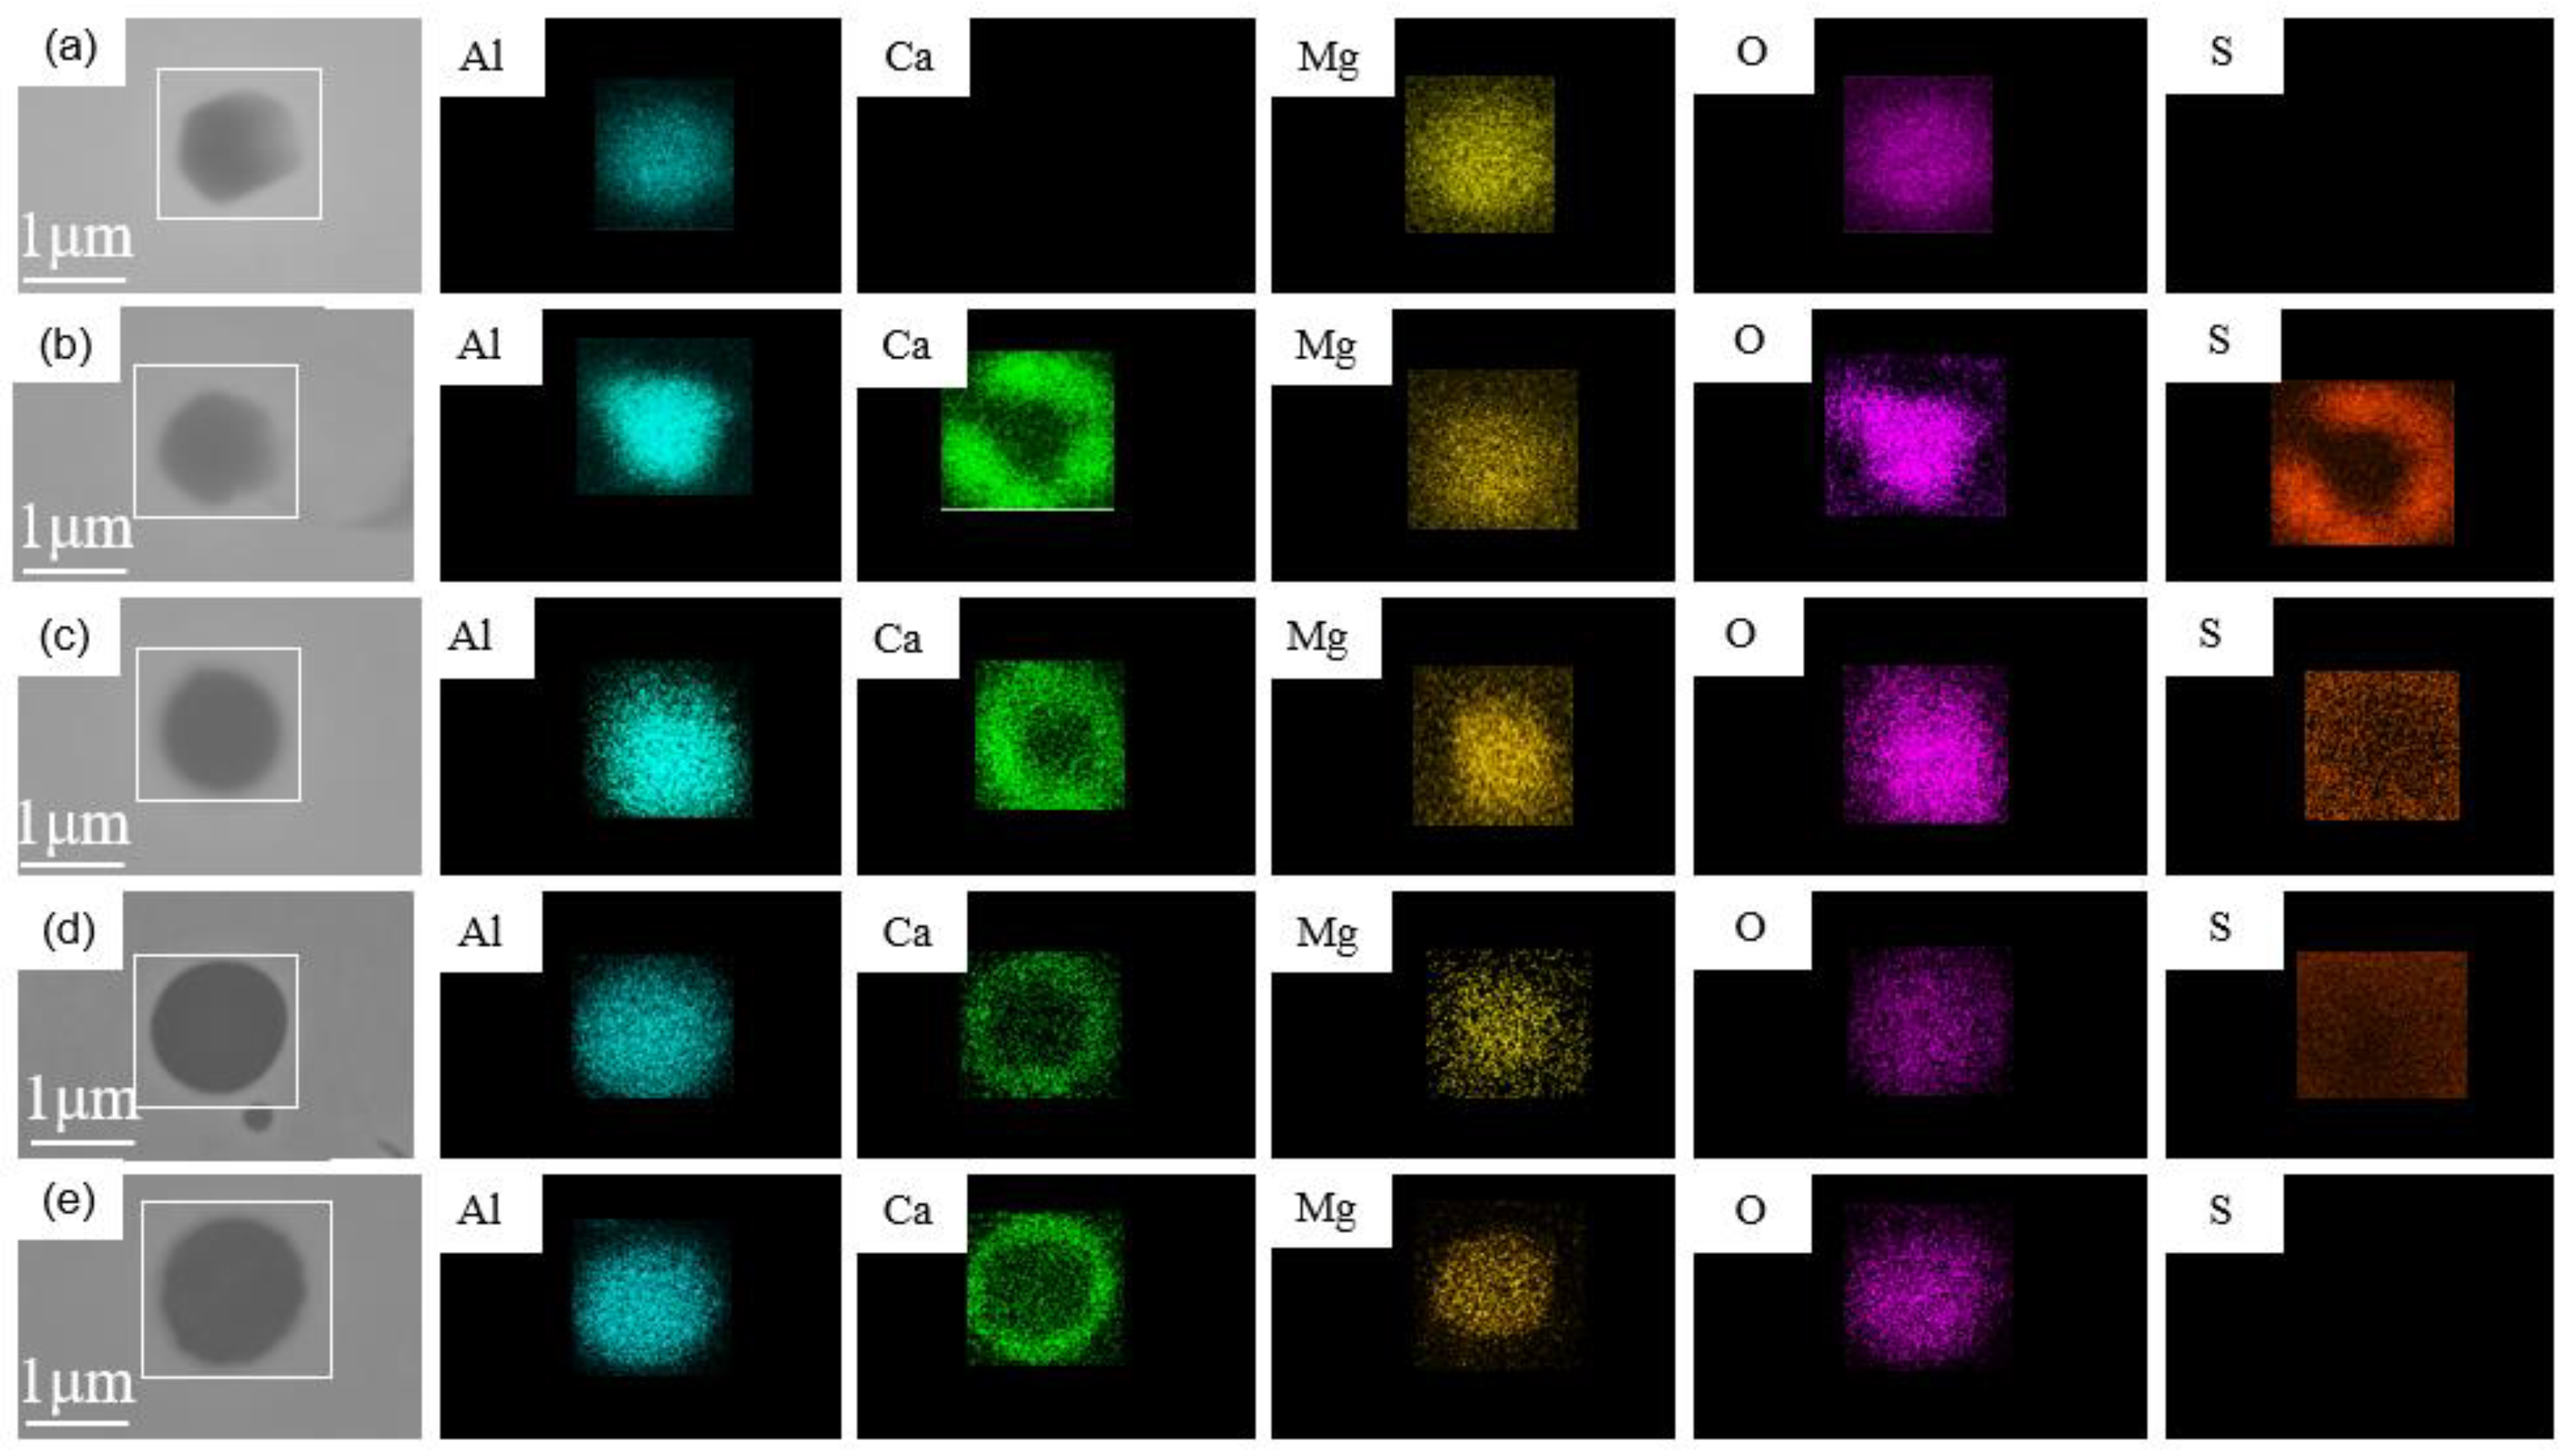
After deoxidation by adding Al, the main inclusions were irregular or cluster-like Al2O3 inclusions. At 30 s after calcium addition, the CaO content in the inclusions increased obviously, and the inclusions transformed into spherical or nearly spherical calcium aluminate, indicating the reaction between calcium metal and Al2O3 was insufficient, and some of Al2O3 did not fully transform into liquid calcium aluminate. At 30 s after magnesium addition, many irregularly shaped MAS inclusions were immediately formed in the liquid, while the original calcium aluminate basically disappeared, and CaO was found in the periphery of inclusions, as shown in Figure 4. The results demonstrated that adding magnesium into liquid iron could modify the inclusions extremely fast, which was also mentioned in authors’ previous research. Meanwhile, the inclusion type as shown in Figure 5 was identified in the samples, namely composite inclusions with a Ca–Al–Mg–O core, two MAS ends, and an outer CaS layer. The authors speculated that the inclusions were the intermediate product of calcium aluminate transforming into MAS. After added into liquid iron, magnesium reacted with calcium aluminate first, displaced part of calcium in inclusions, and transformed into CaO–Al2O3–MgO. As the reaction proceeded, CaO in the outermost part of inclusions was consumed first, forming Al2O3–MgO, the formed magnesium aluminate spinel is solid and difficult to completely encapsulate liquid CaO–Al2O3–MgO, and further the internal CaO was gradually reduced as well. Moreover, some studies have proved that the diffusion coefficient of calcium metal in Al2O3–MgO was far lower than that in liquid CaO–Al2O3–MgO [19]. The calcium generated from reduction of CaO by Mg diffused outwards through liquid CaO–Al2O3–MgO and aggregated outside the inclusions. As there was no stirring during the reaction, calcium could not diffuse into the liquid iron in a short time. In this case, due to the addition of magnesium and calcium, the oxygen content in the liquid iron had dropped to a very low level, and the calcium metal reacted with [S] in the iron outside the inclusions to produce CaS, thus forming the inclusion type as shown in Figure 5. At 5 min after magnesium addition, the composition in the outer wrapping layer of inclusions tended to be uniform, and the shape of inclusions also changed to spherical. At 15 min after magnesium addition, a multitude of spherical inclusions wrapped with liquid CaO–Al2O3–MgO were found in the iron, indicating the inclusions had completed the modification reaction. In addition, there are thin and uniform CaS layers in the outermost periphery of some inclusions, which separate out during cooling.
3.1.2. Evolution of Inclusions in Liquid Iron When Adding Mg before Ca
Magnesium was first added into Al-deoxidized liquid iron, and Al2O3 transformed into MAS in an extremely short time, with the size generally less than 1 μm. Then at 30 s after calcium addition, CaS or calcium aluminate appeared in the outer layer of MAS, and the inclusions were nearly spherical, as shown in Figure 6. The formation of CaS has been mentioned in a lot of the literature [16,17,20]. CaS was an intermediate product of calcium metal modifying aluminum oxide or spinel, and its reaction process is as follows: when the oxygen content in the liquid iron was extremely low, the calcium metal was added into the liquid iron and reacted with S in the liquid iron to produce the product CaS around the primary aluminum oxide or spinel; subsequently, CaS reacts with Al2O3 to produce calcium aluminate and the reaction occurred gradually from the outside to the inside.
The analysis reflected that before adding calcium, aluminum and magnesium had been added into the iron for deep deoxidation, and the free oxygen content in the liquid iron was extremely low. The raw material used was industrial pure iron, whose S content was approximately 0.0035%. With an extremely low oxygen content, the thermodynamic conditions allowed calcium metal to react with S. With the extension of reaction time, [Ca] in the liquid iron gradually diffused to a uniform state, and the chemical Equation (2) continuously consumed CaS on the inclusion surface. Therefore, at 5 min after calcium addition, the presence of CaS was no longer observed in the inclusions, and the inclusions had transformed into composite inclusions with a MAS core and an outer CaO–Al2O3–MgO (or liquid xCaO∙yAl2O3) layer. At 15 min after calcium addition, there was almost no pure spinel or calcium aluminate inclusion. EDS analysis revealed that the Ca content in the outer layer of inclusions was higher than that in the inner layer, indicating most MAS inclusions had completely transformed into calcium aluminate, but had not completely turned into liquid phase, as shown in Figure 7. Furthermore, after adding calcium, the inclusions displayed a clear trend of growth in size, with inclusions bigger than 5 μm observed.
3.1.3. Evolution of Inclusions in Liquid Iron When Adding Mg Together with Ca
Magnesium and calcium were added simultaneously, and samples were taken after 30 s. The analysis revealed that most inclusions in the liquid iron were pure MAS, and a small amount of MAS inclusions were wrapped by calcium aluminate, with very few single Al2O3 particles, as shown in Figure 8. This indicated that when the Mg concentration was almost the same with the Ca concentration, Mg preferentially reacted with Al2O3 in liquid iron to produce MAS. The authors speculated the main reason was that at 1873 K, the vapor pressure of magnesium metal was 2238 kPa, much higher than that of calcium (190 kPa). Magnesium formed bubbles more quickly in liquid iron to participate in modification reaction of inclusions and preferentially produce the spinel product, which was consistent with the research conclusion given by Wang et al. [21]. Calcium aluminate was observed to form in the outer layer of many MAS inclusions at 5 min after Mg addition together with Ca, as shown in Figure 9. Moreover, when magnesium and calcium were added simultaneously, the CaS inclusions were not found to form in a large number at 30 s after Mg addition together with Ca, which further confirmed the previous finding that CaS was an intermediate product.
3.2. Inclusion Size Change
Fifty inclusions were taken from each sample in the three experiments to record the inclusion size. The variation of size is displayed in Figure 10. In the Al-deoxidized liquid iron, which was treated by Mg separately, the inclusion sizes were smaller and more uniform than those in the iron separately treated by Ca and those in the iron compositely treated by Mg–Ca. In the experiment of adding Mg before Ca, the inclusion size increased significantly after Ca addition. Nevertheless, in the experiment of adding Mg after Ca, the size variation of inclusions was relatively small after Mg addition. In each of the three experiments, the final sizes of inclusions taken from 30 min samples all fell within the range of 1–2 μm, while the inclusion sizes when adding Mg before Ca were slightly higher than those when adding Mg after Ca and those when adding Mg together with Ca. This was mainly attributed to the Ca content in the experiment of adding Mg before Ca was slightly higher than that of the other two experiments.
4. Discussion
4.1. Mutual Transformation between MAS and Calcium Aluminate
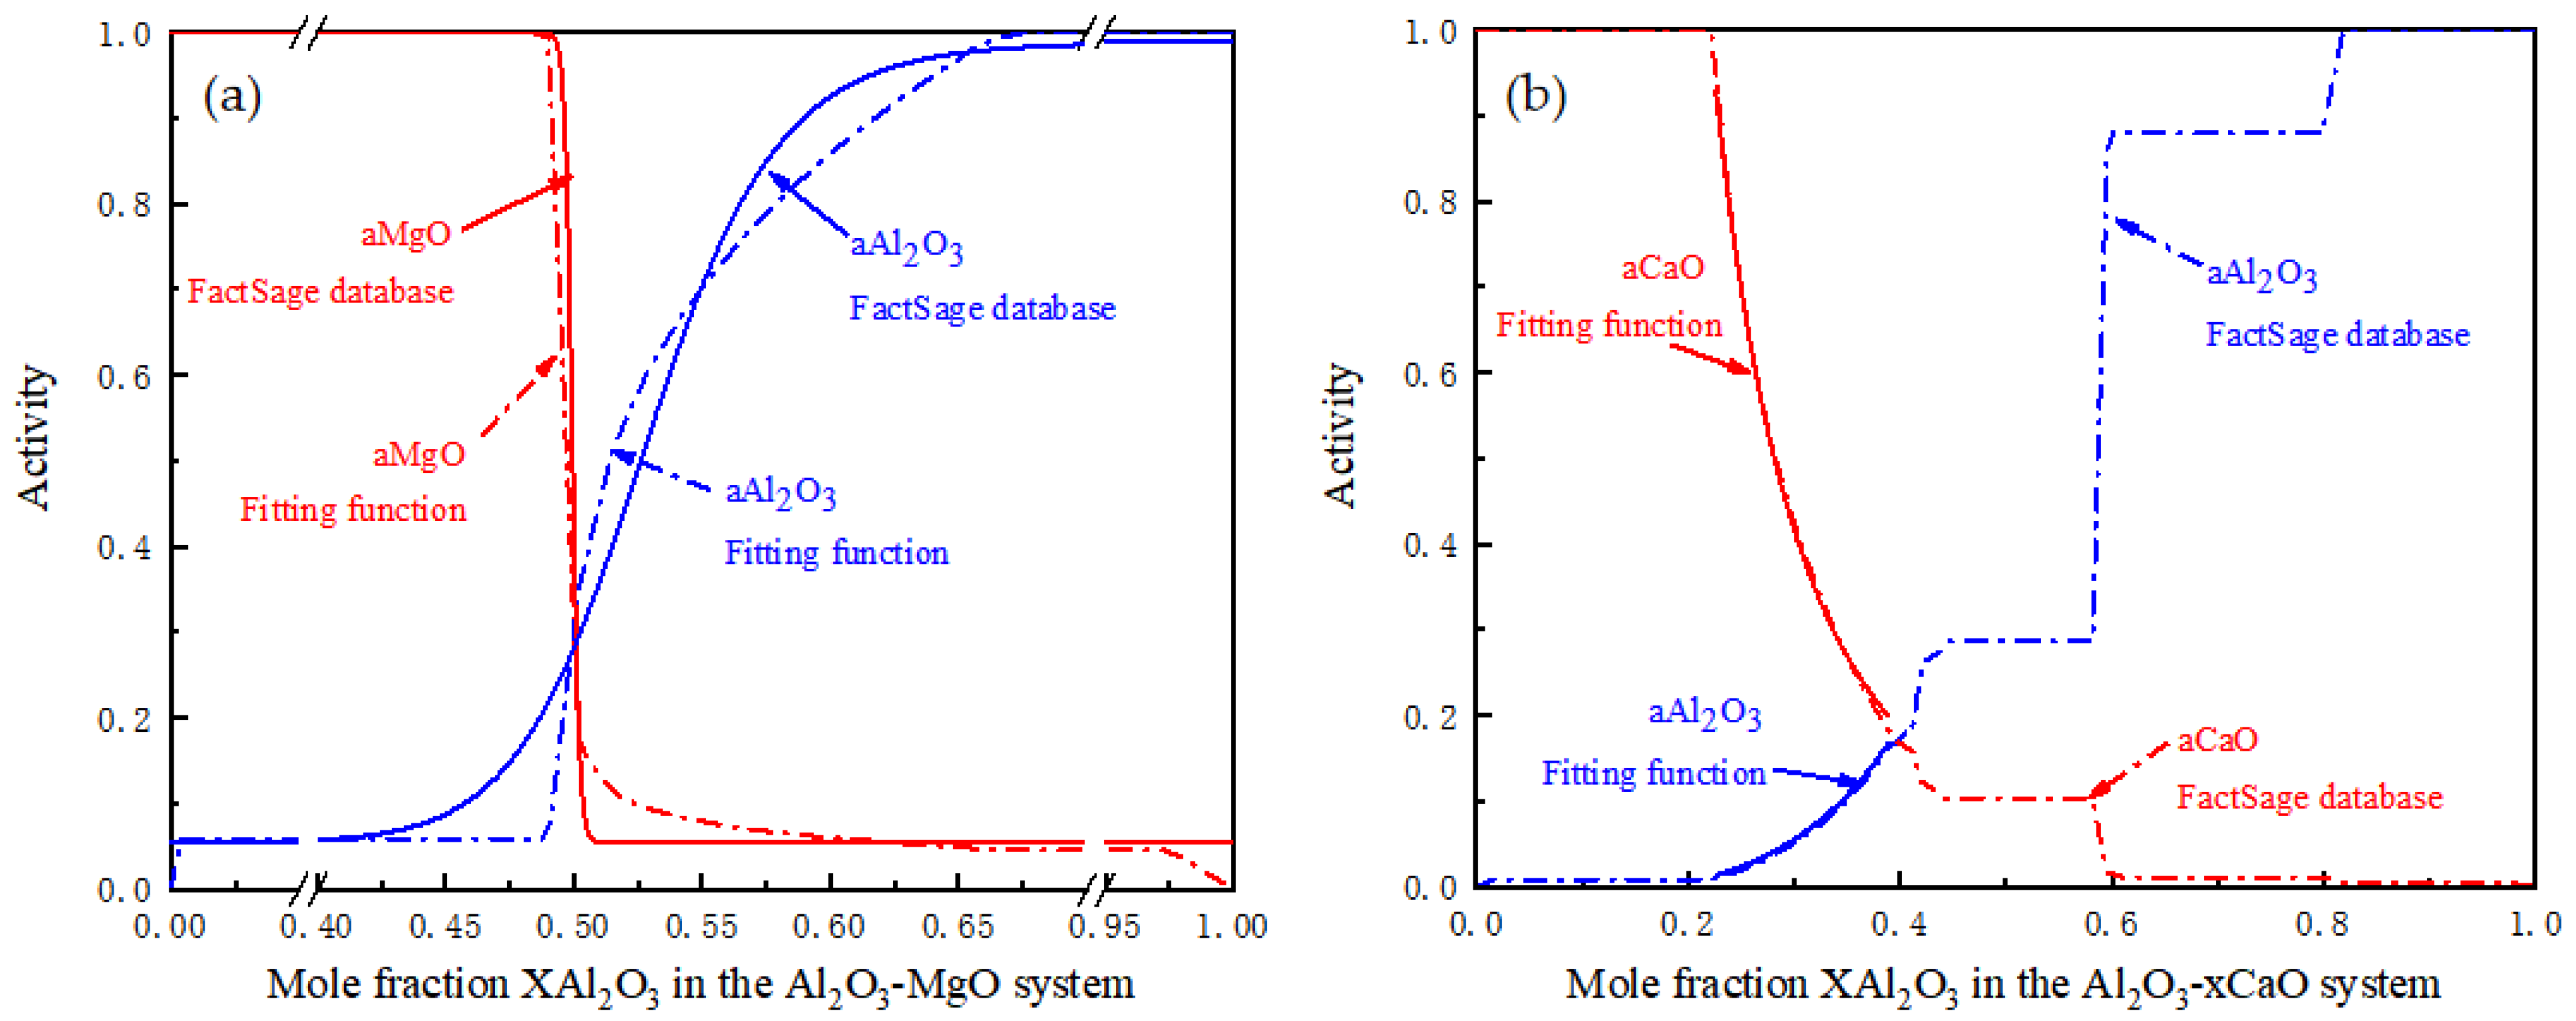
Many research papers have reported the effect of Ca treatment on the modification of MAS inclusions. Most of such studies [22,23,24] believed that a small amount of Ca could transform MAS into calcium aluminate, but few studies have found that calcium aluminate could be transformed into MAS. Therefore, the possibility of mutual transformation between calcium aluminate and MAS was thermodynamically calculated in this paper. Using Factage7.3, the activities of Al2O3, CaO and MgO in MAS and calcium aluminate under different mole fractions of Al2O3 were calculated, as shown in Figure 11.
Through data fitting, the activities of Al2O3 and MgO in MAS can be obtained by the equations below:
The activities of Al2O3 and CaO in calcium aluminate can be obtained by the equations below:
According to the analysis on inclusion elements, despite the addition sequence (adding Mg before Ca, adding Mg after Ca, or adding Mg together with Ca), all the inclusion surface scanning results manifested the magnesium reduction hardly co-existed with the calcium reduction in the inclusions. Therefore, it can be judged mutual replacement reaction occurred between Ca and Mg. To simplify the calculation, the reaction with Al is not considered in the evolution of inclusions, the activity of Al2O3 in inclusions is assumed to be stable and uniform, and the intermediate products, Al2O3–CaO–MgO system oxides, are not considered, so the mutual transformation reaction between calcium aluminate and MAS can be expressed as:
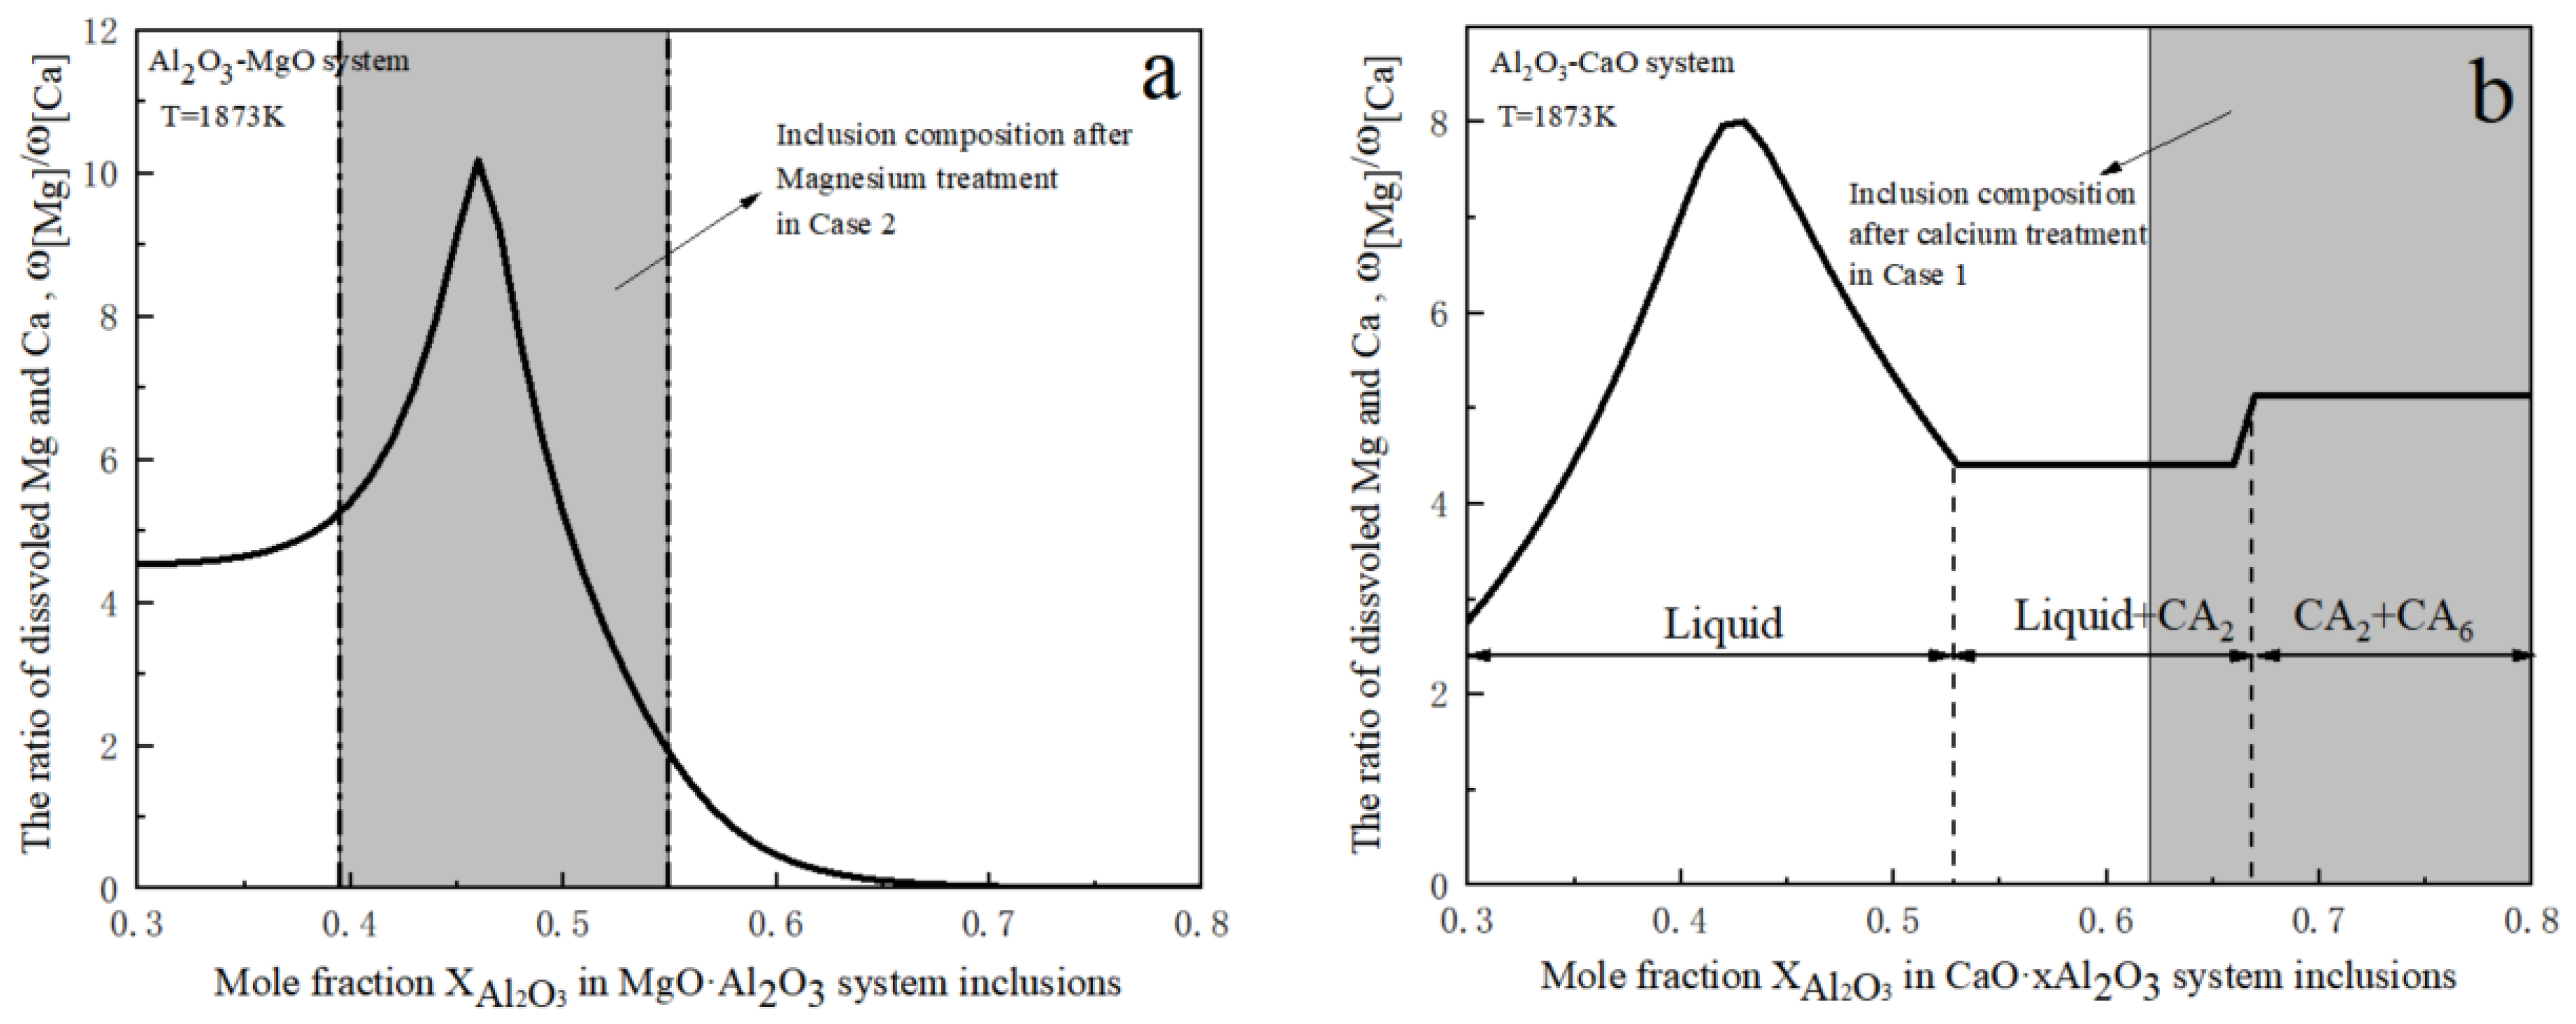
In this paper, the activities of [Ca] and [Mg] in liquid iron were calculated based on standard state (1% activity) of Henry’s law. The first Interaction coefficient in the present study is shown in Table 4. Due to the low contents of elements in industrial pure iron, the second-order interaction coefficient was not considered. The ratio of Mg to Ca needed for calcium aluminate under different Al2O3 contents transforming into MAS, and the ratio of Mg to Ca needed for MAS under different Al2O3 contents transforming into calcium aluminate were calculated by Equation (7).
According to the calculation results, Figure 12a can be obtained. The shadow areas in Figure 12a,b below represent the MAS inclusion composition after Mg treatment in Case 2, and the calcium aluminate inclusion composition after calcium treatment in Case 1, respectively. As can be seen, the difficulty level for Ca to transform MAS depends largely on the MgO content in MAS. When xMgO: yAl2O3 = 1:1 in MAS, the ratio of Mg to Ca must be lower than 6.3 so that MAS can be transformed into calcium aluminate. With the increase of the mole fraction of Al2O3 in MAS, the ratio of Mg to Ca required for the transformation of MAS first rises and then drops. When the mole fraction of Al2O3 in MAS is 0.46, the ratio of Mg to Ca reaches the highest, 10, at which time the Ca content required for MAS transforming into calcium aluminate reaches the lowest. The results verify an important phenomenon in this experiment: when MAS exists in the liquid iron, a small amount of calcium metal can transform MAS into calcium aluminate.
On the other hand, calcium aluminate can also be transformed by [Mg] into MAS under certain conditions. As shown in Figure 12b, the ratio of Mg to Ca required for transforming liquid calcium aluminate first rises and then drops. When the mole fraction of Al2O3 in calcium aluminate is 0.44, the difficulty level of modifying calcium aluminate into MAS reaches the highest, at which time the required ratio is 8. Additionally, CA6 is more difficult to be transformed than CA2 for solid calcium aluminate. The ratio of Mg to Ca needed for transforming liquid + CA2 is 4.4, while the ratio needed for transforming CA2 + CA6 is 5.1. Calcium aluminate in solid phase is easier to transform into MAS than calcium aluminate in liquid phase. Therefore, in Case 1, Ca was first added into the liquid iron, reacted with Al2O3 and was greatly consumed, which explains the low [Ca] content in the liquid iron. Most of the calcium aluminate formed was in solid phase, allowing the Mg added subsequently to react with calcium aluminate and replace its Ca.
4.2. Inclusion Modification Path
Using the phase diagram module in the thermodynamics software Factsage, the inclusion composition in liquid iron was computed under the condition of 0.0025% [O] and 300 ppm [Al], as shown in Figure 13. As can be seen, the final result is MA + Liquid-CMA (C: CaO, M: MgO, A: Al2O3) for all the three experiments, which is in good agreement with the experimental results. Based on the phase diagram, in the case of adding Mg before Ca (adding 15ppm Mg into Al-deoxidized iron), with the increase of [Ca] content, the transformation path of final composition of inclusions is MA→CMA(S) + MA→CMA(S) + MA + CA(S)→MA + CA(S)→MA + CA(S)+Liquid→MA + Liquid. In the case of adding Mg after Ca (adding 10 ppm Ca into iron), with the increase of [Mg] content, the transformation path of final composition of inclusions is CA(S)→CMA(S) + CA(S)→CMA(S) + MA + CA(S)→MA + CA(S)→MA + CA(S) + Liquid→MA + Liquid. The theoretical analysis is in good agreement with the practical evolution of inclusions, as shown in Figure 14.
4.3. Formation of the Intermediate CaS
In the experiment, CaS appeared in some inclusions. The thin and uniform CaS layer separate out during cooling. In addition, inclusions with thick CaS layers appeared at 30 s after calcium addition in case 2 (add calcium after magnesium), and inclusions with CaS at both ends appeared at 30 s after magnesium addition in case 1 (add magnesium after calcium). Therefore, it is necessary to discuss the formation of intermediate CaS.
CaS mostly existed in the outer layer of inclusions, wrapping the core. Hence, it was considered that calcium sulfide was directly produced from [Ca] and [S] through Reaction 1, rather than being produced from the collision between inclusions and CaS. The activity of CaS was regarded as 1 in calculation, and the activities of [Ca] and [S] were obtained according to the interaction coefficients in Table 3. Therefore, under the experimental condition (sulfur content in liquid iron, S = 0.0035%), the theoretical calcium content required for producing CaS was more than 0.004%. In view of this, only when the calcium metal was just added and had not completely and evenly diffused into the liquid iron, the calcium content could meet the condition locally to produce CaS.
In addition, according to the evolution rules of inclusions, CaS only appeared at 30 s after adding Ca (in the experiment of adding Mg before Ca), and in the intermediate product in the process of calcium aluminate transforming into MAS (in the experiment of adding Mg after Ca), while CaS was not found in other processes. Consequently, the reaction between CaS and the calcium aluminate in liquid iron, and the effect of [O] dissolved in liquid iron on the evolution of inclusions were considered in this paper.
To facilitate calculations, it was assumed that the calcium aluminate in liquid iron all existed in the form of 7Al2O3·12CaO. The formation of 7Al2O3·12CaO in liquid iron can be expressed by Equation (8):
The transformation of CaS to 7Al2O3·12CaO was primarily through Equation (2),
When the inclusions in liquid iron were only 7Al2O3·12CaO and CaS, [Al] in Equation (2) was mainly controlled by [Ca] and [O] in liquid iron. Then the Ca–S equilibrium curves under different S contents could be obtained by combining Equations (2) and (8), as shown in Figure 15.
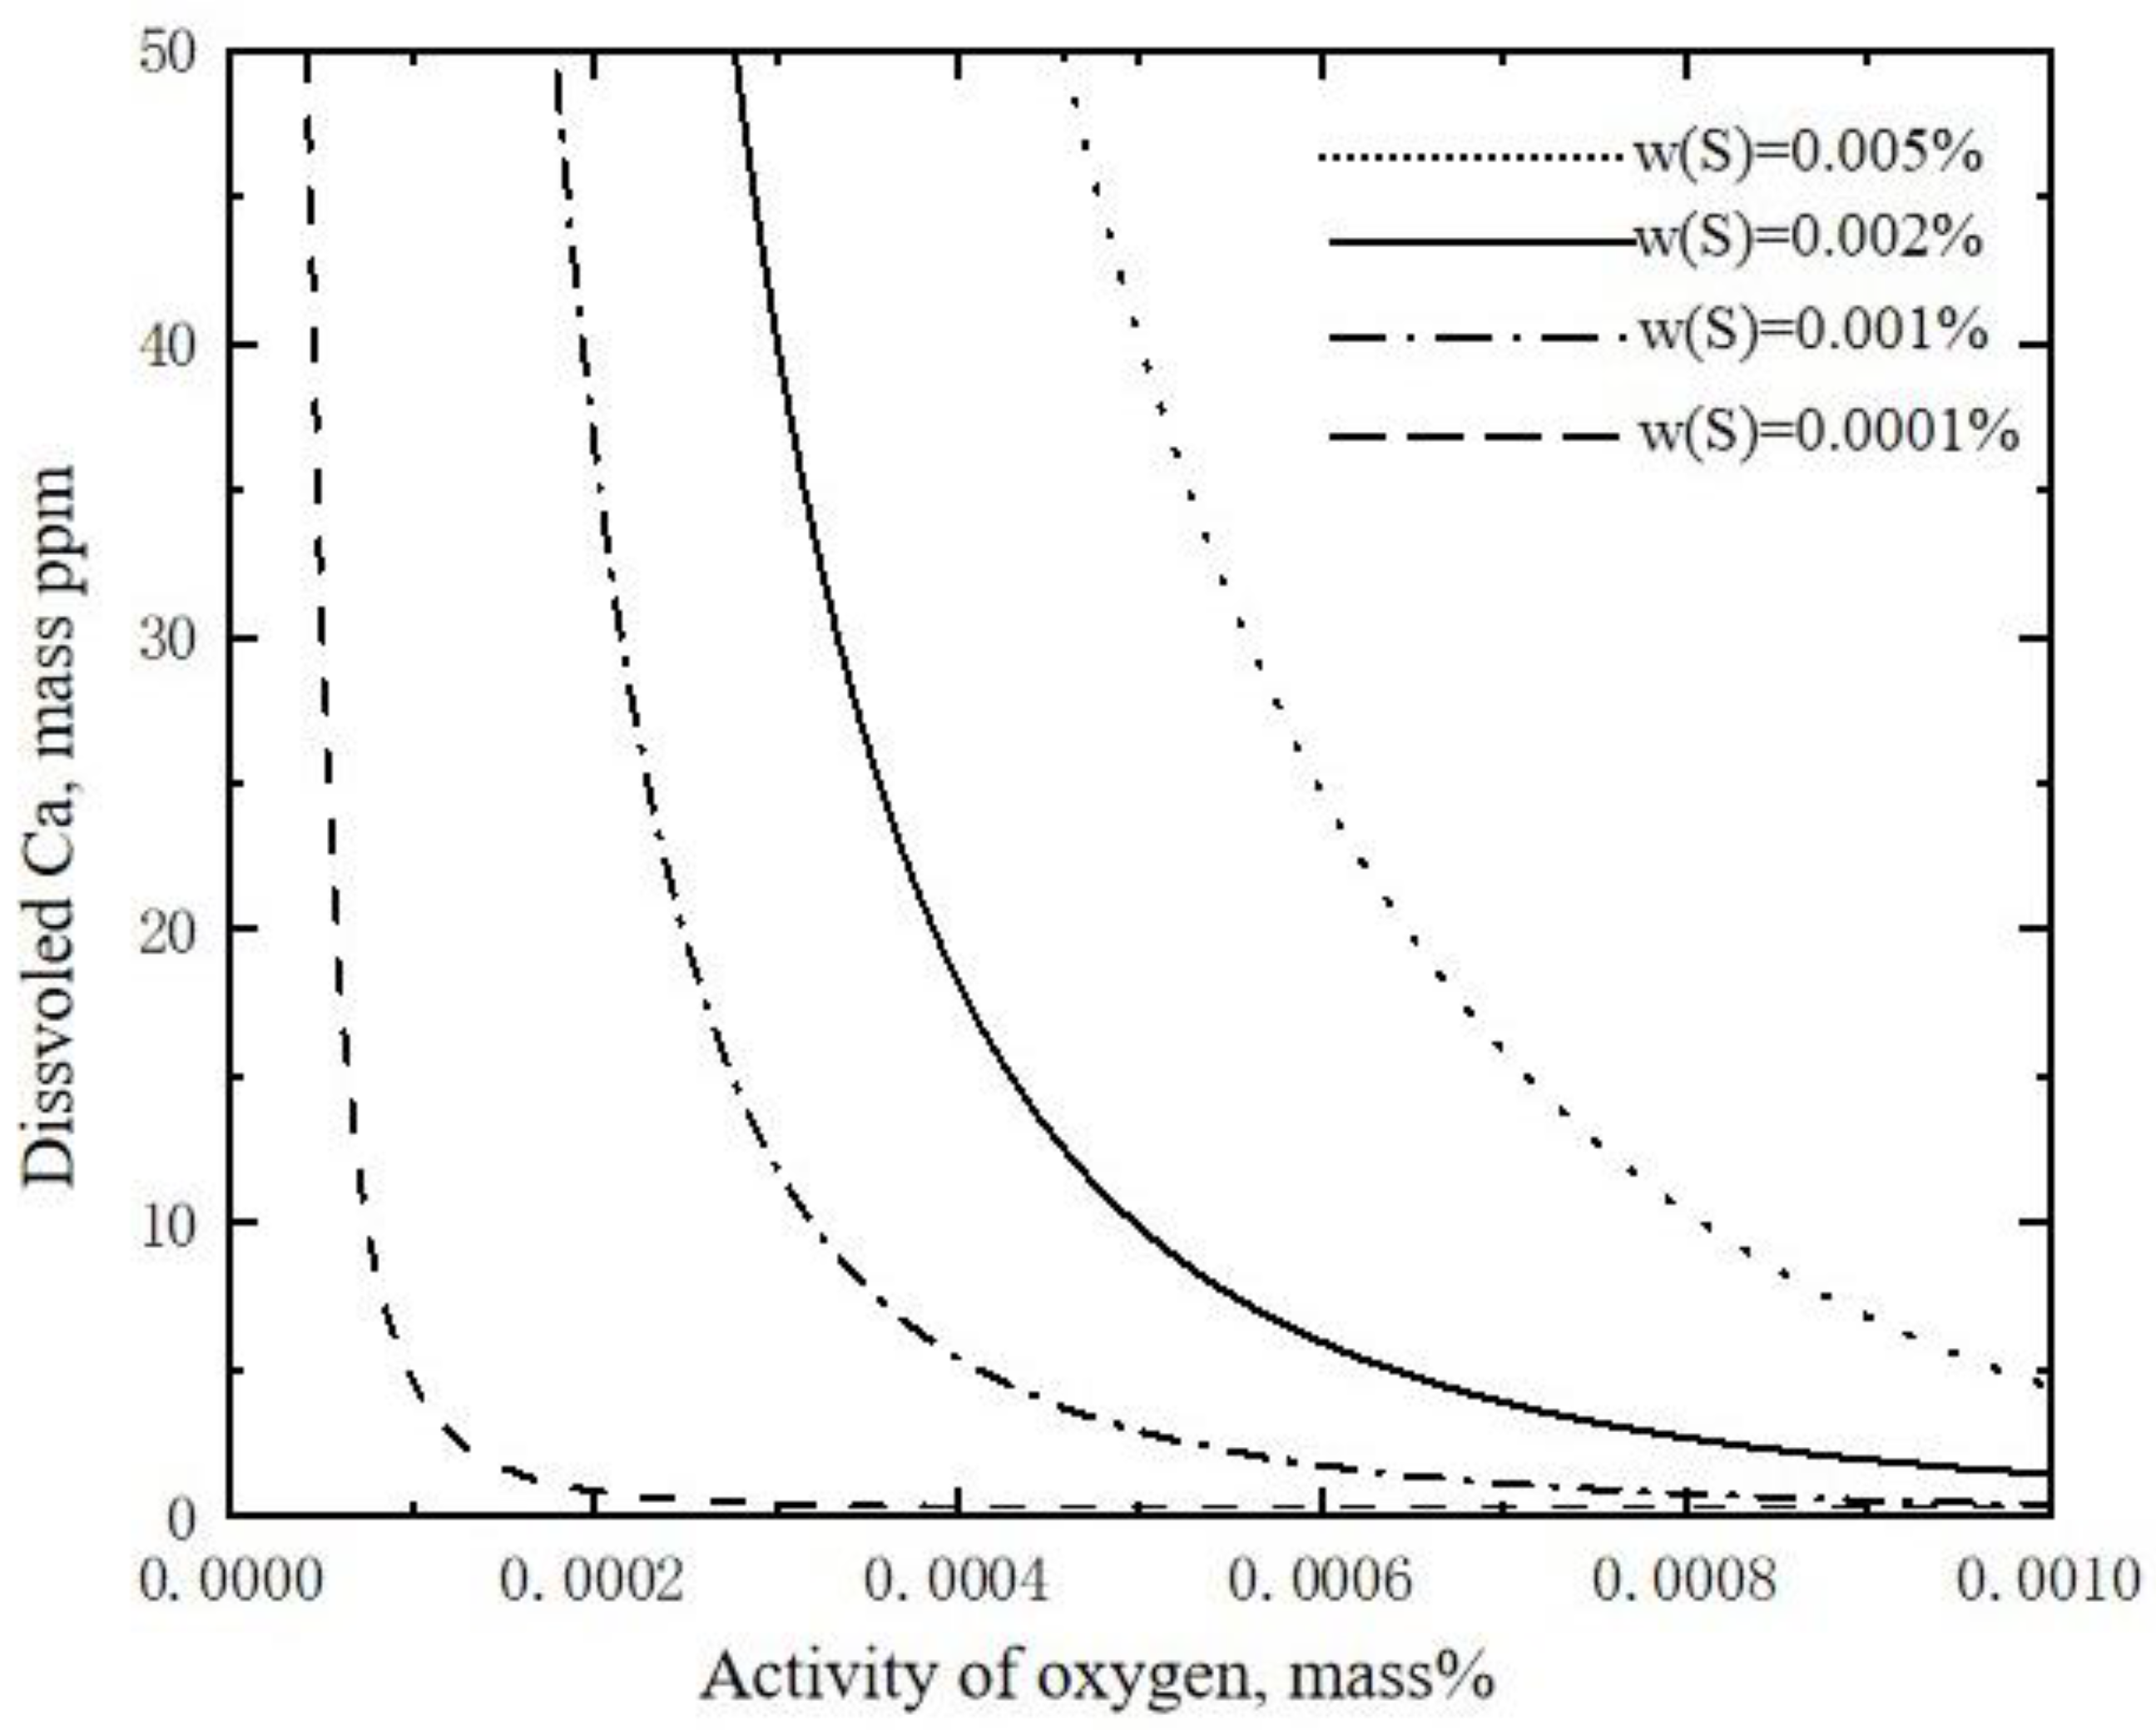
As can be seen, with the increase of [S] content in liquid iron, the formation of 7Al2O3·12CaO becomes more difficult. When the [S] content in liquid iron is 0.0010%, CaS is produced only when the [Ca] content in liquid iron is lower than 5 ppm, otherwise, calcium aluminate is produced. In the case of the [S] content reaching 0.0020%, when oxygen and Ca contents are controlled lower than 0.0005% and 10 ppm, respectively, CaS is formed stably. In the case of the [S] content reaching 0.005%, when the [Ca] content is 20 ppm, CaS will not be formed only if the [O] content is lower than 0.0006%.
In conclusion, the formation of CaS is simultaneously controlled by [O], [Ca], [S] in liquid iron. The higher the [S] content, the less likely CaS transforming into calcium aluminate; and the higher the [Ca] and [O] contents, the more likely CaS transforming into calcium aluminate. When the [S] content remains unchanged, [O] plays a key role for the transformation of CaS into calcium aluminate, which also explains why CaS was present when adding Mg before Ca, but absent when adding Mg together with Ca. When adding Mg before Ca, the Mg added into liquid iron had sufficient time to react with [O] in liquid iron, so that the [O] content was reduced to a lower level. When adding Mg together with Ca, the time was inadequate for [Mg] to react with [O] in iron. Moreover, once added into liquid iron, Mg started to react violently and thus stirred the liquid iron, enabling Ca to be distributed in the liquid iron more uniformly, and hindering the formation of CaS.
5. Conclusions
To explore the dynamic evolution mechanisms of inclusions in the process of Mg–Ca treatment, experiments (i.e., adding Mg after Ca, adding Mg before Ca, and adding Mg together with Ca) were performed in this study on Al-deoxidized molten pure iron, and the following conclusions were drawn through systematic analysis on inclusions:
- (1)
- The modification effect of inclusions in iron was influenced by the addition methods (i.e., adding Mg before Ca, adding Mg after Ca, and adding Mg together with Ca), so different evolution rules were presented for the three methods. However, composite inclusions with a magnesium aluminate spinel (MAS) core and an outer CaO–Al2O3–MgO layer were formed by all the three addition methods, and the Factsage thermodynamic calculation results agreed well with the experiment data.
- (2)
- Under appropriate contents of magnesium and calcium, MAS and calcium aluminate could transform into each other. When the mole fraction of aluminum oxide in MAS was 0.5, the content of calcium dissolved in liquid iron reached 1/6.3 of that of dissolved magnesium, at which time MAS could transform into calcium aluminate. On the other hand, when the ratio of magnesium to calcium dissolved in liquid iron reached 8, the calcium aluminate could transform into MAS. However, it was more difficult for liquid calcium aluminate to be transformed into MAS than solid calcium aluminate.
- (3)
- In the process of Mg–Ca treatment, the formation of CaS largely depended on the contents of [Ca], [O] and [S] in liquid iron, among which the [O] content played the most important role.
Author Contributions
Conceptualization, D.W.; Data curation, L.S. and X.Z.; Formal analysis, L.S. and X.Z.; Investigation, L.S. and X.Z.; Project administration, T.Q.; Resources, H.W.; Supervision, T.Q. and H.W.; Writing—original draft, L.S. and D.W.; Writing—review and editing, D.W. and T.Q.; Figure editing, J.Z. All authors have read and agreed to the published version of the manuscript.
Funding
This work was supported by the National Natural Science Foundation of China (No.51874203, No. U1860205, No. U1908224, No.52074186).
Data Availability Statement
Not applicable.
Conflicts of Interest
The authors declare no conflict of interest.
References
- Matsuno, H.; Kikuchi, Y.; Komatsu, M.; Arai, M.; Nakashima, H. Development of a new deoxidation technique for RH degassers. Iron Steelmak. 1993, 20, 35–38. [Google Scholar]
- Zhang, L.; Taniguchi, S.; Cai, K. Fluid flow and inclusion removal in continuous casting tundish. Metall. Mater. Trans. B 2000, 31, 253–266. [Google Scholar] [CrossRef]
- Mu, W.; Dogan, N.; Coley, K.S. Agglomeration of Non-metallic Inclusions at Steel/Ar Interface: In-Situ Observation Experiments and Model Validation. Metall. Mater. Trans. B 2017, 48, 2379–2388. [Google Scholar] [CrossRef]
- Tabata Bae, I.Y.; Coley, K.S.; Irons, G.A.; Sun, S. A Multilayer Model for Alumina Inclusion Transformation by Calcium in the Ladle Furnace. Metall. Mater. Trans. B 2018, 49, 375–387. [Google Scholar] [CrossRef]
- Wu, Z.; Zheng, W.; Li, G.; Matsuura, H.; Tsukihashi, F. Effect of Inclusions’ Behavior on the Microstructure in Al-Ti Deoxidized and Magnesium-Treated Steel with Different Aluminum Contents. Metall. Mater. Trans. B 2015, 46, 1226–1241. [Google Scholar] [CrossRef]
- Jiang, Z.H.; Zhuang, Y.; Li, Y.; Li, S.J. Effect of Modification Treatment on Inclusions in 430 Stainless Steel by Mg-Al Alloys. J. Iron Steel Res. Int. 2013, 5, 9–13. [Google Scholar] [CrossRef]
- Deng, Z.; Zhu, M. Evolution Mechanism of Non-metallic Inclusions in Al-Killed Alloyed Steel during Secondary Refining Process. ISIJ Int. 2013, 53, 450–458. [Google Scholar] [CrossRef] [Green Version]
- Sun, M.; Jiang, Z.; Li, Y.; Chen, C.; Wang, Q. Effect of Ce–Mg–Fe Alloy Adding Timing on Formation and Evolution of Inclusions in SCr420H Gear Steel. ISIJ Int. 2020, 60, 699–706. [Google Scholar] [CrossRef]
- Tuttle, R.B.; Kottala, S.R. Population Size Distribution of Rare Earth and Non-metallic Inclusions in 4130 and 8630 Steels. Int. J. Met. 2018, 12, 884–896. [Google Scholar] [CrossRef]
- Kojima, A.; Yoshii, K.I.; Hada, T. Development of High HAZ Toughness Steel Plates for Box Columns with High Heat Input Welding. Nippon Steel Tech. Res. 2004, 90, 39–44. [Google Scholar]
- Fuhr, F.; Cicutti, C.; Walter, G.; Torga, G. Relationship between Nozzle Deposits and Inclusion Composition in the Continuous Casting of Steels. Iron Steelmak. 2003, 30, 53–58. [Google Scholar]
- Yang, W.; Zhang, L.; Wang, X.; Ren, Y.; Liu, X.; Shan, Q. Characteristics of Inclusions in Low Carbon Al-Killed Steel during Ladle Furnace Refining and Calcium Treatment. ISIJ Int. 2013, 53, 1401–1410. [Google Scholar] [CrossRef] [Green Version]
- Abdelaziz, S.; Megahed, G.; El-Mahallawi, I.; Ahmed, H. Control of Ca addition for improved cleanness of low C, Al killed steel. Ironmak. Steelmak. 2009, 36, 432–441. [Google Scholar] [CrossRef]
- Lind, M.; Holappa, L. Transformation of Alumina Inclusions by Calcium Treatment. Metall. Mater. Trans. B 2010, 41, 359–366. [Google Scholar] [CrossRef]
- Yang, J.; Yamasaki, T.; Kuwabara, M. Behavior of inclusions in deoxidation process of molten steel with in situ produced Mg vapor. ISIJ Int. 2007, 47, 699–708. [Google Scholar] [CrossRef] [Green Version]
- Verma, N.; Pistorius, P.C.; Fruehan, R.J.; Potter, M.; Lind, M.; Story, S. Transient Inclusion Evolution During Modification of Alumina Inclusions by Calcium in Liquid Steel: Part I. Background, Experimental Techniques and Analysis Methods. Metall. Mater. Trans. B 2011, 42, 711–719. [Google Scholar] [CrossRef]
- Verma, N.; Pistorius, P.C.; Fruehan, R.J.; Potter, M.; Lind, M.; Story, S.R. Transient Inclusion Evolution During Modification of Alumina Inclusions by Calcium in Liquid Steel: Part II. Results and Discussion. Metall. Mater. Trans. B 2011, 42, 720–729. [Google Scholar] [CrossRef]
- Yang, S.; Li, J.-S.; Wang, Z.-F.; Li, J.; Lin, L. Modification of MgO center dot Al2O3 spinel inclusions in Al-killed steel by Ca-treatment. Int. J. Miner. Metall. Mater. 2011, 18, 18–23. [Google Scholar] [CrossRef]
- Park, J.H.; Kin, D.S.; Lee, S.B. Inclusion control of ferritic stainless steel by aluminum deoxidation and calcium treatment. Metall. Mater. Trans. B 2005, 36, 67–73. [Google Scholar] [CrossRef]
- Yoshioka, T.; Shimamura, Y.; Karasev, A.; Ohba, Y.; Jonsson, P.G. Mechanism of a CaS Formation in an Al-Killed High-S Containing Steel during a Secondary Refining Process without a Ca-Treatment. Steel Res. Int. 2017, 88, 1700147. [Google Scholar] [CrossRef]
- Ming, L.; Wang, B.; Wang, D.; Zhang, T.; Jiang, M. Control performance of nonmetallic inclusion in molten steel using Mg-treatment. Steelmaking 2014, 30, 1–4. [Google Scholar]
- Tabatabaei, Y.; Coley, K.S.; Irons, G.A.; Sun, S. A Kinetic Model for Modification of MgAl2O4 Spinel Inclusions During Calcium Treatment in the Ladle Furnace. Metall. Mater. Trans. B 2018, 49, 2744–2756. [Google Scholar] [CrossRef]
- Liu, C.; Gao, X.; Ueda, S.; Kitamura, S.-Y. Change in Composition of Inclusions through the Reaction between Al-killed Steel and the Slag of CaO and MgO Saturation. ISIJ Int. 2019, 59, 268–276. [Google Scholar] [CrossRef] [Green Version]
- Yang, S.; Wang, Q.; Zhang, L.; Li, J.; Peaslee, K. Formation and Modification of MgO center dot Al2O3-Based Inclusions in Alloy Steels. Metall. Mater. Trans. B 2012, 43, 731–750. [Google Scholar] [CrossRef]
- Ono, H.; Ibuta, T. Equilibrium Relationships between Oxide Compounds in MgO-Ti2O3-Al2O3 with Iron at 1 873 K and Variations in Stable Oxides with Temperature. ISIJ Int. 2011, 51, 2012–2018. [Google Scholar] [CrossRef] [Green Version]
- Todoroki, H.; Mizuno, K. Effect of silica in slag on inclusion compositions in 304 stainless steel, deoxidized with aluminum. ISIJ Int. 2004, 44, 1350–1357. [Google Scholar] [CrossRef] [Green Version]
- Cho, S.W.; Suito, H. Assessment of Aluminum-Oxygen Equilibrium in Liquid iron and Activities in CaO-Al2O3-SiO2 Slags. ISIJ Int. 1994, 34, 177–185. [Google Scholar] [CrossRef]
- Taguchi, K.; Ono-Nakazato, H.; Nakai, D.; Usui, T.; Marukawa, K. Deoxidation and desulfurization equilibria of liquid iron by calcium. ISIJ Int. 2003, 43, 1705–1709. [Google Scholar] [CrossRef] [Green Version]
- Ohta, H.; Suito, H. Activities in CaO-MgO-Al2O3 slags and deoxidation equilibria of Al, Mg, and Ca. ISIJ Int. 1996, 36, 983–990. [Google Scholar] [CrossRef] [Green Version]
- Ma, Z.T.; Janke, D. Characteristics of oxide precipitation and growth during solidification of deoxidized steel. ISIJ Int. 1998, 38, 46–52. [Google Scholar] [CrossRef]
- Karasev, A.; Suito, H. Quantitative evaluation of inclusion in deoxidation of Fe-10 mass pct Ni alloy with Si, Ti, Al, Zr, and Ce. Metall. Mater. Trans. B 1999, 30, 249–257. [Google Scholar] [CrossRef]
- Suzuki, K.; Ban-Ya, S.; Hino, M. Deoxidation Equilibrium of Cr-Ni Stainless Steel with Si at the Temperatures from 1823 to 1923 K. ISIJ Int. 2002, 41, 813–817. [Google Scholar] [CrossRef]
- Ishii, F.; Ban-Ya, S.; Hino, M. Thermodynamics of the Deoxidation Equilibrium of Aluminum in Liquid Nickel and Nickel-Iron Alloys. ISIJ Int. 2007, 36, 25–31. [Google Scholar] [CrossRef]
- Hino, M.; Ito, K. Thermodynamic Data for Steelmaking; Tohoku University Press: Sendai, Japan, 2010. [Google Scholar]
Figure 1.
Atmosphere protection resistance furnace for test.

Figure 2.
Sampling process.

Figure 3.
Composition of inclusions when adding Mg after Ca (a) 30 s after Al addition, (b) 30 s after Ca addition, (c) 30 s after Mg addition, (d) 5 min after Mg addition, (e) 15 min after Mg addition, (f) 30 min after Mg addition.
Figure 3.
Composition of inclusions when adding Mg after Ca (a) 30 s after Al addition, (b) 30 s after Ca addition, (c) 30 s after Mg addition, (d) 5 min after Mg addition, (e) 15 min after Mg addition, (f) 30 min after Mg addition.

Figure 4.
Typical inclusions when adding Mg after Ca (a) 30 s after Ca addition, (b) 30 s after Mg addition, (c) 5 min after Mg addition, (d) 15 min after Mg addition, (e) 30 min after Mg addition.
Figure 4.
Typical inclusions when adding Mg after Ca (a) 30 s after Ca addition, (b) 30 s after Mg addition, (c) 5 min after Mg addition, (d) 15 min after Mg addition, (e) 30 min after Mg addition.

Figure 5.
Part of inclusions at 30 s after Mg addition.

Figure 6.
Typical inclusions when adding Ca after Mg (a) 30 s after Mg addition, (b) 30 s after Ca addition, (c) 5 min after Ca addition, (d) 15 min after Ca addition, (e) 30 min after Ca addition.
Figure 6.
Typical inclusions when adding Ca after Mg (a) 30 s after Mg addition, (b) 30 s after Ca addition, (c) 5 min after Ca addition, (d) 15 min after Ca addition, (e) 30 min after Ca addition.

Figure 7.
Composition of inclusions when adding Ca after Mg (a) 30 s after Al addition, (b) 30 s after Mg addition, (c) 30 s after Ca addition, (d) 5 min after Ca addition, (e) 15 min after Ca addition, (f) 30 min after Ca addition.
Figure 7.
Composition of inclusions when adding Ca after Mg (a) 30 s after Al addition, (b) 30 s after Mg addition, (c) 30 s after Ca addition, (d) 5 min after Ca addition, (e) 15 min after Ca addition, (f) 30 min after Ca addition.

Figure 8.
Typical inclusions when adding Mg together with Ca (a) 30 s after Mg–Ca addition, (b) 5 min after Mg–Ca addition, (c) 15 min after Mg–Ca addition, (d) 30 min after Mg–Ca addition.
Figure 8.
Typical inclusions when adding Mg together with Ca (a) 30 s after Mg–Ca addition, (b) 5 min after Mg–Ca addition, (c) 15 min after Mg–Ca addition, (d) 30 min after Mg–Ca addition.

Figure 9.
Composition of inclusions when adding Mg together with Ca (a) 30 s after Al addition, (b) 30 s after Mg–Ca addition, (c) 5 min after Mg–Ca addition, (d) 15 min after Mg–Ca addition, (e) 30 min after Mg–Ca addition.
Figure 9.
Composition of inclusions when adding Mg together with Ca (a) 30 s after Al addition, (b) 30 s after Mg–Ca addition, (c) 5 min after Mg–Ca addition, (d) 15 min after Mg–Ca addition, (e) 30 min after Mg–Ca addition.

Figure 10.
Size variation of inclusions in the three experiments.

Figure 11.
(a) Activities of Al2O3 and MgO at different mole fractions of Al2O3 in Al2O3–MgO system (b) Activities of Al2O3 and CaO at different mole fractions of Al2O3 in Al2O3–xCaO system.
Figure 11.
(a) Activities of Al2O3 and MgO at different mole fractions of Al2O3 in Al2O3–MgO system (b) Activities of Al2O3 and CaO at different mole fractions of Al2O3 in Al2O3–xCaO system.

Figure 12.
Ratio of Mg to Ca required for mutual transformation between Al2O3·MgO (a) and between Al2O3·xCaO (b).
Figure 12.
Ratio of Mg to Ca required for mutual transformation between Al2O3·MgO (a) and between Al2O3·xCaO (b).

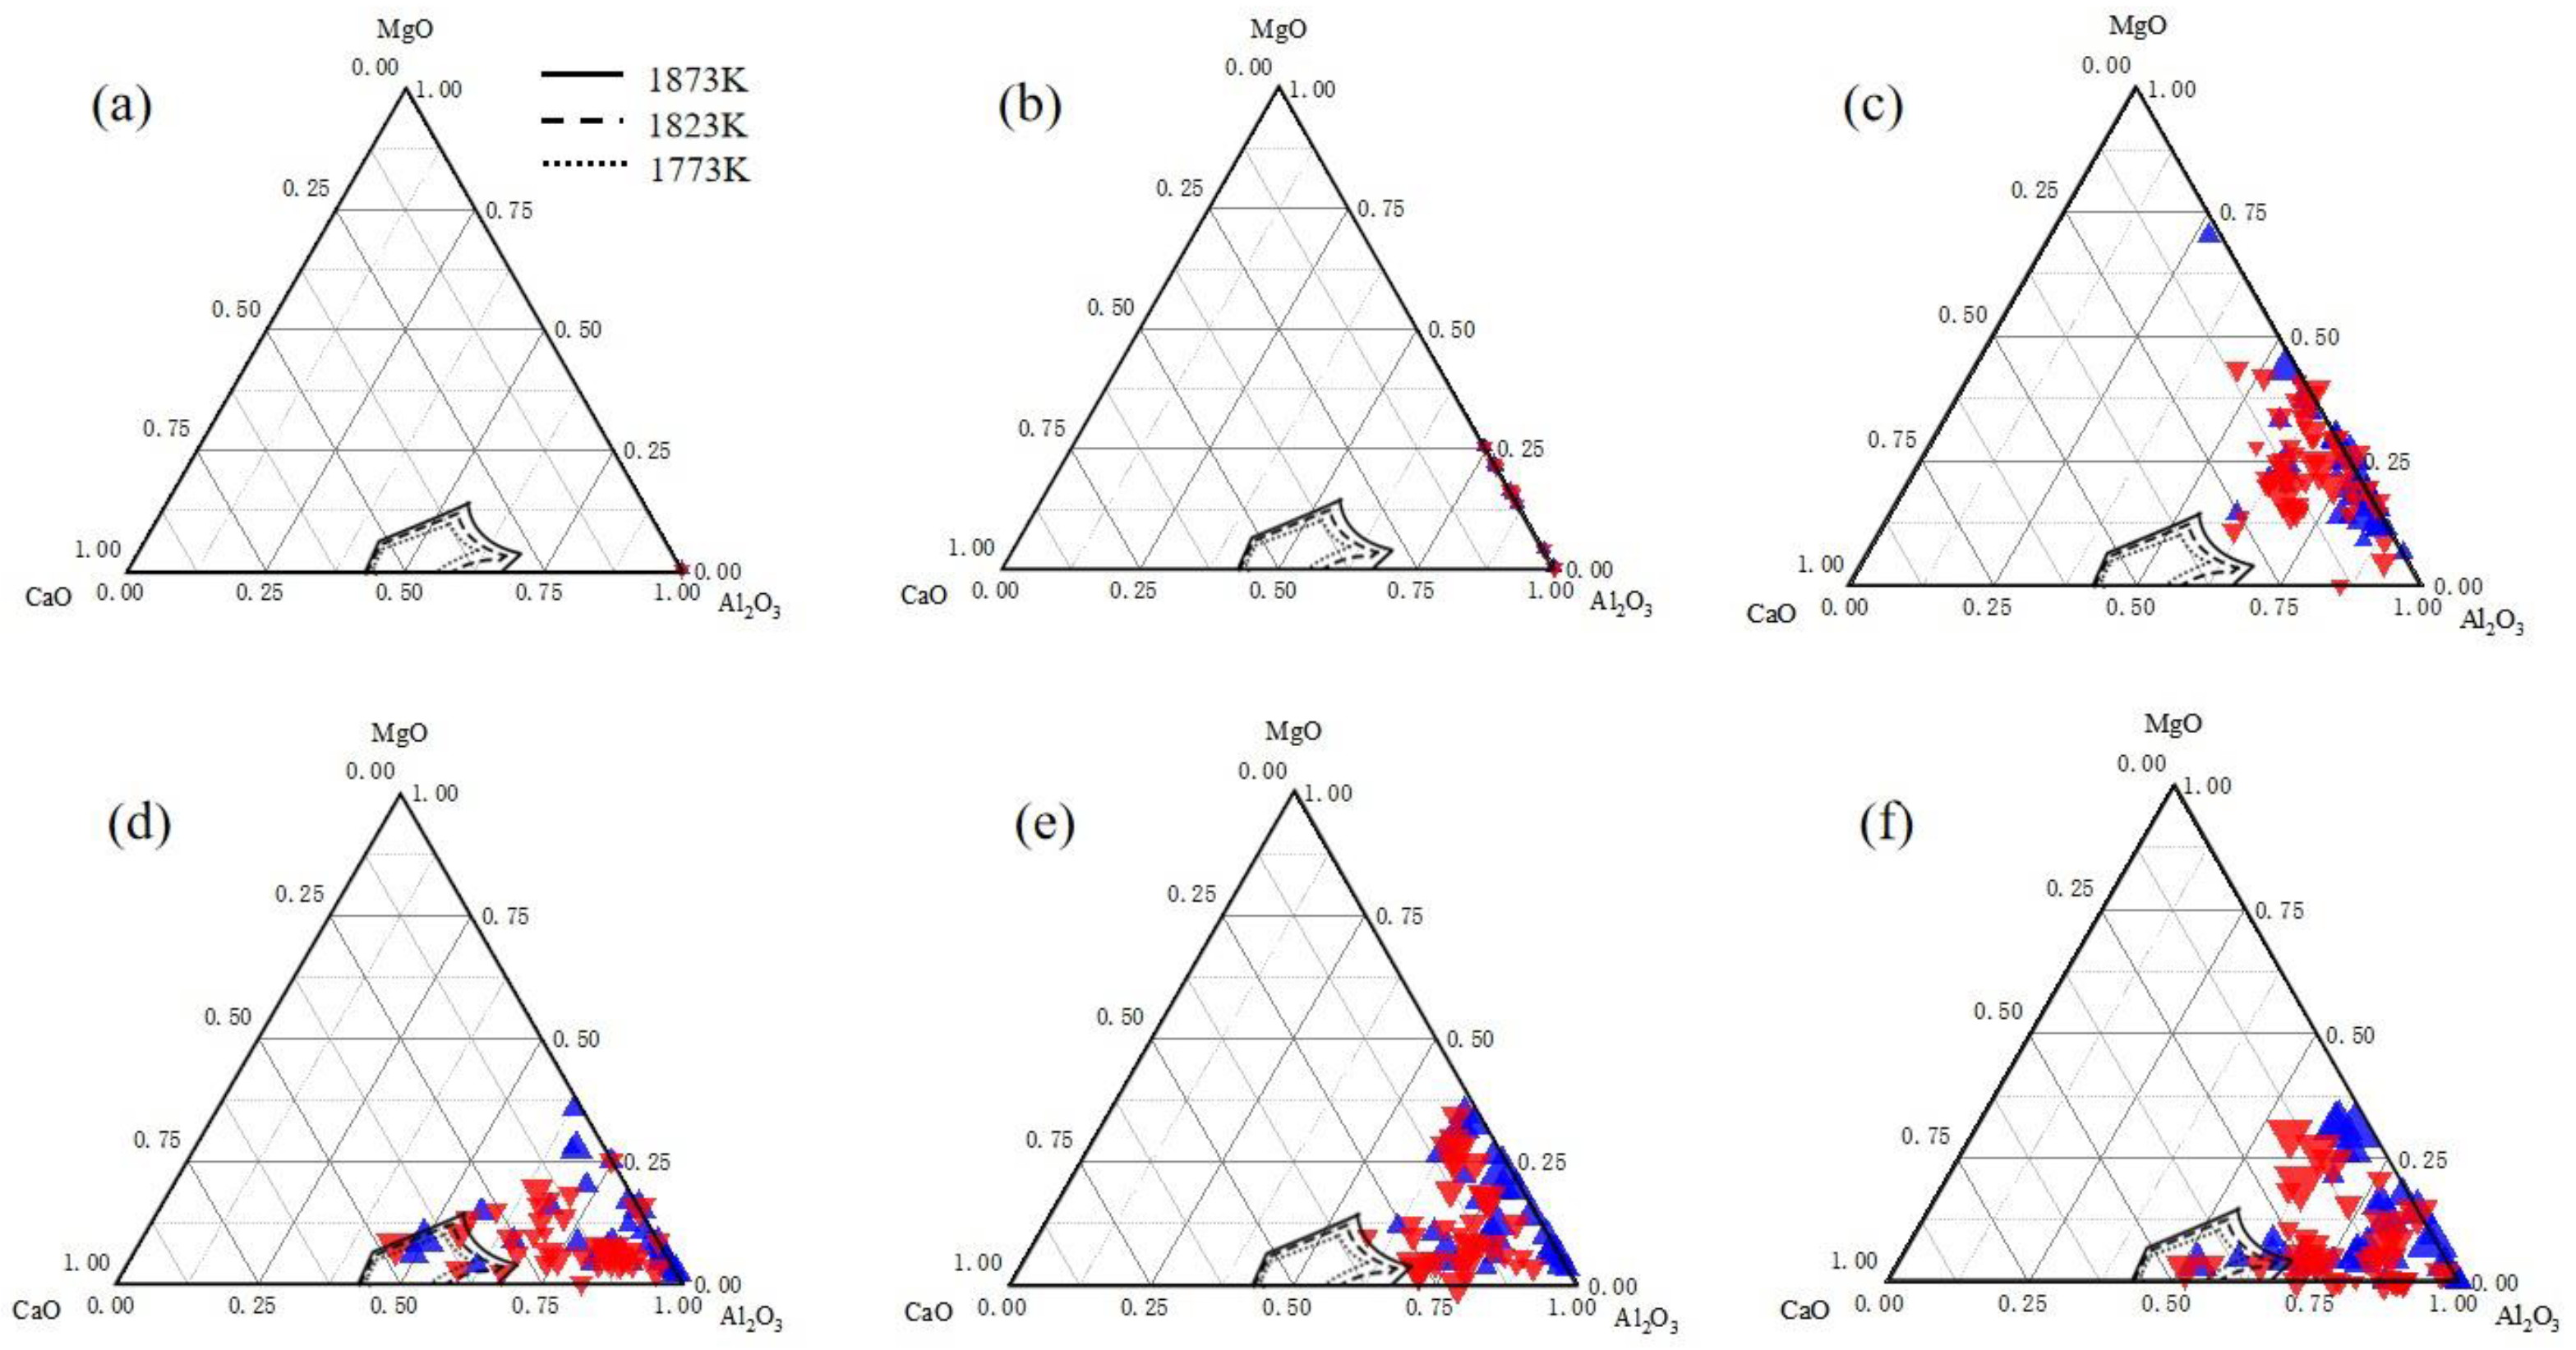
Figure 13.
Stable phase diagram of inclusions in Fe–Al–Ca–Mg–O system.

Figure 14.
Evolution of inclusions in the three experiments.

Figure 15.
[Ca]–[O] equilibrium curves for the formation of 7Al2O3·12CaO under different [S] contents.
Figure 15.
[Ca]–[O] equilibrium curves for the formation of 7Al2O3·12CaO under different [S] contents.


Table 1.
Chemical compositions of industrial pure iron (weight percent).
| Element | C | Mn | Si | P | S | Al | Cr | Ni | Cu | Ti | O |
|---|---|---|---|---|---|---|---|---|---|---|---|
| Content | 0.003 | 0.02 | 0.01 | 0.0025 | <0.004 | 0.02 | 0.02 | 0.013 | 0.006 | 0.005 | <0.008 |
Table 2.
Addition sequence of deoxidizer and alloy.
| Case | Step 1 | Step 2 | Step 3 |
|---|---|---|---|
| 1 | Al (0.43 g) | Ni–Mg (0.67 g) | Ca (0.4 g) |
| 2 | Al (0.43 g) | Ca (0.4 g) | Ni–Mg (0.67 g) |
| 3 | Al (0.43 g) | Ni–Mg (0.67 g) + Ca (0.4 g) | – |
Table 3.
Chemical compositions of the three groups of samples (weight percent).
| Sample | Al | Mg | Ca | S | T.O | N |
|---|---|---|---|---|---|---|
| No.1 | 0.0178 | 0.0012 | 0.0007 | 0.0032 | 0.0025 | 0.0054 |
| No.2 | 0.0203 | 0.0015 | 0.0012 | 0.0035 | 0.0023 | 0.0060 |
| No.3 | 0.0196 | 0.0014 | 0.0008 | 0.0033 | 0.0028 | 0.0058 |
Publisher’s Note: MDPI stays neutral with regard to jurisdictional claims in published maps and institutional affiliations. |
© 2021 by the authors. Licensee MDPI, Basel, Switzerland. This article is an open access article distributed under the terms and conditions of the Creative Commons Attribution (CC BY) license (https://creativecommons.org/licenses/by/4.0/).
Share and Cite
MDPI and ACS Style
Shi, L.; Zhou, X.; Wang, D.; Qu, T.; Wang, H.; Zhu, J. Evolution of Inclusions in Magnesium–Calcium-Treated Liquid Iron. Metals 2021, 11, 1213. https://doi.org/10.3390/met11081213
AMA Style
Shi L, Zhou X, Wang D, Qu T, Wang H, Zhu J. Evolution of Inclusions in Magnesium–Calcium-Treated Liquid Iron. Metals. 2021; 11(8):1213. https://doi.org/10.3390/met11081213
Chicago/Turabian StyleShi, Liwei, Xingzhi Zhou, Deyong Wang, Tianpeng Qu, Huihua Wang, and Jie Zhu. 2021. "Evolution of Inclusions in Magnesium–Calcium-Treated Liquid Iron" Metals 11, no. 8: 1213. https://doi.org/10.3390/met11081213
Note that from the first issue of 2016, this journal uses article numbers instead of page numbers. See further details here.