
Study on Low-Frequency Band Gap Characteristics of a New Helmholtz Type Phononic Crystal

Department of Basic Sciences, Air Force Engineering University, Xi’an 710051, China
*
Authors to whom correspondence should be addressed.
Symmetry 2021, 13(8), 1379; https://doi.org/10.3390/sym13081379
Submission received: 7 May 2021
/
Revised: 21 July 2021
/
Accepted: 27 July 2021
/
Published: 29 July 2021
(This article belongs to the Special Issue The Study of Low Frequency Vibration and Noise Reduction)
Abstract
:In order to solve the problem of low-frequency noise of aircraft cabins, this paper presents a new Helmholtz type phononic crystal with a two-dimensional symmetric structure. Under the condition of the lattice constant of 62 mm, the lower limit of the first band gap is about 12 Hz, and the width is more than 10 Hz, thus the symmetric structure has distinct sound insulation ability in the low-frequency range. Firstly, the cause of the low-frequency band gap is analyzed by using the sound pressure field, and the range of band gaps is calculated by using the finite element method and the spring-oscillator model. Although the research shows that the finite element calculation results are basically consistent with the theoretical calculation, there are still some errors, and the reasons for the errors are analyzed. Secondly, the finite element method and equivalent model method are used to explore the influence of parameters of the symmetric structure on the first band gap. The result shows that the upper limit of the first band gap decreases with the increase of the lattice constant and the wedge height and increases with the increase of the length of wedge base; the lower limit of the band gap decreases with the increase of the wedge height and length of wedge base and is independent of the change of lattice constant, which further reveals the essence of the band gap formation and verifies the accuracy of the equivalent model. This study provides some theoretical support for low-frequency noise control and broadens the design idea of symmetric phononic crystal.
1. Introduction
During take-off and flight, aircraft will produce huge noise, especially the low-frequency noise, which will seriously affect the physical and mental health of flight personnel and ground crew [1] and cause acoustic fatigue of the aircraft structure and electronic equipment [2]. According to previous studies, the low-frequency noise energy in a turboprop aircraft cabin is mainly concentrated in 0~500 Hz [3]. It cannot be effectively controlled by the conventional sound insulation materials currently applied due to the long wavelength of low-frequency noise [4]. In order to solve such noise problems of aircraft cabins, it is important to isolate the noise in the propagation path. Since aircraft has high requirements for structural strength and weight, it is critical to study and use a low-frequency sound insulation structure with lightweight and low density to isolate the noise in the process of noise propagation [5].
Phononic crystals refer to a class of materials with special acoustic properties [6]. Many phononic crystals are symmetrical in structure, which is a universal standard in acoustic research and design [7]. The periodic arrangement of symmetrical structures makes phononic crystals exhibit different acoustic properties. The special acoustic properties of such materials are generally realized through structural design. One of the important acoustic properties is the existence of elastic wave “band gap” [8], whose band gap characteristics are as follows: when elastic wave propagates in phononic crystal, it is affected by its internal periodic structure to form a special dispersion relation. The frequency ranges between the dispersion relation curve are called band gaps, which correspond to the frequency ranges in which no branch of the dispersion relation exists. Theoretically, the elastic wave propagation in the band gap frequency range is suppressed, while the elastic wave in the other frequency range (pass band) will propagate lossless under the action of the dispersion relation. Helmholtz cavity is a kind of common acoustic structure. Its main principle is to make use of the resonance characteristics of the air itself. The structure generally contains a small air channel and a large cavity. This makes the structure have good advantages in lightweight and low-frequency design. The structure has a wide range of applications in noise control [9,10,11,12,13,14,15], acoustic metamaterials [16,17,18], acoustic lenses [19], and acoustic metamaterials with negative refraction [20] and ultrasonic focusing [21]. In recent years, Helmholtz type phononic crystals using the principle of local resonance have become one of the hot research issues of acoustic metamaterials and phononic crystals. Nansha Gao et al. [22] proposed the composite meta-porous structure embedded multiple lateral plates of different lengths, finding that this structure has a high sound absorption performance in the range of 0~6.4 kHz. Guan et al. [23] increased the length of the air column at the opening through the helical design, reducing the first band gap range to 217~492 Hz. The cylindrical slit Helmholtz structure designed by Liu Min et al. [24] opens the low-frequency band gap below 100 Hz. Chen Xin et al. [25] constructed a coupling structure between the Helmholtz resonator and elastic oscillator, reducing the lower limit of the first band gap to 24.5 Hz.
These studies are significant for improving the sound insulation effect of the Helmholtz structure. However, due to the limited opening length of the traditional Helmholtz structure, the equivalent oscillator mass is difficult to be further improved. If the lower limit of the band gap needs to reduce further, it is often necessary to increase the size of the structure, or reduce the volume of the inner cavity, which will affect the band gap characteristics of the structure and also limit its application in engineering [25]. In this paper, a new Helmholtz phononic crystal is designed based on the research of the Helmholtz phononic crystal designed by Chen Xin [26], who designed a phononic crystal using a Helmholtz resonator with a membrane wall. Although the starting frequency of the first band gap is reduced, the width of the first band gap is also reduced. In addition, the membrane needs to be fixed on a rigid frame, but the tension is not easy to control. When the structure is put into a practical application, each cell needs to be combined into a large plate-like structure. Thus it is necessary to consider how to fix the frame. Consequently, the new Helmholtz phononic crystal is designed with a rigid wall. The lower limit of the first band gap is further reduced without increasing the size of the structure or reducing the volume of inner cavity. The band gap mechanism is analyzed in detail, and the equivalent model is established. With a size of 60 mm, the lower limit of band gap is reduced to 12 Hz, and the width is ensured to be above 10 Hz. This is critical because it could better realize the control of large wavelengths with small size. The structure design breaks through the low-frequency limit of the traditional Helmholtz two-dimensional phononic crystal. It also broadens the design idea of low-frequency phononic crystal and expands its application scope in engineering.
2. Materials and Methods
2.1. Low-Frequency Band Gap Characteristics
The cross-section diagram of the new Helmholtz type phononic crystal structure is shown in Figure 1. Based on the Helmholtz phononic crystal structure, this paper optimized the air channel of the Helmholtz cavity. A certain number of wedges were added to the original smooth wall surface. The shape of the air channel was transformed into a “W” type channel. Since the existence of symmetry affects the function and performance of the structure [27], the symmetry of phononic crystal structure was emphasized in structural design. Under the condition of not reducing internal cavity volume, the design dramatically increased the length of the air channel, which greatly increased the equivalent mass of the oscillator of the equivalent model. Furthermore, the optimization of parameters further reduced the lower limit of the first band gap and also improved the performance of sound insulation. As shown in Figure 1, the specific parameters of the phononic crystal and the wedge were as follows: the whole cell was square and the lattice constant was a, the length of the cavity was l1, the thickness of the wall was b, the total length of the air channel was l2, the equivalent width of the air channel was s. Each wedge attached to the beam was an isosceles triangle with base d and height h, the length of the beam was l3, the thickness of beam was b, the number of beams was n1. Moreover, the direction of propagation of the sound waves and the arrangement of cells are also shown in Figure 1.
Under the conditions of l1 = 60 mm, b = 1 mm, s = 0.15 mm, a = 62 mm, d = 0.3 mm, h = 0.7 mm, n1 = 20, l2 = 2400 mm, l3 = 57 mm, using COMSOL Multiphysics software simulation, the band gaps in the range of 0–500 Hz were obtained by scanning the Helmholtz type phononic crystal structure along the irreducible Brillouin zone boundary. During the simulation, the pressure acoustics module and structural mechanics module were selected in the software. In order to prevent the vibration of the frame from interfering with the study of the bandgap mechanism, the structural frame was set to the fixed constraint state. Although the phononic crystal structure was not strictly centrally symmetric, its band gap mechanism was based on the local resonance principle, thus it can still scan according to the irreducible Brillouin zone of the square lattice during software simulation, which has been widely used in the study of band gap [28].
As shown in Figure 2a, the phononic crystal structure had 7 band gaps in the range of 0~500 Hz, and there was a low-frequency complete band gap with a lower limit of about 12 Hz and a width of more than 10 Hz (the starting point A and ending point B of the first band gap has been marked in the figure). The new Helmholtz phononic crystal structure had band gaps of 12.0~26.6 Hz, 74.1~82.8 Hz, 145.1~150.1 Hz, 216.7~220.2 Hz, 288.4~291.1 Hz, 360.2~362.4 Hz, and 431.9~433.7 Hz. The band diagram of the first and second bandgaps are shown in Figure 2b. As shown in the figure, the branches of the band diagram were extremely flat except at the proximity of the point Γ, which means the structure had almost the same natural frequency in different directions, the vibration energy was completely localized in the inner cavity of the structure. It suggests that, compared with standard phononic crystals, the Helmholtz resonator had excellent absorption and attenuation effect on low-frequency noise, and its working frequency was specific.
2.2. Structural Equivalent Model
For the phononic crystal materials, the performance of sound insulation in the low-frequency range was important. Therefore, the vibration mode of the first band gap was studied in this paper.
The sound pressure distribution of point A and point B is shown in Figure 3.
At point A, as shown in Figure 3a, the sound pressure in the inner cavity was the highest, and the sound pressure in the outer cavity was basically 0. It shows that the air in the channel resonates locally with the air in the inner cavity under the excitation of sound waves. Sound waves were localized in the inner cavity, unable to spread further. It corresponds to the lower limit of the band gap.
At point B, as shown in Figure 3b, the sound pressure in the inner cavity was the lowest, while the sound pressure in the outer cavity was the highest, the air pressure in the channel increased gradually from inside to outside. It showed that the air in the inner cavity, the air in the channel, and the air in the outer cavity vibrated in the same direction and that sound waves can travel in the outer cavity. As the frequency of the sound waves increased, they began to travel into the cavities of neighboring structures. It corresponds to the upper limit of the band gap.
For this structure, this paper selected the spring-oscillator model to analyze it. Firstly, for the air in the channel, since the volume and width of the air channel was much smaller than the inner cavity, and the length of the air channel was much smaller than the wavelength of the sound wave, it could be assumed that the air in the channel was incompressible and moved synchronously. In other words, the vibration of the air in each part of the channel was approximately the same, and the air in the channel vibrated as a piston. Consequently, it can be regarded as a mass oscillator, and its equivalent mass was expressed by m; secondly, for the air in the inner and outer cavity, since the volume of the air in the inner and outer cavity was much larger than the volume of the air in the channel, the inertia force caused by air vibration can be ignored, thus it can be regarded as a massless spring, whose equivalent stiffness is represented by k1 and k2, respectively.
To sum up, as shown in Figure 4, the equivalent models were established for starting point A (as shown in Figure 4a) and ending point B (as shown in Figure 4b).
The equivalent model of this structure can be used to calculate the band gap by using the transfer matrix method [29]:
Firstly, the height of the structure was set to 1, and the cross-sectional area of the air channel can be expressed by s1. For the air in the inner cavity, it can be regarded as a massless spring, and its equivalent stiffness is:
and the formula of elastic wave propagation velocity in the continuous medium [30] is:
Substituting Equation (2) into Equation (1), we can get:
Its transfer matrix is:
In the formula, E is the volumetric elastic modulus, x is the air movement distance at the cavity mouth, c is the sound velocity in the air, ρair is the air density, and V1 is the volume of the inner cavity.
Secondly, for the air in the channel, this part can be regarded as the mass oscillator, and its free vibration equation is:
Its transfer matrix is:
In the formula, u is the longitudinal amplitude, x is the transverse coordinate, t is the time, l2 is the total length of the air channel, , ω is the angular frequency.
Finally, the equivalent model of the air in the outer cavity can be regarded as a massless spring.
Its equivalent stiffness is:
Its transfer matrix is:
In the formula, V2 is the volume of the outer cavity.
The direction of transmission was set to propagate from the outer cavity to the inner cavity. At the upper limit of the band gap, since the air in the outer cavity can transmit sound waves, the transmission order is “outer cavity-channel-inner cavity” thus the overall transfer matrix can be written as:
At the upper limit of the band gap, the boundary is the air spring of the outer cavity, thus the boundary condition is the fixed constraint state. The total transfer equation of the equivalent model of point B can be written as:
Simplifying Equation (10), we can get:
where N2b and N1b are the forces exerted by the inner and outer air cavities on the boundary respectively in the equivalent model of point B, and the units are in [N]
At the lower limit of the band gap, the air in the air channel resonates with the air in the inner cavity, and the sound wave cannot propagate in the outer cavity. The transmission order is “channel-inner cavity.” Then, its overall transfer matrix is:
At the lower limit of the band gap, the boundary is the air oscillator of the channel, thus the boundary condition is the free state. The total transfer equation of the equivalent model of point A can be written as:
Simplifying Equation (13), we can get:
where X1a is the displacement of the air oscillator in [m], N2a is the force exerted by the inner cavity on the boundary in the equivalent model of point A, and the unit is in [N]. Substituting the parameter values in Table 1 into Equations (11) and (14), the upper and lower limits of each band gap of the structure can be respectively solved.
In this paper, 2 methods, the Finite Element Method (FEM) and Transfer Matrix Method (TMM) were used to solve the upper and lower limits of all band gaps of this structure in the range of 0~500 Hz. As can be seen from Table 2, for the 2 band gaps of the structure, the results obtained by the 2 methods were basically the same, which shows the correctness of the hypothesis of the model. The main cause of the errors was that when the channel length and width were evaluated, due to the existence of wedges, they could not be accurately calculated and can only be used for equivalent approximation. The approximate value was taken as the equivalent length l2 and equivalent width s of the air channel, which leads to certain errors in the calculation. In addition, when the equivalent width s of the air channel was large, the theoretical calculation value will have large errors. This was because the ratio of the volume of the inner and outer cavity to the volume of the air in the channel was small, and the influence of compressibility of the air in the channel cannot be ignored.
3. Results
3.1. Structure Sound Insulation Characteristics
In order to study the sound insulation performance of this structure and compare the similarities and differences between the actual structure and the simulation model, a two-dimensional model of the periodic phononic crystal structure was constructed in this paper. As shown in Figure 5, 7 cells were connected in longitudinal series, and the background pressure field was arranged at the left end of the periodic structure (part 2 in the figure). The perfect matching layer (part 1,4 in the figure) was set at both ends of the periodic structure, respectively, to simulate the infinite air domain. Finally, periodic boundaries were set at the upper and lower boundaries to simulate the horizontal infinite period. The cell of the structure is also shown in the figure.
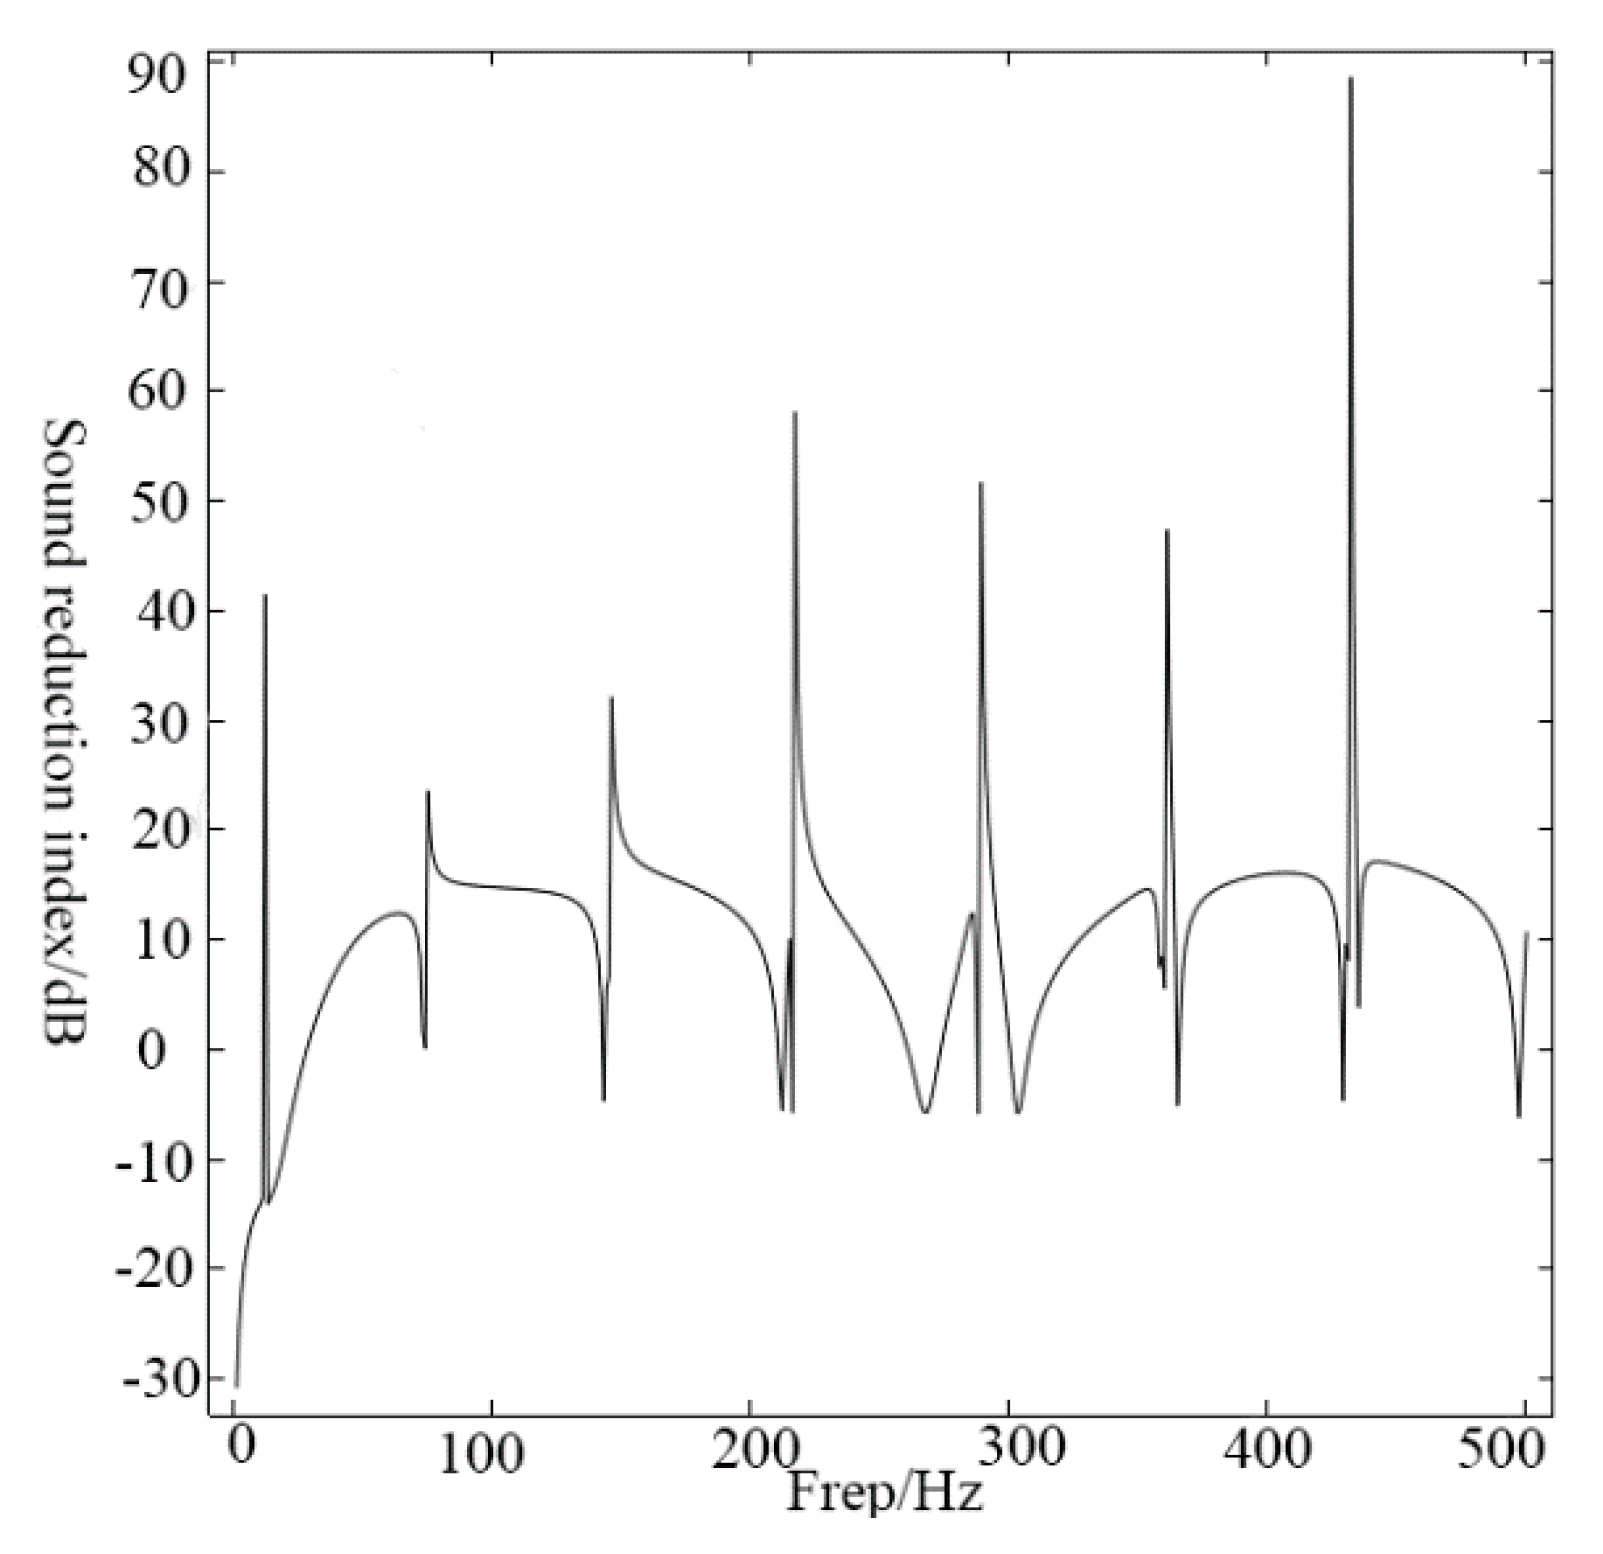
The sound reduction index was used to measure the level of sound insulation provided by a structure. The calculation formula of the sound reduction index is as follows:
where, T refers to sound reduction index, Pin represents the incident sound pressure, and Pout represents the output sound pressure.
The sound reduction index of the structure was calculated by COMSOL Multiphysics, and the transmission spectrum is shown in Figure 6. As shown in the figure, firstly, there were seven peaks in the spectrum, and the location of the peak was the same as the lower limit of the band gaps, which indicates that peaks were in good agreement with the calculated results of the bandgap. Secondly, the sound reduction index of this structure reached the maximum value of 88.4 dB at about 432 Hz. In the range of the first band gap, a peak of more than 40 dB appeared at about 12 Hz. Moreover, it can also reach 23.4 dB in the low-frequency domain of about 74 Hz. The result shows that the structure has great low-frequency sound insulation performances. Thirdly, the sound insulation effect of the structure in the high-frequency range was greater than that in the low-frequency range, which was consistent with the general sound absorption law of phononic crystals. Finally, the sound insulation index was negative at some frequencies. This was because the sound waves were reflected on the wall of the structure many times. The output sound waves from all directions interfered with each other, which makes the output sound pressure larger than the incident sound pressure, making the sound reduction index negative.
3.2. Study on the Influencing Factors of Band Gap
In order to study the influence of structural parameters on the first band gap, and further reveal the essence of the formation of the band gap, this paper used COMSOL Multiphysics software for simulation experiments and the equivalent model for theoretical calculation. The finite element method and transfer matrix method were used to calculate the frequency variation of the band gap with the change of parameters. As shown in Table 3, the experiments changed the structural parameters: the length of wedge base d, wedge height h and lattice constants a; other structural parameters remain unchanged: the length of the cavity l1, the thickness of the wall and the beam b, the length of the beam l3 and the number of beams n1. Through the experiment, we found that the structure had better bandgap characteristics and sound insulation characteristics. When the initial structural parameters were selected, we can get a low-frequency complete band gap with a lower limit of about 12 Hz and a width of more than 10 Hz.
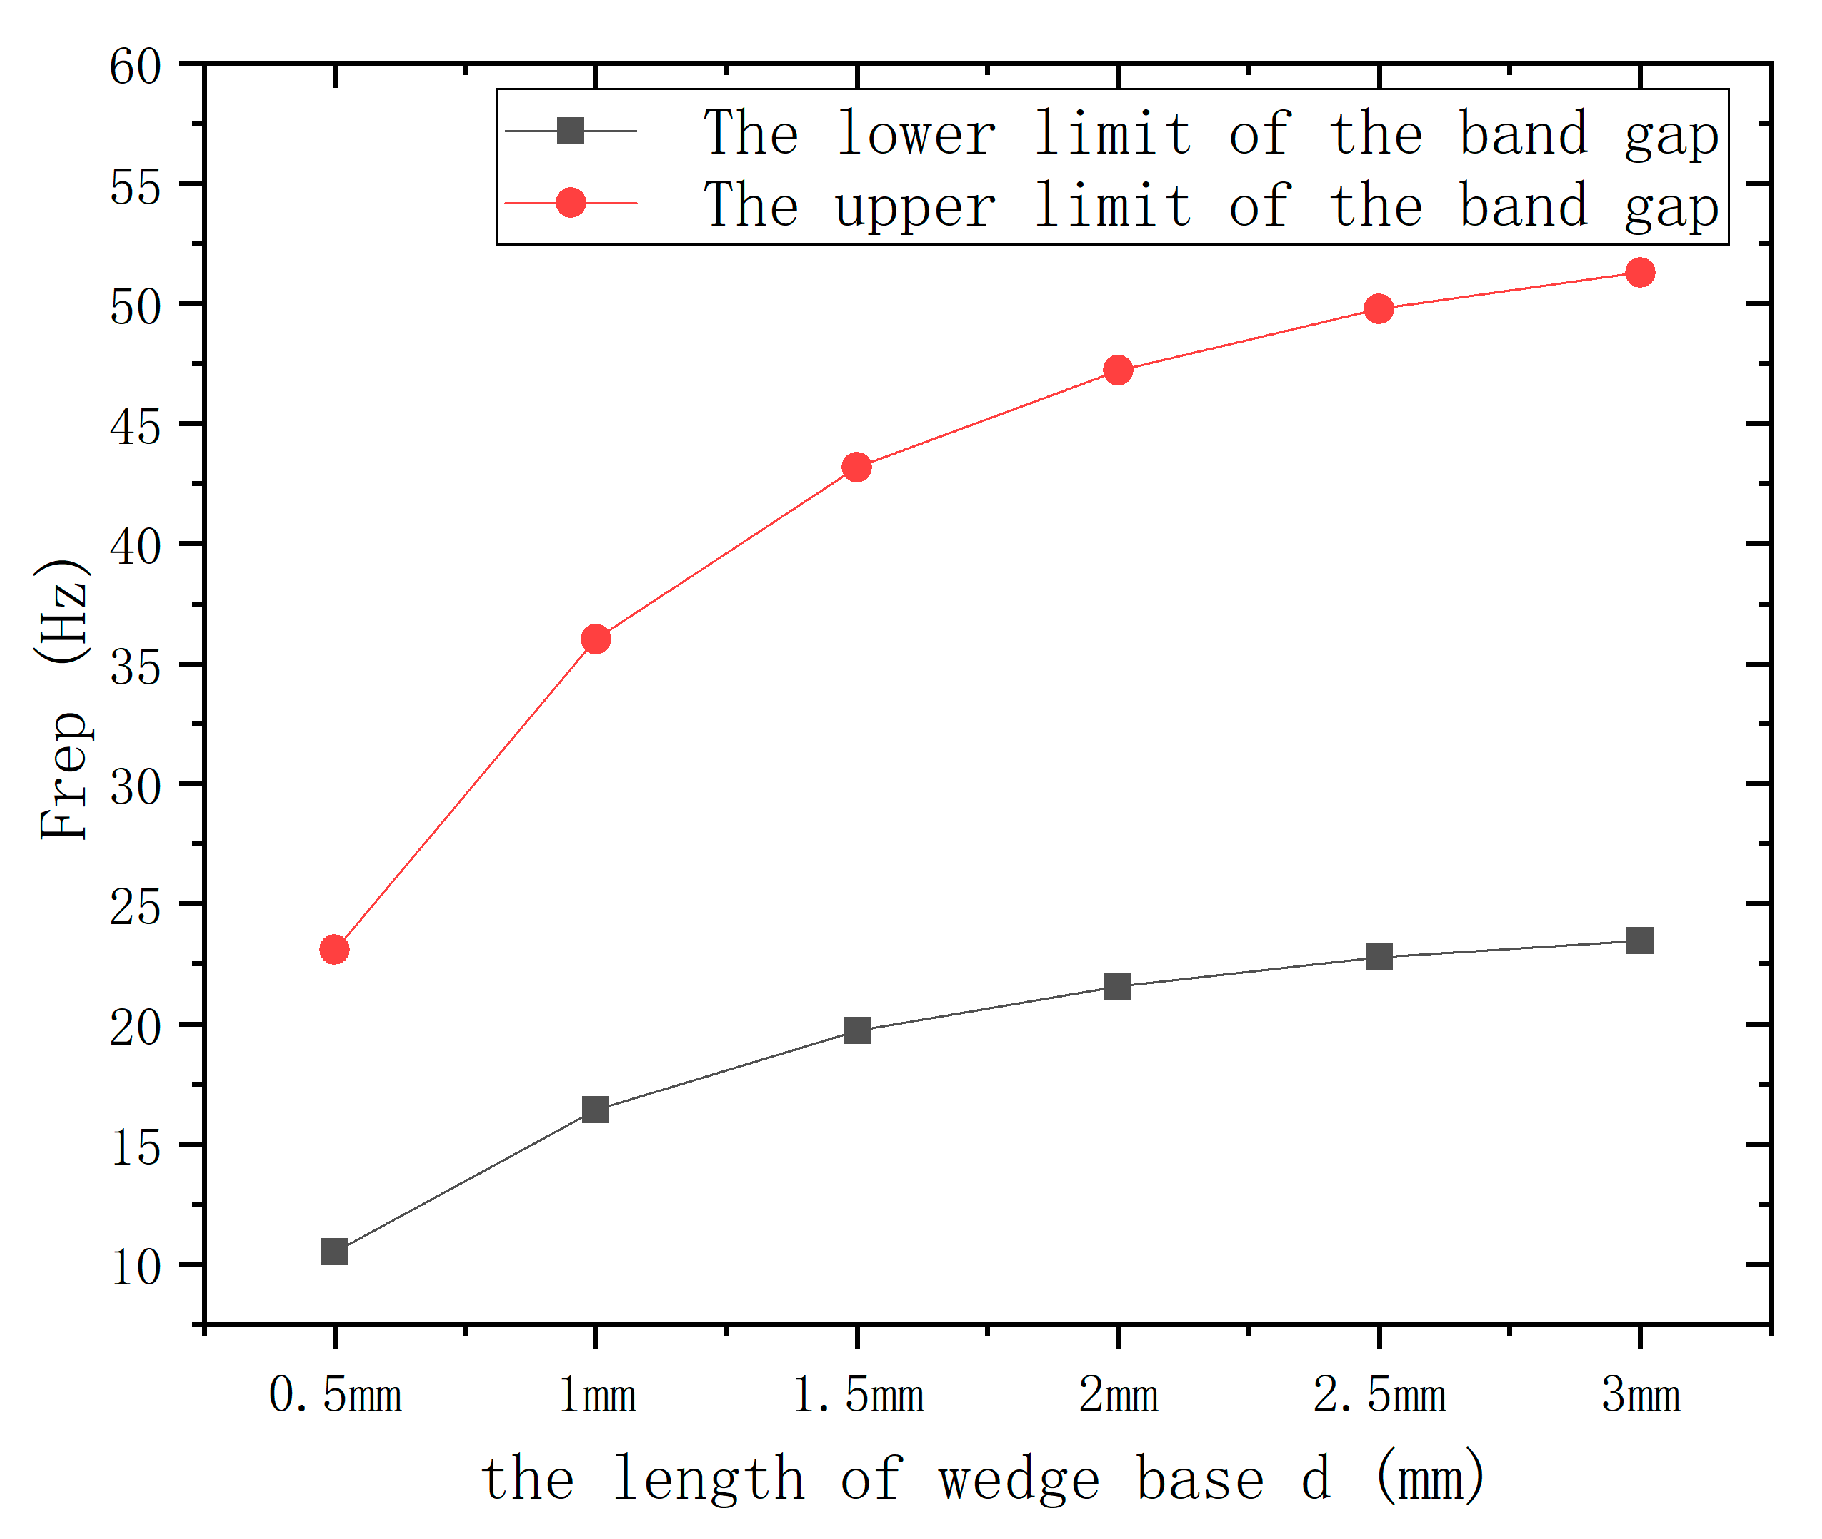
3.2.1. Influence of the Length of Wedge Base d on Band Gap
Figure 7 shows the relationship between the upper and lower limits of the first band gap and the length of wedge base d. During the experiment, the length of wedge base d was changed, and other parameters remain unchanged. As shown in Figure 7, as the length of wedge base d increasing, the upper limit and lower limit of the first band gap constantly increased. Meanwhile, the width of the band gap tended to widen. This was because, under the condition that the length of the beam l3 was not varied, the length of the wedge base d kept increasing, thus that the number of the wedge attached to the beam kept decreasing. Finally, the length of the “W”-shaped air channel l2 decreased correspondingly, leading to the constant decrease of the equivalent mass m of the air in the channel, thus making the upper and lower limits of the first band gap rise continuously. These results showed that the increase of d will lead to the upper and lower limits of the first band gap moving to the direction of high frequency.
3.2.2. Influence of the Wedge Height h on Band Gap
Figure 8 shows the relationship between the upper and lower limits of the first band gap and the wedge height h. During the experiment, the wedge height h was changed and other parameters remain unchanged. As shown in Figure 8, with the increasing of h, the lower limit and upper limit of the first band gap continuously decreased, and the width of the band gap tended to narrow. This was because, under the condition that the length of wedge base d was given, the width of gap between the wedges decreased with the increase of the height h, thus that the equivalent width of the air channel s decreased correspondingly. Finally, it will lead to the reduction of the equivalent stiffness k1 and k2 of the spring in the equivalent model, thus that the upper and lower limits of the first band gap continued to decrease. These results showed that the increase of the wedge height h will lead to the upper and lower limits of the first band gap moving to the direction of low frequency.
3.2.3. Influence of the Lattice Constant a on Band Gap
Figure 9 shows the relation between the lower limit and upper limit of the first band gap and the lattice constant a. In the process of experiment and theoretical calculation, other structural parameters remain unchanged, and the lattice constant a was changed. The result is shown in Figure 9. It can be seen from the figure that the change of the lattice constant a basically did not affect the lower limit of the first band gap, because the total transfer matrix of the equivalent model at the lower limit of the band gap was independent of the air in the outer cavity. The change of lattice constant a only changed the equivalent stiffness of the air in the outer cavity, thus the lower limit of the band gap will not be affected. For the upper limit of band gap, the increase of lattice constant a will directly lead to the increase of the volume of outer cavity V2, leading to the decrease of the equivalent stiffness k2 of the air in the outer cavity. It will lead to the limit moving to low-frequency direction. The results prove the consistency of the simulation experiment and theoretical calculation. For this structure, when making a periodic arrangement, the smaller the spacing between the cells, the wider the band gap will be.
4. Discussion
In this paper, a new Helmholtz type phononic crystal with a two-dimensional symmetric structure was designed. The air channel was modified based on the W-shaped air channel, and wedges were added to the original smooth wall surface. The equivalent model of the system was established, and the study shows that:
- First item; the symmetric structure design can break through the limit of the traditional Helmholtz cavity structure band gap, reducing to 12 Hz with a structure size of 60 mm, and ensure the band gap width of more than 10 Hz. It has engineering significance for the application in the field of low-frequency vibration reduction and sound insulation of aircraft cabins.
- Second item; in this paper, the spring-oscillator model is used to conduct equivalent analysis on the structure. The upper and lower limits of the band gap are solved by the finite element method and the transfer matrix method. The results obtained by the two solutions are basically consistent, which shows the correctness of the model hypothesis.
- Third item; the effects of structural parameters such as the length of the wedge base, the wedge height, and the lattice constant on the upper and lower limits of the first band gap are analyzed. It can be seen from the analysis that the wedge with a smaller base and higher height is beneficial to improve the sound insulation performance of the structure in the low-frequency range. Keeping a small lattice constant is one of the key factors to obtain a wide band gap.
5. Conclusions
This paper focuses on the low-frequency band gap characteristics of the new Helmholtz type phononic crystal and comprehensively uses the transfer matrix method, finite element method, equivalent model method, and other methods. Firstly, the band gap mechanism of Helmholtz phononic crystal was analyzed, and then the equivalent model of the spring oscillator was constructed, and its acoustic performance was studied. The study includes the formation law of band gap, the influencing factors of band gap, and the performance of sound insulation.
Based on existing research, this paper has made some innovative research on improving the low-frequency sound insulation performance and band gap characteristics of the Helmholtz type phononic crystal. However, there are still some problems that need to be further discussed. For example, thermal viscosity is a factor to be considered. This paper is only discussed in the range of pressure acoustics. If the designed structure is to be applied in practice, thermal-viscous acoustics should be added for a more detailed study. In addition, the research content of this paper is still mainly limited to the linear field, the flow of air is also an important factor. In future research, these factors can be taken into consideration to carry out further research.
Author Contributions
Conceptualization, D.-H.H. and G.-J.Z.; methodology, H.Y.; software, D.-H.H.; validation, D.-H.H., J.-B.Z., G.-J.Z. and H.Y.; formal analysis, J.-B.Z.; investigation, D.-H.H.; resources, G.-J.Z.; data curation, J.-B.Z.; writing—original draft preparation, D.-H.H.; writing—review and editing, J.-B.Z.; visualization, H.Y.; supervision, H.Y.; project administration, J.-B.Z.; funding acquisition, J.-B.Z. All authors have read and agreed to the published version of the manuscript.
Funding
This research was funded by the National Natural Science Foundation of China, grant number 11504429.
Institutional Review Board Statement
The study did not involve humans or animals.
Informed Consent Statement
The study did not involve humans.
Data Availability Statement
The data used to support the findings of this study are available from the corresponding authors upon request.
Conflicts of Interest
The authors declare no conflict of interest.
References
- Xia, Z.; Yongxiang, W.; Chuandong, D. Experimental study on the influence of noise on pilot ergonomics of J-8D aircraft. China J. Aerosp. Med. 1998, 9, 172. [Google Scholar]
- Wencheng, S.; Yujun, L.; Qiang, F. Wind Tunnel Test of Active Flow Control Technology for Aerodynamic Noise of Weapon Cabin. Chin. J. Aerodyn. 2016, 34, 33–39. [Google Scholar]
- Emborg, U.; Samuelsson, F.; Holmgren, J.; Leth, S. Active and passive noise control in practice on the Saab 2000 high speed turboprop. In Proceedings of the 4th AIAA/CEAS Aeroacoustics Conference, Toulouse, France, 2–4 June 1998. [Google Scholar] [CrossRef]
- Liang, Q.; Lv, P.; He, J.; Wu, Y.; Ma, F.; Chen, T. A controllable low-frequency broadband sound absorbing metasurface. J. Phys. D Appl. Phys. 2021, 54, 355109. [Google Scholar] [CrossRef]
- Gao, N.; Tang, L.; Deng, J.; Lu, K.; Hou, H.; Chen, K. Design, fabrication and sound absorption test of composite porous matamaterial with embedding I-plates into porous polyurethane. Appl. Acoust. 2021, 175, 107845. [Google Scholar] [CrossRef]
- Deymier, P.A. Acoustic Metamaterials and Phononic Crystals; National Defense Industry Press: Beijing, China, 2016. [Google Scholar]
- Montoya, F.G.; Baños, R.; Alcayde, A.; Manzano-Agugliaro, F. Symmetry in Engineering Sciences II. Symmetry 2020, 12, 1077. [Google Scholar] [CrossRef]
- Kushwaha, M.S.; Halevi, P.; Dobrzynski, L.; Djafari-Rouhani, B. Acoustic band structure of periodic elastic composites. Phys. Rev. Lett. 1993, 71, 2022. [Google Scholar] [CrossRef] [PubMed]
- Chenzhi, C.; Cheukming, M. Hybrid noise control in a duct using a periodic dual Helmholtz resonator array. Appl. Acoust. 2018, 134, 119–124. [Google Scholar]
- Mariaa, N.; Gabriela, S. Position optimization of Helmholtz resonator in ducts using a genetic algorithm. J. Acoust. Soc. Am. 2013, 133, 3452. [Google Scholar]
- Ahmet, S.; Iljae, L. Helmholtz resonator with extended neck. J. Acoust. Soc. Am. 2003, 113, 1975–1985. [Google Scholar]
- Dan, Z. Transmission loss analysis of a Parallel-Coupled helmholtz resonator network. AIAA J. 2012, 50, 1339–1346. [Google Scholar]
- Cai, C.; Mak, C.M.; Shi, X. An extended neck versus a spiral neck of the Helmholtz resonator. Appl. Acoust. 2017, 115, 74–80. [Google Scholar] [CrossRef]
- Fan, Y.; Lijun, L. Transmission loss and characteristic analysis of double Helmholtz resonators with different connection modes. Mod. Manuf. Eng. 2018, 452, 31–37. [Google Scholar]
- Shengli, S.; Miao, Z.; Weiwu, C. Research of acoustically improved Helmholtz resonator. Ship Sci. Technol. 2014, 36, 128–131. [Google Scholar]
- Xudong, W.; Yi, K.; Shuguang, Z.; Panxue, L. Research on multi-band structural noise reduction of vehicle body based on two-degree-of-freedom locally resonant phononic crystal. Appl. Acoust. 2021, 179, 108073. [Google Scholar]
- Li, J.; Wang, W.; Xie, Y.; Popa, B.-I.; Cummer, S.A. A sound absorbing metasurface with coupled resonators. Appl. Phys. Lett. 2016, 109, 091908. [Google Scholar] [CrossRef]
- Xia, B.; Qin, Y.; Chen, N.; Yu, D.; Jiang, C. Optimization of uncertain acoustic metamaterial with Helmholtz resonators based on interval model. Sci. China Technol. Sci. 2017, 60, 385–398. [Google Scholar] [CrossRef]
- Atak, O.; Huybrechs, D.; Pluymers, B.; Desmet, W. The design of Helmholtz resonator based acoustic lenses by using the symmetric Multi-Level Wave Based Method and genetic algorithms. J. Sound Vib. 2014, 333, 3367–3381. [Google Scholar] [CrossRef]
- Xie, Y.; Popa, B.-I.; Zigoneanu, L.; Cummer, S.A. Measurement of a broadband negative index with space-coiling acoustic metamaterials. Phys. Rev. Lett. 2013, 110, 175501. [Google Scholar] [CrossRef]
- Shu, Z.; Leilei, Y.; Nicholas, F. Focusing Ultrasound with an Acoustic Metamaterial Network. Phys. Rev. Lett. 2009, 102, 194301. [Google Scholar]
- Gao, N.; Wu, J.; Lu, K.; Zhong, H. Hybrid composite meta-porous structure for improving and broadening sound absorption. Mech. Syst. Signal Process. 2021, 154, 107504. [Google Scholar] [CrossRef]
- Guan, D.; Wu, J.H.; Jing, L.; Gao, N.; Hou, M. Application of a Helmholtz structure for low frequency noise reduction. Noise Control Eng. J. 2015, 63, 20–35. [Google Scholar] [CrossRef] [Green Version]
- Liu, M.; Hou, Z.L.; Fu, X.J. Local resonant acoustic band gaps in two-dimensional square-arranged Helmholtz resonators array. Acta Phys. Sin. 2012, 61, 000238. [Google Scholar]
- Xin, C.; Hong, Y.; Zhao, J.-B.; Zhang, S.; He, Z.-H.; Jiang, J.-N. Study on Band Gap of Helmholtz Resonator Coupled with Elastic Oscillator Structure. Acta Phys. Sin. 2019, 68, 084302. [Google Scholar]
- Xin, C.; Hong, Y.; Zhao, J.-B.; Zhang, S.; He, Z.-H.; Jiang, J.-N. Low Frequency Band Gap of Thin Films Coupled with Helmholtz Cavity. Acta Phys. Sin. 2019, 68, 214208. [Google Scholar]
- Qingying, Q.; Xiuming, C.; Chao, Y.; Peien, F. Classification and Effects of Symmetry of Mechanical Structure and Its Application in Design. Symmetry 2021, 13, 683. [Google Scholar]
- Elford, D.P.; Chalmers, L.; Kusmartsev, F.V.; Swallowe, G.M. Matryoshka locally resonant sonic crystal. J. Acoust. Soc. Am. 2011, 130, 2746–2755. [Google Scholar] [CrossRef] [PubMed] [Green Version]
- Gao, N.; Luo, D.; Cheng, B.; Hou, H. Teaching-learning-based optimization of a composite metastructure in the 0–10 kHz broadband sound absorption range. J. Acoust. Soc. Am. 2020, 148, EL125–EL129. [Google Scholar] [CrossRef]
- Rongjue, W. Accurate Calculation of Sound Velocity in Air. J. Nanjing Univ. Nat. Sci. Ed. 1955, 1, 55–63. [Google Scholar]
Figure 1.
The schematic diagram of the structure cross-section and arrangement of cells.

Figure 2.
(a) Band diagram of 0~500 Hz; (b) band diagram of the first and second bandgaps.

Figure 3.
(a) Sound pressure distribution diagrams of point A; (b) sound pressure distribution dia-grams of point B.
Figure 3.
(a) Sound pressure distribution diagrams of point A; (b) sound pressure distribution dia-grams of point B.

Figure 4.
(a) The equivalent model of point A; (b) the equivalent model of point B.

Figure 5.
Schematic diagram of sound insulation volume simulation.

Figure 6.
Transmission spectrum.

Figure 7.
Influence of the length of wedge base d on the first band gap.

Figure 8.
Influence of the wedge height h on the first band gap.

Figure 9.
Influence of lattice constant a on the first band gap.


Table 1.
The values of structural parameters.
| Parameters | ρair (kg/m3) | c (m/s) | s1 (m2) | V1 (m3) | V2 (m3) | l2/m |
|---|---|---|---|---|---|---|
| Value | 1.25 | 343 | 1.5 × 10⁻⁴ | 1.16 × 10⁻³ | 2.44 × 10⁻⁴ | 2.4 |
Table 2.
The low-frequency band gap range obtined by the two methods.
| Computing Method | Lower Limit of First Band Gap | Upper Limit of First Band Gap | Lower Limit of Second Band Gap | Upper Limit of Second Band Gap |
|---|---|---|---|---|
| FEM | 12.0 | 26.6 | 74.1 | 82.8 |
| TMM | 12.1 | 26.5 | 73.6 | 82.2 |
| Error | 0.83% | 0.38% | 0.67% | 0.72% |
Table 3.
The combination of structural parameters.
| Parameters | d/mm | h/mm | a/mm | l1/mm | n1 | b/mm | l3/mm |
|---|---|---|---|---|---|---|---|
| Initial structural parameters | 0.6 | 0.8 | 62 | 60 | 20 | 1 | 57 |
| Variation range of structural parameters | [0.5, 3.0] | [0.3, 0.8] | [62, 70] | 60 | 20 | 1 | 57 |
Publisher’s Note: MDPI stays neutral with regard to jurisdictional claims in published maps and institutional affiliations. |
© 2021 by the authors. Licensee MDPI, Basel, Switzerland. This article is an open access article distributed under the terms and conditions of the Creative Commons Attribution (CC BY) license (https://creativecommons.org/licenses/by/4.0/).
Share and Cite
MDPI and ACS Style
Han, D.-H.; Zhao, J.-B.; Zhang, G.-J.; Yao, H. Study on Low-Frequency Band Gap Characteristics of a New Helmholtz Type Phononic Crystal. Symmetry 2021, 13, 1379. https://doi.org/10.3390/sym13081379
AMA Style
Han D-H, Zhao J-B, Zhang G-J, Yao H. Study on Low-Frequency Band Gap Characteristics of a New Helmholtz Type Phononic Crystal. Symmetry. 2021; 13(8):1379. https://doi.org/10.3390/sym13081379
Chicago/Turabian StyleHan, Dong-Hai, Jing-Bo Zhao, Guang-Jun Zhang, and Hong Yao. 2021. "Study on Low-Frequency Band Gap Characteristics of a New Helmholtz Type Phononic Crystal" Symmetry 13, no. 8: 1379. https://doi.org/10.3390/sym13081379
Note that from the first issue of 2016, this journal uses article numbers instead of page numbers. See further details here.