
The Role of Participatory Village Maps in Strengthening Public Participation Practice


1
Faculty of Geo-Information Science and Earth Observation (ITC), University of Twente, 7514 AE Enschede, The Netherlands
2
Regional Development Planning Agency (BAPPEDA) of Deli Serdang District, Medan 20514, North Sumatra, Indonesia
*
Author to whom correspondence should be addressed.
ISPRS Int. J. Geo-Inf. 2021, 10(8), 512; https://doi.org/10.3390/ijgi10080512
Submission received: 3 June 2021
/
Revised: 21 July 2021
/
Accepted: 23 July 2021
/
Published: 29 July 2021
(This article belongs to the Special Issue Public Participation in 2021: New Forms, New Modes, New Questions?)
Abstract
:This study investigated the role of participatory village maps in strengthening the Musrenbang, an annual multi-stakeholder public consultation forum to discuss development issues and plans in Indonesia. We evaluated the Musrenbang in five villages in Deli Serdang District after conducting participatory mapping workshops to produce village maps to inform the Musrenbang process. Our results show that communication between Musrenbang participants improved because the maps provided a clear definition of the village administrative area, geospatial data as resources for participation, transparency, and a dynamic deliberative process. Collaboration was also evident as the maps enabled participants to exchange knowledge, experience social learning, and have greater influence on the decision-making process. Despite the benefits, some issues impeded the optimal use of the village maps to support the participatory process in the Musrenbang. The maps could not completely overcome the power disparities between Musrenbang participants. Certain actors still dominated the implementation of the Musrenbang, making the deliberative process inaccessible to and less inclusive of some local stakeholders. Several improvements are urgently needed to optimise the use of participatory village maps and enhance Musrenbang implementation.
1. Introduction
Numerous studies have reported the benefits of participatory maps in helping stakeholders to solve diverse development problems. Participatory maps allow stakeholders to communicate and collaborate effectively, while eliciting and integrating their spatial knowledge during the deliberative process [1], visualise spatial inequalities [2], raise citizens’ awareness of protecting their environment [3,4], and increase the decision-making capacity of local stakeholders [5]. Although advances in the technologies for collecting and producing maps have made the map-making process faster and more accessible, in the Global South, the situation might be challenging due to limited resources and capacity to obtain or produce maps [6,7,8]. For these countries, making maps available can be a complex endeavour that requires a great deal of effort, cost, and expertise.
Indonesia has a strong interest in making geospatial data, such as maps, available to support the decision-making process at different levels of government, from national, provincial, and district/city to the village. The government launched the One Map Policy (OMP) through Presidential Decree 9 of 2016 to reach a target of 85 thematic maps produced by 2019 [9]. However, by 2019, the only mandated thematic map yet to be accomplished by the government was the village map. Only one-third of Indonesia’s villages have been delineated but merely in village boundary map format [10,11]. The village map, which outlines the village boundary, facilities, and land use or land cover of the village area [10], is needed to support spatial planning and claim the villages’ boundaries [12,13]. It is also essential for the village planning and development process [7], notably for supporting the Musrenbang (in the Indonesian language, the word ‘musrenbang’ stands for ‘musyawarah perencanaan pembangunan’, which can be translated literally as ‘community consensus building for budgeting, planning, and development’), the public participation practice held annually in villages [14].
A bottom-up approach, such as participatory mapping, may be a feasible solution to deal with such a situation, particularly to address and support the collection and production of geospatial data at local scales [15]. Localising map production at the grassroots scale by employing participatory mapping might be a practical option to accelerate the availability of maps [15]. Involving village stakeholders in participatory mapping workshops would address the problem of unavailability of village maps and, at the same time, enable participants to communicate [16,17] and collaborate on map making [18,19] and, in doing so, experience social learning [20,21] and integrate their local spatial knowledge into the village maps [7,22,23]. Participatory mapping activities allow village stakeholders to conceptualise their local knowledge, which may benefit the management of the village’s local resources and spatial planning [24,25]. Consequently, the maps produced may be of value to the Musrenbang public participation process at the village level.
This study tested this hypothesis by scrutinising how village maps produced by village stakeholders through participatory mapping workshops enhance Indonesia’s Musrenbang public participation practice. Fox [26] argued that a participatory mapping exercise may be regarded as successful if villagers not only participate in the map-making process but also claim and use the maps produced. Thus, following our previous Musrenbang evaluation in 2018 [27], and the participatory mapping workshops in 2019 [7], we revisited the case study areas to evaluate the Musrenbang meeting in 2020 and observe the difference in implementation after they had village maps to hand. We aimed to answer the central question: To what extent do the participatory village maps produced from participatory mapping workshops help to strengthen public participation practice at the village level? We answered this question using the following two further questions: (1) To what extent do the participatory village maps support the Musrenbang by facilitating communication between participants? (2) To what extent do the participatory village maps help the Musrenbang by enabling collaboration between participants?
2. Participatory Village Maps for Strengthening Public Participation
The production of village maps for all villages is a challenging task for the Indonesian government. Of the 83,436 villages in Indonesia, only 31,147 have been delineated by the central government [9]. The rest do not have maps or have only sketch maps. Ambarwulan et al. [11] found that most of the village sketch maps do not follow cartographic rules. The maps typically have no coordinates, are unclear about the sources of data, are unscaled, and are only drawn with modest drawing tools, such as pens or markers. Consequently, the village sketch map cannot be used for measuring the size of the village area or to calculate the distance of the village from other cartographic objects (such as main roads, rivers, or the sub-district capital). The villagers never use sketch maps for any decision-making processes; consequently, the maps are usually displayed in the village head office only as decoration [28].
Some scholars have begun to work with villagers to produce village maps using cartographic rules, from conventional participatory mapping methods to sophisticated methods, such as the Geographic Information System (GIS), or a combination of both [5,29,30,31,32]. The village maps thus produced have been used for different purposes, such as counter-mapping [12,33], ecosystem service mapping [4,25,34,35], neighbourhood land-use planning [31,36], and delineation of village administrative areas [9,11]. Despite many studies in this field, there is a lack of empirical investigations addressing the role of such participatory village maps in supporting public participation practice. Examination of the Musrenbang may fill this gap as the topics of discussion in the process are closely linked to geographical locations, although maps are rarely used in Musrenbang implementation [28].
McCall and Minang [37] classified participatory mapping activities according to four degrees of participation: manipulative or passive participation, consultation or functional participation, interactive involvement in decision making by all actors in most stages, and initiation of actions at the highest degree. Inspired by this classification, in a previous study, we conducted participatory mapping workshops in three case study areas where village stakeholders produced geospatial data by integrating their spatial knowledge and learning as a group in a participatory manner [7,38]. The mapping workshops aimed to produce participatory village maps, while stimulating village stakeholders’ communication, collaboration, social learning and knowledge co-production.
In this study, we critically examine how the village maps produced in previous participatory mapping workshops have been used to strengthen Musrenbang practice. To do so, we employed the Sustainable Development Goal (SDG)-based evaluation framework developed in a previous study [27]. The framework, which was developed using SDGs 11.3 and 16.7 as the basis, acts as the analytical framework in this study. Out of 15 criteria, we tested 8 (shown in the third ring in Figure 1) that are relevant to the assessment of map usage in Musrenbang practice.
Facilitation of communication between participants is an essential factor for strengthening the public participation process. Public participation should be a democratic and inclusive process for the participants so that it is accessible to the wider community and is not restricted to an elite or privileged group [39]. Engagement in creating participatory village maps has the potential to achieve this purpose by facilitating communication between participants [7]. The maps provide a clear indication of the scope of the task [40,41] that enables participants to identify the spatial extent of the village administrative area that needs to be addressed in the Musrenbang. The participatory process is more transparent [42], since the village maps, as the data needed to support the deliberative process, are available and accessible [41,42]. The use of maps may stimulate a reciprocal and tolerant deliberative process that enables open and fair communication between participants [43,44]. Furthermore, participants can use the maps to formulate creative ideas or solutions for better results or decisions [40,45].
Public participation should also be responsive to development issues [46], while promoting the social learning of participants [47]. Thus, enabling participant collaboration is also crucial to strengthen the outcomes of public participation practice. The participatory village maps used in public participation practice should be able to stimulate collaboration and knowledge sharing [7,40]. The maps should support social learning and increase the villagers’ capacity to learn and work collaboratively to solve the community’s problems [47,48]. Such public participation practice may raise the participants’ satisfaction as their opinions can influence the final policy outcomes [43,49].
Despite the various potential benefits of using participatory maps in public participation practice, it is important to keep in mind that the maps may also have some negative impacts on local communities—what Fox et al. [50] called ‘the ironic effects’ of participatory mapping. Some information regarded by local communities as sensitive, such as religious or sacred places, can be exposed to external actors [51]. The map-making process can become ‘a small-group elitist activity’ involving a few stakeholders who have greater knowledge and access to the maps [52]. The technology gaps between different groups in the community can maintain the existing power disparities between local stakeholders [53]. The information presented on maps may provoke conflicts among stakeholders because of boundary disputes or competition for land [33,54], have repercussions on gender inequalities [55,56], and trigger land grabbing [13]. Therefore, this study attempts to objectively examine the positive and negative impacts of participatory village maps using the criteria listed in Figure 1.
3. Methodology
3.1. The Case Study
We studied the Musrenbang in five villages in Deli Serdang District, Indonesia. The Musrenbang functions as a legal mechanism for citizens to participate actively in the local development planning and budgeting processes while aligning top-down and bottom-up planning programmes [57,58]. It is implemented annually in public meeting format at several hierarchical levels, from the village, sub-district, and provincial to the national. Various stakeholders are involved in the meeting, including government officials, the private sector, and citizen representatives, such as women’s groups, religious or community leaders, and youth groups [27]. The Musrenbang plays an essential role in discussing, clarifying, harmonising, and building a consensus on development priorities at each level of the process [59,60]. At the village level, the Musrenbang is crucial as the first phase of the hierarchical participatory planning process and is a medium for rural citizens to share their views or aspirations and propose specific programmes to solve various development problems in the village [61].
Five villages were chosen for the case study based on four major criteria: (1) the villages were located in different sub-districts, (2) the ethnicity of the population was primarily Javanese, (3) the main livelihood of the population was farming/agriculture, and (4) the villagers were willing to participate in the study. The selected villages were Denai Lama, Kramat Gajah, Kolam, Sidoharjo I Pasar Miring, and Tandem Hulu II. We divided the villages into an intervention group, which included Denai Lama, Kramat Gajah, and Kolam, and a control group, which included Sidoharjo I Pasar Miring and Tandem Hulu. The division of villages into two groups is useful for comparing contrasting cases or situations under different treatments to seek explanations and gain an understanding of the social phenomena in different contexts [62]. This method allows the researcher to compare the impact of an intervention with what would have happened if there had been no intervention or to compare the impacts of different kinds of intervention [62,63]. Similar to a previous study by Reyes-García et al. [54], we randomly allocated the selected villages into the two groups. We did not inform any of the villages about the division and the names of the other villages involved in this study, as well as the different treatment of each village. The randomisation of experimental participants is crucial ‘as it means that the members of the different groups in the experiment are to all intents and purposes alike’ [62] (p. 55). Two modes of intervention were used: (1) a mapping intervention to produce participatory village maps and (2) the use of participatory village maps during the Musrenbang at the village level.
We visited and evaluated the Musrenbang in all villages twice, in 2018 (before the interventions) and in 2020 (after the interventions). We have reported the results of the Musrenbang (2018) and the mapping workshops (2019) in previous publications [7,27,28,38]. This study is a report of our second visit to the Musrenbang (2020) to examine the use of maps during the process in the case study areas.
3.2. The Participatory Mapping Workshops
We conducted one participatory mapping workshop for each of the intervention villages in October–November 2019. We used two methods: digital participatory mapping (DM) in Denai Lama and Kramat Gajah and non-digital participatory mapping (NDM) in Kolam (Figure 2). A high-resolution satellite image was used as a background layer to help participants to identify and draw elements in their village. (Each satellite image had a high resolution (50 cm) and was a natural colour composition (pan-sharpened) image covering the whole village administrative area. The satellite images were captured on 16 January 2019 (Kolam), 19 April 2019 (Denai Lama), and 19 May 2019 (Kramat Gajah) by the WorldView2 and WorldView3 platforms (https://worldview.earthdata.nasa.gov/).) Prior to the workshops, none of the villages had a georeferenced village map. We employed the Open Geospatial Tool (OGITO) application in the digital mapping workshops [7,38]. The OGITO tool allowed participants to draw on the satellite image displayed on a touchscreen monitor. For the non-digital mapping workshop, we manually drew on each village’s printed satellite image using colour markers and stickers. The first author then transferred the sketches drawn by the participants into a GIS to produce village maps in digital and hardcopy formats. Three maps—satellite image map, infrastructure/public facilities map, and land-use map—mandated by the Head of Geospatial Information Agency (BIG) Regulation 3 of 2016 were created and handed over to the village stakeholders. We also provided two additional maps: a boundary map and a proposed development map. The latter was based on the results of participants’ discussions during the participatory mapping workshops. In the last session, we asked them to identify problems and possible solutions for their village. Then, the participants drew the discussion result on the satellite image that we used in the participatory mapping workshops to produce a proposed development map. This map was then used to support the Musrenbang deliberative process.
We did not conduct any participatory mapping workshops in the control villages (Sidoharjo I Pasar Miring and Tandem Hulu II). However, Sidoharjo I Pasar Miring had produced its own village maps by hiring a private consultant in 2019. These maps were created with the involvement of only the village head and staff but not the other village stakeholders. The other control village, Tandem Hulu II, did not have or produce any maps at the time of data collection.
3.3. Data Collection and Analysis
The first author attended the Musrenbang in each village in January 2020. A passive observation was conducted to observe how the Musrenbang was implemented and how the villages that had village maps used them during the deliberative process of the Musrenbang (the observation guidelines are provided in Appendix A). At the end of the Musrenbang session, the participants were asked to fill a self-administered questionnaire (based on the conceptual framework in Figure 1) to collect their opinions about the Musrenbang implementation and the use of the village map during the process (Appendix B). A semi-structured interview (Appendix C) was also conducted in January–February 2020 with 69 Musrenbang participants. The details are shown in Table 1.
Audio and video recordings were made of all meetings and interviews. All participants verbally gave their informed consent to all data collection from the fieldwork. The questionnaire responses were compiled and analysed using frequency analysis, while the meeting notes and interviews were transcribed and analysed systematically using the content analysis method. All interviewees’ names were substituted with codes to anonymise them (Appendix D).
4. Results
4.1. To What Extent Do the Participatory Village Maps Support the Musrenbang by Facilitating Communication between Participants?
Based on the evaluation criteria, we obtained some notable results for five criteria related to the process of public participation.
4.1.1. Clear Scope of the Task: Defining the Spatial Extent of the Village Area That Needs to Be Addressed in the Musrenbang
The participatory village maps provided clear information about the extent of the village area and its boundaries. Valid information about the exact boundaries of neighbourhoods or villages was necessary for most of the participants whom we interviewed from all villages. The population size, village area, and population density (Table 1) did not have a bearing on the importance of boundaries for the village communities. The boundaries defined the scope of the task to help participants to focus on the topics related or relevant to their villages. Most of the interviewees in the intervention village group (Denai Lama, Kramat Gajah, and Kolam) responded that the maps used in the Musrenbang were helpful to better understand their village areas. The maps also enabled them to identify the boundaries with other villages and the boundaries of each neighbourhood in the villages. Interviewee C18 said, ‘It [the exact boundaries] is important, so a map is needed. If we want to plan a project development in our village, we must know the exact position’ (C18, personal communication, 11 February 2020). In this study, we did not observe an increase in conflict due to participatory mapping, but rather a reduction. The exact boundaries reduced tensions among heads of neighbourhoods when dealing with land registration or taxation issues (B8, personal communication, 28 January 2020).
The questionnaire results supported the finding for the intervention group that the village maps used during the Musrenbang had helped them to better understand their villages (Figure 3). Only a small percentage of respondents in Denai Lama (3%) and Kramat Gajah (2%) responded ‘strongly disagree’ and ‘neutral’, respectively, to the statement that the map was helpful for them to understand their village better. The responses of participants from the control villages were not included, since question 18 in the questionnaire was not relevant to them (see Appendix B).
In the control villages (Sidoharjo I Pasar Miring and Tandem Hulu II), the participants had difficulty identifying the area being discussed due to the lack of visualised supporting data, such as maps. They also revealed that village maps and information about boundaries were essential. For example, when asked about the possibility of using village maps in the Musrenbang, the three heads of neighbourhoods in Sidoharjo I Pasar Miring (D9, D10, and D11) gave the same response to whether village maps were important for showing boundary information. D10 said, ‘[The Musrenbang] will be much better. We can identify the boundaries, [for example the boundaries of] neighbourhood Pasar 7 [and] neighbourhood Pringgan, right?’ (D10, personal communication, 6 February 2020). Another interviewee from Tandem Hulu II also expressed his opinion about why the village map was necessary: ‘Because not all village officials, including the BPD (village council), understand each neighbourhood’s area. We know where neighbourhood 1, 2, 4 or 9 [is] located, but the details, such as [information about] pathways in each neighbourhood, we do not know’ (E5, personal communication, 17 February 2020).
4.1.2. Transparency: Village Maps Made the Decision-Making Process in the Musrenbang More Transparent
The participatory village maps helped the Musrenbang process to be more transparent. The maps displayed at the Musrenbang helped to provide participants with sufficient information about the process and the results of the planning discussion. The intervention villages used the participatory village maps in different ways, as shown in Figure 4. Denai Lama and Kramat Gajah displayed the printed village maps at the front of the meeting room so that the audiences could see them. Kolam used a slide projector to display the village map on the front wall of the venue.
The village heads of Denai Lama and Kolam used only the proposed development map during the Musrenbang, while the village head of Kramat Gajah used two maps, the proposed development map and the land-use map. The village heads used the maps to explain projects that needed to be implemented and showed the prioritised sites on the maps to convince the audience that the projects were crucial and should be prioritised (Figure 4). As a result, most of the interviewees from the intervention villages responded that the use of village maps had made the Musrenbang process more transparent. An interviewee from Denai Lama said, ‘The last Musrenbang was not the same as the Musrenbang in previous years. The last one was a bit flexible and more transparent’ (A8, personal communication, 18 February 2020). An interviewee from Kramat Gajah stated, ‘The [last] Musrenbang was transparent. Very transparent. We all could see the plans [on the maps presented]. All of them were transparent’ (C18, personal communication, 11 February 2020).
The use of the maps also made the discussion about budget allocation more transparent. An interviewee from Denai Lama said, ‘At least we knew, with all the presented data [all became clear]. The communities were constantly asking for information about the budget allocation and the sources. Those [kinds of information] were necessary. The village government should be open and transparent to the communities’ (A6, personal communication, 5 February 2020). C2 also stated that the maps made the Musrenbang process more transparent, ‘[The process was] transparent and more open. All participants could know that the budget allocation will be used for financing this [project] or that [project]’ (C2, personal communication, 7 February 2020).
The villages in the control group, Sidoharjo I Pasar Miring and Tandem Hulu II, did not use maps during the Musrenbang, although the former already had village maps. Interviewees D1 and D8 from Sidoharjo I Pasar Miring said that only the village head and secretary could access the maps. They also noted that the maps still contained some disputed village and neighbourhood boundaries. The village head decided not to make the maps public, because the boundaries were a sensitive issue that could provoke conflicts between citizens or with neighbouring villages (D8, personal communication, 11 February 2020).
Many interviewees from the control villages expressed their concerns about the lack of transparency during Musrenbang deliberations. Decisions about development priorities or budget allocation plans were made without any data or tools to support the discussion. Such a situation led to the participants wondering about the exact locations of the topics being discussed or why a budget needed to be allocated to a particular project. An interviewee from Tandem Hulu II said, ‘Well, you were there and saw it yourself. In the last Musrenbang, we only talked, without presenting any data [during the discussion]’ (E9, personal communication, 26 February 2020).
4.1.3. Accessibility of Resources for Participation: Data Are Essential for Public Participation Practice
The participants’ responses to the questionnaire show that the use of village maps had a positive influence on Musrenbang implementation. Previously, hardly any geographical data were used in the Musrenbang. The data used were often only a list of proposed programmes prepared by heads of neighbourhoods. They were handwritten on a sheet of paper and presented orally by each head of neighbourhood without supporting tools, such as a whiteboard or a slide projector. The heads of neighbourhoods rarely updated the lists, so they remained the same for years (D4, personal communication, 6 February 2020). However, in the 2020 Musrenbang, there was a substantial difference as villagers from Denai Lama, Kramat Gajah, and Kolam used village maps for the first time during the Musrenbang. As shown in Figure 5, most participants in the intervention group agreed that appropriate data were available to support the Musrenbang process.
This finding indicates that the participants in the intervention villages were aware that the village maps shown during the meeting made the latest Musrenbang different from previous ones. Respondent A9 considered the 2020 Musrenbang to be better than those in previous years. He said that the maps enhanced the deliberative process of the Musrenbang; the discussion was more constructive and faster because participants could directly identify, see, and point to the locations being discussed on the maps. Previously, they only discussed development priorities or plans without supporting data that clearly showed the exact locations (A9, personal communication, 18 February 2020).
In contrast, the responses of participants in the control group, particularly those from Tandem Hulu II, indicated that they felt the Musrenbang deliberation was not supported with sufficient data. Interestingly, Sidoharjo I Pasar Miring had responses almost similar to those from villages in the intervention group. In this village, the Musrenbang organiser combined the process with the regular biannual farmers’ meeting. The organiser split a two-hour meeting to discuss two different agendas, the Musrenbang itself and the meeting to decide the schedule of paddy-planting plans. Consequently, the participants were less representative because most of them were farmers who attended the meeting because their main purpose was to discuss the paddy-planting plans, not the village development priorities/plans. This may explain why their responses to the questionnaire were different from those of the participants from Tandem Hulu II. However, the interviews revealed that most participants representing citizens’ groups from both villages admitted the absence of supporting data during the Musrenbang implementation. They said that they had no understanding of the topics discussed, because no supporting data were displayed. This finding indicates that relying only on the list of proposed development programmes prepared by the heads of neighbourhoods may not be sufficient to support the Musrenbang deliberative process.
The majority of participants from each village also agreed that having data to support the discussion in the Musrenbang was important. However, the participants from the three villages that used village maps during the Musrenbang showed considerably greater agreement than villages that did not use geospatial data during the process (Figure 6). This finding suggests that if we had used village maps during the Musrenbang in these two villages, we would have obtained the same responses as those from the villages that used maps during the process.
4.1.4. New, Creative Ideas or Solutions: Maps Were Helpful to Determine the Areas Discussed
The Musrenbang participants effectively used the participatory village maps to formulate new, creative ideas or solutions. Participants could comprehensively define the village problems, integrate them, and use scientific or technical analysis during the deliberative process. In the questionnaire, we found different responses from the intervention (Denai Lama, Kramat Gajah, and Kolam) and control villages (Sidoharjo I Pasar Miring and Tandem Hulu II) to the question of whether the data available were effectively used during the Musrenbang (Figure 7). The majority of respondents from the intervention villages strongly agreed/agreed that the data were used effectively. A small percentage of respondents from Denai Lama and Kolam were neutral or disagreed. In contrast, the responses from the control group participants were generally mixed, with about a third disagreeing.
In the intervention villages, when a discussion about the administrative area arose, some participants referred to the maps to confirm the boundaries or make decisions. The maps also allowed them to think creatively in solving problems. For example, in Kolam, the maps were used to discuss the ideal number of farmer groups that the village should have based on the existing agricultural area. Interviewee B1 said:
From the maps, we found that some agricultural areas have changed to residential areas. So the current [agricultural] area does not match the requirement [the number of farmer groups]. So we need to merge some farmer groups. The maps were very helpful for that purpose (B1, personal communication, 28 January 2020).
The maps were also helpful for updating data on neighbourhood areas. In Kolam, all heads of neighbourhoods received a printed neighbourhood map that could be used to update the current conditions of their areas. Relevant updated information, such as population size, socio-economic indicators, and land registration, could help them to think creatively and formulate feasible solutions for their neighbourhoods and the village.
In contrast, the control villages did not use any data during the Musrenbang; consequently, there were no innovative approaches to identify or solve problems discussed in the Musrenbang (E9, personal communication, 26 February 2020).
4.1.5. Deliberative Processes Characterised by Reciprocity and Tolerance: They Continue to Be Dominated by Certain Elites
The participatory village maps were also helpful for supporting the deliberative process in the Musrenbang. Open and fair communication between participants was established during the Musrenbang in the intervention villages. More than 90% of the respondents in the three villages agreed that maps could help the Musrenbang deliberation (Figure 8). Only a small percentage was neutral about the helpfulness of maps in this regard. The responses from control villages were not included, since question 19 in the questionnaire was not relevant to these villages (see Appendix B).
The interviews also revealed that the use of maps increased the citizens’ trust in the village government. Interviewee A10 said that the maps were crucial to understand which particular topic was being discussed or needed to be prioritised. This kind of information is important to inform decision making in the Musrenbang process. Moreover, the visualisation of the village area on the maps facilitated the participants’ engagement with the topics of discussion (A10, personal communication, 5 February 2020). In the control villages that did not use maps, we found the ambiance of the Musrenbang deliberation in 2020 almost similar to that of the Musrenbang in 2018. The discussion was tedious and boring, and most participants kept silent during the meeting. The atmosphere of the Musrenbang was more like that of a ceremony than of a decision-making forum.
Although the participatory village maps had a positive influence on the Musrenbang deliberation, the majority of respondents from most of the villages were of the view that some participants dominated the discussions. More than half or two-thirds of the participants from Denai Lama, Kramat Gajah, Kolam, and Tandem Hulu II agreed that some participants were too dominant during the deliberations (Figure 9). The Sidoharjo I Pasar Miring participants gave mixed responses.
In Sidoharjo I Pasar Miring, only one-third of the participants agreed that certain individuals dominated the deliberative process (Figure 9). The participants’ background as farmers and the purpose of the meeting, as discussed in Section 4.1.3, could be the two main reasons why their responses were somewhat different from those of the participants from other villages.
Our observations also confirm that in all intervention and control villages, the discussion tended to be dominated by some participants, particularly village officials or community leaders who had more control and influence within the village communities. We noted three main causes for this issue. First, the village elites (village head, village staff, village council (BPD), village development board (LKMD), and heads of neighbourhoods) often used their roles as Musrenbang organisers to pre-select the attendees. The elites preferred to invite participants, from their circles or kinship groups, who would not oppose their ideas or development proposals. Interviewee A4 said that ideally, the participants from the intervention villages could use the participatory village maps to critically discuss the development proposal. However, since many of the Musrenbang attendees were related to individuals in the elite circles, only a few participants used the maps to oppose or criticise the proposals (A4, personal communication, 5 February 2020).
Second, some participants did not feel comfortable enough to have their say at the meeting, because the meeting arrangements were too formal and ceremonial. The schedule was also tight. The organisers only provided two to three hours for a Musrenbang meeting. The tight schedule was exacerbated by bad time management habits. All the meetings we attended always started late, by half to one hour from the time stated in the invitation, which significantly reduced the opportunity for detailed discussion among participants. Agenda items were too many and included opening remarks from the village council, officials of the sub-district government, and honoured guests from different institutions. Such arrangements led to participants having less time for fruitful discussion with other attendees. Moreover, this situation caused public speaking anxiety in some participants about articulating their opinions during the deliberative process. Interviewee B10 said, ‘If we are not used to speaking in front of many people, it would feel awkward. We could not express our opinion’ (B10, personal communication, 28 January 2020).
The meeting arrangement also led to fewer females participating in the Musrenbang, particularly in Kolam, Tandem Hulu II, and Sidoharjo I Pasar Miring (see Table 1). However, high female participation in the Musrenbang, as was seen in Denai Lama and Kramat Gajah, also did not guarantee that the female participants could contribute more during the deliberative process. The meeting arrangements also drove female participants to feel shy and less confident in conveying their views. A woman participant, A5, from Denai Lama said, ‘They have [different] opinions, but do not have bravery [to convey their opinions]. That is the main problem. Not all people can speak in front of lots of people. Nervous. Sometimes it makes us remain silent, and just listening’ (A5, personal communication, 5 February 2020). We also observed that female participants simply agreed with the males’ opinions during the deliberative processes. Interviewee A6 said that female participants remained silent during the meeting because they typically had the same opinions or ideas. Therefore, normally, one person talked on their behalf (A6, personal communication, 5 February 2020).
Third, the meeting venue brought another problem to Musrenbang implementation. Typically, it was the village meeting hall, which was often too small to accommodate a large group of people. The venue could be too noisy and crowded, and the meeting leaders could not efficiently control the crowds. Interviewee B4 said that while someone was speaking in the forum, others did not listen as they talked with the persons who sat next to them (B4, personal communication, 28 January 2020).
These findings indicate that the use of participatory village maps could not fully overcome the domination of the discussion by some individuals, primarily because the elites were not willing to create a democratic and inclusive participatory process for all citizens. Moreover, the maps were less effective when the meeting leaders or the organisers could not satisfactorily manage the deliberative process.
4.2. To What Extent Do the Participatory Village Maps Support the Musrenbang Outcomes by Enabling Collaboration between Participants?
The evaluation resulted in significant findings for three criteria related to the outcomes of public participation, as described below.
4.2.1. Knowledge Sharing: Maps Were Helpful for Sharing Development Issues in the Villages
The participatory village maps enabled participants to share their knowledge with other participants. We observed that the discussion among participants from the intervention villages (Denai Lama, Kramat Gajah, Kolam) became quite intense when someone referred to the maps. Interviewee B2 said, ‘When a citizen shared his/her opinion, we gained new information about the current condition that previously we did not know’ (B2, personal communication, 28 January 2020). A woman interviewee from Kolam said, ‘Knowledge sharing occurred, among the heads of neighbourhoods, among community leaders, the youth club. In the past, their opinions were less considered. Now, they can share with each other’ (B5, personal communication, 28 January 2020).
The participatory village maps were also helpful for clarifying or informing the development plans displayed on the map. For example, when a participant from Denai Lama asked why the street lamps had not been installed yet in his neighbourhood, the village head answered by pointing out the plan for street lamp instalment listed on the proposed development plan map. Interviewee A15 was of the same view: ‘In the last [Musrenbang] meeting, several participants were discussing some issues in a small group. The issues discussed in the small group were then shared with other participants [using the available maps]’ (A15, personal communication, 5 February 2020).
We also observed that people who attended the participatory mapping workshops were more active in the discussion. They had a better understanding of the maps because they were involved in creating them. Therefore, they could share their knowledge while relating the issues with the aid of the displayed maps. They were better able than the other participants to refer to the maps and relate the maps to the discussed topics. They also felt more confident in the Musrenbang after participating in the mapping workshops. Respondent A7 from Denai Lama said, ‘For me, receiving the knowledge [of how to produce village maps in a participatory manner] has made me more confident in the Musrenbang’ (A7, personal communication, 18 February 2020). A respondent from Kolam, B4, said that he became a source of information for other Musrenbang participants, who did not take part in the mapping workshops, when they had difficulties identifying the area discussed on the displayed maps (B4, personal communication, 28 January 2020).
In the control villages, the situation was different. Knowledge sharing occurred, but participants had difficulty identifying the objects or locations mentioned in the Musrenbang. They relied heavily on their mental maps of the village area. Therefore, sharing knowledge was challenging since no visual data, such as maps, were available.
4.2.2. Social Learning/Building Institutional Capital and Capacity
The results also imply that the participatory village maps allowed participants in the intervention villages to experience social learning. The maps enhanced the capacity of the participants to handle issues or conflicts and allowed them to collaborate in solving their common problems. We observed that at least three stages of social learning occurred in the Musrenbang. The participants from the intervention villages experienced all three stages, while participants from control villages only experienced the first stage of social learning. First, the questionnaire showed the rise in awareness of participants from all villages that participatory village maps or other supporting data should be available for the Musrenbang process. The interviews also discovered that data availability continued to be challenging, particularly for interviewees from the control villages. The maps could also stimulate participants to learn and work collaboratively to solve their problems. Interviewee C9 from Kramat Gajah said, ‘I finally understand that the Musrenbang could be the [right] place to discuss and solve the village problems. The citizens can share their concerns in the Musrenbang meeting, so I learned that we need to discuss [to solve our common problems]. The process was transparent’ (C9, personal communication, 11 February 2020).
Second, participants from the intervention villages showed behavioural changes when addressing village issues. The participants began to understand the benefits of maps in Musrenbang practice. For example, they finally understood that they could visualise almost everything on a map, as demonstrated by the proposed development map they used during the Musrenbang. The maps also changed their way of perceiving and handling problems. Interviewee C4 said, ‘By using the map, we can clearly see the village boundaries. We can also measure the length, distance [between two places], and the area directly on the maps’ (C4, personal communication, 7 February 2020).
Several interviewees from the intervention villages also revealed that the participatory village maps had been used several times before the Musrenbang. The village head of Kolam took the initiative to print copies of the village maps at a neighbourhood scale and then distributed them to each neighbourhood. Consequently, the heads of neighbourhoods could use the maps for updating socio-economic and population data for their neighbourhoods. Similarly, in Denai Lama, given the importance of the agricultural sector as the main livelihood, a thematic map displaying the working areas of farmers’ groups was produced to measure each group’s exact area, estimate the production in each area, and decide on the allocation of subsidised fertilisers for each group. In the past, they had never used a map to calculate or make such decisions. They learned how geospatial data, such as maps, can be a useful tool to visualise problems spatially and formulate solutions in a short period.
Third, the participants began to challenge underlying assumptions or values. For example, we found that discussion about sustainable development and land-use changes was quite intense in Kolam and Denai Lama. During the discussion, the participatory village maps became a valuable source for identifying the area. They discussed some profound challenges of the rapid land-use changes in their village, while also proposing alternatives or solutions. A respondent from Kolam said that the maps enabled him to recognise the village’s land-use changes. He stated, ‘I noticed the land-use changes in our village area [on the map]. For example, I found a site that used to be a paddy field area which has now changed into residential areas’ (B3, personal communication, 12 February 2020). He questioned their previous assumption that residential areas can bring more economic benefits than agricultural areas. This old assumption had triggered rapid land-use changes in the village. This kind of awareness would be helpful for the better management of spatial planning in villages, for example, for identifying which parts of the villages could be planned for built-up areas and for thinking critically about land-use changes that might endanger the sustainability of the agricultural sector, the main livelihood of village communities.
4.2.3. Influence on Final Policy: Participants’ Opinions Were Heard and Taken into Account
Participants feel satisfied when their views are heard and taken into account. Their involvement in the participatory process is more meaningful if their opinions can influence the final policy or decisions. Our interviews showed that most participants in the intervention and control villages felt that they had influence over the final policy or decisions. Interviewee A13 from Denai Lama said, ‘Although the village head has the authority to take the final decision, he may not know what [developments] are needed in each neighbourhood. That is why we need to discuss’ (C13, personal communication, 5 February 2020). Interviewee C9 from Kramat Gajah said, ‘Any decisions made [in Musrenbang] came from our discussion and consensus’ (C9, personal communication, 11 February 2020). However, we also observed that the participatory village maps used in the intervention villages helped participants to formulate their ideas when proposing alternatives or solutions. The maps enabled them to express their opinions in a structured way so that their views were heard and considered important. This kind of ‘help’ was not evident in the control villages.
The questionnaire also showed the same result. Most Musrenbang participants from all villages chose 7 to 10 in the questionnaire scale to rate their satisfaction with the Musrenbang process (Figure 10). However, the responses of participants from the intervention and control villages were different. Respondents from the intervention villages generally gave higher ratings for satisfaction with the Musrenbang in their villages than those from the control villages. This result indicates that the intervention villages were more satisfied with the Musrenbang process than the control villages.
5. Discussion and Conclusions
The empirical results of our case study indicate several vital issues related to the use of participatory village maps in Musrenbang public participation practice at the village level. First, the findings reveal that the use of participatory village maps in the Musrenbang strengthened its implementation. Most of the participants in the intervention villages agreed that the last Musrenbang, which used the participatory village maps, was much better than the previous Musrenbang. The maps enhanced communication between participants in the Musrenbang by providing a clear definition of the village area, geospatial data as resources for participation, transparency, new and creative solutions, and a dynamic deliberative process. The findings also show that the participatory village maps received positive responses from most of the Musrenbang participants. Their knowledge of the village area improved, enabling them to relate the discussion topics to the village maps used in the Musrenbang. They found that supporting data, such as maps, made the process more transparent and enhanced the Musrenbang deliberative process.
The participatory village maps also enabled collaboration between participants to achieve common goals in the Musrenbang. The visualisation of geospatial data helped the users to easily interpret the information displayed on the maps and acquire knowledge [64]. Knowledge sharing was evident as participants could effectively convey their concerns using the maps. Various levels of social learning were also apparent as some participants started to question previous land-use policy that might endanger the sustainability of the villagers’ main livelihood. The maps helped participants to convey their ideas or concerns, which were heard or adopted in the village development plans and eventually raised their satisfaction in the Musrenbang implementation.
The situation in the control villages was different. There was almost no difference between the Musrenbang in 2020 and that in previous years. The discussion was boring and ceremonial. The process lacked transparency. Data were not available to support the discussion. Participants also had difficulty identifying the objects or locations of the topics being discussed. The division of villages into intervention and control groups led to different results and experiences for the Musrenbang process as well as for the Musrenbang participants.
However, despite the maps enhancing the Musrenbang deliberations in the intervention villages, the potential of the participatory village maps appears not to have been fully realised. Participatory village maps could not completely overcome the power disparities between participants in the Musrenbang. Certain actors, particularly the village head and village officials, still dominated the deliberative process, indicating that it is still highly influenced by local political elites and government officials [58,65,66,67]. Their participation in map making enabled them to acquire greater knowledge and access to the maps than the other Musrenbang participants, thereby turning the process into a ‘small-group elitist activity’, as mentioned by Kahila-Tani et al. [52]. The village head and community leaders usually play an important role in the community, especially by controlling the local decision forums in the village [68]. They can use their influence wisely to drive the community to engage actively in achieving common interests. Conversely, they can also manipulate the community to support their ideas or interests; for example, they could use the maps to persuade and convince Musrenbang participants to support their development proposals, which may not reflect the real demands and needs of the community.
The situation is exacerbated when the village head and officials often intentionally pre-select and invite participants who would not oppose their ideas or development proposals. Consequently, although the Musrenbang public meeting is supposed to be open to and inclusive of all citizens, in reality, only specific individuals can attend the meeting. Thus, the agenda and final decisions are often in the hands of the elites. The pre-selection of participants may prevent individuals or marginal groups from accessing or attending the Musrenbang, which eventually perpetuates the power disparities between participants. These power disparities may weaken the Musrenbang implementation as well as prevent the optimal use of participatory village maps. Therefore, a comprehensive understanding of the local context and actors is crucial to minimise and mitigate unexpected factors, such as power disparities. More importantly, however, the village elites’ political will to make the public participation process more inclusive and accessible to all citizens is also a prerequisite to its success [69] as well as to an increase in the effective use of maps in public participation practice [54].
This study also revealed that female participants show a great interest in exploring or using participatory village maps. However, they do not feel confident enough to engage in the Musrenbang deliberations. The local cultural context and strong patriarchal values within society may be crucial factors that hinder women from contributing to the Musrenbang process [70,71]. Some studies have shown that women have extensive knowledge of their locality. For example, Corbett and Keller found that women have valuable cultural and historical information that might not otherwise have been gathered or included if they were not involved in participatory mapping workshops [72]. In the Brazilian Amazon, the women of Moikarakô are able to recognise important places and objects displayed on satellite images, especially gardens and domestic spaces [73]. Such knowledge deriving from their mental maps [74] and ‘a view from below’ experience from their daily activities [56] indicates that women could optimally use village maps if they had more space or opportunities to explore them during the Musrenbang.
The optimal use of participatory village maps was also highly influenced by the meeting arrangements for public participation. Poor arrangements can lead to elite domination [52] as well as prevent participants from conveying their opinions due to public-speaking anxiety [8]. Organisers should provide convenient settings more conducive to the discussion. The leader of the meeting should also manage the meeting professionally to create a democratic and pleasant atmosphere for all participants. Effective arrangements for public participation would prevent elite domination, while stimulating participants to engage actively during deliberations.
Public acceptance of participatory maps is also crucial to ensure that they are optimally used in public participation practice. We can learn from the control village that used a private consultant to produce village maps without involving all village stakeholders. The outcome of this exercise was less accurate results, with much important information, especially the boundaries, being unclear; consequently, the village head preferred not to use the maps for any purpose, including for the Musrenbang process. The village head had predicted that the community would question the information displayed on the maps, or worse, completely reject them.
By reflecting on the participatory village maps used in the intervention villages, we may conclude that the process of the participatory mapping workshops in these villages attained the third-level ‘interactive involvement’ in participatory mapping suggested by McCall and Minang [37]. At this level, the participants are actively involved in the map-making process, decide on what kind of maps they want to produce, and use the maps to help them in the participatory planning process [37]. Many scholars have suggested that it is important to ensure that the village communities are involved in the map-making process [19,22,30,35]. Local stakeholders with their local spatial knowledge are reliable sources of data to produce local maps. They should be invited to be involved from the initial phase of the map-making process since they know the village area well [52,75]. The involvement would not only acknowledge their local spatial knowledge but also increase the community’s acceptance of the participatory maps [22,76,77]. Active involvement could also determine users’ acceptance of the maps produced in the participatory mapping exercise since they would feel more included, engaged, and valued [22]. The involvement could also build their trust in the researcher [75] and boost the community’s sense of ownership of the mapping results [19]. This may explain why the maps produced by stakeholders in the intervention villages had greater acceptance within the communities compared to the maps produced by a consultant for one of the control villages.
The use of participatory village maps in the Musrenbang also shows that discussion about boundaries is important for village stakeholders. The question of the certainty and precision of maps produced in participatory mapping exercises was raised by McCall in 2006 [51]. He implied that the information displayed on maps, for instance, information about valuable resources or sacred places and boundaries, could be sensitive for the local communities and could even provoke conflicts. Unclear boundaries could provoke land grabbing by other parties [13] or conflicts with other villages [11,54]. Therefore, the determination and affirmation of village boundaries are crucial for clarifying the village administrative area’s precision and legal certainty [11]. Our case study also suggests that boundary information is helpful for easing conflicts between heads of neighbourhoods when dealing with land registration and taxation issues.
However, it is important to note that in the Indonesian context, the legal basis of the village maps produced by participatory mapping initiatives of non-governmental institutions is still uncertain. Although the Village Law 6/2014 and the Head of Geospatial Information Agency (BIG) Regulation 3 of 2016 regulate village mapping and village spatial planning, there is no guarantee that the products of participatory mapping activities would be acknowledged by upper levels of the government or integrated with formal (national and district) spatial planning [12]. As a result, the village boundaries drawn on village maps are still considered tentative. The government often considers mapping as a complex process that requires legitimate and skilful mappers and proper methodologies and techniques, with standard cartographic rules. Therefore, it is important to inform or consult with the upper levels of the government before participatory mapping takes place. The consultation could initiate constructive discussion or negotiation between governmental and non-governmental actors; this may eventually raise the bargaining position of the maps produced by communities to obtain formal governmental recognition.
This study also showed that all intervention villages used the proposed development map during the Musrenbang. This map displayed all the identified development issues and proposed projects based on the discussion in the mapping workshops. This map differed mainly from the other four maps (the satellite image, infrastructure/public facilities, land-use, and boundary maps) produced in the mapping workshops in that it did not fully follow the strict layout prescribed in existing regulation, such as the Head of Geospatial Information Agency (BIG) Regulation 3 of 2016. The proposed development map allowed mapping workshop participants to create or use their own symbols when drawing the identified village problems and suggested solutions. As a result, the proposed development map was useful for supporting the Musrenbang deliberation in the intervention villages for two reasons. First, the map presented the real needs and development priorities of the village communities; therefore, the displayed information was a neat fit with the main purpose of the meeting. Second, the map was easy to use and understandable to the village community since the symbols were originally made by the community itself.
This study had some limitations. First, not all Musrenbang participants were involved in our digital and non-digital participatory mapping workshops; this may mean that some participants did not understand the maps used in the Musrenbang. Improving the mapping methods is necessary. For example, an online application that can accommodate the engagement of more people could be a solution; it may attract diverse stakeholders and outreach groups to participate in the map-making process [20,78,79]. Second, although the Musrenbang has a critical role in identifying and listing projects with the highest priority for villages, this study did not investigate the final budget allocation as well as project implementation. The Musrenbang is merely one part of the whole planning process, and the finalisation of the plan can take several months after the Musrenbang. An in-depth analysis of the final budget allocation and project implementation is beyond the scope of this study but could be an interesting future research topic.
Despite these limitations, this study clearly indicates the importance of participatory village maps in strengthening public participation practice at the village level. The analysis contributes to the discussion on solutions acceptable to different countries in the field of participatory planning in rural areas. Our results also contribute empirically to the research on participatory mapping methods and use of maps in public participation practice.
Author Contributions
Conceptualisation, Aulia Akbar, Johannes Flacke, Javier Martinez, Martin F. A. M. van Maarseveen; methodology, Aulia Akbar; validation, Aulia Akbar; formal analysis, Aulia Akbar; data curation, Aulia Akbar; writing—original draft preparation, Aulia Akbar; writing—review and editing, Aulia Akbar, Johannes Flacke, Javier Martinez; visualisation, Aulia Akbar; supervision, Johannes Flacke, Javier Martinez, Martin F. A. M. van Maarseveen. All authors have read and agreed to the published version of the manuscript.
Funding
This research was funded by the Republic of Indonesia’s Ministry of Finance Indonesian Endowment Fund for Education (LPDP; grant no. PRJ-561/LPDP/2015).
Institutional Review Board Statement
The study has been reviewed by the ITC Ethics Committee, University of Twente (Reference number 2021072801, 28 July 2021).
Informed Consent Statement
Informed consent was obtained from all subjects involved in the study.
Data Availability Statement
The data presented in this study are available in the DANS repository, which can be accessed at https://doi.org/10.17026/dans-zbs-zc2m.
Acknowledgments
We would like to thank the Republic of Indonesia’s Ministry of Finance Indonesian Endowment Fund for Education (LPDP) for supporting this research. We thank all the respondents from Kramat Gajah, Kolam, Denai Lama, Sidoharjo I Pasar Miring, and Tandem Hulu II villages, Deli Serdang District, who enthusiastically responded to our questions and helped our fieldwork. We thank Muhammad Farouq Ghazali Matondang, Ziki Wahyu Rinaldi, Faisal Andrean, Umar Hamdan Hasibuan, IndieMap, and our colleagues at the University of Sumatera Utara (USU) and the State University of Medan (UNIMED) for providing technical support during data collection. We also thank anonymous reviewers for providing useful comments that helped to improve the paper.
Conflicts of Interest
The authors declare no conflict of interest.
Appendix A
| Village Musrenbang Observation Sheet |
| Village: ……………… Date: ………… Observer: ………………………… |
|
Appendix B
| Questionnaire for Village Musrenbang Participants |
| Village: ……………………………………… Date: …………………… |
This questionnaire form is part of the research conducted by Mr. Aulia Akbar, PhD student from ITC, University of Twente. This is an anonymous questionnaire, so you do not need to fill your name on the form. Data that are collected will be used to understand the process of the village Musrenbang and will be published for academic/research purposes. Please fill this form before you leave the Musrenbang venue. If you have any enquiries, please ask, or you can contact Aulia Akbar at HP/WA: +628196030291.
Thank you for your kind attention and help.
- a.
- Evaluation towards the Musrenbang process
Based on your experience in the Musrenbang process, please put a cross sign (X) next to the answers that you choose.
| About the Musrenbang Process | Strongly Disagree | Disagree | Neutral | Agree | Strongly Agree |
| 1 | 2 | 3 | 4 | 5 |
| 1 | 2 | 3 | 4 | 5 |
| 1 | 2 | 3 | 4 | 5 |
| 1 | 2 | 3 | 4 | 5 |
| 1 | 2 | 3 | 4 | 5 |
| 1 | 2 | 3 | 4 | 5 |
| 1 | 2 | 3 | 4 | 5 |
| 1 | 2 | 3 | 4 | 5 |
| 1 | 2 | 3 | 4 | 5 |
| 1 | 2 | 3 | 4 | 5 |
| 1 | 2 | 3 | 4 | 5 |
| 1 | 2 | 3 | 4 | 5 |
| 1 | 2 | 3 | 4 | 5 |
- b.
- Evaluation about the data/information used to support the Musrenbang
| About the Data/Information Available to Support the Discussion in the Musrenbang | Strongly Disagree | Disagree | Neutral | Agree | Strongly Agree |
| 1 | 2 | 3 | 4 | 5 |
| 1 | 2 | 3 | 4 | 5 |
| 1 | 2 | 3 | 4 | 5 |
| 1 | 2 | 3 | 4 | 5 |
| 1 | 2 | 3 | 4 | 5 |
| 1 | 2 | 3 | 4 | 5 |
- c.
- About yourself
Please choose or fill the answer that is most appropriate for you.
- Sex:
☐ Woman ☐ Man
- 2.
- Age:
☐ Less than 18 y.o. ☐ 18–30 y.o. ☐ 31–50 y.o. ☐ 51–65 y.o. ☐ >65 y.o.
- 3.
- Last education
☐ SD/MI ☐ SMP/MTs ☐ SMA/SMK/MA ☐ Diploma ☐ S1 ☐ S2 ☐ S3
- 4.
- Your position/role in the village?
☐ Village government, as: ……………………………
☐ Head of neighbourhood, as: …………………………
☐ BPD; as: ……………………
☐ LKMD; as: ……………………
☐ PKK; as: ………………
☐ Karang Taruna; as: ………………
☐ Tokoh masyarakat, as: ………………………………
☐ Others. Please explain: …………………
- 5.
- Did you attend the participatory mapping workshop held in the village hall to create village maps some time ago?
☐ Yes ☐ No
- 6.
- Did you find the participatory mapping workshop that you attended useful for you to participate effectively in the Musrenbang?
☐ Yes ☐ No ☐ Not relevant
- 7.
- How often do you use printed maps?
☐ Never ☐ Few times in a year ☐ Once a month ☐ Every week ☐ Every day
- 8.
- How often do you use digital maps (e.g., Google Maps on the smartphone)?
☐ Never ☐ Few times in a year ☐ Once a month ☐ Every week ☐ Every day
- 9.
- How many times have you ever participated in the Musrenbang?
☐ Never ☐ 1–2 times ☐ 3–5 times ☐ More than 5 times
- 10.
- On a scale of 1–10, how satisfied are you with the Musrenbang process? (Please circle a number that is appropriate for you; 1 is the lowest satisfaction, and 10 is the most satisfaction.)
1 2 3 4 5 6 7 8 9 10
Thank you for your time for filling the questionnaire.
Appendix C
| Semi-Structured Interview for Musrenbang Participants |
- Interviews with Stakeholders:
- Name:
- Village:
- Sub-district:
- Date of Data Collection
| Date | Month | Time (start) | Time (finish) |
- Introduction
Dear Sir/Madam,
My name is Aulia Akbar. I am here on behalf of the Universiteit of Twente as a researcher of the Musrenbang practice. We would like ask you some questions about your opinions and experiences about the previous village Musrenbang implementation.
In answering our questions, there are no right or wrong answers; we are interested in your own experience. Your name will remain secret, and everything we talk about will be anonymous. If you have any questions during the interview or our questions are not clear, please let us know.
- Background of the interviewee
- 1.
- Could you tell me your full name?
- 2.
- From which neighbourhood?
- 3.
- How long have you lived in …………. Village?
- 4.
- What do you do for a living? What is your position? How long have you been working in that position?
- Representativeness in the Musrenbang
- 5.
- What was your role when you attended the last Musrenbang? Which groups did you represent?
- 6.
- How many times have you ever attended a Musrenbang practice with that role?
- 7.
- Did you ever have other roles? If so, please explain.
- 8.
- Do you think the participants represented all important stakeholders in the village? If not, who else should be invited?
- Awareness of the scope and process of the Musrenbang
- 9.
- How many times have you ever participated in the Musrenbang?
- 10.
- What do you think about the aims of the Musrenbang?
- 11.
- Do you think that the scope of the Musrenbang is clear and appropriate for participants?
- The deliberation process
- 12.
- What do you think about the transparency in the Musrenbang process?
- 13.
- In general, what do you think about the discussion process in the Musrenbang?
- 14.
- What do you about the opportunities for participants to have a say at the meeting?
- 15.
- Did you think there were certain stakeholders dominating the discussion?
- 16.
- Who had more domination in the process? Who had less domination?
- 17.
- What are the factors that make certain people more dominant or less dominant?
- 18.
- About the discussion process, was it dynamic, lively, or maybe too formal? Why?
- Decision-making process
- 19.
- What do you think about the decision-making process in the Musrenbang?
- 20.
- How can you reach a consensus about the plans and budget priorities?
- Knowledge used and social learning experiences
- 21.
- To what extent did you share your knowledge with other participants? Did other stakeholders also share their knowledge?
- 22.
- How did the deliberative processes allow you to understand other participants’ points of view?
- Data/information availability
- 23.
- Did the Musrenbang organiser provide any data/information (i.e., maps, diagrams, pictures)?
- 24.
- If so, what kind of data/information did you get at the meeting?
- 25.
- If not, what kind of data/information do you think needs to be provided at the meeting?
- 26.
- Do you think it is important to have available data/information at the meeting? Why?
- Village map utilisation in the Musrenbang
- 27.
- Was any village map used during the Musrenbang? (If the answer is no, then go to questions 29 and 30 and finish the interview.)
- 28.
- If so, could you explain how the maps were used during the Musrenbang?
- 29.
- Did the Musrenbang of previous years ever use a village map?
- 30.
- What do you think about the utilisation of maps during the Musrenbang?
- 31.
- Did you think the maps are helpful to know more about your village? How?
- 32.
- Did you find the maps useful to support the deliberation of the Musrenbang? How?
- Participation in participatory mapping workshops
- 33.
- Did you participate in the participatory mapping workshop some time ago? (If the answer is no, then finish the interview.)
- 34.
- If so, did you find the workshop useful for you? How?
- 35.
- Could you elaborate the effect of participating in the workshops towards your involvement in the Musrenbang?
Thank you for your answers and support for this research.
Interviewer,
(……………)
Appendix D
- All of the interviewees’ names were kept anonymous by using codes as follows:
- A1, A2, A3, . . . = codes for interviewees from Denai Lama Village
- B1, B2, B3, . . . = codes for interviewees from Kolam Village
- C1, C2, C3, . . . = codes for interviewees from Kramat Gajah Village
- D1, D2, D3, . . . = codes for interviewees from Sidoharjo I Pasar Miring Village
- E1, E2, E3, . . . = codes for interviewees from Tandem Hulu II Village
References
- Shrestha, R.; Flacke, J.; Martinez, J.; van Maarseveen, M. Knowledge Co-Production and Social Learning on Environmental Health Issues. In GIS in Sustainable Urban Planning and Management: A Global Perspective; CRC Press: Boca Raton, FL, USA, 2018; pp. 83–102. [Google Scholar]
- Martinez, J. The use of GIS and indicators to monitor intra-urban inequalities. A case study in Rosario, Argentina. Habitat Int. 2009, 33, 387–396. [Google Scholar] [CrossRef]
- Damastuti, E.; de Groot, R. Participatory ecosystem service mapping to enhance community-based mangrove rehabilitation and management in Demak, Indonesia. Reg. Environ. Chang. 2019, 19, 65–78. [Google Scholar] [CrossRef] [Green Version]
- Ramirez-Gomez, S.; Torres-Vitolas, C. Analysis of ecosystem services provision in the Colombian Amazon using participatory research and mapping techniques. Ecosyst. Serv. 2015, 13, 93–107. [Google Scholar] [CrossRef] [Green Version]
- Eilola, S.; Käyhkö, N.; Ferdinands, A.; Fagerholm, N. Landscape and Urban Planning A bird’ s eye view of my village—Developing participatory geospatial methodology for local level land use planning in the Southern Highlands of Tanzania. Landsc. Urban Plan. 2019, 190, 103596. [Google Scholar] [CrossRef]
- Patel, Z.; Greyling, S.; Simon, D.; Arfvidsson, H.; Moodley, N.; Primo, N.; Wright, C. Local responses to global sustainability agendas: Learning from experimenting with the urban sustainable development goal in Cape Town. Sustain. Sci. 2017, 12, 785–797. [Google Scholar] [CrossRef]
- Akbar, A.; Flacke, J.; Martinez, J.; Aguilar, R.; van Maarseveen, M. Knowing My Village from the Sky: A Collaborative Spatial Learning Framework to Integrate Spatial Knowledge of Stakeholders in Achieving Sustainable Development Goals. ISPRS Int. J. Geo-Inf. 2020, 9, 515. [Google Scholar] [CrossRef]
- Falco, E. Digital Community Planning: The Open Source Way to the Top of Arnstein’s Ladder. Int. J. E-Plan. Res. 2016, 5, 1–22. [Google Scholar] [CrossRef]
- Patmasari, T. The Role of Geospatial Information for Accelerating the Delineation of Village Boundaries in Indonesia using Cartometric Method. Int. J. Adv. Eng. Res. Sci. 2019, 6, 46–58. [Google Scholar] [CrossRef]
- Abidin, H. Status and Future Plans One Map Policy Indonesia. In Proceedings of the 15th South East Asia Survey Congress, Darwin, Australia, 15–18 August 2019. [Google Scholar]
- Ambarwulan, W.; Wulan, T.; Lestari, S.; Patmasari, T.; Suparwati, T. Application of Remotely Sensed Satellite Imagery for Village Boundary Mapping in Indonesia: Case study in Hulu Sungai Tengah Regency, South. In Proceedings of the FIG Congress 2018, Istanbul, Turkey, 6–11 May 2018. [Google Scholar]
- De Vos, R. Counter-Mapping against oil palm plantations: Reclaiming village territory in Indonesia with the 2014 Village Law. Crit. Asian Stud. 2018, 50, 615–633. [Google Scholar] [CrossRef] [Green Version]
- Shahab, N. Indonesia: One Map Policy. Available online: https://www.opengovpartnership.org/wp-content/uploads/2001/01/case-study_Indonesia_One-Map-Policy.pdf (accessed on 12 November 2020).
- Feruglio, F.; Rifai, A. Participatory Budgeting in Indonesia: Past, Present and Future; Institute of Development Studies: Brighton, UK, 2017. [Google Scholar]
- Solís, P.; McCusker, B.; Menkiti, N.; Cowan, N.; Blevins, C. Engaging global youth in participatory spatial data creation for the UN sustainable development goals: The case of open mapping for malaria prevention. Appl. Geogr. 2018, 98, 143–155. [Google Scholar] [CrossRef]
- Engen, S.; Runge, C.; Brown, G.; Fauchald, P.; Nilsen, L.; Hausner, V. Assessing local acceptance of protected area management using public participation GIS (PPGIS). J. Nat. Conserv. 2018, 43, 27–34. [Google Scholar] [CrossRef] [Green Version]
- Rambaldi, G.; Chambers, R.; McCall, M.; Fox, J. Practical ethics for PGIS practitioners, facilitators, technology intermediaries and researchers. Particip. Learn. Action 2006, 54, 106–113. [Google Scholar]
- Falco, E.; Zambrano-Verratti, J.; Kleinhans, R. Web-based participatory mapping in informal settlements: The slums of Caracas, Venezuela. Habitat Int. 2019, 94, 102038. [Google Scholar] [CrossRef]
- Pánek, J. How participatory mapping can drive community empowerment—A case study of Koffiekraal, South Africa. South Afr. Geogr. J. 2015, 97, 18–30. [Google Scholar] [CrossRef]
- Brown, G.; Kyttä, M. Key issues and research priorities for public participation GIS (PPGIS): A synthesis based on empirical research. Appl. Geogr. 2014, 46, 122–136. [Google Scholar] [CrossRef]
- Eilola, S.; Fagerholm, N.; Mäki, S.; Khamis, M. Realization of participation and spatiality in participatory forest management—A policy–practice analysis from Zanzibar, Tanzania. J. Environ. Plan. Manag. 2015, 58, 1242–1269. [Google Scholar] [CrossRef]
- McCall, M. Participatory Mapping and PGIS: Secerning Facts and Values, Representation and Representativity. Int. J. E-Plan. Res. 2021, 10, 105–123. [Google Scholar] [CrossRef]
- Cinderby, S.; Forrester, J.M. Co-designing Possible Flooding Solutions: Participatory Mapping Methods to Identify Flood Management Options from a UK Borders Case Study. J. Geogr. Inf. Sci. 2016, 1, 149–156. [Google Scholar] [CrossRef] [Green Version]
- Wartmann, F.; Purves, R. What’s (not) on the map: Landscape features from participatory sketch mapping differ from local categories used in language. Land 2017, 6, 79. [Google Scholar] [CrossRef] [Green Version]
- Burdon, D.; Potts, T.; McKinley, E.; Lew, S.; Shilland, R.; Gormley, K.; Thomson, S.; Forster, R. Expanding the role of participatory mapping to assess ecosystem service provision in local coastal environments. Ecosyst. Serv. 2019, 39, 101009. [Google Scholar] [CrossRef]
- Fox, J. Siam mapped and mapping in Cambodia: Boundaries, sovereignty, and indigenous conceptions of space. Soc. Nat. Resour. 2002, 15, 65–78. [Google Scholar] [CrossRef]
- Akbar, A.; Flacke, J.; Martinez, J.; van Maarseveen, M. Participatory planning practice in rural Indonesia: A sustainable development goals-based evaluation. Community Dev. 2020, 51, 243–260. [Google Scholar] [CrossRef]
- Akbar, A.; Flacke, J.; Martinez, J.; van Maarseveen, M. Spatial Knowledge: A Potential to Enhance Public Participation? Sustainability 2020, 12, 5025. [Google Scholar] [CrossRef]
- Corbett, J. Empowering Technologies? Introducing Participatory Geographic Information and Multimedia Systems in two Indonesian Communities; University of Victoria: Victoria, BC, Canada, 1995. [Google Scholar]
- Corbett, J.; Keller, C. Empowerment and Participatory Geographic Information and Multimedia Systems: Observations from Two Communities in Indonesia. Inf. Technol. Int. Dev. 2005, 2, 25–44. [Google Scholar] [CrossRef]
- Aditya, T. Usability issues in applying participatory mapping for neighborhood infrastructure planning. Trans. GIS 2010, 14, 119–147. [Google Scholar] [CrossRef]
- Pánek, J. Aramani—Decision-support tool for selecting optimal participatory mapping method. Cartogr. J. 2015, 52, 107–113. [Google Scholar] [CrossRef]
- Sirait, M.; Prasodjo, S.; Podger, N.; Flavelle, A.; Fox, J. Mapping customary land in East Kalimantan, Indonesia: A tool for forest management. Ambio 1994, 23, 411–417. [Google Scholar] [CrossRef]
- Ramirez-Gomez, S.; Brown, G.; Verweij, P. Participatory mapping to identify indigenous community use zones: Implications for conservation planning in southern Suriname. J. Nat. Conserv. 2016, 29, 69–78. [Google Scholar] [CrossRef] [Green Version]
- Brown, G.; Fagerholm, N. Empirical PPGIS/PGIS mapping of ecosystem services: A review and evaluation. Ecosyst. Serv. 2015, 13, 119–133. [Google Scholar] [CrossRef]
- Simão, A.; Densham, P.; Haklay, M. Web-based GIS for collaborative planning and public participation: An application to the strategic planning of wind farm sites. J. Environ. Manag. 2009, 90, 2027–2040. [Google Scholar] [CrossRef]
- McCall, M.; Minang, P. Assesing Participatory GIS for Community-Based Natural Resource Management: Claiming Community Forests in Cameroon. Geogr. J. 2005, 171, 340–356. [Google Scholar] [CrossRef]
- Aguilar, R.; Calisto, L.; Flacke, J.; Akbar, A.; Pfeffer, K. OGITO, an Open Geospatial Interactive Tool to support collaborative spatial planning with a maptable. Comput. Environ. Urban Syst. 2021, 86, 101591. [Google Scholar] [CrossRef]
- Haklay, M. Neogeography and the delusion of democratisation. Environ. Plan. A 2013, 45, 55–69. [Google Scholar] [CrossRef]
- Innes, J.; Booher, D. Consensus building and complex adaptive systems: A framework for evaluating collaborative planning. J. Am. Plan. Assoc. 1999, 65, 412–423. [Google Scholar] [CrossRef]
- Rowe, G.; Marsh, R.; Frewer, L. Evaluation of a Deliberative Conference. Sci. Technol. Hum. Values 2004, 29, 88–121. [Google Scholar] [CrossRef]
- Rowe, G.; Frewer, L. Public Participation Methods: A Framework for Evaluation. Sci. Technol. Hum. Values 2000, 25, 3–29. [Google Scholar] [CrossRef]
- Agger, A.; Löfgren, K. Democratic Assessment of Collaborative Planning Processes. Plan. Theory 2008, 7, 145–164. [Google Scholar] [CrossRef]
- Laurian, L.; Shaw, M. Evaluation of public participation: The practices of certified planners. J. Plan. Educ. Res. 2008, 28, 293–309. [Google Scholar] [CrossRef]
- Beierle, T. The quality of stakeholder-based decisions. Risk Anal. 2002, 22, 739–749. [Google Scholar] [CrossRef] [PubMed]
- Swapan, M. Who participates and who doesn’t? Adapting community participation model for developing countries. Cities 2016, 53, 70–77. [Google Scholar] [CrossRef]
- Flacke, J.; Shrestha, R.; Aguilar, R. Strengthening participation using interactive planning support systems: A systematic review. ISPRS Int. J. Geo-Inf. 2020, 9, 49. [Google Scholar] [CrossRef] [Green Version]
- Perdana, A.; Ostermann, F. Eliciting Knowledge on Technical and Legal Aspects of Participatory Toponym Handling. ISPRS Int. J. Geo-Inf. 2019, 8, 500. [Google Scholar] [CrossRef] [Green Version]
- Webler, T.; Tuler, S.; Krueger, R. What is a good public participation process? Five perspectives from the public. Environ. Manag. 2001, 27, 435–450. [Google Scholar] [CrossRef]
- Fox, J.; Suryanata, K.; Hershock, P.; Pramono, A. Mapping Power: Ironic Effects of Spatial Information Technology. Particip. Learn. Action 2006, 54, 98–105. [Google Scholar]
- McCall, M. Precision for whom? Mapping ambiguity and certainty in (Participatory) GIS. Particip. Learn. Action 2006, 54, 114–119. [Google Scholar]
- Kahila-Tani, M.; Kytta, M.; Geertman, S. Does mapping improve public participation ? Exploring the pros and cons of using public participation GIS in urban planning practices. Landsc. Urban Plan. 2019, 186, 45–55. [Google Scholar] [CrossRef]
- Chapin, M.; Lamb, Z.; Threlkeld, B. Mapping indigenous lands. Annu. Rev. Anthropol. 2005, 34, 619–638. [Google Scholar] [CrossRef] [Green Version]
- Reyes-García, V.; Orta-Martínez, M.; Gueze, M.; Luz, A.C.; Paneque-Gálvez, J.; Macía, M.J.; Pino, J. Does participatory mapping increase conflicts? A randomized evaluation in the Bolivian Amazon. Appl. Geogr. 2012, 34, 650–658. [Google Scholar] [CrossRef]
- Catacutan, D.; McGaw, E.; Llanza, M. (Eds.) In Equal Measure: A User Guide to Gender Analysis in Agroforestry; World Agroforestry Centre (ICRAF) Southeast Asia Regional Program: Los Baños, Philippines, 2014; ISBN 1930261381. [Google Scholar]
- Gilbert, M.; Masucci, M. The implications of including women’s daily lives in a feminist GIScience. Trans. GIS 2006, 10, 751–761. [Google Scholar] [CrossRef]
- Butler, J.; Bohensky, E.; Suadnya, W.; Yanuartati, Y.; Handayani, T.; Habibi, P.; Puspadi, K.; Skewes, T.; Wise, R.; Suharto, I.; et al. Scenario planning to leap-frog the Sustainable Development Goals: An adaptation pathways approach. Clim. Risk Manag. 2016, 12, 83–99. [Google Scholar] [CrossRef] [Green Version]
- Sutiyo, S. Roles of Neighborhood Group to Promote Participatory Development in Indonesia: Case of Three Villages in Purbalingga District, Central Java Province. J. Gov. Polit. 2015, 6, 125–135. [Google Scholar] [CrossRef] [Green Version]
- Indika, D.; Vonika, N. Increasing Transparency and Community Participation through the Open Government Partnership in Bojonegoro Regency. In Proceedings of the Achieving and Sustaining SDGs 2018 Conference: Harnessing the Power of Frontier Technology to Achieve the Sustainable Development Goals (ASSDG 2018), Bandung, Indonesia, 18 October 2018; Atlantis Press: Dordrecht, The Netherlands; Paris, France; Zhengzhou, China, 2019; Volume 216, pp. 41–51. [Google Scholar]
- Sutiyo, S. A Study on Implementation of Decentralized Rural Development in Indonesia: Case of Three Villages in Purbalingga District, Central Java Province; Hiroshima University: Hiroshima, Japan, 2013. [Google Scholar]
- Grillos, T. Participatory Budgeting and the Poor: Tracing Bias in a Multi-Staged Process in Solo, Indonesia. World Dev. 2017, 96, 343–358. [Google Scholar] [CrossRef]
- Bryman, A. Social Research Methods, 4th ed.; Oxford University Press: New York, NY, USA, 2012; ISBN 978-0-19-958805-3. [Google Scholar]
- Banerjee, A.; Duflo, E. The experimental approach to development economics. Annu. Rev. Econom. 2009, 1, 151–178. [Google Scholar] [CrossRef] [Green Version]
- Kraak, M. Geovisualization illustrated. ISPRS J. Photogramm. Remote Sens. 2003, 57, 390–399. [Google Scholar] [CrossRef]
- Purba, R. Decentralization and public participation: Learning from Indonesia. In Proceedings of the 18th Biennial Conference of the Asian Studies Association of Australia: Crises and Opportunities: Past, Present and Future, Adelaide, Australia, 5–10 July 2010. [Google Scholar]
- Purba, R. Public Participation in Development Planning: A Case Study of Indonesian Musrenbang. Int. J. Interdiscip. Soc. Sci. 2011, 5, 265–277. [Google Scholar] [CrossRef]
- Aswad, S.; Heywood, P.; Susilawati, C. The roles of procedural justice and social learning in improving self organizing capabilities of local communities for sustainable development in decentralized. OIDA Int. J. Sustain. Dev. 2012, 3, 73–90. [Google Scholar]
- Sullivan, L. Conservation in Context: Toward a Systems Framing of Decentralized Governance and Public Participation in Wildlife Management. Rev. Policy Res. 2019, 36, 242–261. [Google Scholar] [CrossRef]
- Bednarska-Olejniczak, D.; Olejniczak, J.; Svobodová, L. How a Participatory Budget Can Support Sustainable Rural Development—Lessons From Poland. Sustainability 2020, 12, 2620. [Google Scholar] [CrossRef] [Green Version]
- Rhoads, E. Women’s Political Participation in Indonesia: Decentralisation, Money Politics and Collective Memory in Bali. J. Curr. Southeast Asian Aff. 2012, 31, 35–56. [Google Scholar] [CrossRef] [Green Version]
- Taylor, J.; Murphy, C.; Mayes, S.; Mwilima, E.; Nuulimba, N.; Slater-Jones, S. Land and natural resource mapping by San communities and NGOs: Experiences from Namibia. Particip. Learn. Action 2006, 54, 79–84. [Google Scholar]
- Corbett, J.; Keller, C. Using Community Information Systems to express traditional knowledge embedded in the landscape. Particip. Learn. Action 2006, 54, 21–27. [Google Scholar]
- The inhabitants of Moikarakô; Robert, P.; Faure, J.; Laques, A. The power of maps: Cartography with indigenous people in the Brazilian Amazon. Particip. Learn. Action 2006, 54, 74–78. [Google Scholar]
- Pánek, J. From Mental Maps to GeoParticipation. Cartogr. J. 2016, 53, 300–307. [Google Scholar] [CrossRef]
- McCall, M.; Dunn, C. Geo-information tools for participatory spatial planning: Fulfilling the criteria for ‘good’governance? Geoforum 2012, 43, 81–94. [Google Scholar] [CrossRef]
- Verplanke, J.; McCall, M.; Uberhuaga, C. A Shared Perspective for PGIS and VGI. Cartogr. J. 2016, 53, 308–317. [Google Scholar] [CrossRef] [Green Version]
- McCall, M. Seeking good governance in participatory-GIS: A review of processes and governance dimensions in applying GIS to participatory spatial planning. Habitat Int. 2003, 27, 549–573. [Google Scholar] [CrossRef]
- Jankowski, P.; Czepkiewicz, M.; Młodkowski, M.; Zwoliński, Z.; Wójcicki, M. Evaluating the scalability of public participation in urban land use planning: A comparison of Geoweb methods with face-to-face meetings. Environ. Plan. B Urban Anal. City Sci. 2019, 46, 511–533. [Google Scholar] [CrossRef]
- Kraak, M. The role of the map in a Web-GIS environment. J. Geogr. Syst. 2004, 6, 83–93. [Google Scholar] [CrossRef]
Figure 1.
A conceptual framework to assess how village maps produced during participatory mapping activities can strengthen Musrenbang practice.
Figure 1.
A conceptual framework to assess how village maps produced during participatory mapping activities can strengthen Musrenbang practice.

Figure 2.
The participatory village map-making process, from a sketch map, created during digital or non-digital participatory mapping workshops, to a (georeferenced) village map.
Figure 2.
The participatory village map-making process, from a sketch map, created during digital or non-digital participatory mapping workshops, to a (georeferenced) village map.

Figure 3.
The helpfulness of village maps to the respondents for knowing more about their villages.

Figure 4.
The village map was used at the Musrenbang: (a) Denai Lama, (b) Kramat Gajah, and (c) Kolam (source: first author).
Figure 4.
The village map was used at the Musrenbang: (a) Denai Lama, (b) Kramat Gajah, and (c) Kolam (source: first author).

Figure 5.
The availability of data to support the Musrenbang process.

Figure 6.
The importance of having data to support the Musrenbang.

Figure 7.
The effective use of available data during the Musrenbang.

Figure 8.
The use of village maps to support the deliberative process in the Musrenbang.

Figure 9.
Domination of the Musrenbang deliberations by certain participants.

Figure 10.
Participants’ satisfaction with the Musrenbang process.


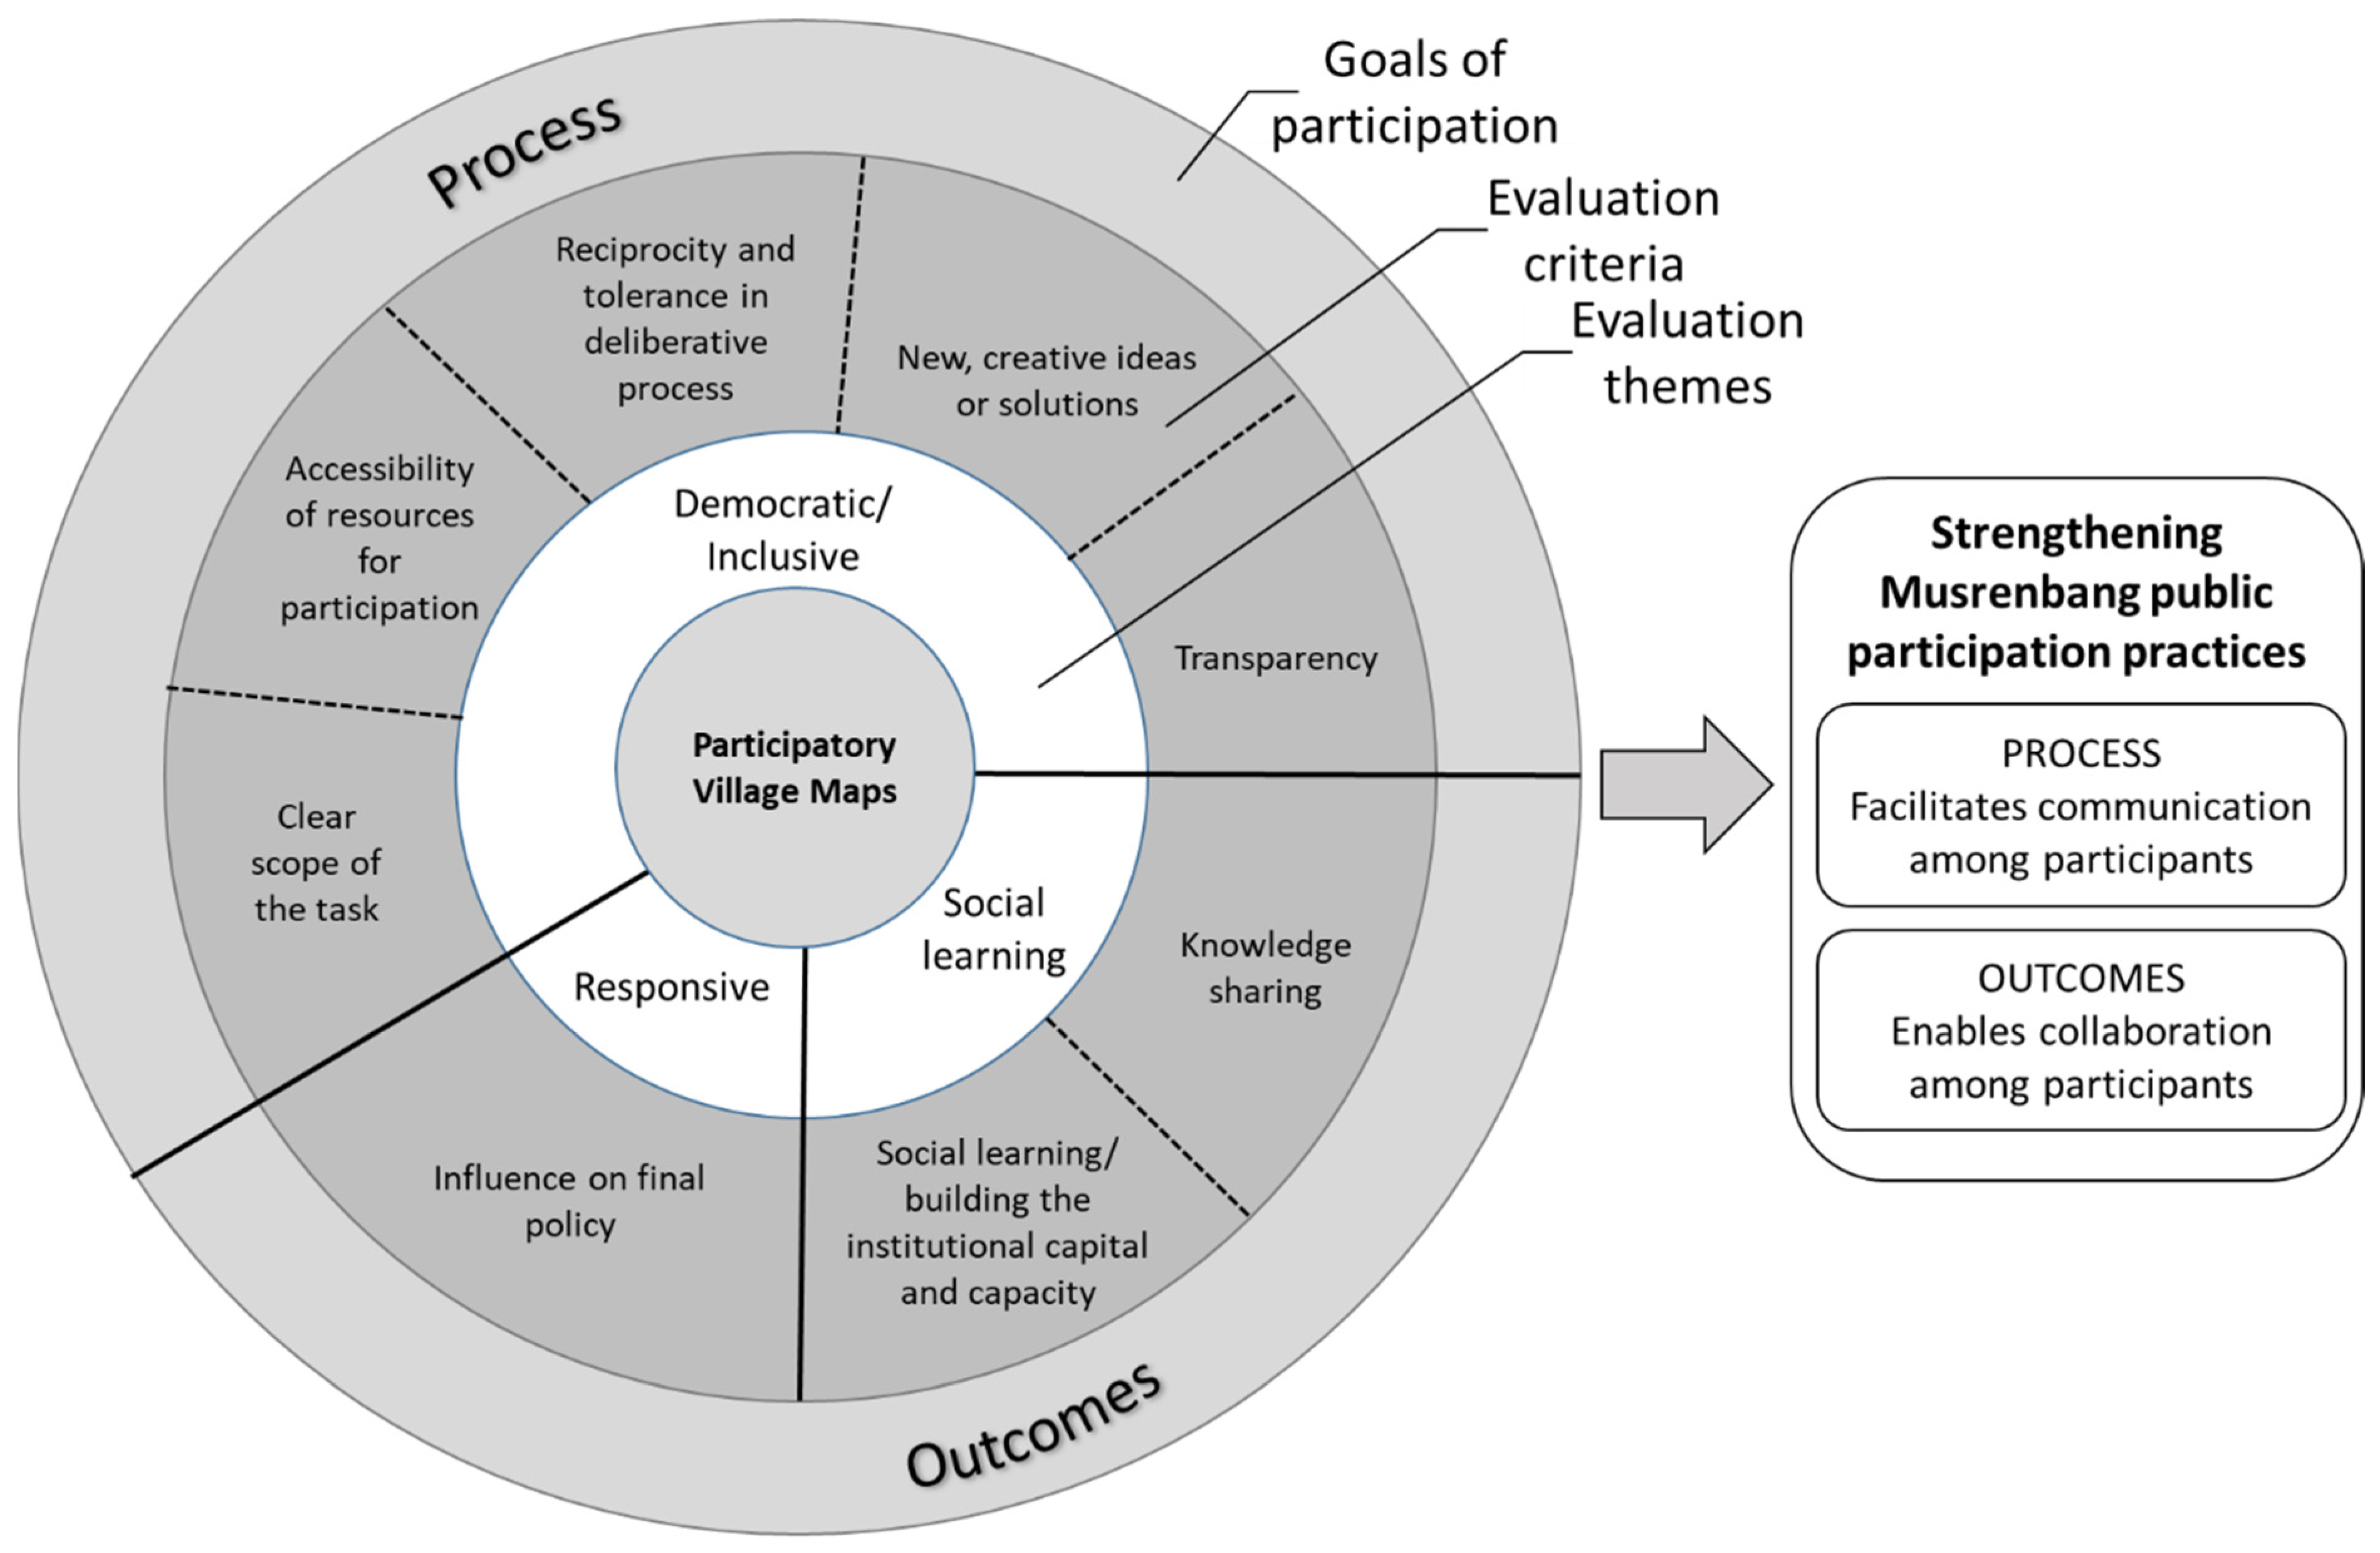
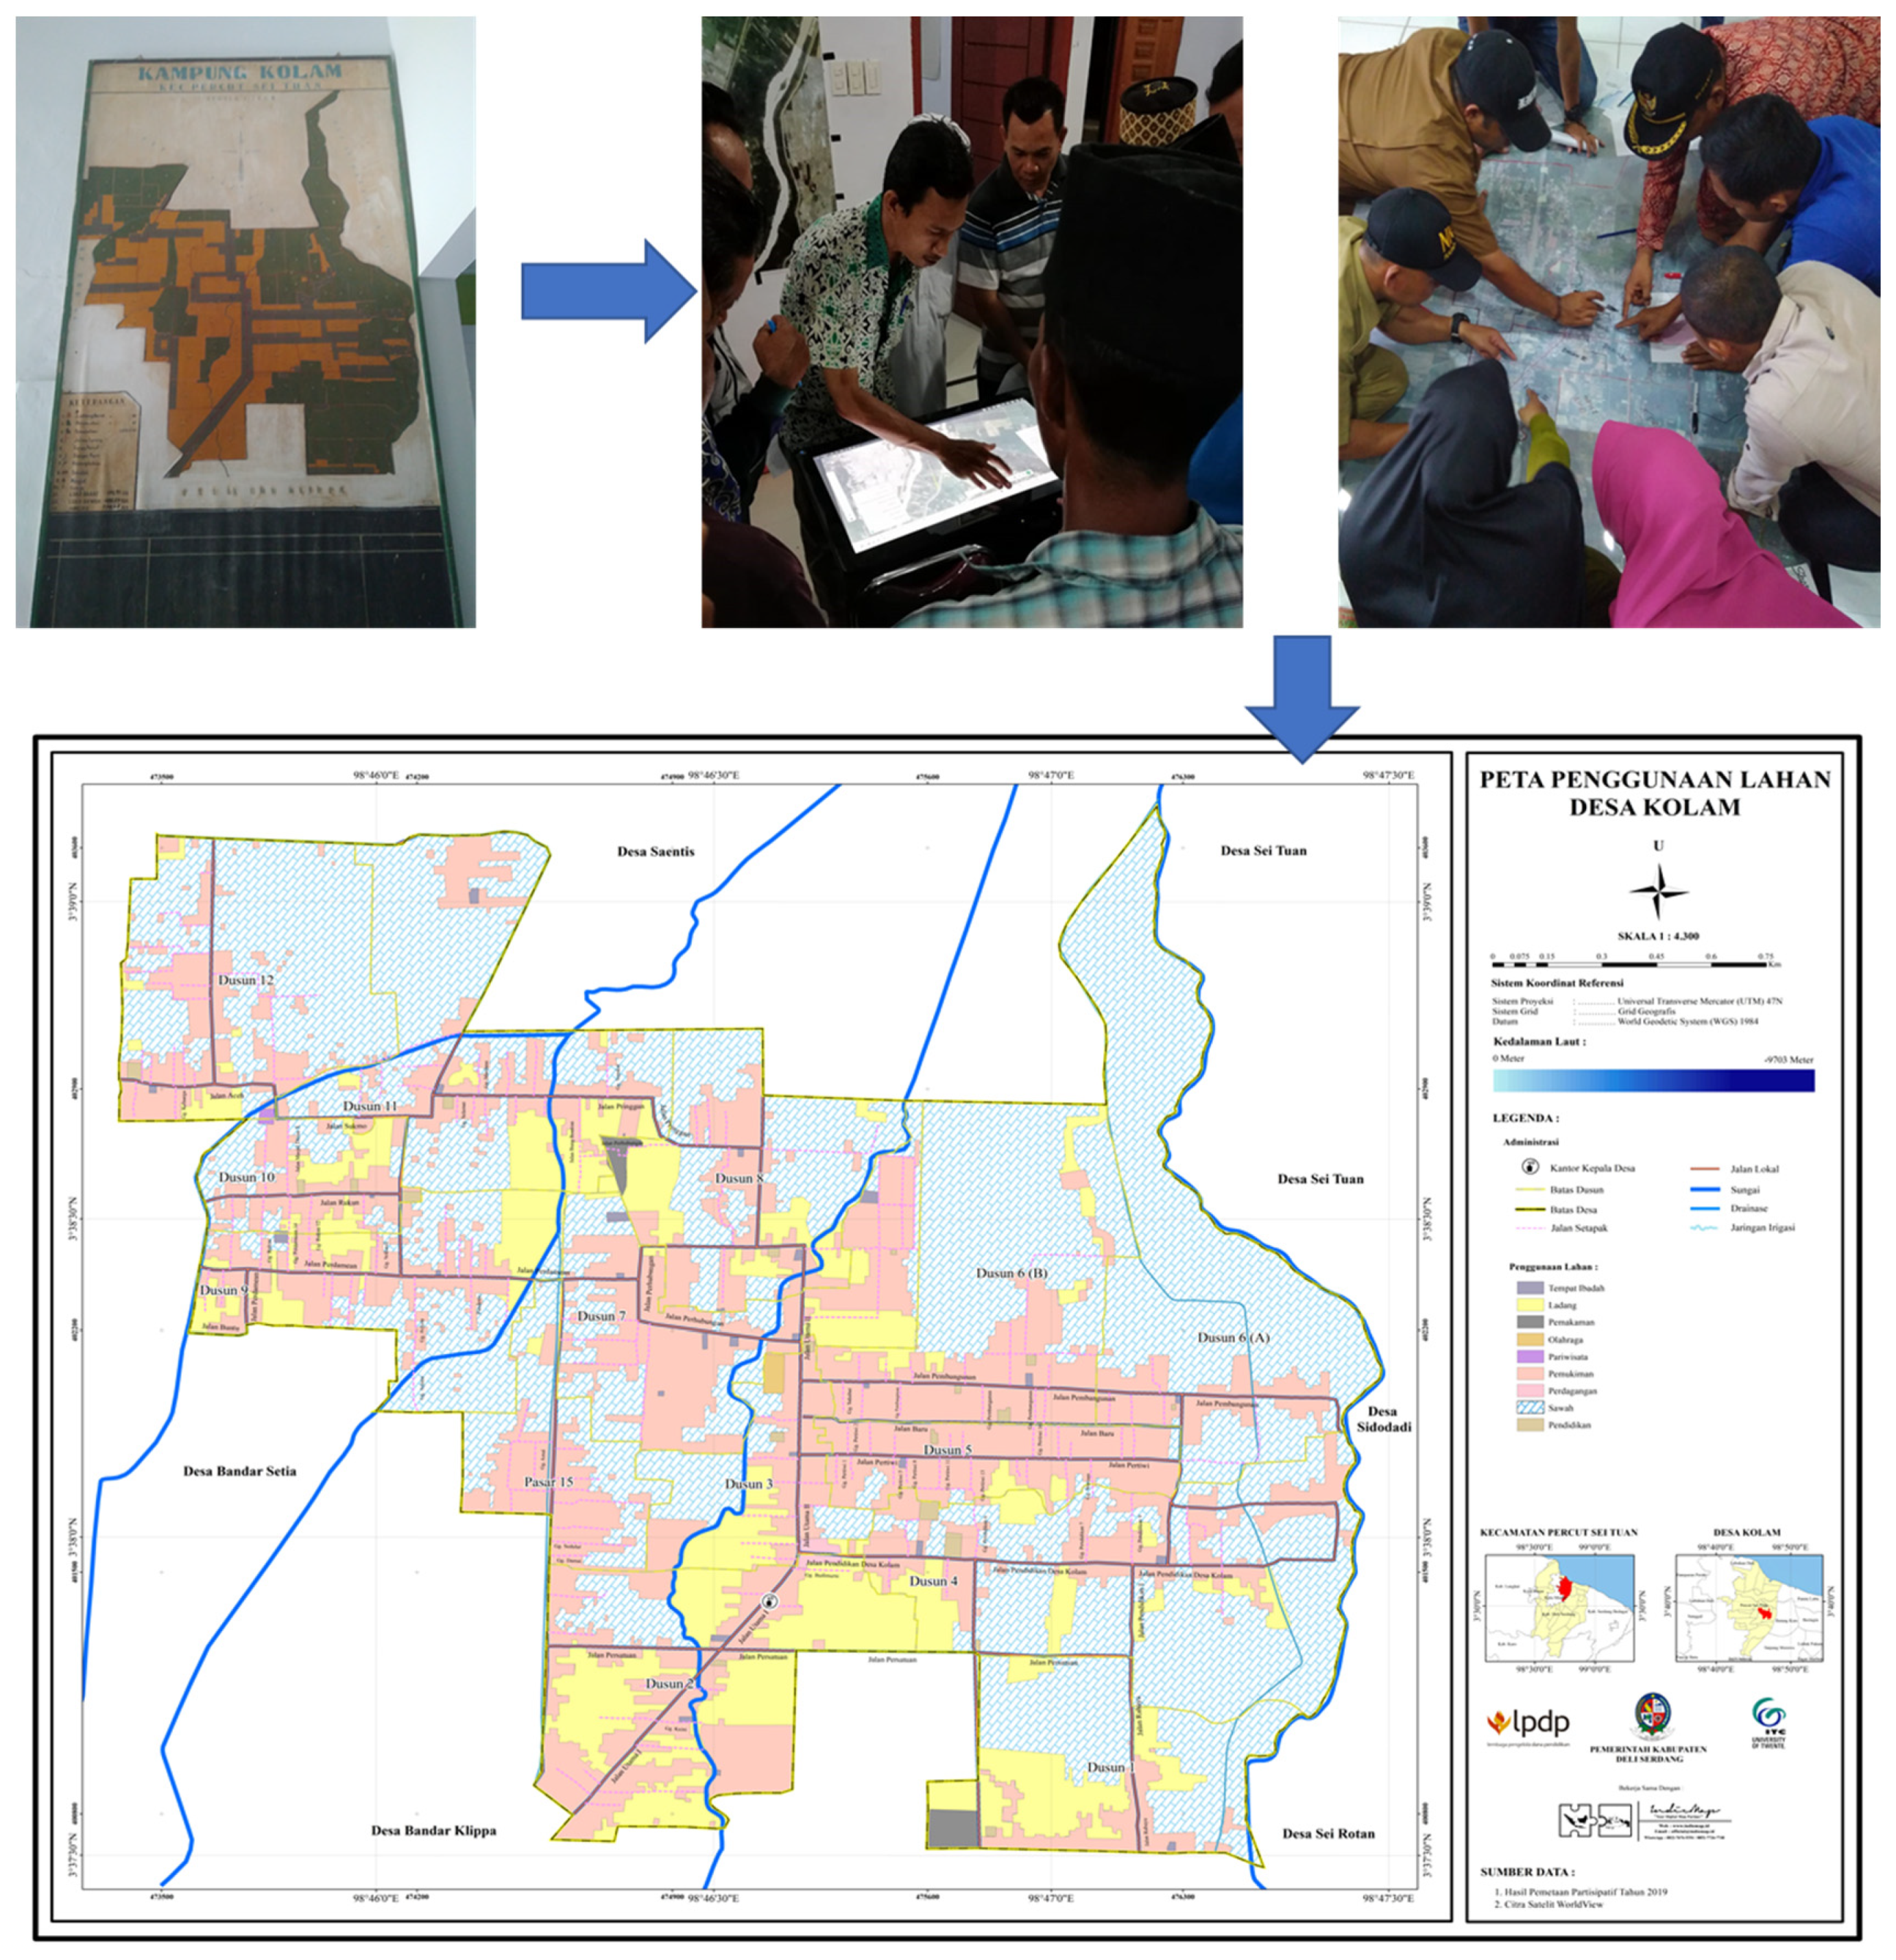
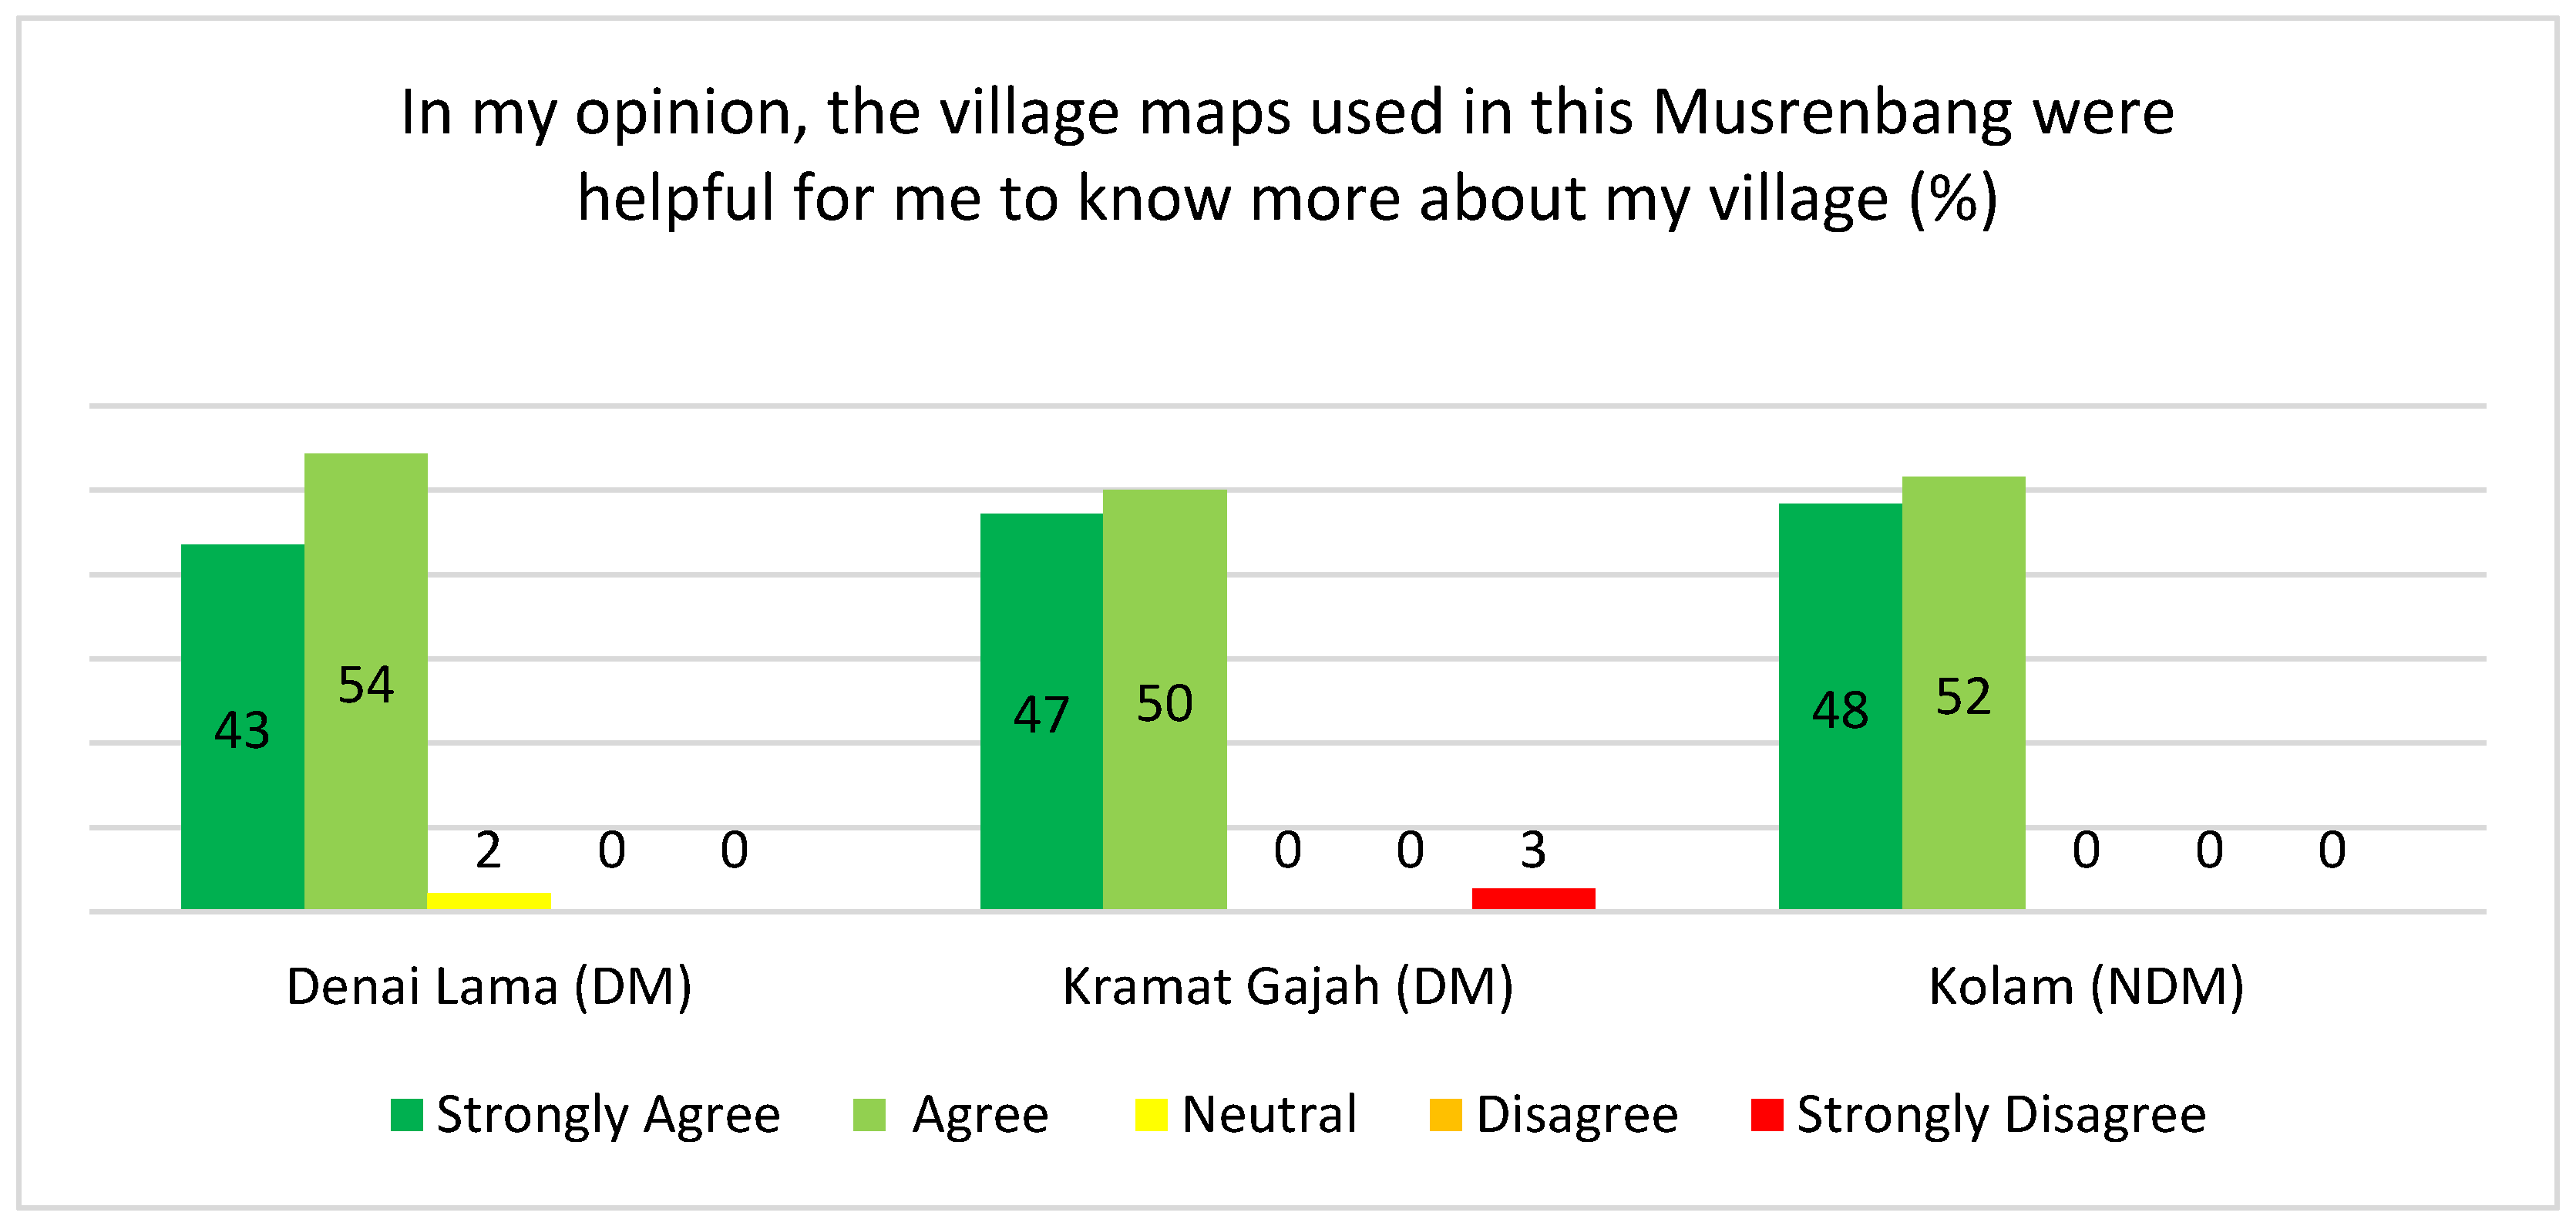
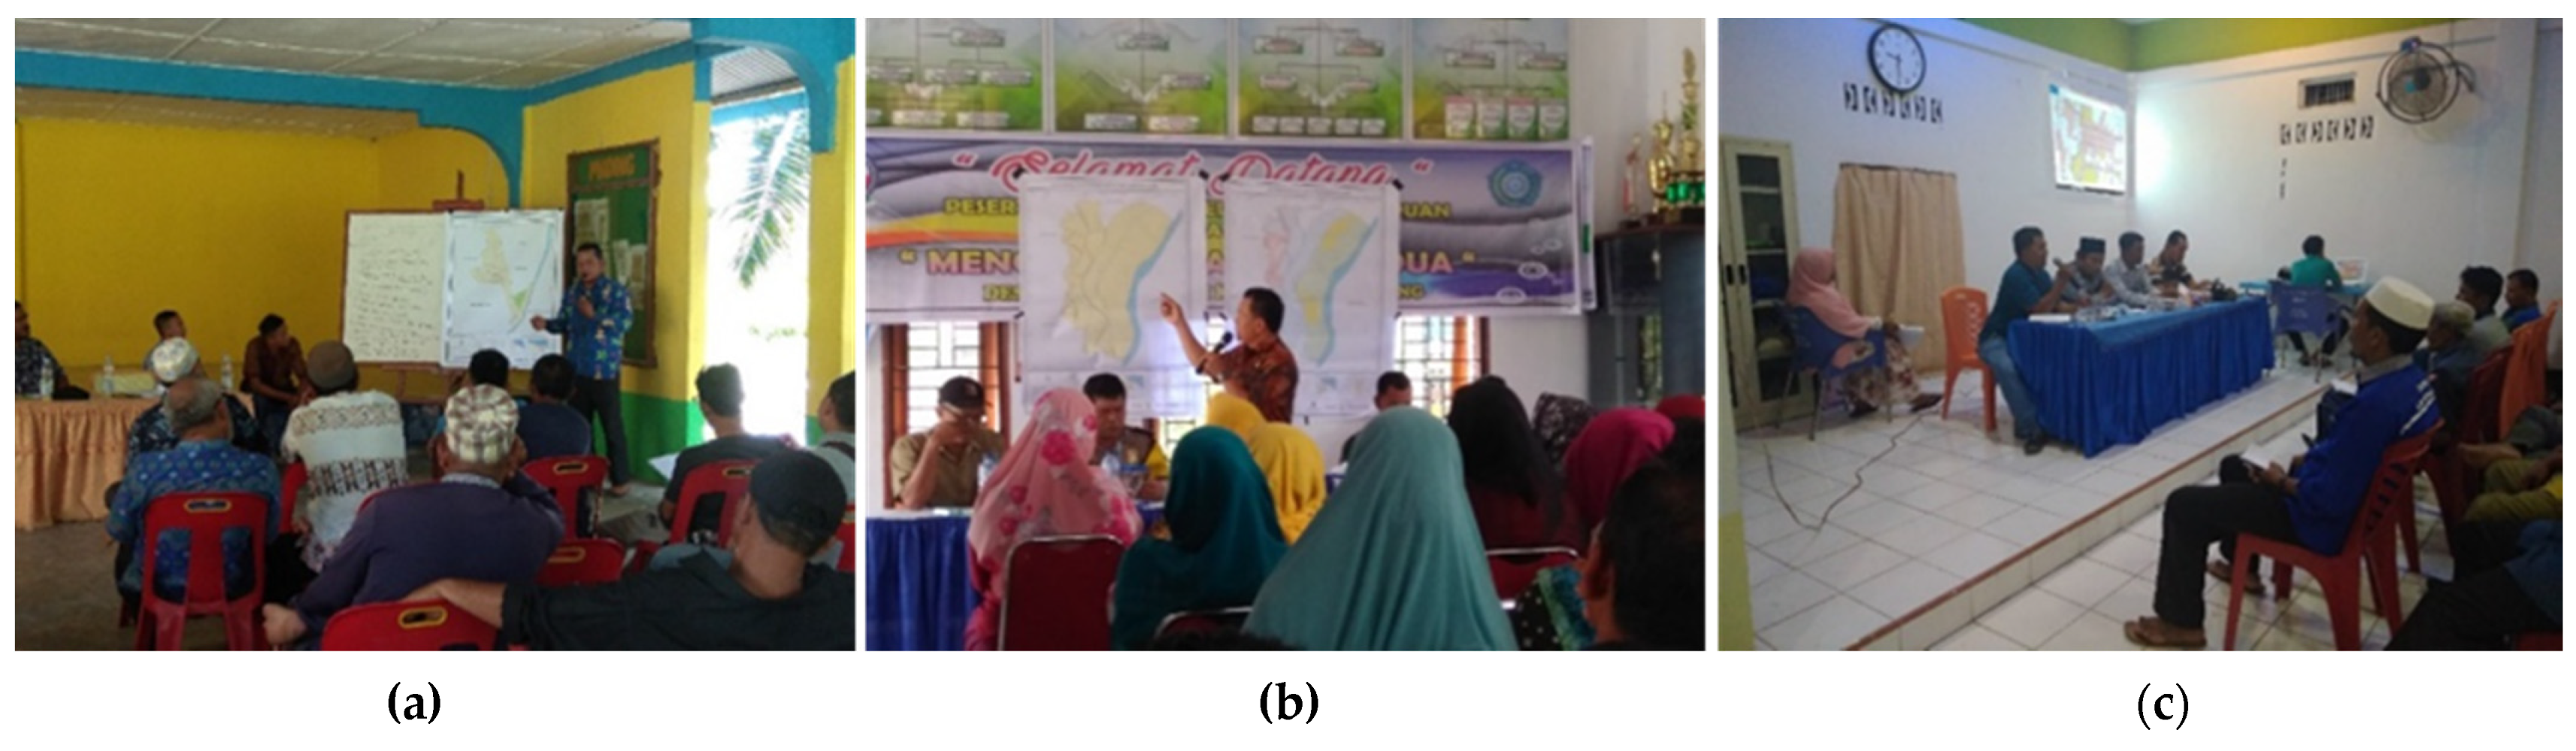
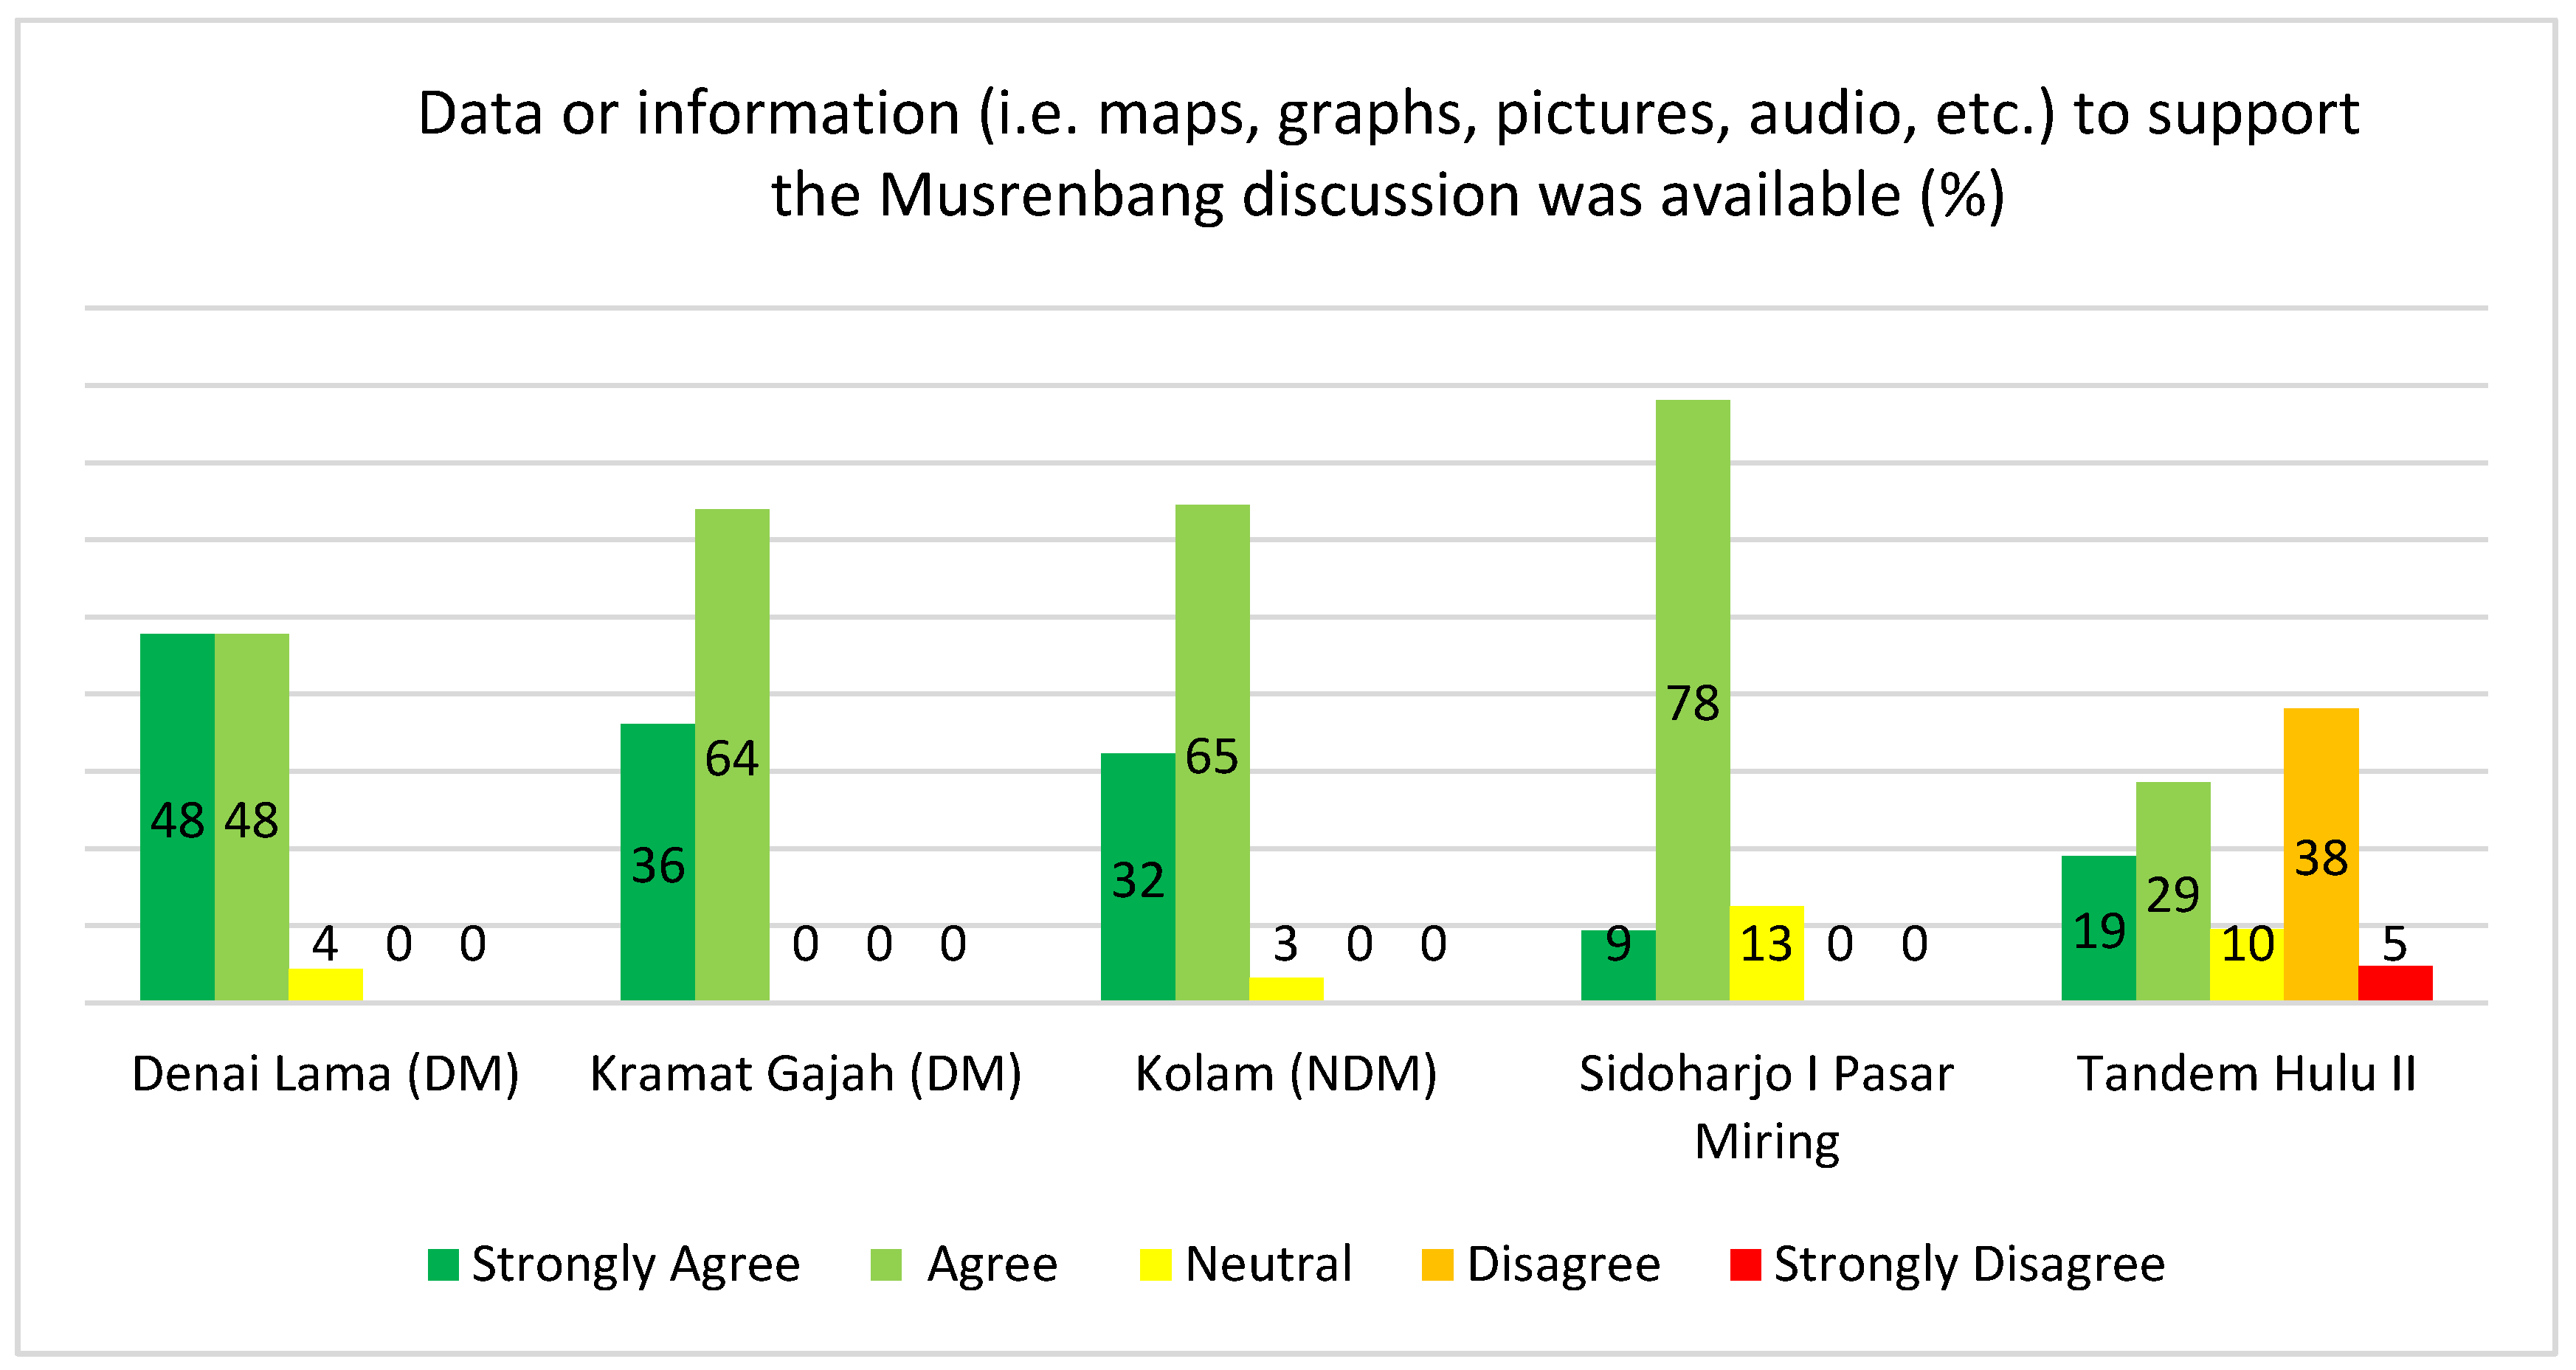
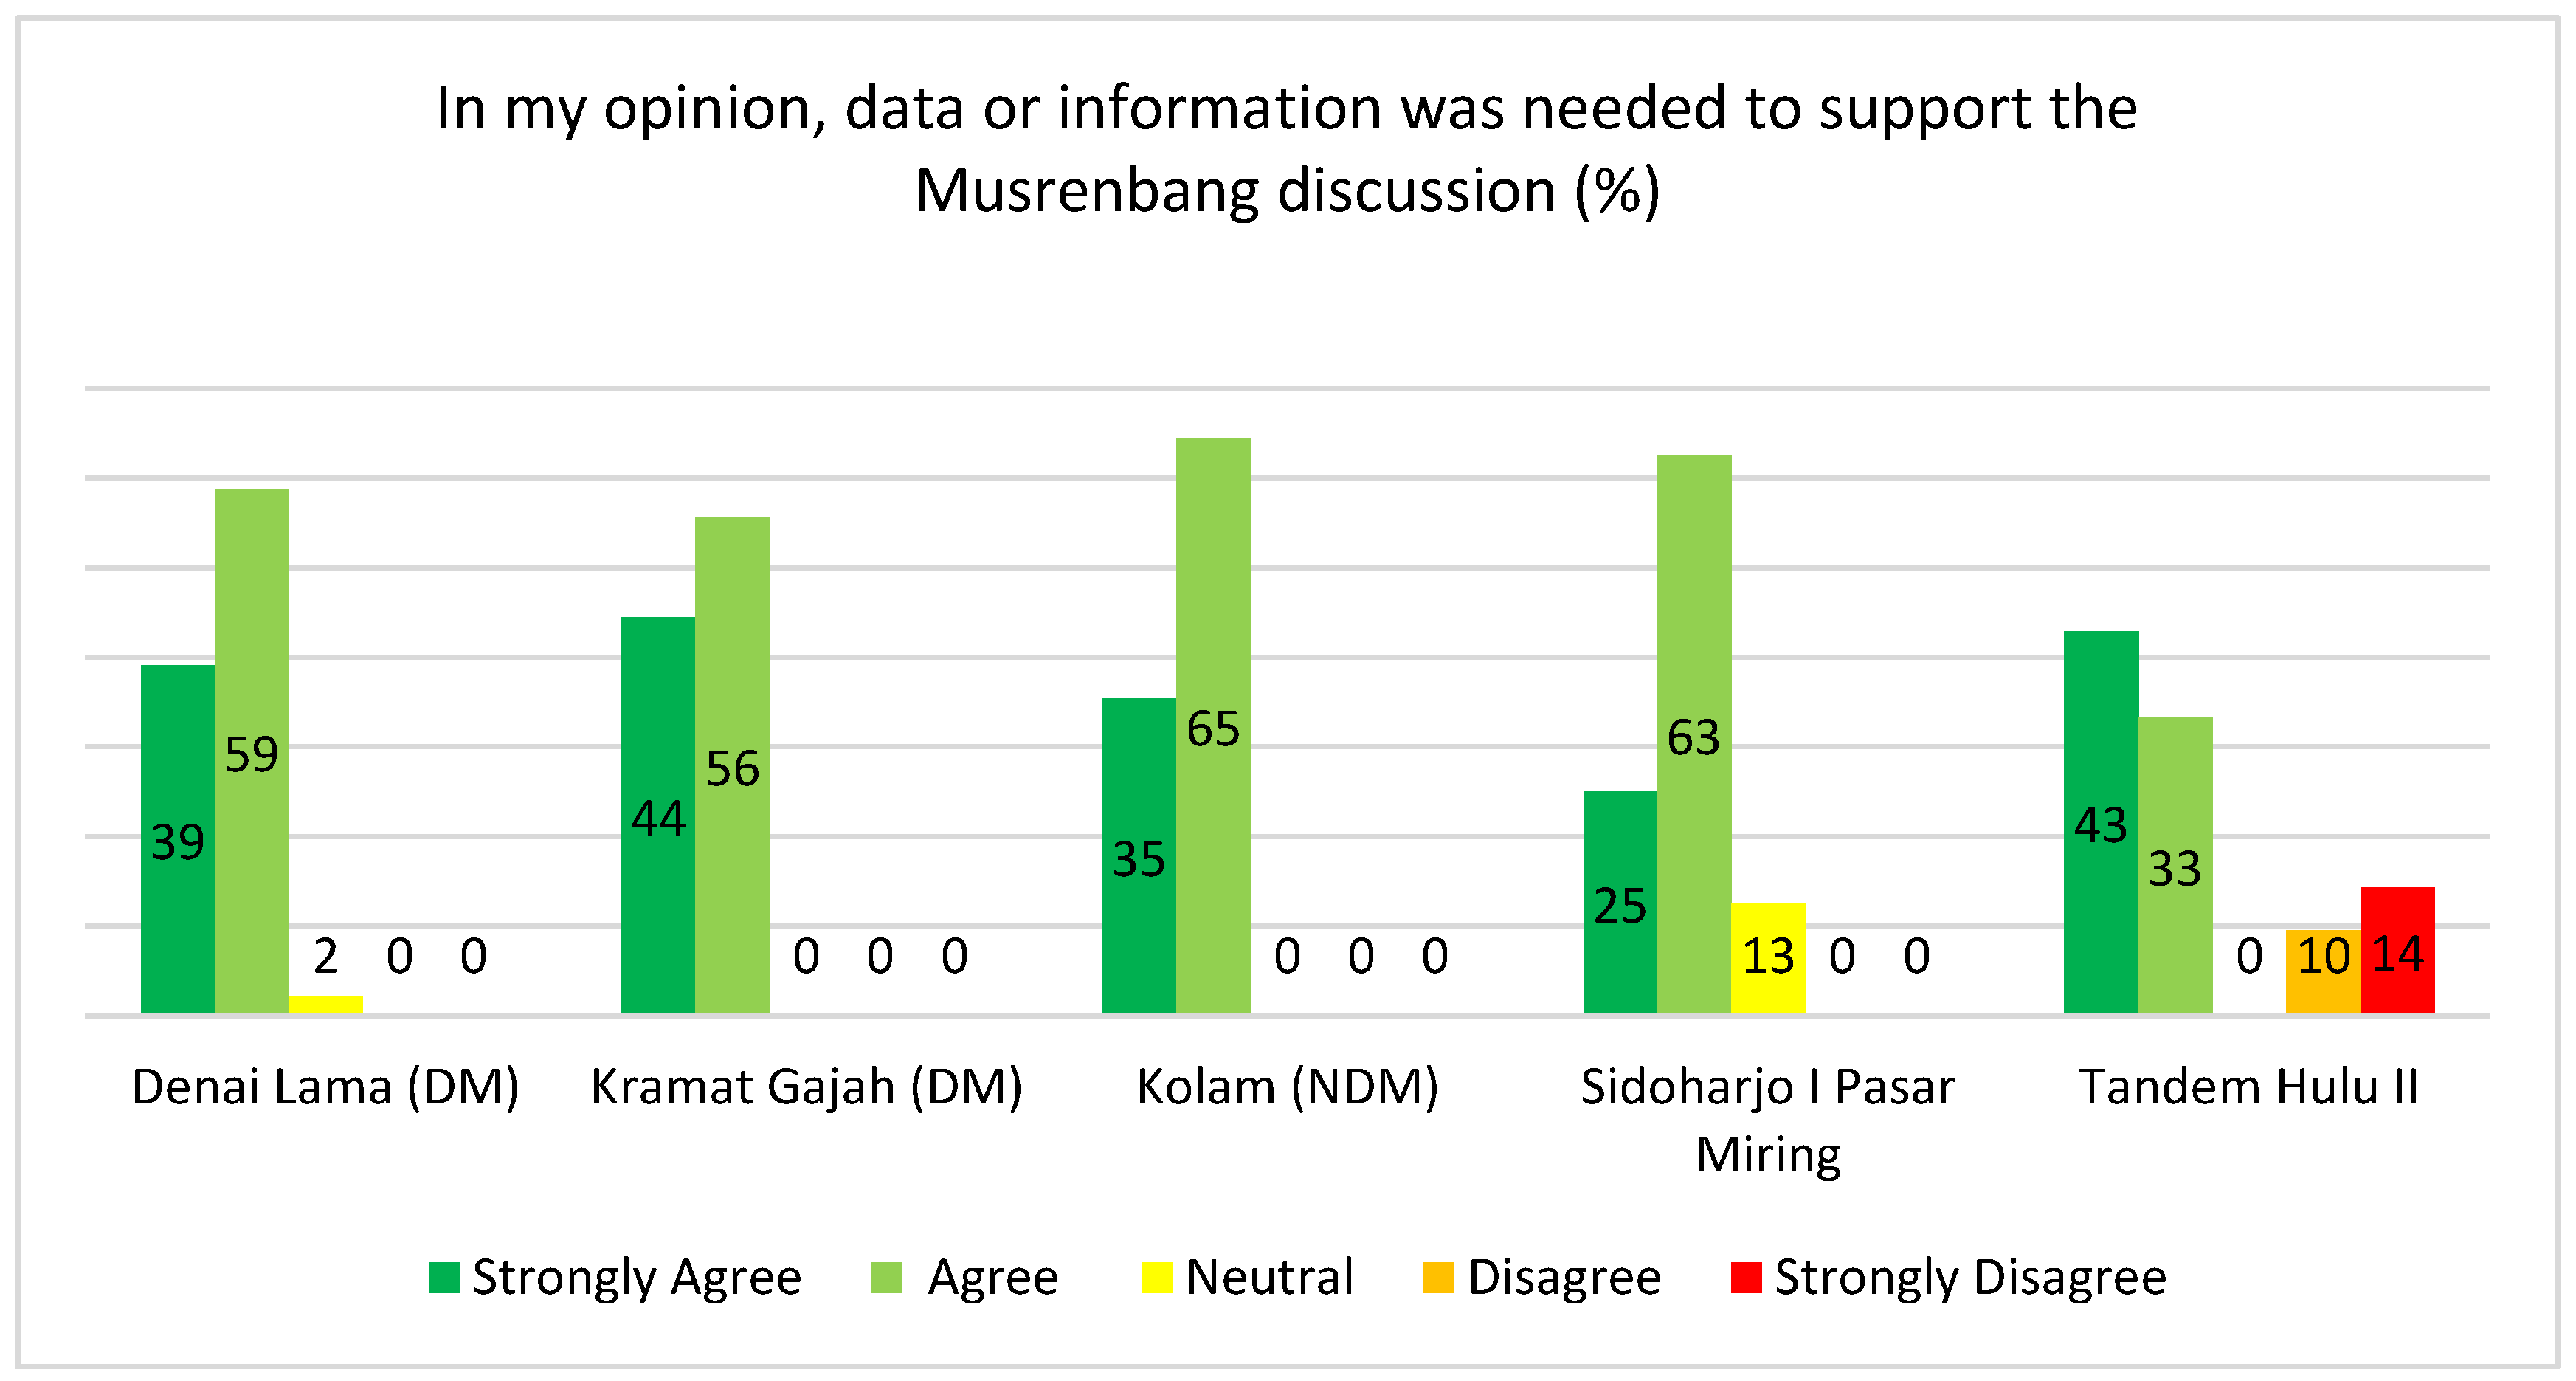
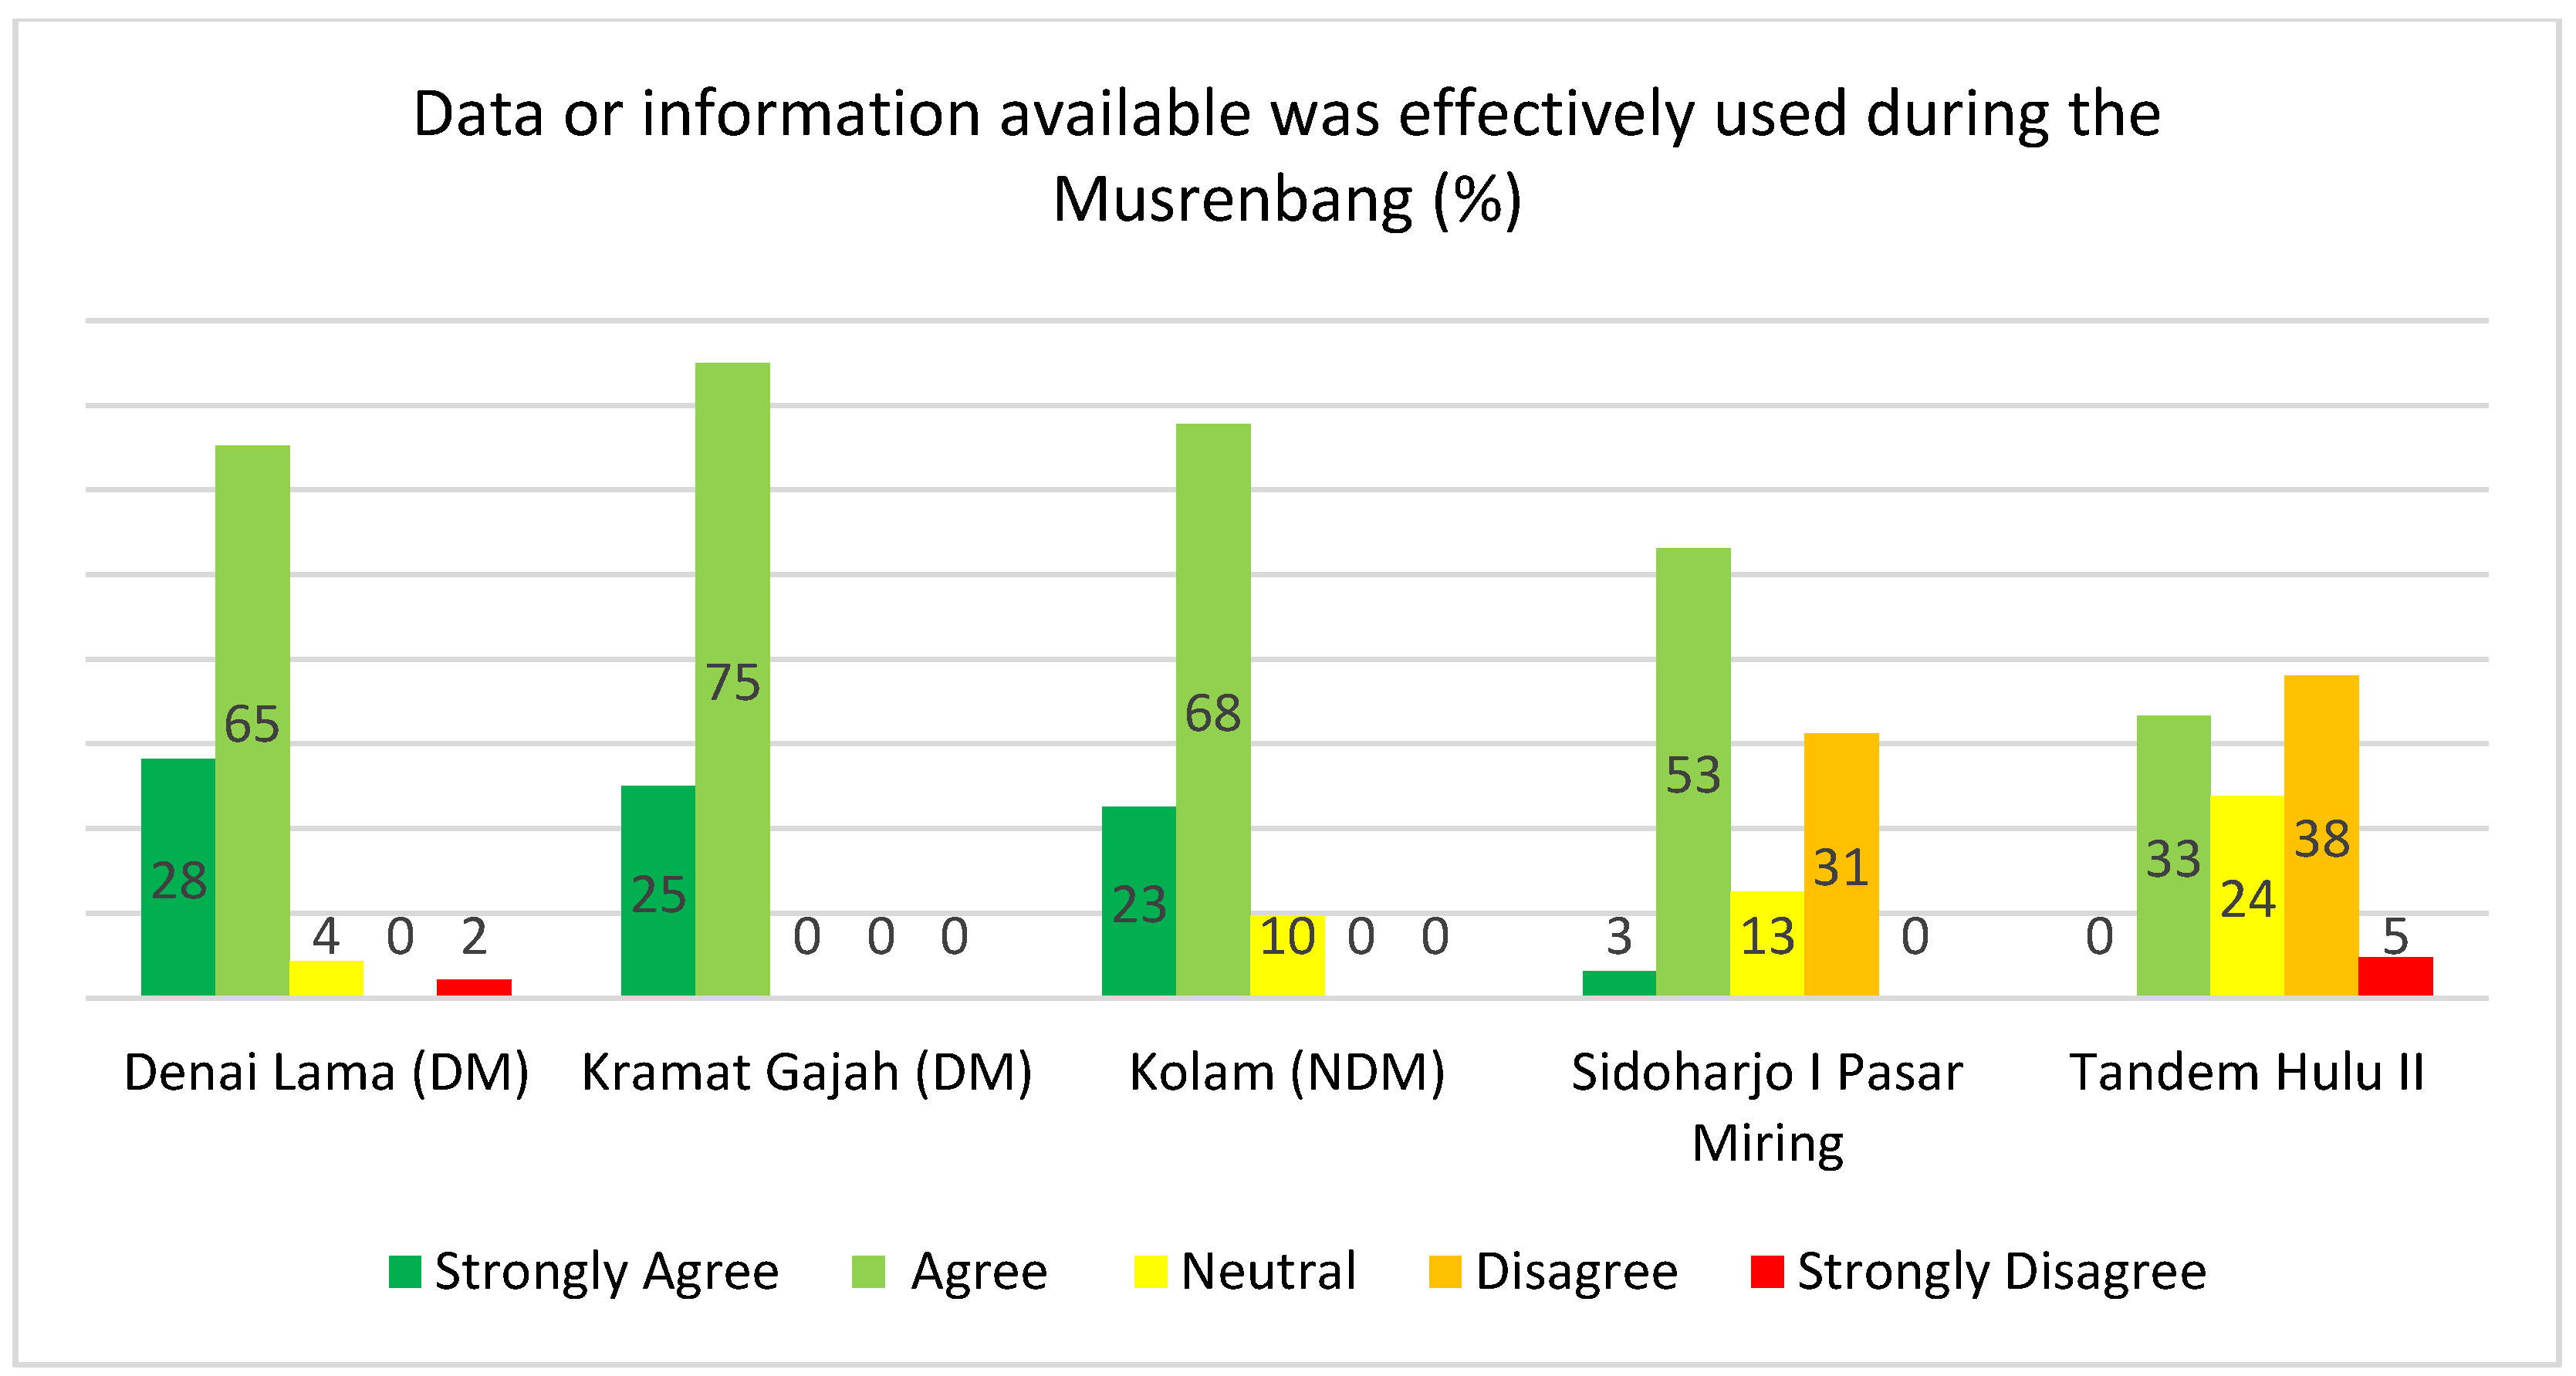
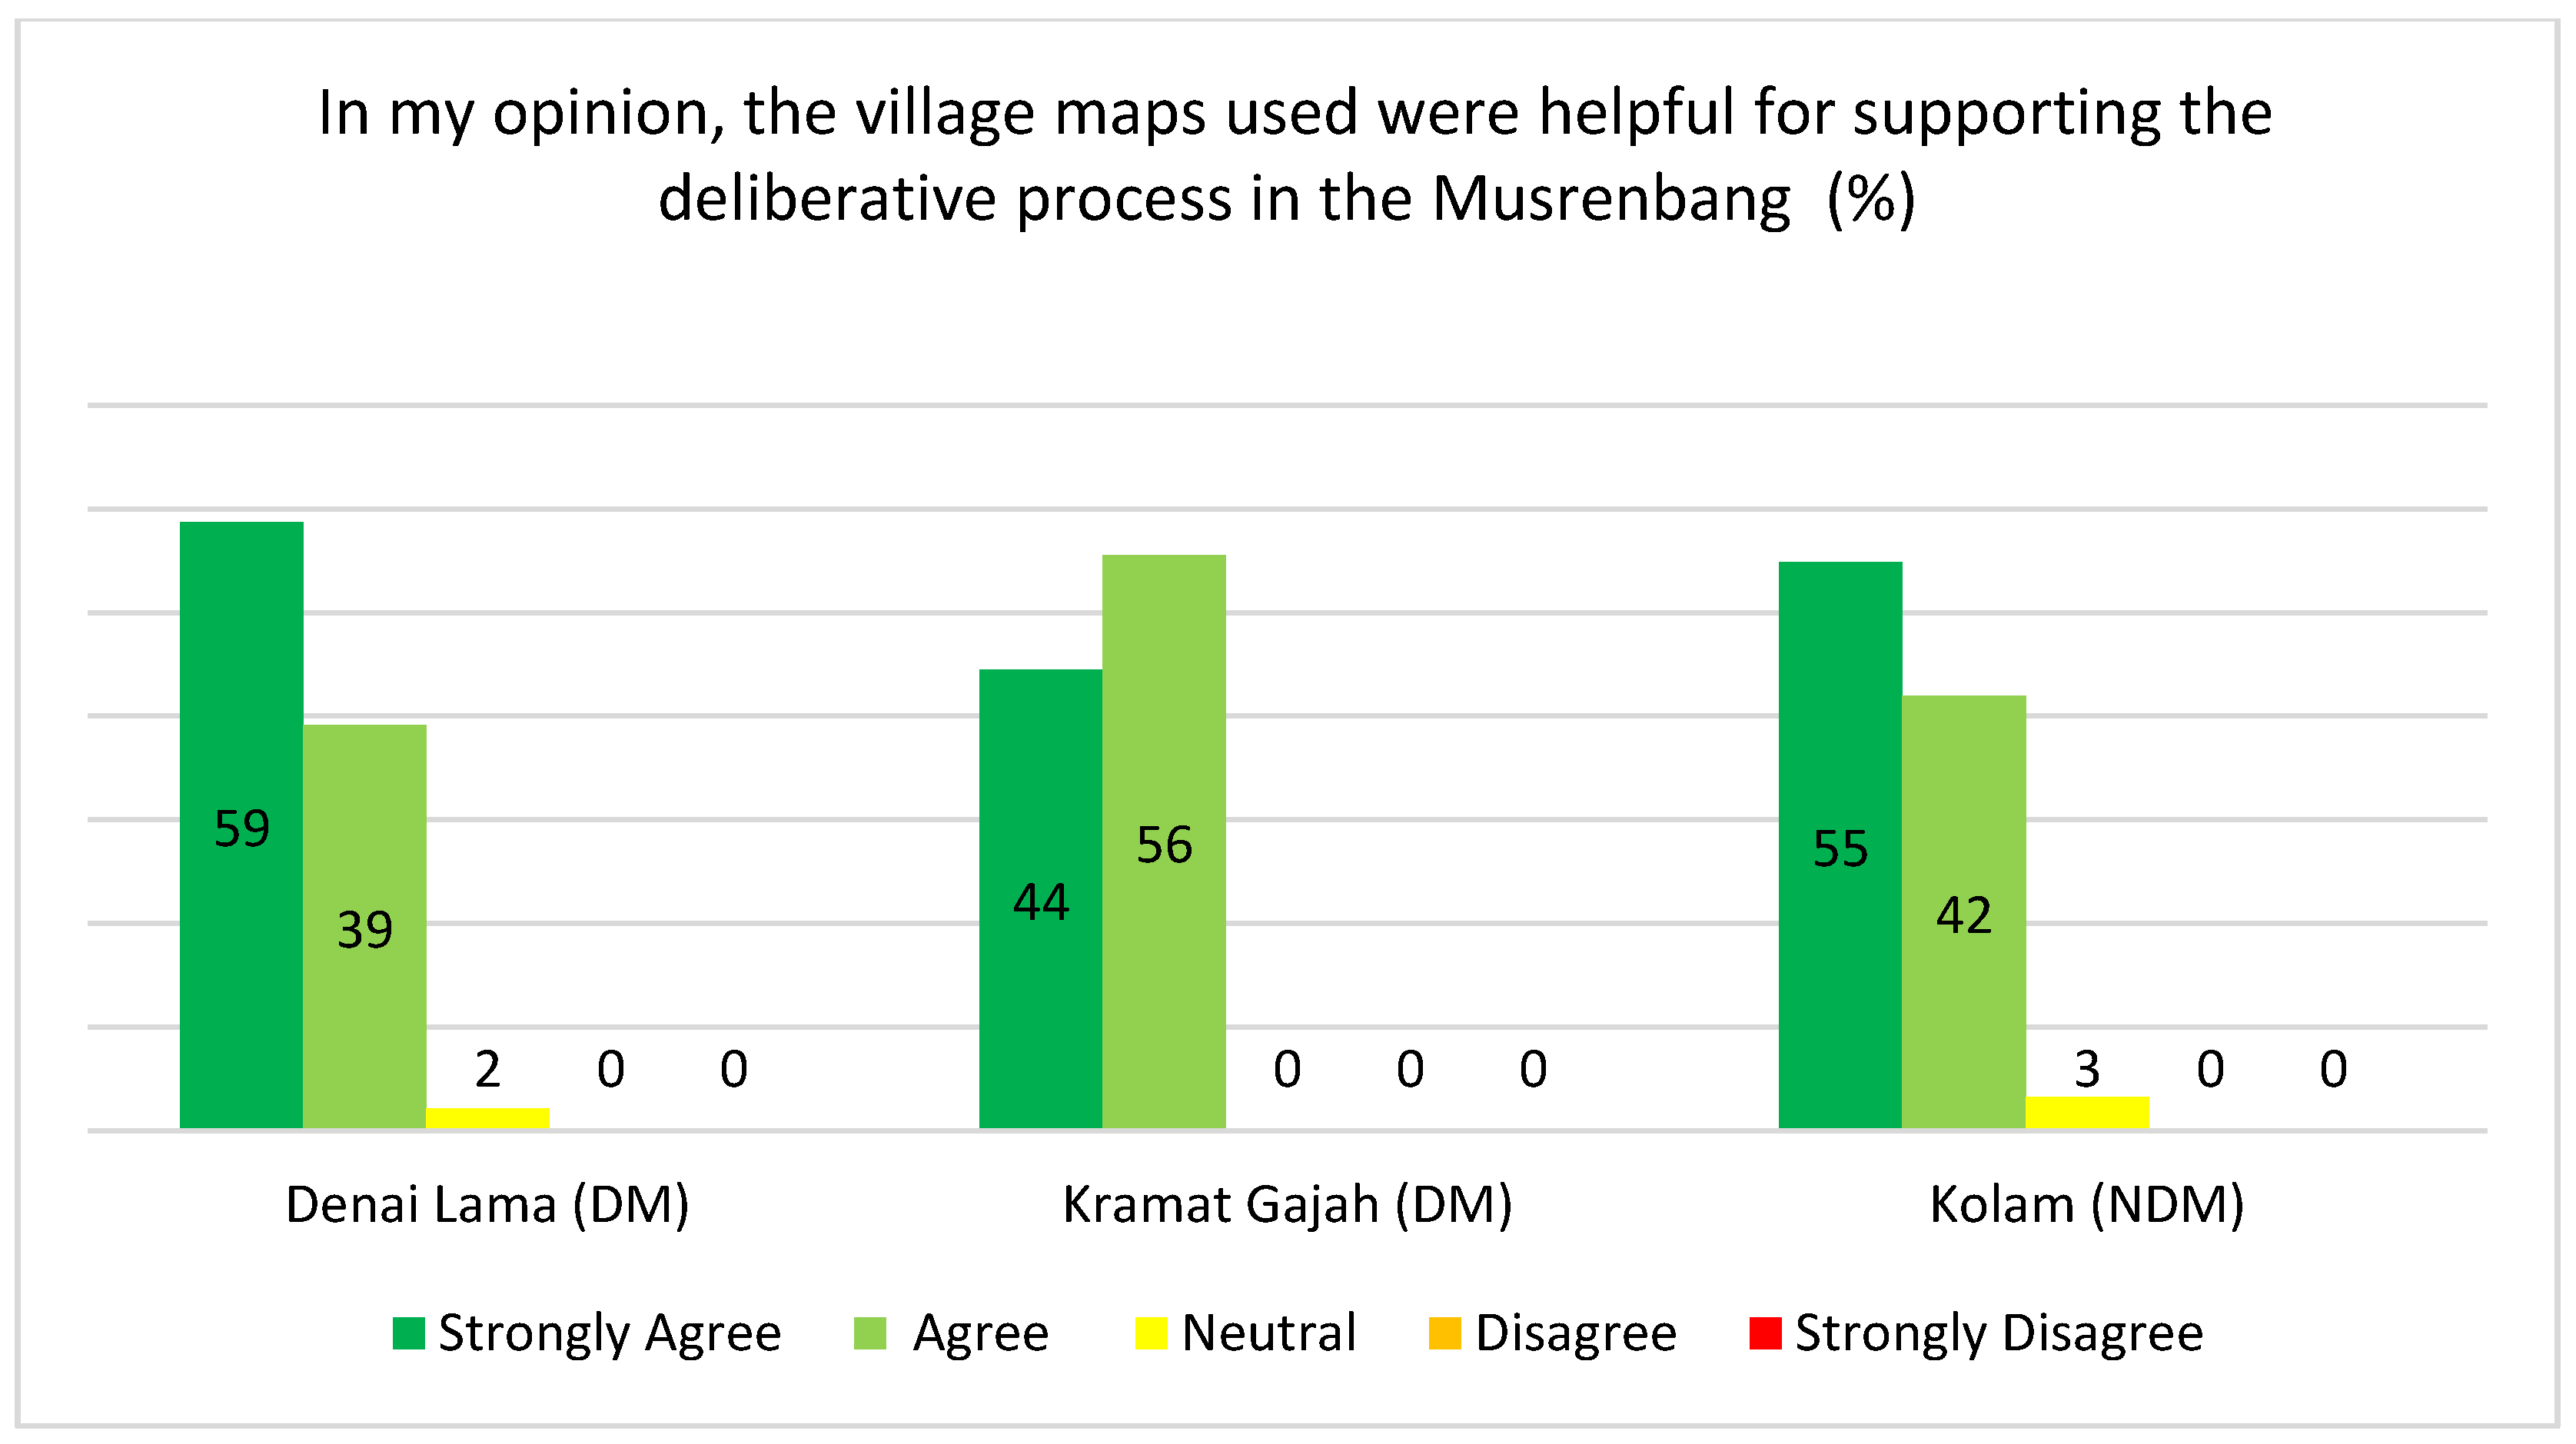
Table 1.
Information about participatory mapping workshop participants, Musrenbang participants, and interviewees.
Table 1.
Information about participatory mapping workshop participants, Musrenbang participants, and interviewees.
| Village and Musrenbang 2020 Attendance (Male/Female) | Population and Density/km2 (2019) * | Area (km2) * | Type of Intervention | Participants of Village Mapping Workshops (2019) | Musrenbang Participants Interviewed (2020) | ||
|---|---|---|---|---|---|---|---|
| Number of Males | Number of Females | Number of Musrenbang Participants Interviewed | Number of Interviewees Who Participated in the Mapping Workshops | ||||
| Denai Lama (29/17) | 2927 (1096) | 2.67 | Digital mapping | 16 | - | 15 | 9 |
| Kramat Gajah (17/19) | 2237 (1491) | 1.50 | Digital mapping | 10 | - | 18 | 8 |
| Kolam (28/3) | 17,418 (2913) | 5.98 | Non-digital mapping | 15 | 15 | 16 | 15 |
| Sidoharjo I Pasar Miring (23/9) | 5614 (1315) | 4.19 | No intervention | - | - | 11 | - |
| Tandem Hulu II (15/6) | 9298 (2183) | 4.26 | No intervention | - | - | 9 | - |
* Source: Statistics of Indonesia (2020).
Publisher’s Note: MDPI stays neutral with regard to jurisdictional claims in published maps and institutional affiliations. |
© 2021 by the authors. Licensee MDPI, Basel, Switzerland. This article is an open access article distributed under the terms and conditions of the Creative Commons Attribution (CC BY) license (https://creativecommons.org/licenses/by/4.0/).
Share and Cite
MDPI and ACS Style
Akbar, A.; Flacke, J.; Martinez, J.; van Maarseveen, M.F.A.M. The Role of Participatory Village Maps in Strengthening Public Participation Practice. ISPRS Int. J. Geo-Inf. 2021, 10, 512. https://doi.org/10.3390/ijgi10080512
AMA Style
Akbar A, Flacke J, Martinez J, van Maarseveen MFAM. The Role of Participatory Village Maps in Strengthening Public Participation Practice. ISPRS International Journal of Geo-Information. 2021; 10(8):512. https://doi.org/10.3390/ijgi10080512
Chicago/Turabian StyleAkbar, Aulia, Johannes Flacke, Javier Martinez, and Martin F. A. M. van Maarseveen. 2021. "The Role of Participatory Village Maps in Strengthening Public Participation Practice" ISPRS International Journal of Geo-Information 10, no. 8: 512. https://doi.org/10.3390/ijgi10080512
Note that from the first issue of 2016, this journal uses article numbers instead of page numbers. See further details here.