
IoT Botnet Detection Using Salp Swarm and Ant Lion Hybrid Optimization Model


1
King Abdullah II School of Information Technology, The University of Jordan, Amman 11942, Jordan
2
Security Engineering Lab, Computer Science Department, Prince Sultan University, Riyadh 11586, Saudi Arabia
*
Author to whom correspondence should be addressed.
Symmetry 2021, 13(8), 1377; https://doi.org/10.3390/sym13081377
Submission received: 7 July 2021
/
Revised: 23 July 2021
/
Accepted: 23 July 2021
/
Published: 28 July 2021
(This article belongs to the Topic Applied Metaheuristic Computing)
Abstract
:In the last decade, the devices and appliances utilizing the Internet of Things (IoT) have expanded tremendously, which has led to revolutionary developments in the network industry. Smart homes and cities, wearable devices, traffic monitoring, health systems, and energy savings are typical IoT applications. The diversity in IoT standards, protocols, and computational resources makes them vulnerable to security attackers. Botnets are challenging security threats in IoT devices that cause severe Distributed Denial of Service (DDoS) attacks. Intrusion detection systems (IDS) are necessary for safeguarding Internet-connected frameworks and enhancing insufficient traditional security countermeasures, including authentication and encryption techniques. This paper proposes a wrapper feature selection model (SSA–ALO) by hybridizing the salp swarm algorithm (SSA) and ant lion optimization (ALO). The new model can be integrated with IDS components to handle the high-dimensional space problem and detect IoT attacks with superior efficiency. The experiments were performed using the N-BaIoT benchmark dataset, which was downloaded from the UCI repository. This dataset consists of nine datasets that represent real IoT traffic. The experimental results reveal the outperformance of SSA–ALO compared to existing related approaches using the following evaluation measures: TPR (true positive rate), FPR (false positive rate), G-mean, processing time, and convergence curves. Therefore, the proposed SSA–ALO model can serve IoT applications by detecting intrusions with high true positive rates that reach 99.9% and with a minimal delay even in imbalanced intrusion families.
1. Introduction
A set of connected devices that use a wireless connection to communicate, sense, compute, process, share, and store information over the Internet defines the new technology trend Internet of Things (IoT). IoT is a set of connected devices, including electronic, physical objects, and embedded objects, that communicate through the Internet without human intervention (machine-to-machine). Recently, there has been a massive proliferation in the number of connected devices in IoT. The expected number of connected objects in 2021 is 13.8 billion, and it is expected to jump to 30.9 billion by 2025 (https://www.statista.com/statistics/1101442/iot-number-of-connected-devices-worldwide/ (accessed on 8 March 2021)). IoT applications are strongly connected to humans’ daily lives, including the areas of health, agriculture, fleet management, hospitality, and many others.
IoT is characterized by low computational memory, battery, streaming bandwidth, and processing unit. Due to these characteristics, IoT becomes more susceptible to security breaches. The plug-and-play facility of IoT devices and the original passwords from their manufacturers make them more attractive to brute-force and botnet attacks. Other issues that increase the vulnerability of IoT to software and hardware security threats are the heterogeneity and scalability with other interconnected networks.
IoT devices attacked by malicious software are compromised by a botnet. This botnet is created by brute-forcing techniques or weak credential exploitation to compromise the victim device [1]. Once the device is compromised, the attacker gains control by downloading malicious binaries to enrol into the IoT botnet [2,3].
In general, three main layers encompass IoT: perception, transportation, and the application layers. Each layer applies different standards, making it easier to be attacked by different security breaches. Specifically, the transportation layer includes several technologies for communication, so it can be attacked by denial-of-service (DoS) or distributed denial-of-service (DDoS) attacks. Five years ago, a remarkable DDoS attack occurred involving the Dyn (https://www.kaspersky.com/blog/attack-on-dyn-explained/13325/ (accessed on 26 October 2016)) domain name service provider. This attack launched the Mirai botnet to flood the servers, disrupt many functionalities, and stop the services of many websites, including Twitter, CNN, PayPal, and Netflix. Intrusions threaten mainly the system’s confidentiality, integrity, availability, and authenticity. Traditional security countermeasures, including authentication protocols and encryption techniques, might not be sufficient to provide acceptable security levels for the highly scalable and interconnected IoT. Many emergent protection technologies work against these intrusions, such as blockchain, fog, and cloud computing technology. However, these technologies still have shortcomings related to time latency and scalability issues [4]. Intrusion detection systems (IDSs) are essential and crucial for IoT. In this solution, hardware and software are used to monitor the network and discover malicious behaviors. Typically, there are different types of IDSs, which could be based on statistics, machine learning, or others [5,6,7,8,9,10,11].
IDSs consist of three primary components: the sensing component to gather the information from the environment and the analysis and reporting components. In the analysis components, different intelligent data mining techniques help to process the massive volume of monitored data and capture the abnormal and malicious patterns. Therefore, the analysis component is the smart component in IDS that deploys smart and lightweight security models to protect the network.
IoT involves many connected devices with a high amount of collected high-dimensional data. Such colossal data need data mining techniques to process them, including feature selection (FS) [12].
FS is a data mining technique used to distinguish irrelevant and symmetrical features that may reduce the classifier’s performance. FS contributes to reducing the dimensionality, enhancing the classification performance, and even reducing the training time. Using traditional search techniques, such as exhaustive search, yields exponential running time. Thus, if a dataset has N features, the size of the entire feature space is . This is practically impossible, especially with a medium and large number of features. Different search methods have been investigated in recent years, but most of them have suffered from the local minima. Recently, metaheuristic algorithms have been applied widely and efficiently for the optimization of the FS problem and have achieved promising results [13].
This work proposes a hybrid model using a salp swarm algorithm (SSA) and ant lion optimization (ALO). The new model is called SSA–ALO, which integrates the power points of both algorithms into one method. The hybridization exploits the ability to search globally (exploration) of the ALO and the ability to search locally by the SSA, consequently achieving a balance between global search and local search of feature space and increasing the opportunity to reach the optimal solution (best asymmetrical features subset) and alleviate the local minima problem. The SSA algorithm has one parameter that adaptively decreases across the iterations of the optimization process. Thus, the algorithm explores several regions at the beginning of the optimization process and focuses on promising regions later on. As a bonus, follower salps update their positions gradually according to other salps in the swarm, which prevents the optimizer from falling into local minima. The SSA maintains the best-found individual so that it is reserved even if agents become weakened. In the SSA, the leader salp moves based on the position of the food source only, which is the best salp found so far, so the leader always is capable of searching globally and locally around the food source in the search space.
ALO has two types of individuals: ants and ant lions. Ant lions are the best solutions found so far. Their positions are replaced whenever a fitter ant is found. Ants are moving around in the search space continuously. The positions of ants are changed based on the positions of ant lions. The position update strategy of ants is based on selecting an ant lion using a roulette wheel in combination with the best solution. Thus, a given ant updates its position based on these two agents. The selection of an agent randomly using a roulette wheel encourages diversification in the search space. Therefore, ants can move randomly in the search space and explore more regions without stagnating in local minima. The avoidance of local minima is a significant merit of ALO, which gives it superiority against other methods such as PSO. Moreover, it has few parameters compared to PSO and GA. In SSA, the swarm leader is chosen to be the agent with the highest fitness value. Hence, the agents of low fitness values have no chance of leading the swarm. This decreases the exploration capability of the algorithm and supports its exploitative power. In contrast, ALO keeps track of all agents in the swarm and uses a roulette wheel together with the current best agent to lead the swarm. This indicates that low-fitness agents can participate in guiding other agents in the swarm besides the best-found agent. This supports the exploratory behavior of the ALO. Integrating the principles of ALO and SSA into one algorithm can support the exploration/exploitation trade-off. The proposed hybrid algorithm keeps the ants and ant lion swarms in motion. However, it uses the ideas of leadership assignments from both ALO and SSA to provide more trade-offs between global search and local search. The proposed SSA–ALO algorithm takes the merits of ALO by updating low-fitness agents (ants) using ALO principles. On the other hand, it uses the merits of SSA by updating the high-fitness agents (ant lions) using SSA principles that have to maintain faster convergence.
2. Related Works
In the literature, researchers have been attracted by new technologies of data mining. Therefore, they have utilized them for security breaches and botnet attacks in IoT in an efficient way. In [14], neural network (NN) and the negative selection algorithm were used to predict intrusions in IoT. However, in this study, the performance of the IDs was limited. Mehmood [15], used a multi-agent system to detect DDoS attacks. Another study [16] classified the machine learning methods used for security in IoT. In [17], the authors used and compared a set of classifiers to determine their performance in detecting malicious activities. The results showed that NB achieved the worst performance among RF and GB. Principal component analysis (PCA) and fuzzy clustering were used to detect intrusions in IoT. The yielded efficiency of the proposed IDS was promising. However, the system suffered from the scalability problem, so it became inefficient when the amount of data increased [18].
Rathore, in [19], proposed an extreme learning machine (ELM) for attack detection in IoT. The new method outperformed other traditional machine learning methods in terms of accuracy. Moustafa [20] proposed an ensemble learning method for IoT security detection. The proposed method was used to detect mainly three kinds of attacks in IoT.
Several nature-inspired algorithms were used to deal with security issues by developing IDS for IoT. Hamamoto [21] proposed IDS based on a genetic algorithm. In [22], a genetic algorithm was used to detect insider threats. The authors in [23] developed an IDS using multilayer perception and an artificial bee colony algorithm to detect malicious patterns. Ali in [24] proposed IDS based on particle swarm optimization (PSO) to detect attacks. In [25], Bayesian networks and C4.5 were used with the firefly algorithm to perform FS and classify the data in the network. PSO, GA, and ant colony algorithms were proposed as a layered model in [26] along with five rule-based classifiers.
In all mentioned studies, the proposed IDSs were used to handle the data traffic in the traditional networks or typical wireless sensor networks (WSNs). This means that they were not specifically developed for IoT networks. Hence, they may be insufficient for the evolved IoT networks [27]. In the literature, there are few studies on the use of metaheuristic algorithms for detecting intrusions in IoT networks and using metaheuristic FS to enhance the detection of attacks.
In [28], RF and the bat algorithm (BA) were integrated to perform FS for IoT security. The achieved performance results were superior to those of other used methods such as SVM, AdaBoost, and decision tree (DT). Xue [29] applied a differential evolution algorithm. In [30], Popoola proposed a wrapper FS to detect intrusions in networks by using a differential evolution algorithm. Guendouzi developed an FS method to detect intrusions using the biogeography-based optimization (BBO) algorithm [31]. In [32], the author proposed a genetic IDS. There is no existing solution in the literature that uses the integration of SSA and ALO for FS in IDSs, especially to detect botnets in IoT networks. In [8], the authors proposed a deep multi-layer classification intrusion detection approach. They used two stages for detecting an intrusion and the type of intrusion. They also applied an oversampling technique to enhance the classification results. The experiments showed that the best settings of the proposed approach included oversampling by the intrusion type identification label (ITI), 150 neurons for the Single-Hidden Layer Feed-Forward Neural Network (SLFN), and 2 layers and 150 neurons for LSTM. The results showed that the proposed technique outperformed the other well-known techniques in terms of the G-mean having a value of 78% compared to 75% for KNN and less than 50% for the other techniques.
In [6], the authors proposed a new approach for intrusion detection. They integrated the unsupervised (clustering), supervised (classification) and oversampling methods for carrying the task. The used classifier in the proposed approach is the Single Hidden Layer Feed-Forward Neural Network (SLFN). The oversampling method was applied to generate balanced training data. The results showed that the SLFN with the Support Vector Machine and Synthetic Minority Oversampling (SVM-SMOTE), with a ratio of 0.9 and a k-means++ clustering with k value of 3 obtained better results than other values and other classification methods.
3. Preliminaries
3.1. Salp Swarm Optimization
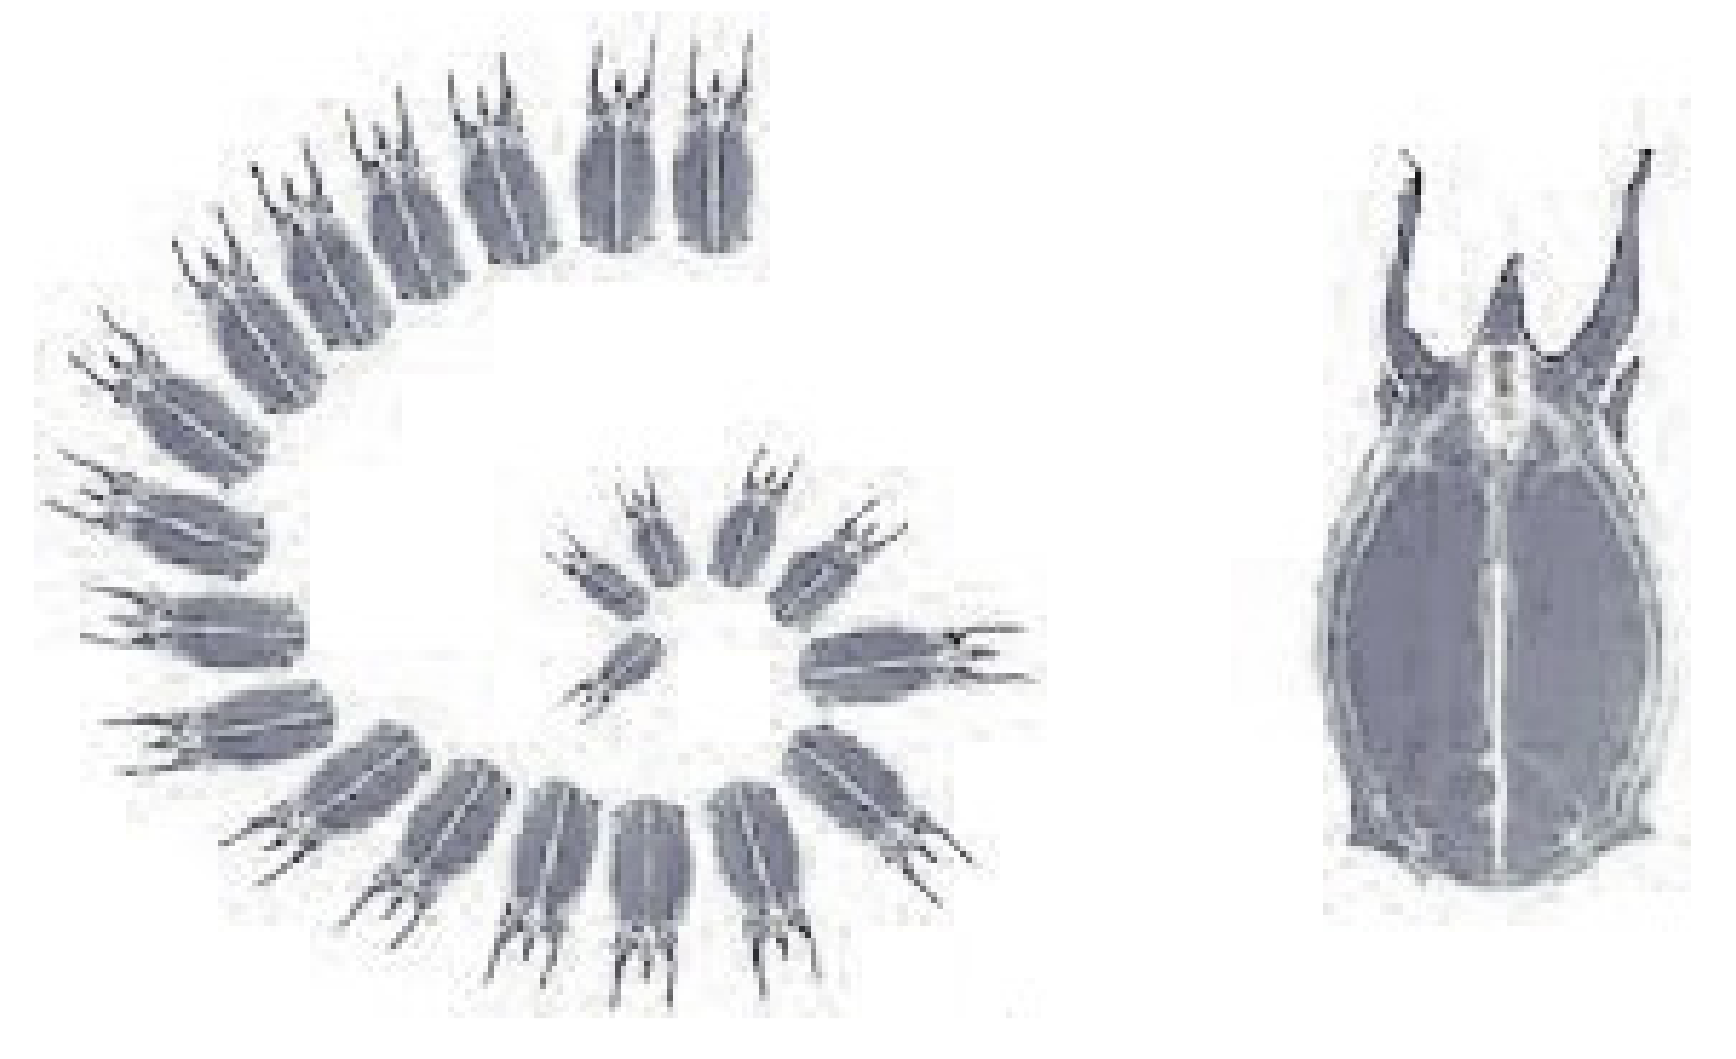
The salp swarm algorithm (SSA) is a swarm intelligence algorithm that was developed in [33]. It inspiration is from animals called salps that live in the sea as a chain. The chain starts with a leader salp that leads other salps. Other salps are followers of the leader salp. Figure 1 shows the swarm of salps and the individual salp.
The population X of n salps can be represented using a 2D matrix as shown in Equation (1). F is the food source. The matrix represents the population of salps. Each line in this matrix represents a single salp (solution). This solution or salp consists of a number of elements. The length of the salp represents the dimension of the problem (d). Actually, this is the number of dimensions or features in a dataset. The number of salps (n) represents the size of the population. Therefore, the first line in the matrix represents the first salp in the swarm, which is the leader salp, and the last line in the matrix is the follower salp number (n) in the swarm. Equation (2) explains the position relation of the leader salp (which is the first solution in the swarm of salp) and the food source.
The position of the leader salp is formulated as in Equation (2)
where and are the positions of leaders and food source in the jth dimension, respectively. is a gradually decreasing parameter across iterations, and calculated as in Equation (3), where l and L are the current iteration and the maximum iterations, respectively. The other and parameters in Equation (2) are randomly selected from [0, 1]. The parameters and are very important to direct the next position in the jth dimension towards +∞ or −∞ and determine the step size. The and are the bounds of the jth dimension.
In Equation (4), and represents the position of the ith follower at the jth dimension. SSA is presented in Algorithm 1.
| Algorithm 1 SSA algorithm pseudo-code. |
|
Input: n is the # salps, d is the # dimensions) Output:Near optimal solution (F) Initialization step x_i (i = 1, 2, . . . , n) considering ub and lb while (maximum iterations is not reached) do Computer the fitness value of each individual Define F as the best individual Update by Equation (3) for (each individual ) do if l == 1 then Change the position of the leader individual by Equation (2) else Change the position of the follower individual by Equation (4) end if Change the positions of the individuals based on the bounds of variables end while return F |
3.2. Ant Lion Optimization
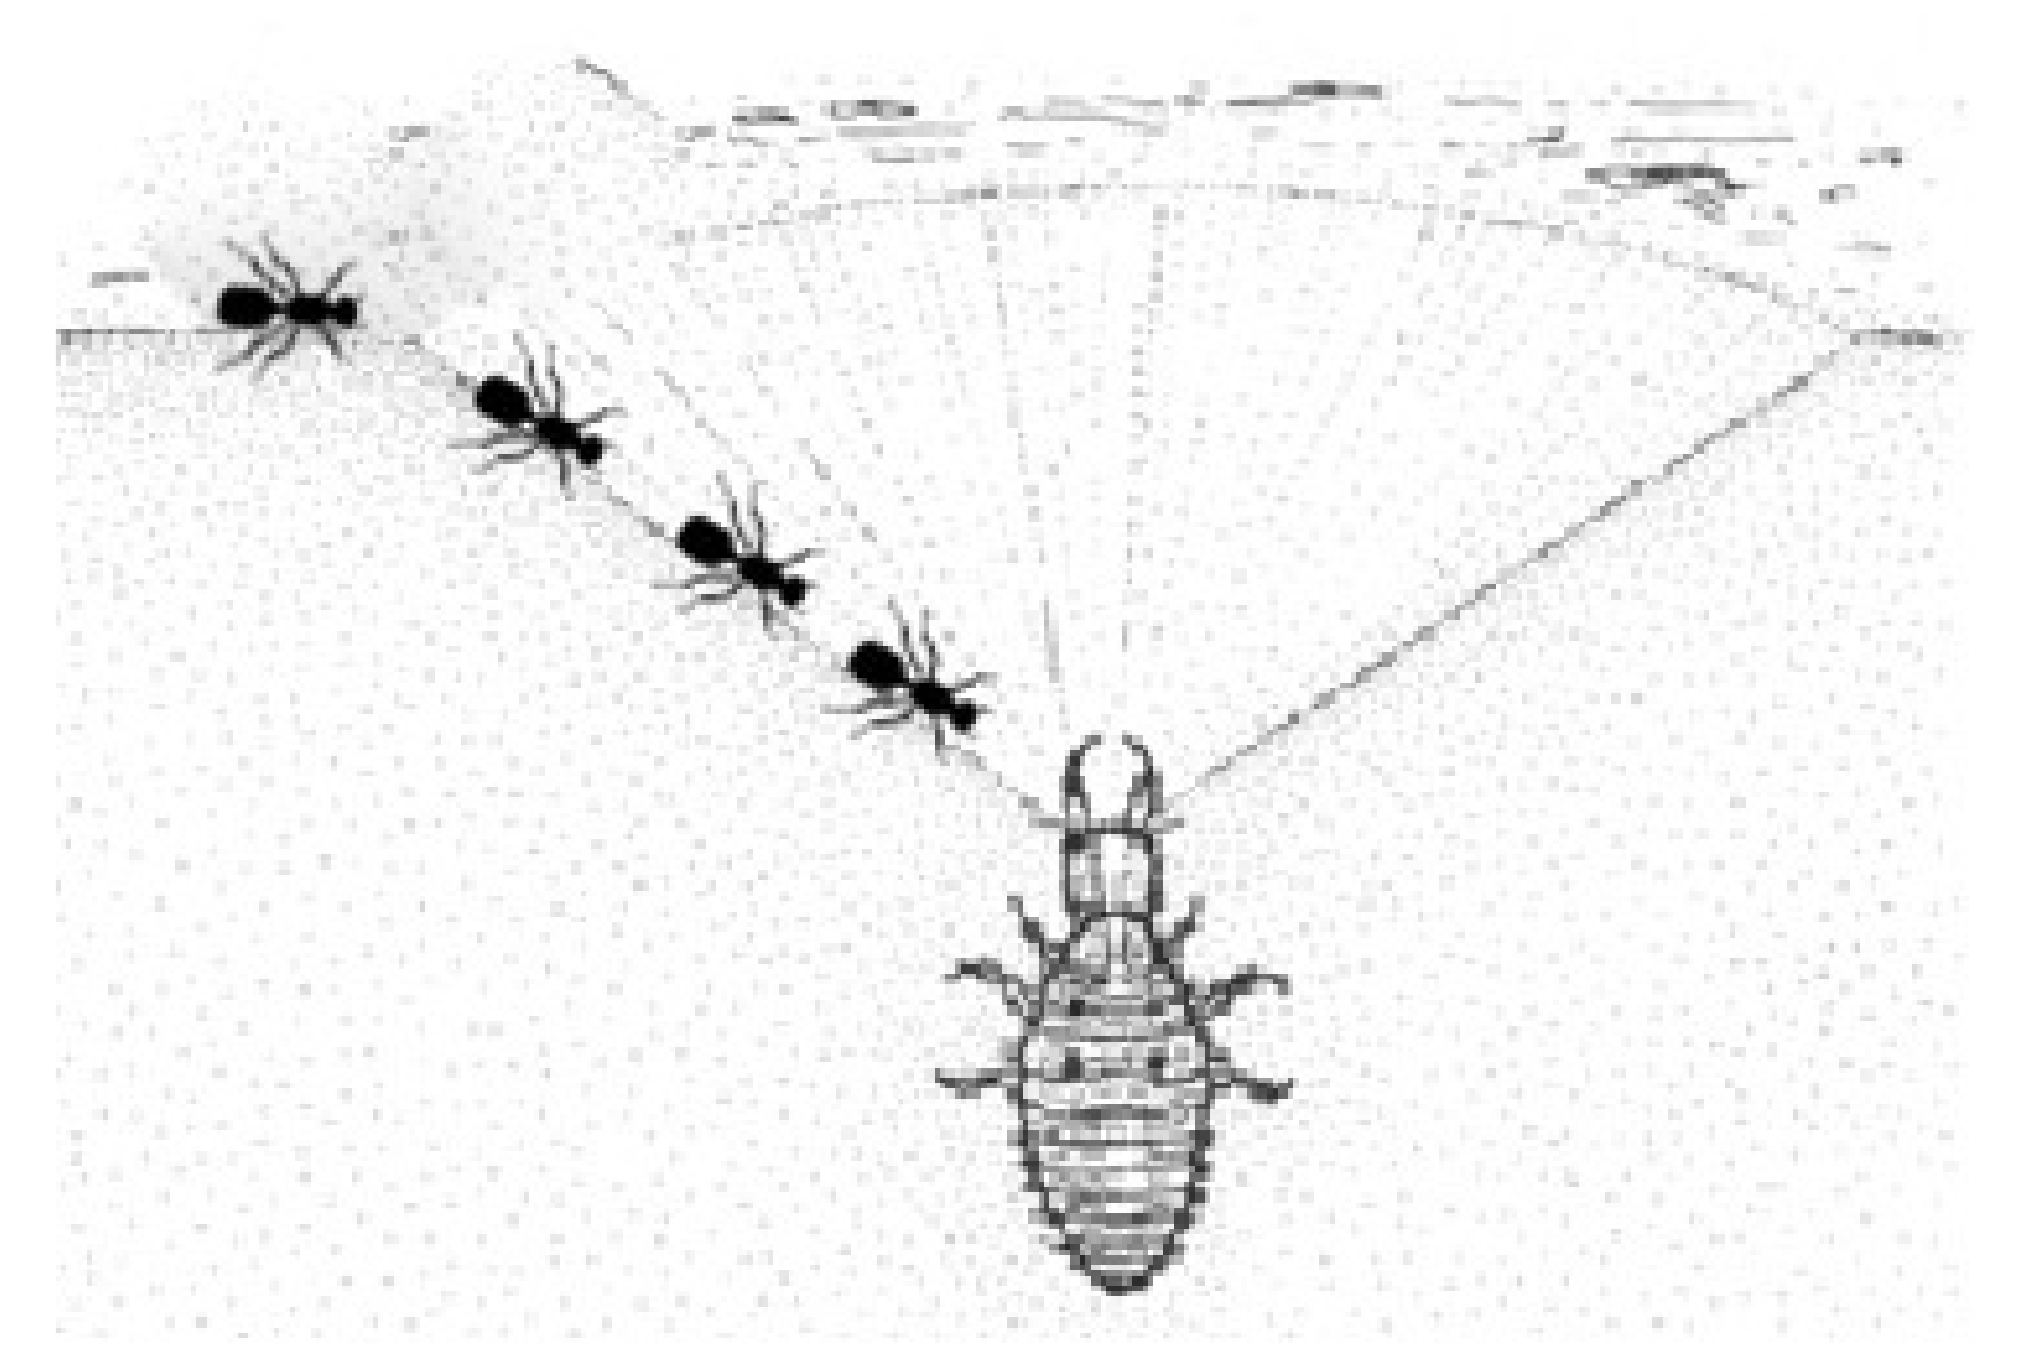
Ant lion optimization (ALO) was developed in 2015 [34]. ALO mimics the ant lions’ strategy for hunting in nature. Ant lions begin to hunt when they are larvae, while they reproduce when they become adults. Ant lion larvae build a hole in the land. This hole is the trap for insects such as ants. Ant lion larvae hide in the hole and wait for the ants. When the ant lion recognizes ant, it throws the sand out of the hole, in an attempt to catch it. Thus, the ant is captured and is unable to get out from the hole. After the ant lion consumes the prey, it tries to fix the trap for the next prey.
In the ALO algorithm, the ants move within the search space in a random way. Ants are affected by the traps that are built by ant lions. The trap size depends on the fitness value of the ant lion so that a large hole indicates the high fitness of the ant lion. Hence, the ant lion with a higher fitness value has a greater chance of catching prey. In each iteration, prey can be hunted by an ant lion. In ALO, the random walks of ants decrease in adaptive way across iterations to reflect the situation of sliding ants in the direction of the ant lion. If the ant is hunted by the ant lion and pulled towards the bottom of the trap, this is described in terms of the ant having higher fitness than the ant lion. The ant lion updates its position to the last hunted prey and builds another hole in preparation for the next hunt. Figure 2 shows the ants and the ant lion in nature. ALO is formulated in Algorithm 2.
| Algorithm 2 ALO algorithm pseudo-code. |
|
Input: Search space, fitness function, # ants and ant lions, # iterations (), ,. Output: The best ant lion and its fitness. 1. Initialize a random n ant positions and n ant lion positions. 2. Compute the fitness of all ants and ant lions. 3. Find the best ant lion 4. whiledo for all do (i) Use a roulette wheel to select an ant lion (building trap); as in Equations (9) and (10). (ii) Slide ants towards the ant lion; as in Equations (11) and (12). (iii) Create a random walk for anti and normalize it; as in Equation (14). end for - Compute the fitness of all ants. - Replace an ant lion with a fitter ant. - Update elite if an ant lion becomes fitter than the elite. end while 5. Select the optimal ant lion position. |
- t: the current iteration
- T: the maximum iterations
- : the position of ant lion j at iteration t
- : the position ant i at iteration t
- : is the minimum of all variables at tth iteration.
- : indicates the vector including the maximum of all variables at tth iteration.
- w: a constant defined based on the current iteration ( when , when , when , when , and when ). The constant w can adjust the accuracy level of exploitation.
- I: I is a ratio defined based on w using the equation
- : minimum random walk of ithvariable.
- : maximum random walk of ithvariable.
Random walks of ants are all based on Equation (6):
where cumsum is the cumulative sum, T is the maximum # iterations, t shows the step of random walk, and is a function in Equation (7)
with being a random number in [0; 1].
To keep the random walks inside the search space, the minmax normalization is applied:
Ant lions release sand outside the hole as soon as an ant is in the trap. This behavior is mathematically modeled in Equations (11) and (12)
The last step is to catch the prey and rebuild the hole. It is assumed that the hunting of ants occurs when ants have higher fitness values than their corresponding ant lions. An ant lion is then expected to update its position regarding the latest position of the hunted ant to improve its chance of catching new prey, modeled by Equation (13)
Elitism is used to reserve the best solution(s) across iterations. The random walk of an ant is led by the selected ant lion and the elite ant lion and, therefore, the new position of an ant is formulated as in Equation (14)
where is the random walk around the ant lion selected by the roulette wheel, and is the random walk around the elite ant lion.
4. The SSA–ALO Hybrid Model for Feature Selection
The SSA algorithm has many promising features that make it favorable for global optimization, particularly for FS problems. In general, SSA has a simple structure, is efficient, and has an implementable methodology. Furthermore, SSA has one parameter for balancing the global search and local search. It adaptively decreases across the iterations of the optimization process. Thus, the algorithm explores several regions at the beginning of the optimization process and focuses on promising regions later on. As a bonus, follower salps update their positions gradually according to other salps in the swarm, which prevents the optimizer from falling into local minima. The SSA maintains the best-found individual so that it is reserved even if agents become weakened. In the SSA, the leader salp moves according to the food source position. This is the best salp found so far. Therefore, the leader always is able to search globally and locally around the food source in the search space.
ALO has two types of individuals: ants and ant lions. Ant lions are the best solutions found so far. Their positions are replaced whenever a fitter ant is found. Ants are moving around in the search space continuously. The positions of ants are changed based on the positions of ant lions. The position update strategy of ants is based on selecting an ant lion using a roulette wheel in combination with the best solution. Thus, a given ant updates its position based on these two agents. The selection of an agent randomly using a roulette wheel encourages diversification in the search space. Therefore, ants can move randomly in the search space and explore more regions without stagnating in local minima. The avoidance of local minima is a significant merit of ALO, which gives it superiority against other methods such as PSO. Moreover, it has few parameters compared to PSO and GA.
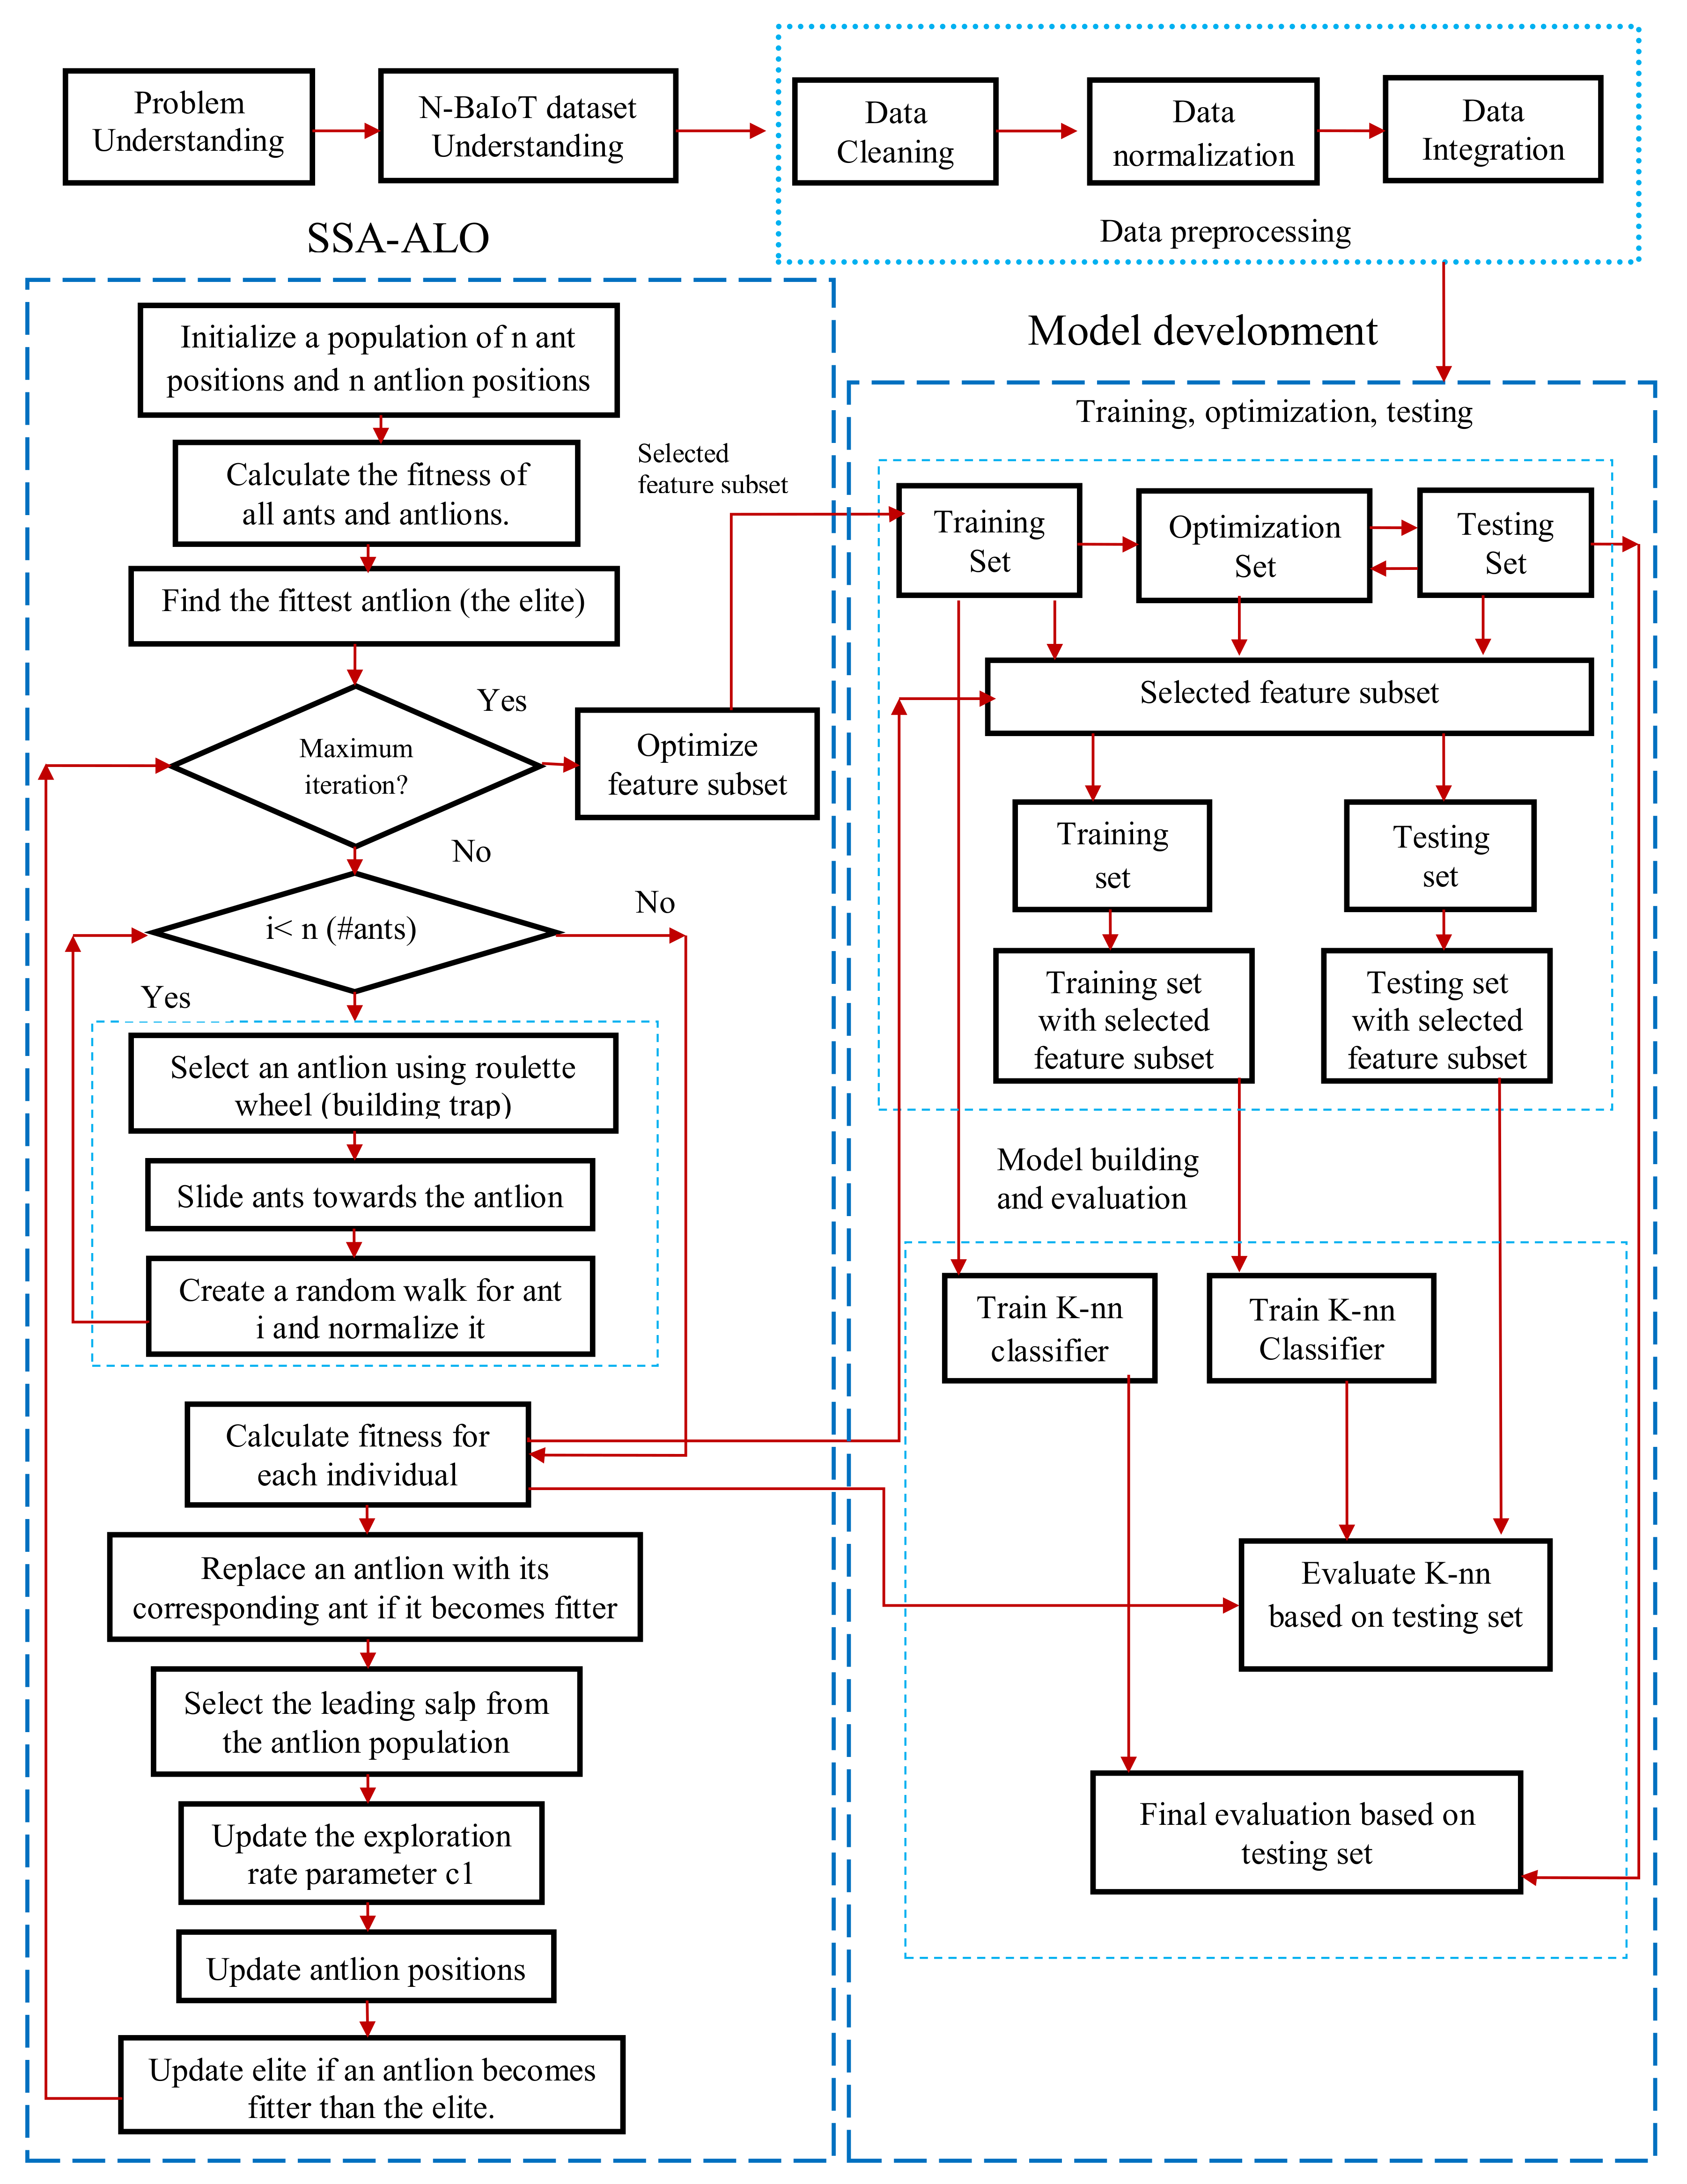
The exploration/exploitation capability of a particular algorithm depends directly on how the swarm leader is announced. In SSA, the swarm leader is chosen to be the agent with the highest fitness value. Hence, the agents of low fitness values have no chance of leading the swarm. This decreases the exploration capability of the algorithm and supports its exploitative power. In contrast, ALO keeps track of all agents in the swarm and uses a roulette wheel together with the current best agent to lead the swarm. This indicates that low-fitness agents can participate in guiding other agents in the swarm besides the best-found agent. This supports the exploratory behavior of the ALO. Integrating the principles of ALO and SSA into one algorithm can support the exploration/exploitation trade-off. The proposed hybrid algorithm keeps the ants’ and ant lions’ swarms in motion. However, it uses the ideas of leadership assignments from both ALO and SSA to provide more trade-offs between global search and local search. The proposed SSA–ALO algorithm takes the merits of ALO by updating low-fitness agents (ants) using ALO principles. On the other hand, it uses the merits of SSA by updating the high-fitness agents (ant lions) using SSA principles that have to maintain faster convergence. The SSA–ALO is formally given in Algorithm 3. The overall botnet detection system is represented by the flowchart in Figure 3.
The proposed SSA–ALO algorithm has sufficient exploration capabilities because:
- It applies a roulette wheel as a selection mechanism of individuals. This affects the swarm of ants.
- It changes the size of the random walk adaptively as in SSA. This affects the ant lions swarm.
- The size of the random walks is adaptive as in ALO. This affects the population of ants.
- All members of the population are repositioned, rather than only the ant population, as in ALO.
| Algorithm 3 The proposed hybrid SSA–ALO algorithm. |
|
Input: Search space, fitness function, # ants and ant lions, # iterations (). Output: The optimal ant lion and its fitness. 1. Initialize the random n ant positions and n ant lion positions. 2. Compute the fitness of all ants and ant lions. 3. Find the fittest ant lion (the elite) 4. while do for alldo (i) choose an ant lion using roulette wheel (building trap). (ii) Slide ants towards the ant lion. (iii) build a random walk for and normalize it. end for - Compute the fitness of all ants. - Change the position of an ant lion with a fitter ant (catching a prey). - Select the leading salp from the ant lion population based on its fitness. - Update the exploration rate parameter - Update ant lion positions - Update elite if an ant lion becomes fitter than the elite. end while 5. Select the optimal ant lion position. |
Furthermore, the SSA–ALO has exploitation power:
- It is arget-driven, which is realized from SSA, where the best solution is the leader and remaining solutions are the followers. This helps to improve the ant lions walk.
- The random steps of both SSA and ALO are reduced over time.
- The fitter ants are replaced with an ant lion as in ALO concepts.
The proposed SSA–ALO algorithm represents a wrapper-based FS framework. The main issue related to implementing the wrapper approach is using a learning (classification) algorithm. In the proposed algorithm, we have used the K-nearest neighbor (KNN) technique to determine the feature subsets’ goodness. The fitness function in the wrapper approach can be formulated as in Equation (15) and will be used to assess the quality of individual i at iteration t (). The main objective is to minimize and .
In the wrapper framework, evaluating a single solution is costly because it requires a training–testing process using the classification algorithm. For this reason, the choice of an efficient search algorithm is necessary. In this paper, the integration of ALO and SSA is applied to perform an adaptive search in the feature search space. The main target is to increase the classification performance to the maximum and reduce the number of features to the minimum simultaneously. Iteratively, the ALO selects an ant lion randomly using a roulette wheel mechanism. Furthermore, the ants implement a random walk around the best ant lion (elite). Based on the latest two random walks, the ants adjust their positions. If the ant has higher fitness than the ant lion, the ant lion eats it and adjusts its position to the ant’s position. Ant lions adjust their positions based on SSA principles, where the leader salp is selected among ant lions. This algorithm is applied iteratively and depends on the exploration rate, which decreases throughout the optimization process.
As mentioned previously, the solution is limited by two values, 0/1. Therefore, a continuous solution with real values needs to be mapped into a binary solution using Equation (16)
where is the continuous value of solution i in dimension j, and is the binary representation of solution vector x.
5. Experiments, Results, and Discussion
N-BaIoT dataset [35] is a benchmark dataset that was downloaded from the machine learning repository [36] at UCI (the University of California Irvine). This dataset represents IoT traffic generated after implementing two common botnet families called BASHLITE and Mirai, in addition to the implementation of the network’s normal behavior.
A test bed was built to run BASHLITE and Mirai botnets consisting of nine devices connected wirelessly via Wi-Fi. Their access point was connected wired-based with the attacker side (mainly C&C server). The types of devices included were two doorbells, a thermostat, a baby monitor, four security cameras, and a webcam.
The main attack executed by these botnets was the DoS attack. DoS attacks or distributed DoS attacks target mainly the availability security requirement of the IoT applications. DoS takes advantage of the resource constraint of the IoT devices, including energy, memory, processing capabilities, and bandwidth, to initiate or inject attacks that drain the devices and network resources and make their services unavailable to the concerned users. Table 1 shows the types of attacks that both botnet families carry out. Both BASHLITE and Mirai botnets execute an auto-scanning phase to scan the IoT and discover the vulnerable devices to inject them with malicious code (malware). The attacker’s C&C (command and control) servers can control this malware remotely. The main purpose of this phase is to propagate the malware and enlarge the botnet.
Moreover, both the TCP and UDP transport layers’ protocols were utilized to flood the IoT by sending too many fake packets too fast in order to deplete the device and network resources. Since TCP is a connection-oriented protocol, specific TCP packets were created and transmitted, including synchronization (SYN) and acknowledgement (ACK) packets.
Additionally, the BASHLITE botnet implemented spamming attacks, whether through sending spam data (junk) or opening fake connections with specific ports and IP addresses (COMBO) to book them just for DoS purposes. The total records per attack category are shown in Table 1.
Table 2 presents the 23 recorded features. Table 3 presents the number of normal and abnormal packets for each IoT device in the N-BaIoT Dataset. Table 4 presents a new N-BaIoT dataset that resulted from combining the data based on object type and the numbers of packets that were utilized in different stages. The new version of the N-BaIoT dataset is called the NN-BaIoT dataset. This is the one used for evaluating the proposed method.
All optimization algorithms were implemented using the EvoloPy-FS framework [13]. This is a publicly available FS swarm intelligence framework coded in Python. EvoloPy-FS consists of several metaheuristic algorithms, which can be downloaded from (www.evo-ml.com) (accessed on 28 March 2021). All results were recorded based on population size and maximum number of iterations equal to 10 and 100, respectively.
The proposed SSA–ALO algorithm was assessed using three evaluation measures that are widely used for testing the capability of attack detection; in the following equations, indicates true positives, indicates false negatives, indicates false negatives, indicates true negatives, indicates the true positive rate as in Equation (17), indicates the false positive rate as in Equation (18), and G-mean indicates the square root of of multiplied by as in Equation (19).
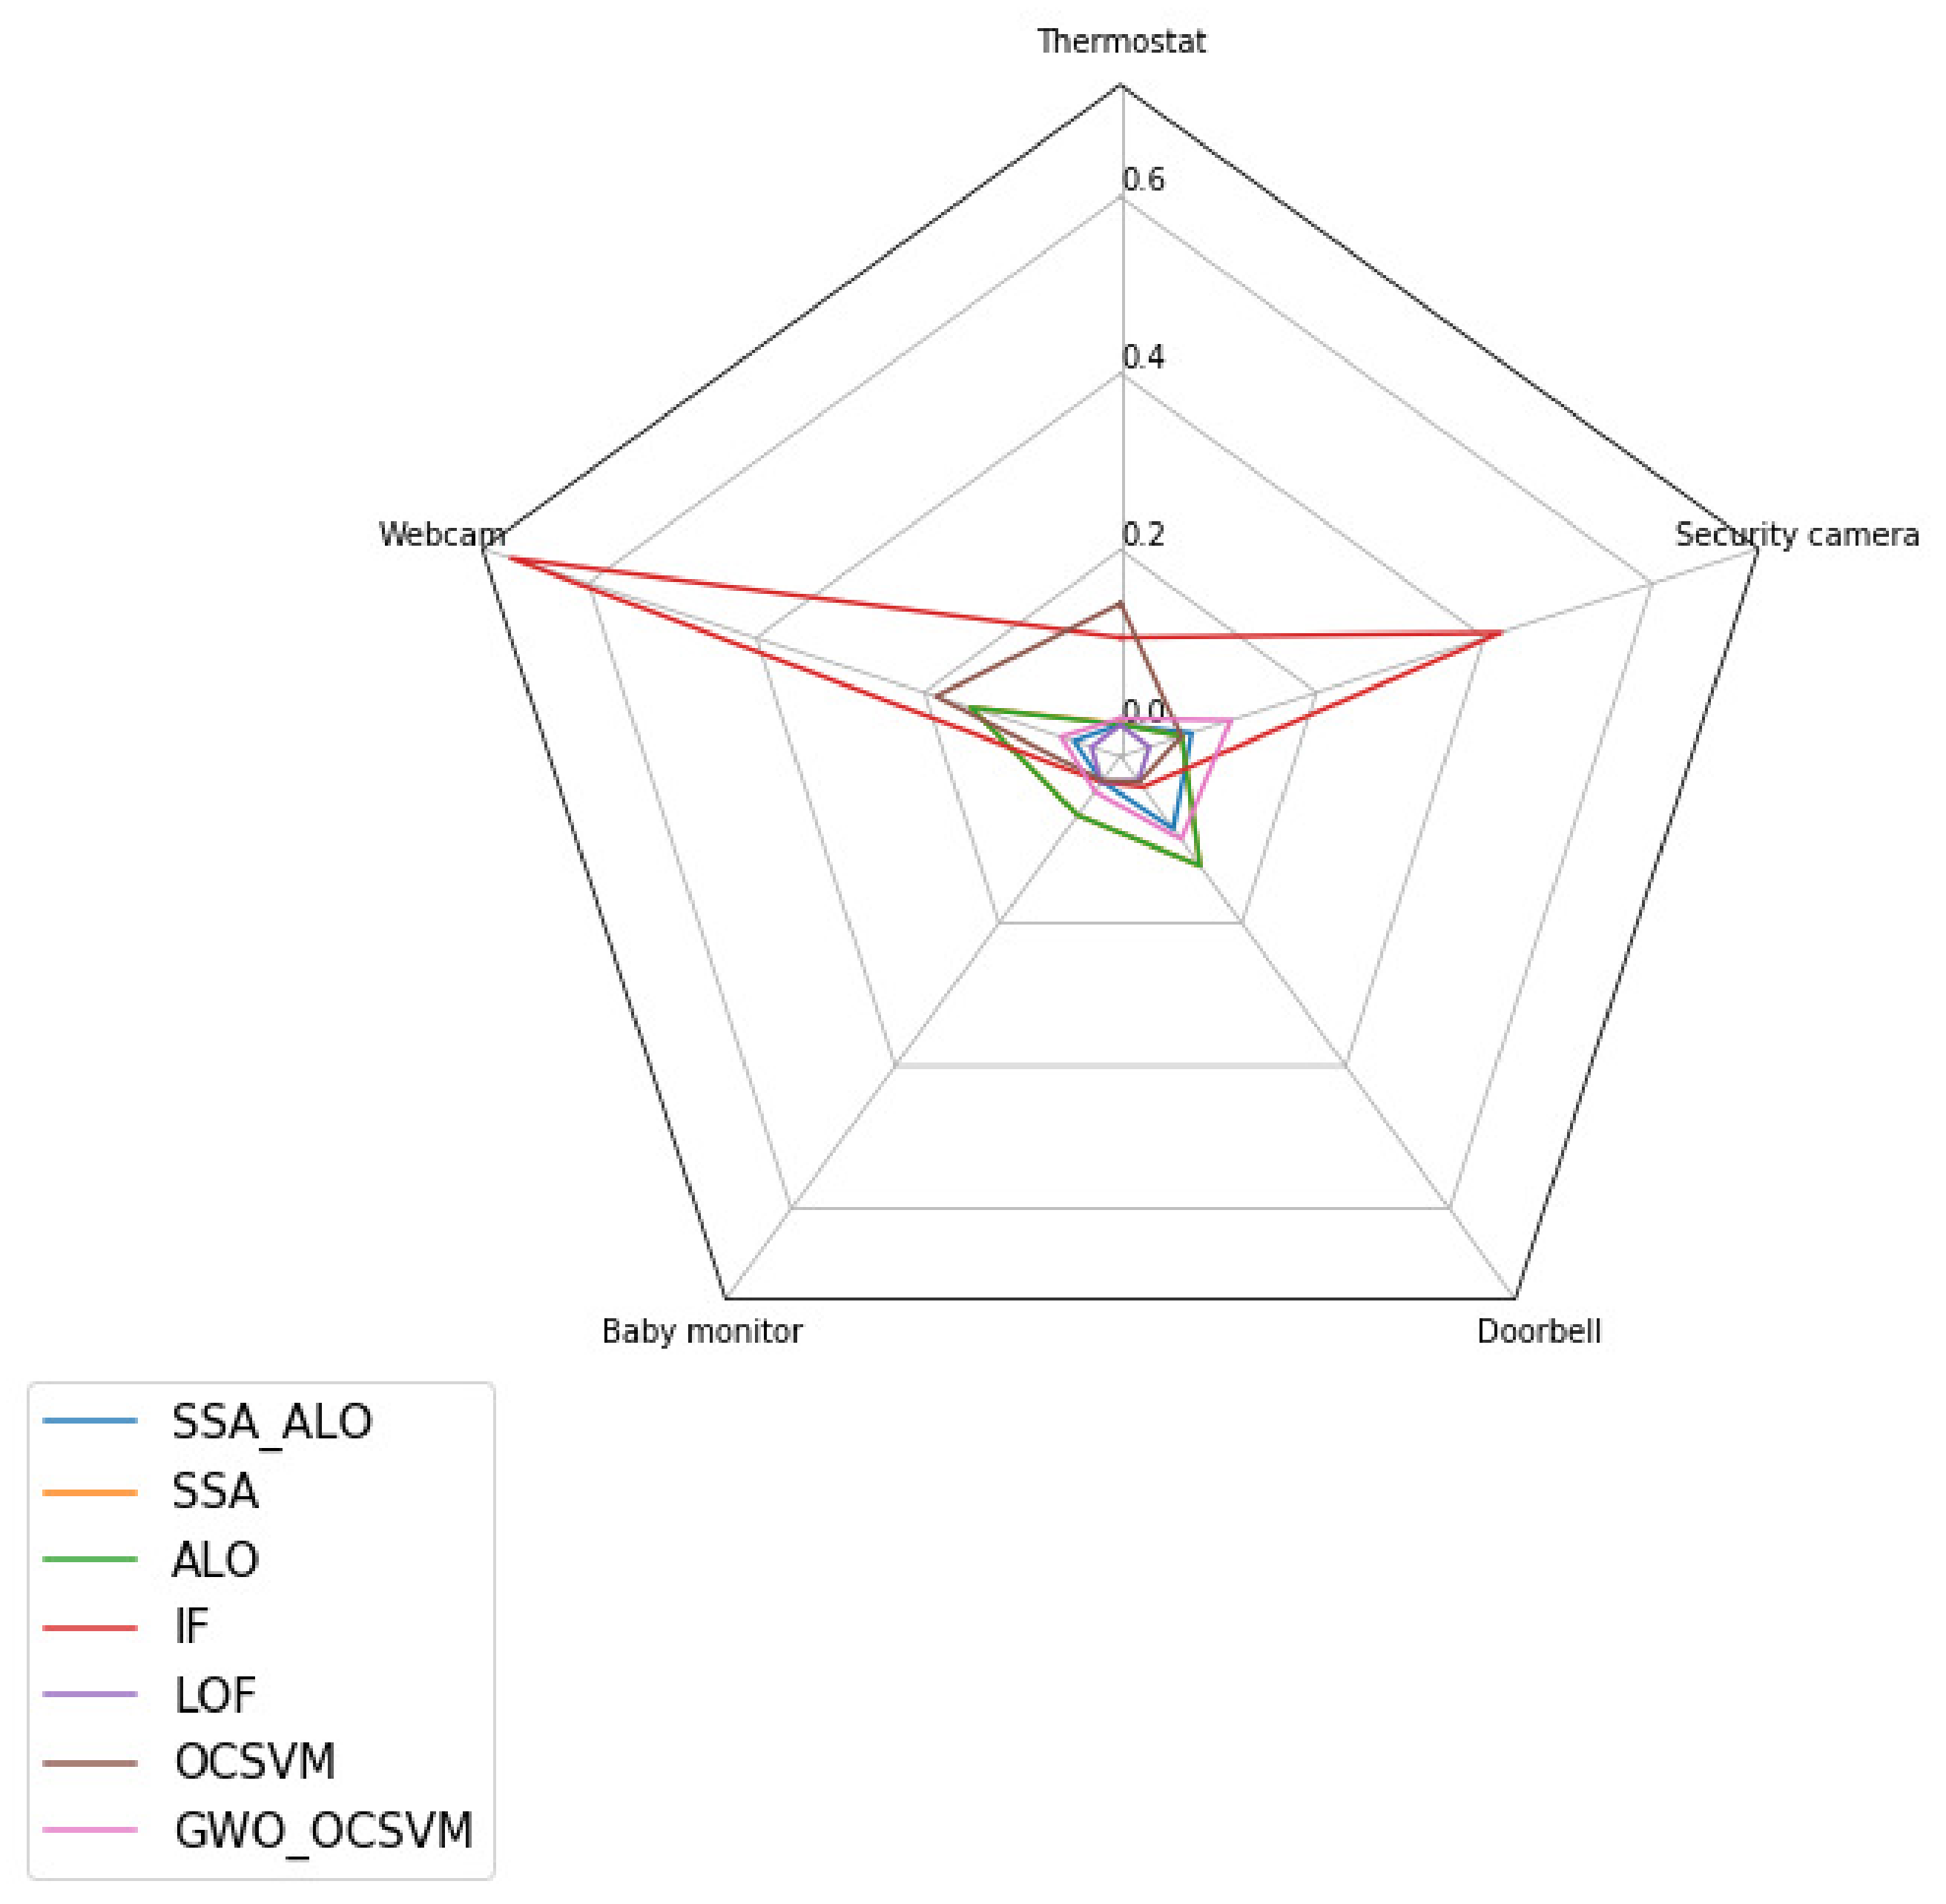
These evaluation measures were applied to the testing part of the dataset. The best anomaly detection was achieved when larger values of and were obtained. Moreover, lower values of were required to increase the robustness of the anomaly detection approach. Consequently, the perfect anomaly detection occurred when both and equaled one and equaled zero. Table 5 shows the and values for the SSA, ALO, and the proposed SSA–ALO algorithms. In addition, we compared the results with other anomaly detection algorithms from the literature. These are IF, LOF, OCSVM, and GWO-OCSVM. All the algorithms were applied over the NN-BaIoT dataset at the testing stage. TPR for anomaly detection means predicting the attack whenever it occurs. means predicting benign data as malicious. Therefore, higher values of and lower values of FPR are preferable.
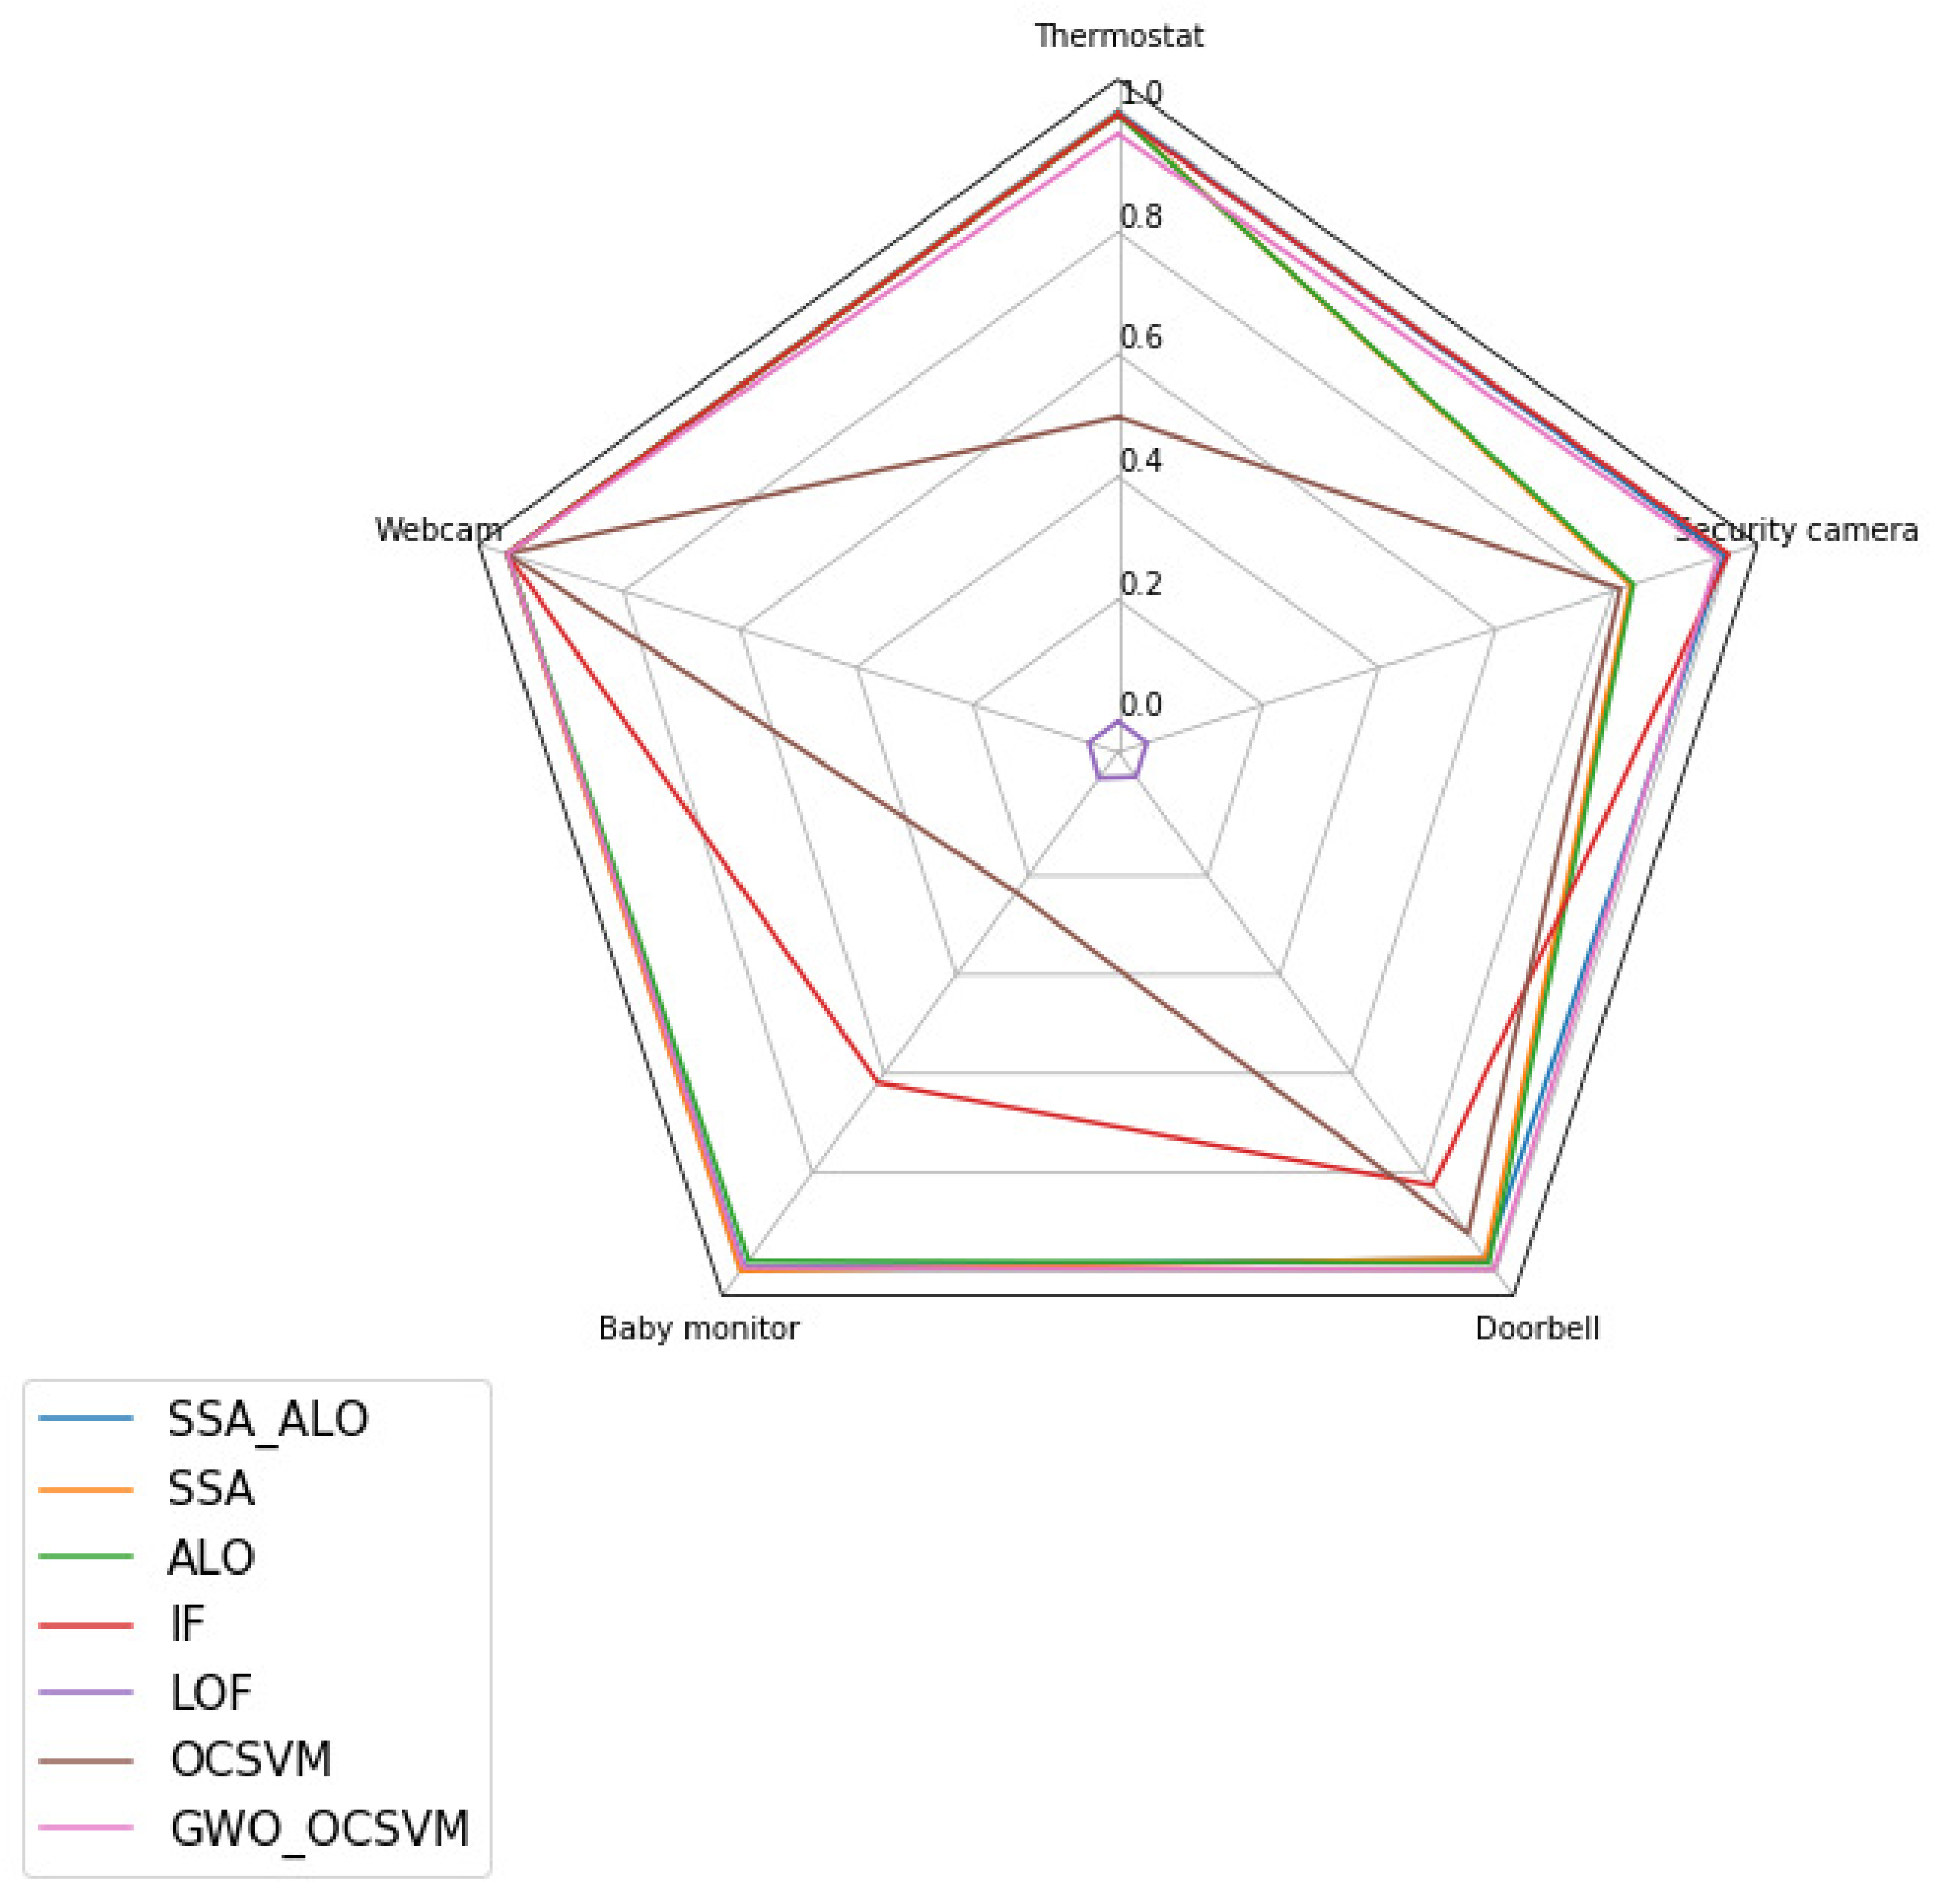
In addition, and as seen in Table 6, SSA–ALO achieved the best G-mean values across all types of IoT devices. In this context, it is worth mentioning that the and could not clearly indicate the performance because the dataset was imbalanced. Therefore, we used the measurement, which is commonly used to measure the performance of imbalanced datasets. The average G-mean value of the proposed SSA–ALO was 0.984, which is better than SSA, ALO, GWO-OCSVM, OCSVM, and IF. In addition, it is much higher than LOF. This means that SSA–ALO has a better ability to balance and .
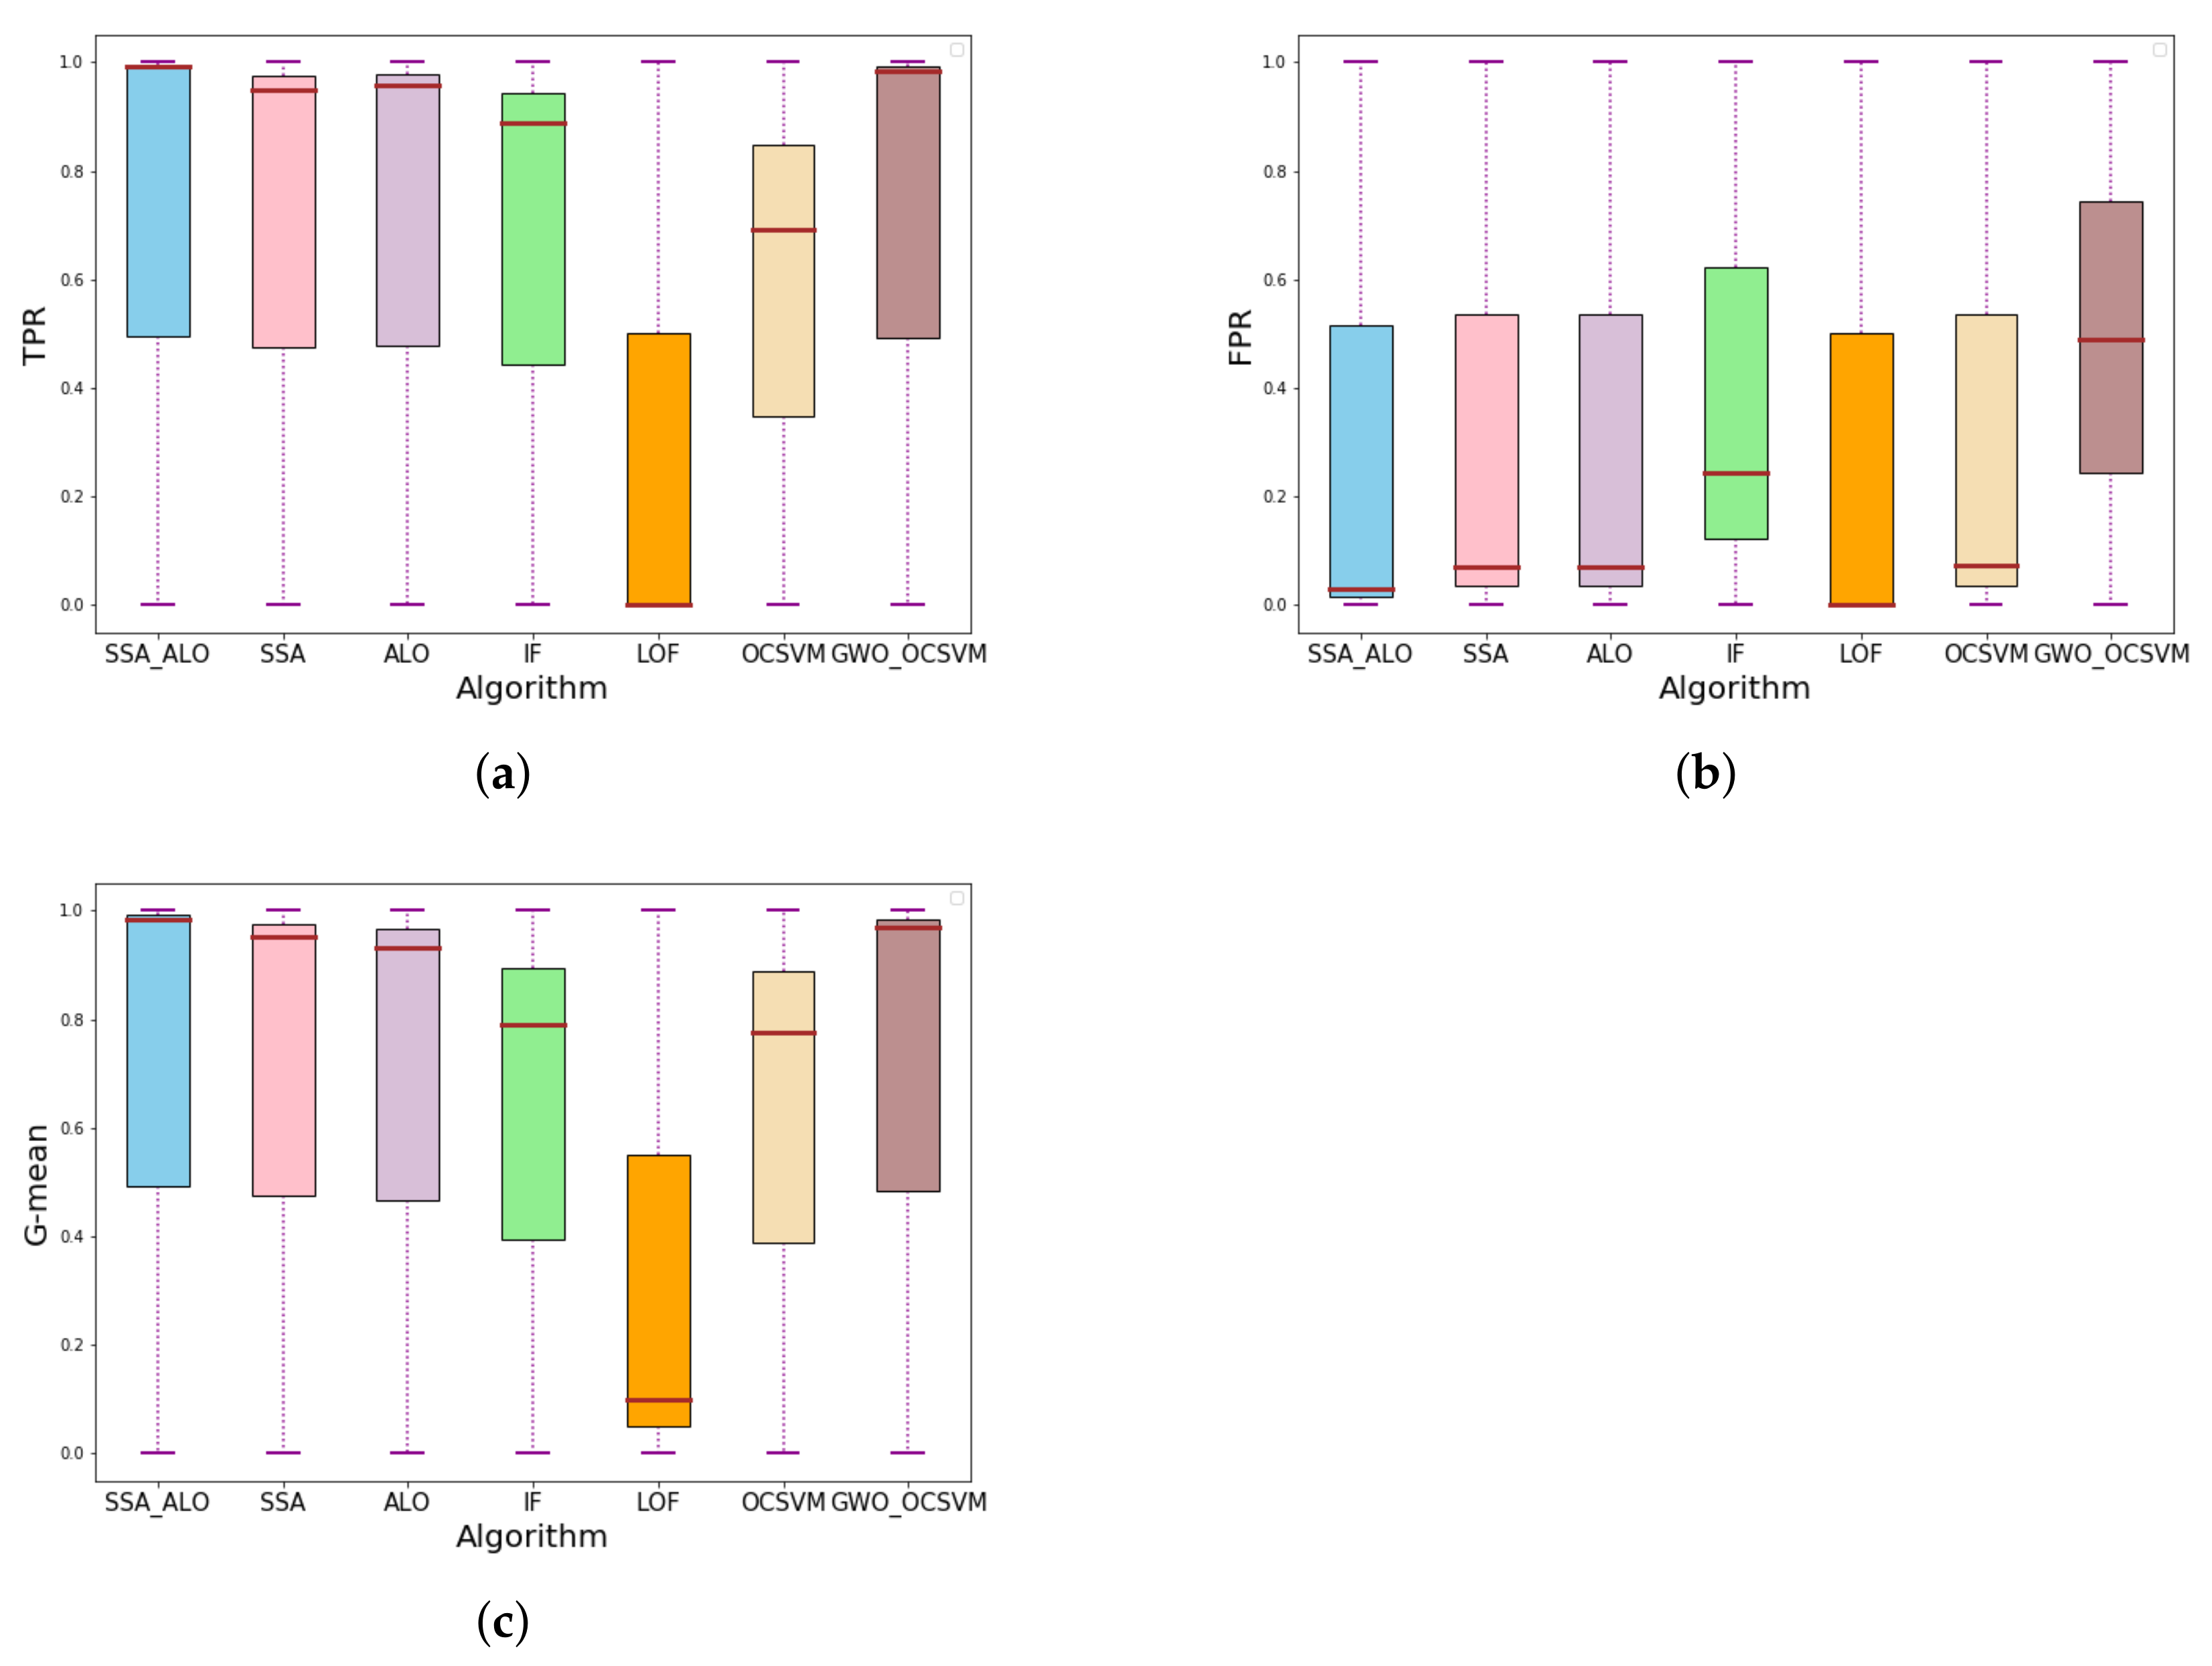
To visually describe the comparisons between these algorithms, Figure 4 shows boxplots of the information in Table 5 and Table 6. As shown in Figure 4, LOF has deficient performance since the and values are the same. This is close to the random classifier, where the TPR and are equal. On the other hand, the proposed SSA–ALO shows different behavior, with a significant difference between the and values. This can be explained by the fact that the hybridization between SSA and ALO can optimize the FS problem better than other algorithms. Moreover, the feature subset found by the SSA–ALO is the best, so it results in the best classification results.
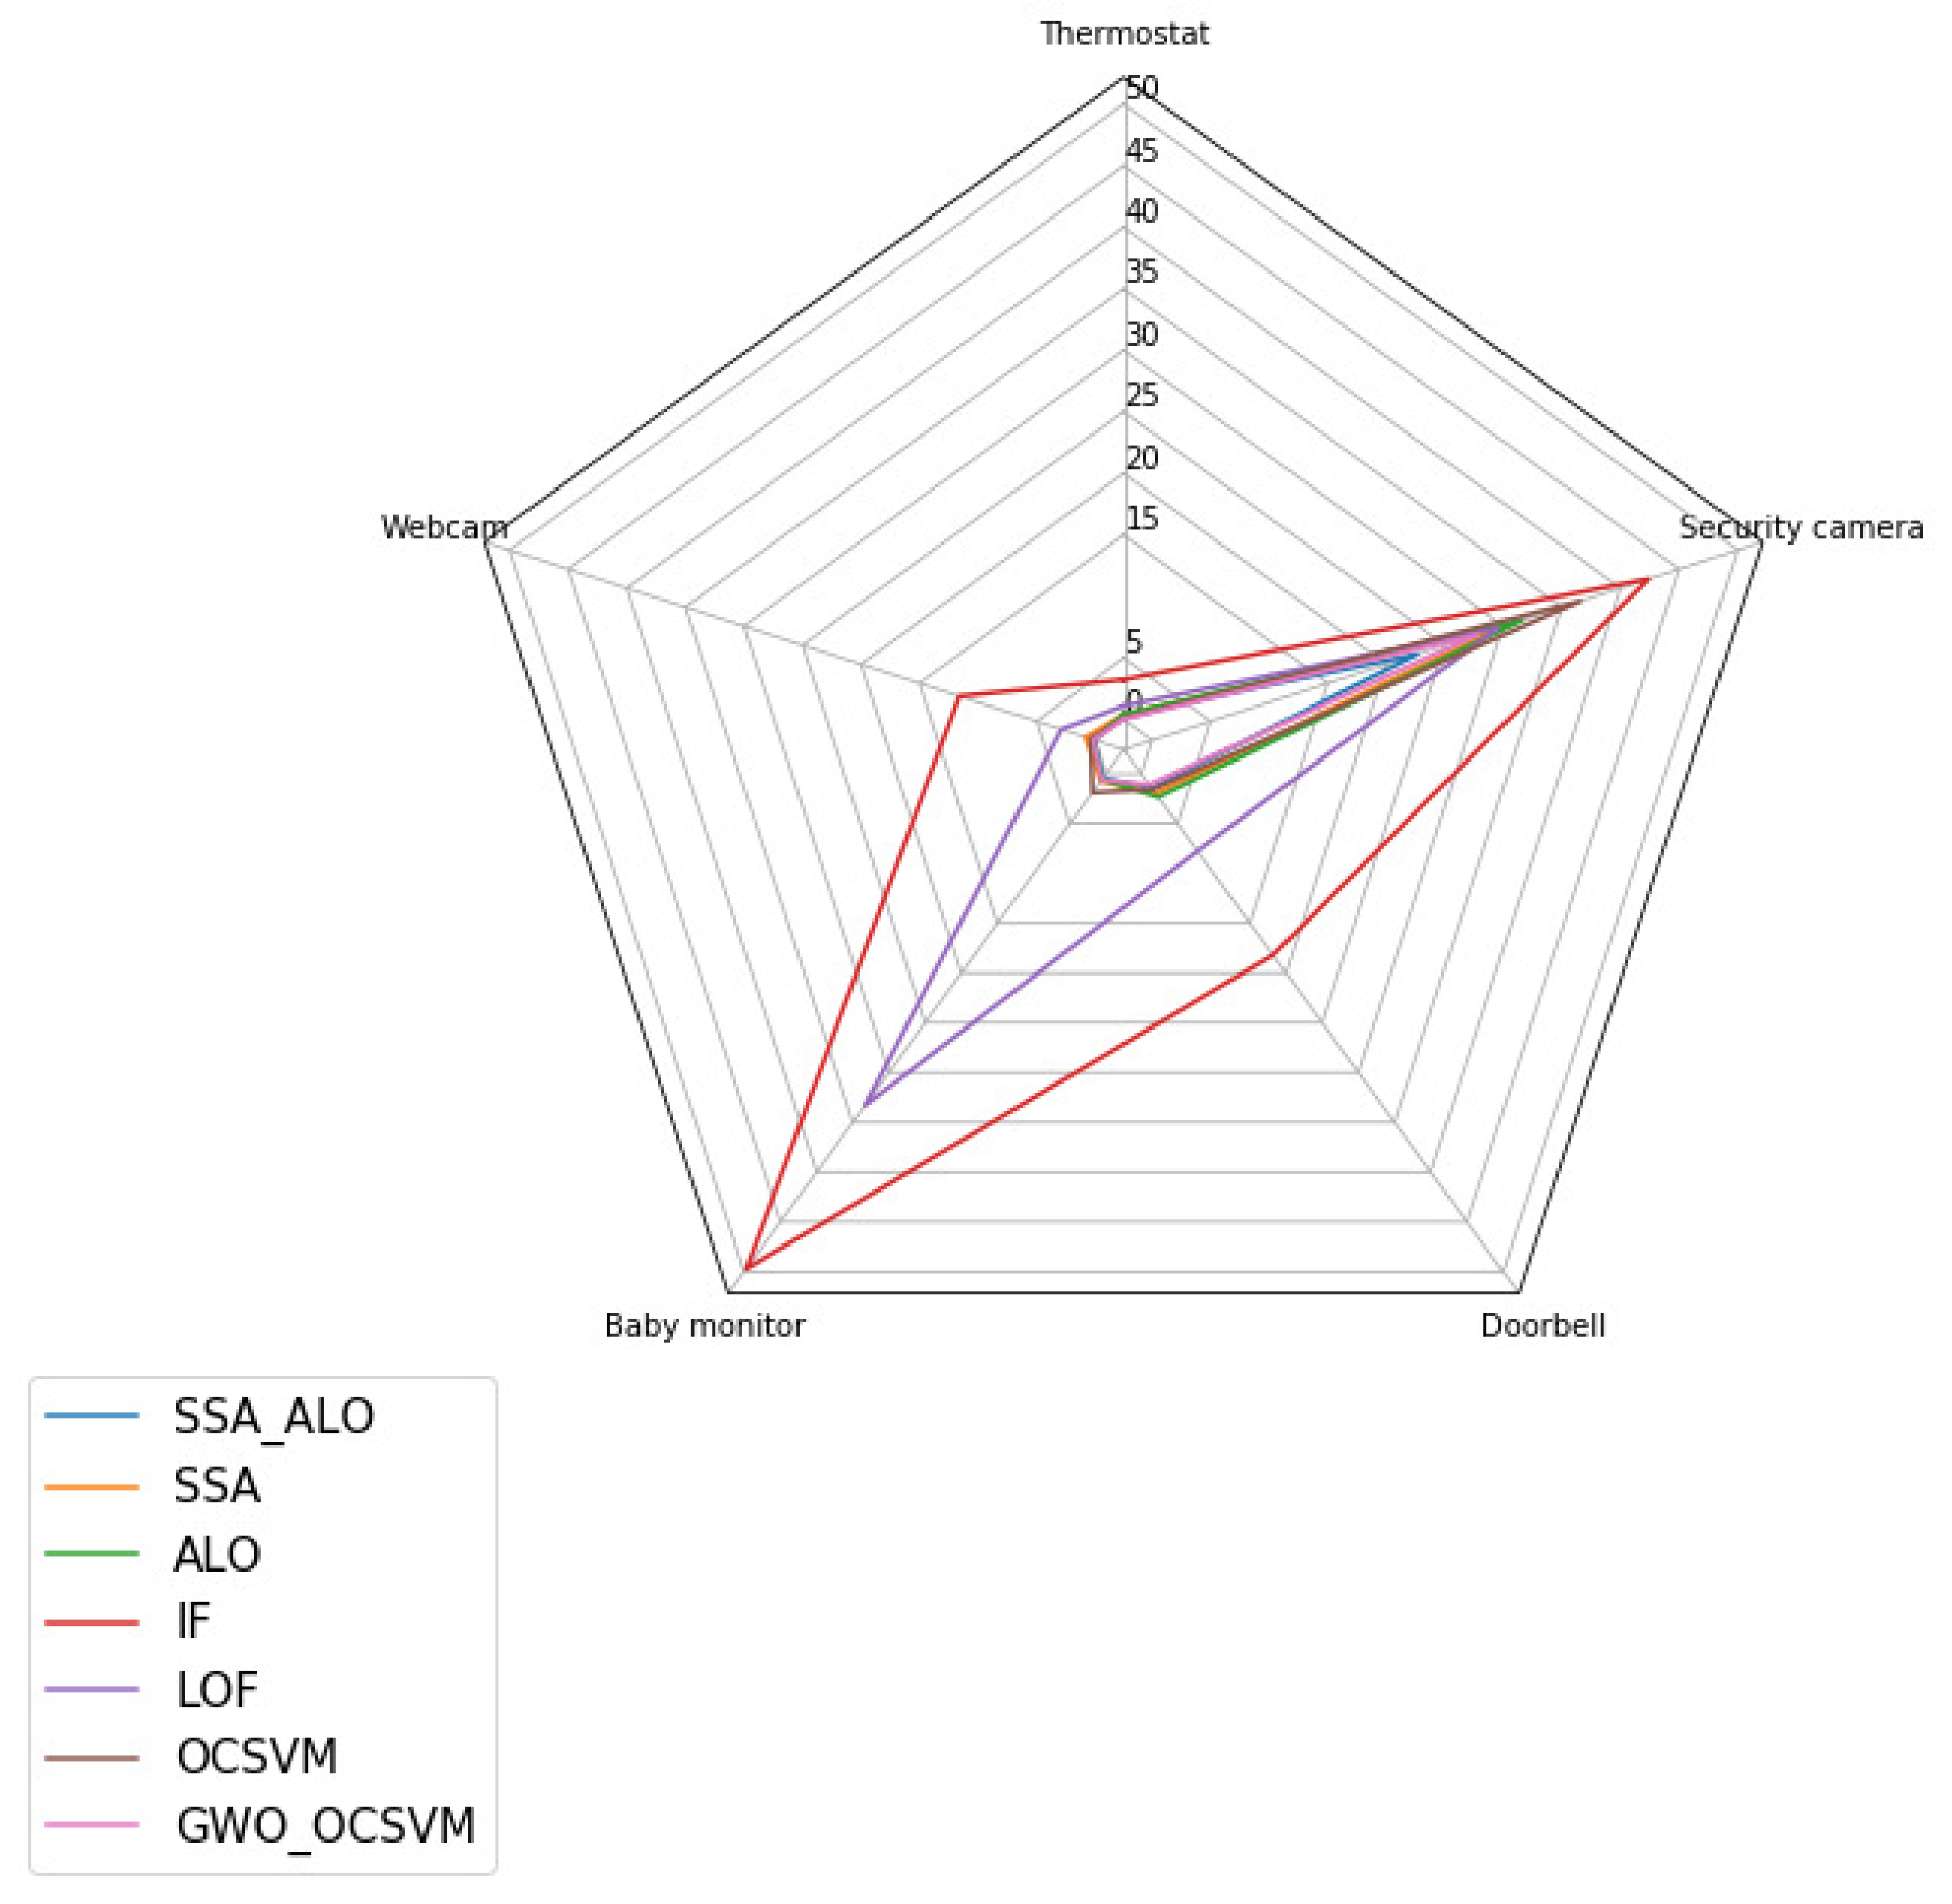
The algorithms were also compared in terms of the running time of the algorithm (detection time) as seen in Table 7. It is clearly shown that the detection time of the SSA–ALO is the lowest among all the algorithms. On average, the SSA–ALO algorithm needs 5 s to detect an attack. This implies that if the IoT devices are attacked, then their functionality will be restored within 5 s. Thus, the time duration of the attack is reduced.
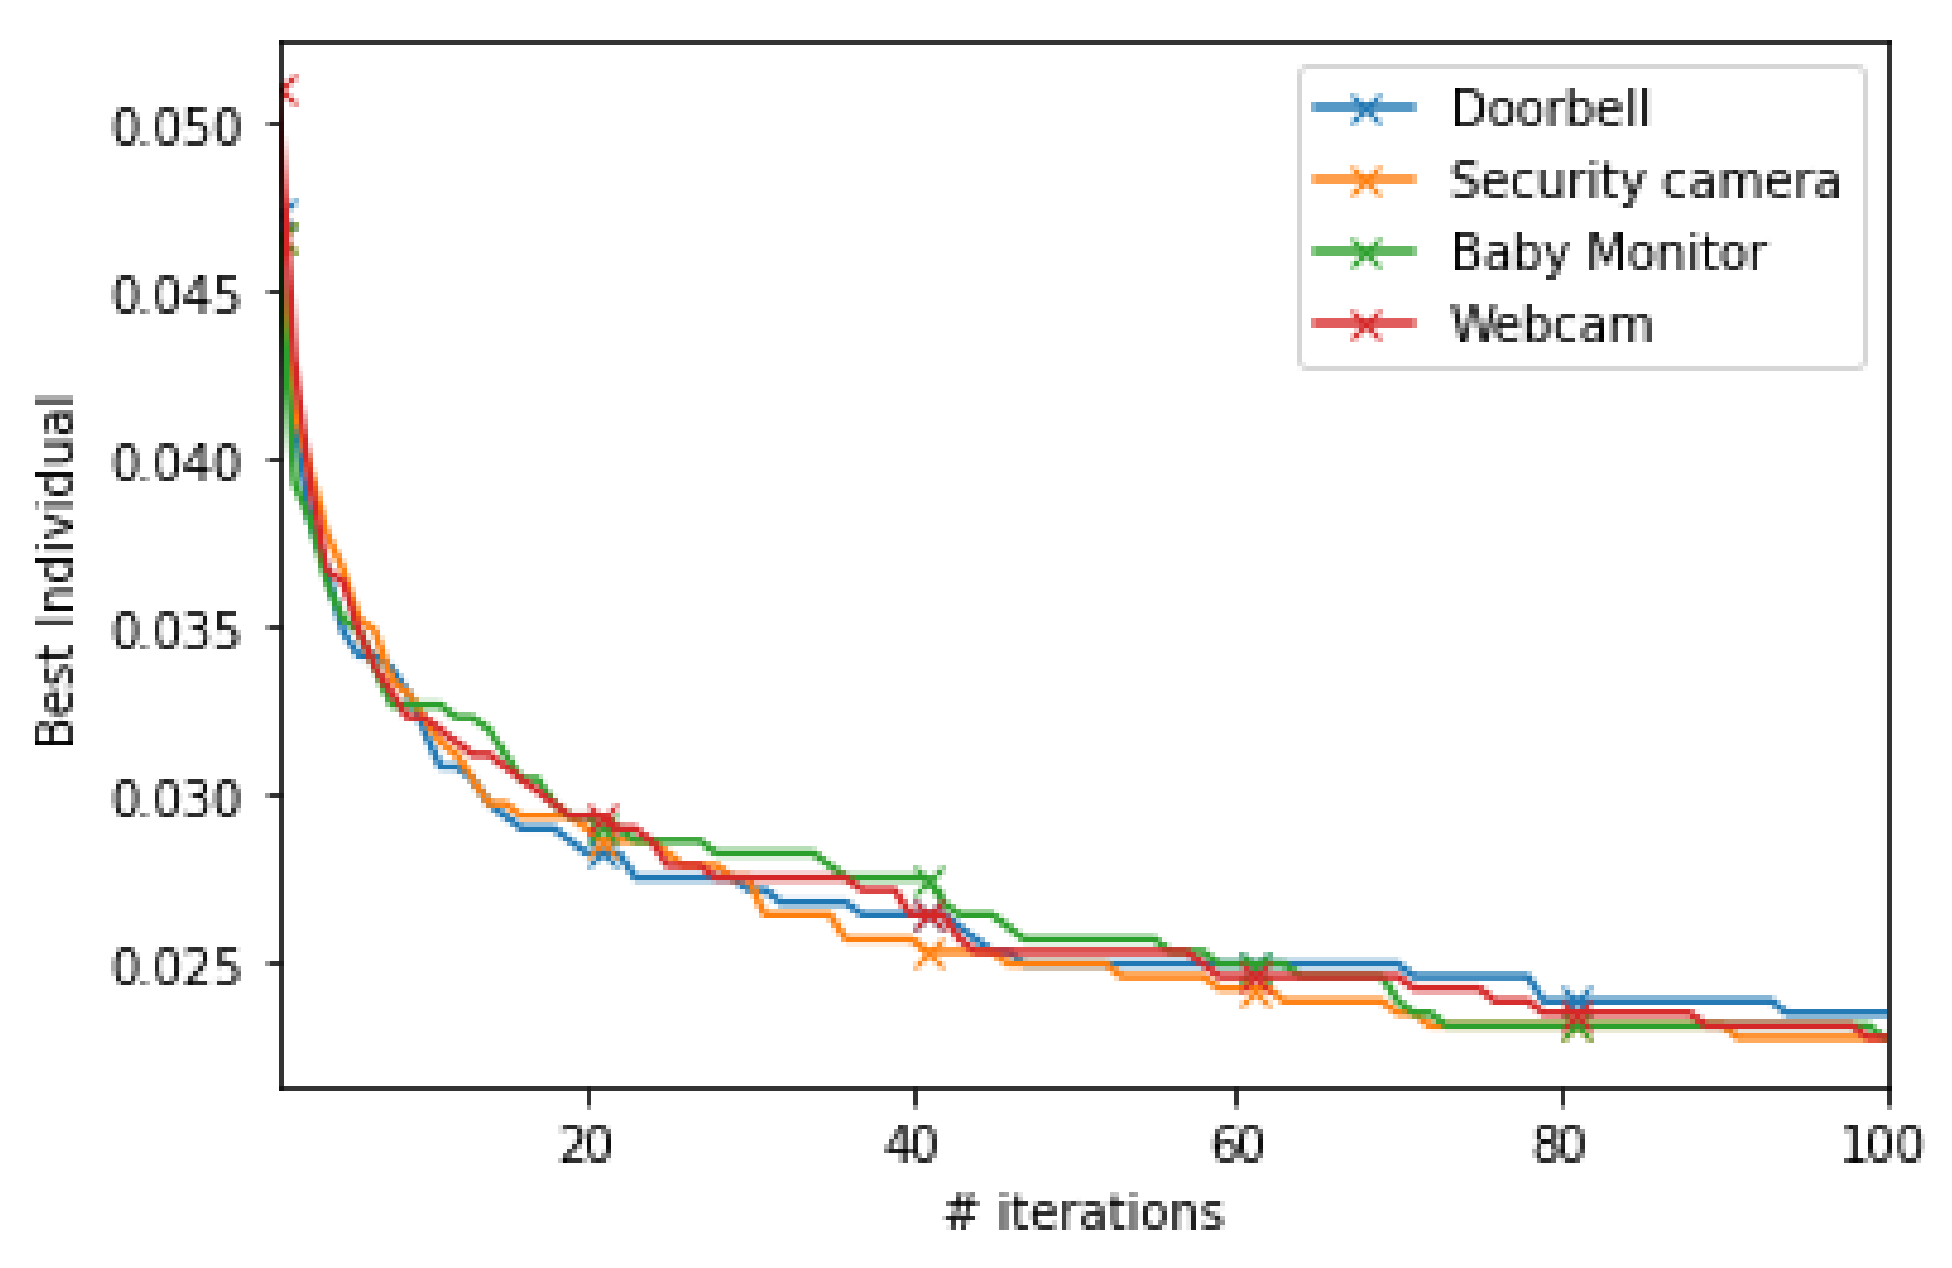
On the other hand, Figure 5 shows that the SSA–ALO algorithm obtains the best convergence behavior. Figure 6, Figure 7, Figure 8 and Figure 9 present the radar charts, which demonstrate the overall performance results in terms of evaluation measures across the various IoT devices. It can be seen that the best feature subset that is found by the SSA–ALO algorithm enhances the results in terms of all the used evaluation measures. In summary, the proposed SSA–ALO demonstrated superior behavior for IoT attack detection in comparison with the other six anomaly detection algorithms.
6. Analysis of the Most Relevant Features
This section presents the most relevant features selected by the proposed SSA–ALO algorithm over the NN-BaIoT dataset during the optimization process. The results show that SSA–ALO obtained the best results in terms of the studied metrics using these relevant subsets of features. As mentioned before, the NN-BaIoT dataset has 115 features. The number of selected features by SSA–ALO to detect a threat to a security camera, baby monitor, doorbell, webcam, and thermostat is eleven, seven, twelve, eleven, and five, respectively. This implies that there is a dimensionality reduction of (90–96%). The following list shows the most relevant features necessary to detect an attack on each type of device:
- Security camera:
- 1.
- H_L1_mean
- 2.
- HH_L5_radius
- 3.
- HH_L3_weight
- 4.
- HH_L3_magnitude
- 5.
- HH_L3_radius
- 6.
- HH_L1_mean
- 7.
- HH_L0.1_mean
- 8.
- HH_L0.1_magnitude
- 9.
- HH_L0.1_radius
- 10.
- HH_iit_L0.1_variance
- 11.
- HH_iit_L0.1_mean
- Baby Monitor:
- 1.
- HH_L3_pcc
- 2.
- HH_L0.1_magnitude
- 3.
- HH_L0.1_radius
- 4.
- HH_L0.1_pcc
- 5.
- HH_iit_L1_weight
- 6.
- HpHp_L3_magnitude
- 7.
- HpHp_L3_radius
- Doorbell
- 1.
- HH_L3_magnitude
- 2.
- HH_L1_std
- 3.
- HH_L1_radius
- 4.
- HH_L0.1_weight
- 5.
- HH_L0.1_mean
- 6.
- HH_L0.1_pcc
- 7.
- HH_L0.01_std
- 8.
- HH_iit_L3_mean
- 9.
- HH_iit_L1_weight
- 10.
- HH_iit_L0.1_variance
- 11.
- HpHp_L0.1_radius
- 12.
- HpHp_L0.01_magnitude
- Webcam
- 1.
- MI_dir_L0.1_mean
- 2.
- MI_dir_L0.01_mean
- 3.
- H_L5_variance
- 4.
- H_L0.1_mean
- 5.
- HH_L3_mean
- 6.
- HH_L3_pcc
- 7.
- HH_L0.1_pcc
- 8.
- HH_L0.01_radius
- 9.
- HpHp_L1_magnitude
- 10.
- HpHp_L0.1_radius
- 11.
- HpHp_L0.01_std
- Thermostat
- 1.
- HH_L3_weight
- 2.
- HH_L0.1_weight
- 3.
- HH_L0.1_radius
- 4.
- HH_iit_L1_weight
- 5.
- HpHp_L3_mean
7. Conclusions and Future Work
IoT botnet attacks are brutal due to several reasons, such as the rapid increase in the number of connected IoT devices, the vulnerability of these objects to security breaches, and the fact that the attacked devices may not show any symptoms of threat. This study aims to detect IoT botnet breaches by utilizing ant lion optimization, salp swarm optimization, and the proposed hybrid SSA–ALO algorithm. The results on the NN-BaIoT dataset demonstrated the efficiency of the SSA–ALO. The new hybrid algorithm proved its efficiency compared to six other algorithms in terms of the studied evaluation metrics for all IoT device types under study. In addition, it needed the least time to detect an attack. Meanwhile, it reduced the number of selected features. The hybrid SSA–ALO algorithm has an excellent trade-off between the global search and the local search. The algorithm can increase the solutions’ diversity and avoid premature convergence. For future work, we have a few ideas that can be investigated:
- Developing a parallel version of the hybrid SSA–ALO to work on a distributed framework.
- Using the proposed method on other applications such as those from genetic and microarray.
Author Contributions
These authors contributed equally to this work. All authors have read and agreed to the published version of the manuscript.
Funding
This research received no external funding.
Institutional Review Board Statement
Not applicable.
Informed Consent Statement
Not applicable.
Data Availability Statement
Not applicable.
Acknowledgments
The authors would like to acknowledge the support of Prince Sultan University for paying the Article Processing Charges (APC) of this publication.
Conflicts of Interest
The authors declare no conflict of interest.
References
- Alieyan, K.; Almomani, A.; Abdullah, R.; Almutairi, B.; Alauthman, M. Botnet and Internet of Things (IoTs): A Definition, Taxonomy, Challenges, and Future Directions. In Research Anthology on Combating Denial-of-Service Attacks; IGI Global: Hershey, PA, USA, 2021; pp. 138–150. [Google Scholar]
- Hamid, H.; Noor, R.M.; Omar, S.N.; Ahmedy, I.; Anjum, S.S.; Shah, S.A.A.; Kaur, S.; Othman, F.; Tamil, E.M. IoT-based botnet attacks systematic mapping study of literature. Scientometrics 2021, 126, 2759–2800. [Google Scholar] [CrossRef]
- Dange, S.; Chatterjee, M. IoT Botnet: The Largest Threat to the IoT Network. In Data Communication and Networks; Springer: Berlin/Heidelberg, Germany, 2020; pp. 137–157. [Google Scholar]
- Viriyasitavat, W.; Da Xu, L.; Bi, Z.; Hoonsopon, D. Blockchain technology for applications in internet of things—Mapping from system design perspective. IEEE Internet Things J. 2019, 6, 8155–8168. [Google Scholar] [CrossRef]
- Nguyen, H.T.; Ngo, Q.D.; Le, V.H. A novel graph-based approach for IoT botnet detection. Int. J. Inf. Secur. 2020, 19, 567–577. [Google Scholar] [CrossRef]
- Qaddoura, R.; Al-Zoubi, A.; Almomani, I.; Faris, H. A Multi-Stage Classification Approach for IoT Intrusion Detection Based on Clustering with Oversampling. Appl. Sci. 2021, 11, 3022. [Google Scholar] [CrossRef]
- Idrissi, I.; Boukabous, M.; Azizi, M.; Moussaoui, O.; El Fadili, H. Toward a deep learning-based intrusion detection system for IoT against botnet attacks. IAES Int. J. Artif. Intell. 2021, 10, 110. [Google Scholar]
- Qaddoura, R.; Al-Zoubi, A.M.; Faris, H.; Almomani, I. A Multi-Layer Classification Approach for Intrusion Detection in IoT Networks Based on Deep Learning. Sensors 2021, 21, 2987. [Google Scholar] [CrossRef] [PubMed]
- Aljarah, I.; Mafarja, M.; Heidari, A.A.; Faris, H.; Mirjalili, S. Multi-Verse Optimizer: Theory, Literature Review, and Application in Data Clustering; Nature-Inspired Optimizers: Berlin/Heidelberg, Germany, 2020; pp. 123–141. [Google Scholar]
- Faris, H.; Aljarah, I.; Al-Madi, N.; Mirjalili, S. Optimizing the learning process of feedforward neural networks using lightning search algorithm. Int. J. Artif. Intell. Tools 2016, 25, 1650033. [Google Scholar] [CrossRef]
- Mafarja, M.; Heidari, A.A.; Faris, H.; Mirjalili, S.; Aljarah, I. Dragonfly Algorithm: Theory, Literature Review, and Application in Feature Selection; Nature-Inspired Optimizers: Berlin/Heidelberg, Germany, 2020; pp. 47–67. [Google Scholar]
- Al Shorman, A.; Faris, H.; Aljarah, I. Unsupervised intelligent system based on one class support vector machine and Grey Wolf optimization for IoT botnet detection. J. Ambient. Intell. Humaniz. Comput. 2020, 11, 2809–2825. [Google Scholar] [CrossRef]
- Khurma, R.A.; Aljarah, I.; Sharieh, A.; Mirjalili, S. Evolopy-fs: An open-source nature-inspired optimization framework in python for feature selection. In Evolutionary Machine Learning Techniques; Springer: Berlin/Heidelberg, Germany, 2020; pp. 131–173. [Google Scholar]
- Pamukov, M.E.; Poulkov, V.K.; Shterev, V.A. Negative selection and neural network based algorithm for intrusion detection in iot. In Proceedings of the 2018 41st International Conference on Telecommunications and Signal Processing (TSP), Athens, Greece, 4–6 July 2018; pp. 1–5. [Google Scholar]
- Mehmood, A.; Mukherjee, M.; Ahmed, S.H.; Song, H.; Malik, K.M. NBC-MAIDS: Naïve Bayesian classification technique in multi-agent system-enriched IDS for securing IoT against DDoS attacks. J. Supercomput. 2018, 74, 5156–5170. [Google Scholar] [CrossRef]
- Xiao, L.; Wan, X.; Lu, X.; Zhang, Y.; Wu, D. IoT security techniques based on machine learning: How do IoT devices use AI to enhance security? IEEE Signal Process. Mag. 2018, 35, 41–49. [Google Scholar] [CrossRef]
- Shaikh, F.; Bou-Harb, E.; Crichigno, J.; Ghani, N. A machine learning model for classifying unsolicited iot devices by observing network telescopes. In Proceedings of the 2018 14th International Wireless Communications & Mobile Computing Conference (IWCMC), Limassol, Cyprus, 25–29 June 2018; pp. 938–943. [Google Scholar]
- Liu, L.; Xu, B.; Zhang, X.; Wu, X. An intrusion detection method for internet of things based on suppressed fuzzy clustering. EURASIP J. Wirel. Commun. Netw. 2018, 2018, 1–7. [Google Scholar] [CrossRef] [Green Version]
- Rathore, S.; Park, J.H. Semi-supervised learning based distributed attack detection framework for IoT. Appl. Soft Comput. 2018, 72, 79–89. [Google Scholar] [CrossRef]
- Moustafa, N.; Turnbull, B.; Choo, K.K.R. An ensemble intrusion detection technique based on proposed statistical flow features for protecting network traffic of internet of things. IEEE Internet Things J. 2018, 6, 4815–4830. [Google Scholar] [CrossRef]
- Hamamoto, A.H.; Carvalho, L.F.; Sampaio, L.D.H.; Abrão, T.; Proença, M.L., Jr. Network anomaly detection system using genetic algorithm and fuzzy logic. Expert Syst. Appl. 2018, 92, 390–402. [Google Scholar] [CrossRef]
- Bin Ahmad, M.; Akram, A.; Asif, M.; Ur-Rehman, S. Using genetic algorithm to minimize false alarms in insider threats detection of information misuse in windows environment. Math. Probl. Eng. 2014, 2014, 179109. [Google Scholar] [CrossRef]
- Hajimirzaei, B.; Navimipour, N.J. Intrusion detection for cloud computing using neural networks and artificial bee colony optimization algorithm. ICT Express 2019, 5, 56–59. [Google Scholar] [CrossRef]
- Ali, M.H.; Al Mohammed, B.A.D.; Ismail, A.; Zolkipli, M.F. A new intrusion detection system based on fast learning network and particle swarm optimization. IEEE Access 2018, 6, 20255–20261. [Google Scholar] [CrossRef]
- Selvakumar, B.; Muneeswaran, K. Firefly algorithm based feature selection for network intrusion detection. Comput. Secur. 2019, 81, 148–155. [Google Scholar]
- Panigrahi, A.; Patra, M.R. A Layered Approach to Network Intrusion Detection Using Rule Learning Classifiers with Nature-Inspired Feature Selection. In Progress in Computing, Analytics and Networking; Springer: Berlin/Heidelberg, Germany, 2018; pp. 215–223. [Google Scholar]
- Raza, S.; Wallgren, L.; Voigt, T. SVELTE: Real-time intrusion detection in the Internet of Things. Ad Hoc Netw. 2013, 11, 2661–2674. [Google Scholar] [CrossRef]
- Li, J.; Zhao, Z.; Li, R.; Zhang, H. Ai-based two-stage intrusion detection for software defined iot networks. IEEE Internet Things J. 2018, 6, 2093–2102. [Google Scholar] [CrossRef] [Green Version]
- Xue, Y.; Jia, W.; Zhao, X.; Pang, W. An evolutionary computation based feature selection method for intrusion detection. Secur. Commun. Netw. 2018, 2018, 2492956. [Google Scholar] [CrossRef]
- Popoola, E.; Adewumi, A.O. Efficient Feature Selection Technique for Network Intrusion Detection System Using Discrete Differential Evolution and Decision. IJ Netw. Secur. 2017, 19, 660–669. [Google Scholar]
- Guendouzi, W.; Boukra, A. GAB-BBO: Adaptive Biogeography Based Feature Selection Approach for Intrusion Detection. Int. J. Comput. Intell. Syst. 2017, 10, 914–935. [Google Scholar] [CrossRef] [Green Version]
- Gharaee, H.; Hosseinvand, H. A new feature selection IDS based on genetic algorithm and SVM. In Proceedings of the 2016 8th International Symposium on Telecommunications (IST), Tehran, Iran, 27–28 September 2016; pp. 139–144. [Google Scholar]
- Mirjalili, S.; Gandomi, A.H.; Mirjalili, S.Z.; Saremi, S.; Faris, H.; Mirjalili, S.M. Salp Swarm Algorithm: A bio-inspired optimizer for engineering design problems. Adv. Eng. Softw. 2017, 114, 163–191. [Google Scholar] [CrossRef]
- Mirjalili, S. The ant lion optimizer. Adv. Eng. Softw. 2015, 83, 80–98. [Google Scholar] [CrossRef]
- Meidan, Y.; Bohadana, M.; Mathov, Y.; Mirsky, Y.; Shabtai, A.; Breitenbacher, D.; Elovici, Y. N-baiot—Network-based detection of iot botnet attacks using deep autoencoders. IEEE Pervasive Comput. 2018, 17, 12–22. [Google Scholar] [CrossRef] [Green Version]
- Asuncion, A.; Newman, D. UCI Machine Learning Repository; University of California: Irvine, CA, USA, 2007. [Google Scholar]
- Domingues, R.; Filippone, M.; Michiardi, P.; Zouaoui, J. A comparative evaluation of outlier detection algorithms: Experiments and analyses. Pattern Recognit. 2018, 74, 406–421. [Google Scholar] [CrossRef]
Figure 1.
The chain of salps and the single salp.

Figure 2.
The ants and the ant lion.

Figure 3.
The proposed methodology diagram.

Figure 4.
Boxplots to represent clearly the results in Table 5 and Table 6. (a) TPR, (b) FPR, (c) G-mean.

Figure 5.
The convergence curves for SSA–ALO algorithm.

Figure 6.
G-mean results for the SSA–ALO and other algorithms.

Figure 7.
TPR results for the SSA–ALO and other algorithms.

Figure 8.
FPR results for the SSA–ALO and other algorithms.

Figure 9.
Time results for detecting attacks for the SSA–ALO and other algorithms.


Table 1.
N-BaIoT dataset main attack categories and record distribution.
| BASHLITE | Mirai | ||||||
|---|---|---|---|---|---|---|---|
| Scanning | Spamming | Flooding | Scanning | Flooding | |||
| Auto Scan | Junk | COMBO | TCP | UDP | Auto Scan | TCP | UDP |
| 255,111 | 261,789 | 515,156 | 859,850 | 946,366 | 537,979 | 1,377,120 | 1,753,303 |
| 255,111 | 776,945 | 1,806,216 | 537,979 | 3,130,423 | |||
Table 2.
The N-BaIoT dataset features.
| Value | Measure | Aggregated by | # Features |
|---|---|---|---|
| The size of outbound packets | Mean Variance | Source IP, Source MAC-IP, Channel, Socket | 8 |
| Packet count | Number | Source IP, Source MAC-IP, Channel, Socket | 4 |
| Packet jitter | Mean, Variance, Number | Channel | 3 |
| Packet size | Magnitude, Radius, Covariance, Correlation Coefficient | Channel Socket | 8 |
Table 3.
N-BaIoT dataset records according to IoT device and attack class.
| Model of Device | Type of Device | Benign | BASHLITE | Mirai | Tot Attacks | ||||||||
|---|---|---|---|---|---|---|---|---|---|---|---|---|---|
| Combo | Junk | Scan | TCP | UDP | Ack | Scan | Syn | UDP | UDPPlain | ||||
| Danmini | Doorbell | 40,395 | 59,718 | 29,068 | 29,849 | 92,141 | 105,874 | 102,195 | 107,685 | 122,573 | 237,665 | 81,982 | 968,750 |
| Ennio | Doorbell | 34,692 | 53,014 | 29,797 | 28,120 | 101,536 | 103,933 | 0 | 0 | 0 | 0 | 0 | 316,400 |
| Ecobee | Thermostat | 13,111 | 53,012 | 30,312 | 27,494 | 95,021 | 104,791 | 113,285 | 43,192 | 116,807 | 151,481 | 87,368 | 822,763 |
| Philips B120N/10 | Baby monitor | 160,137 | 58,152 | 28,349 | 27,859 | 92,581 | 105,782 | 91,123 | 103,621 | 118,128 | 217,034 | 80,808 | 923,437 |
| Provision PT-737E | Sec. camera | 55,169 | 61,380 | 30,898 | 29,297 | 104,510 | 104,011 | 60,554 | 96,781 | 65,746 | 156,248 | 56,681 | 766,106 |
| Provision PT-838 | Sec. camera | 91,555 | 57,530 | 29,068 | 28,397 | 89,387 | 104,658 | 57,997 | 97,096 | 61,851 | 158,608 | 53,785 | 738,377 |
| SH XCS7-1002-WHT | Sec. camera | 42,784 | 54,283 | 28,579 | 27,825 | 88,816 | 103,720 | 111,480 | 45,930 | 125,715 | 151,879 | 78,244 | 816,471 |
| SH XCS7-1003-WHT | Sec. camera | 17,936 | 59,398 | 27,413 | 28,572 | 98,075 | 102,980 | 107,187 | 43,674 | 122,479 | 157,084 | 84,436 | 831,298 |
| Samsung SNH 1011 N | Webcam | 46,817 | 58,669 | 28,305 | 27,698 | 97,783 | 110,617 | 0 | 0 | 0 | 0 | 0 | 323,072 |
| 502,596 | 515,156 | 261,789 | 255,111 | 859,850 | 946,366 | 643,821 | 537,979 | 733,299 | 1,229,999 | 523,304 | 6,506,674 | ||
Table 4.
The division of NN-BaIoT dataset into training, optimization, and testing stages.
| Device Type | Training | Optimization | Testing | ||
|---|---|---|---|---|---|
| No. of Benign Instances | No. of Benign Instances | No. of Malicious Instances | No. of Benign Instances | No. of Malicious Instances | |
| Baby monitor | 53,379 | 53,379 | 307,812 | 53,379 | 615,625 |
| Doorbell | 25,029 | 25,029 | 428,383 | 25,029 | 856,767 |
| Security camera | 69,148 | 69,148 | 1,050,750 | 69,148 | 2,101,502 |
| Thermostat | 4371 | 4370 | 274,254 | 4370 | 548,509 |
| Webcam | 15,607 | 15,605 | 107,690 | 15,605 | 215,382 |
Table 5.
TPR and FPR results.
| Device Type | SSA–ALO | SSA | ALO | IF [37] | LOF [37] | OCSVM [12] | GWO-OCSVM [12] | |||||||
|---|---|---|---|---|---|---|---|---|---|---|---|---|---|---|
| TPR | FPR | TPR | FPR | TPR | FPR | TPR | FPR | TPR | FPR | TPR | FPR | TPR | FPR | |
| Thermostat | 0.995 | 0.002 | 0.993 | 0.003 | 0.991 | 0.002 | 0.992 | 0.101 | 0.001 | 0.001 | 0.498 | 0.139 | 0.960 | 0.009 |
| Webcam | 0.999 | 0.022 | 0.999 | 0.145 | 0.999 | 0.169 | 0.999 | 0.692 | 0.001 | 0.001 | 0.999 | 0.186 | 0.999 | 0.037 |
| Baby monitor | 0.989 | 0.002 | 0.948 | 0.049 | 0.977 | 0.061 | 0.618 | 0.003 | 0.004 | 0.004 | 0.234 | 0.001 | 0.991 | 0.016 |
| Doorbell | 0.998 | 0.068 | 0.972 | 0.120 | 0.982 | 0.097 | 0.826 | 0.010 | 0.001 | 0.001 | 0.923 | 0.003 | 0.995 | 0.083 |
| Security camera | 0.974 | 0.051 | 0.831 | 0.039 | 0.836 | 0.027 | 0.999 | 0.419 | 0.001 | 0.001 | 0.813 | 0.039 | 0.982 | 0.098 |
| Average | 0.991 | 0.029 | 0.949 | 0.071 | 0.957 | 0.071 | 0.887 | 0.245 | 0.002 | 0.002 | 0.693 | 0.074 | 0.985 | 0.489 |
Table 6.
G-mean results.
| Device Type | G-Mean | ||||||
|---|---|---|---|---|---|---|---|
| SSA–ALO | SSA | ALO | IF [37] | LOF [37] | OCSVM [12] | GWO-OCSVM [12] | |
| Thermostat | 0.996 | 0.995 | 0.994 | 0.944 | 0.032 | 0.655 | 0.975 |
| Webcam | 0.988 | 0.924 | 0.911 | 0.555 | 0.032 | 0.902 | 0.981 |
| Baby monitor | 0.993 | 0.949 | 0.958 | 0.785 | 0.063 | 0.479 | 0.987 |
| Doorbell | 0.964 | 0.925 | 0.942 | 0.904 | 0.032 | 0.959 | 0.956 |
| Security camera | 0.961 | 0.894 | 0.901 | 0.762 | 0.032 | 0.884 | 0.941 |
| Average | 0.984 | 0.952 | 0.931 | 0.789 | 0.099 | 0.776 | 0.968 |
Table 7.
Average time for detecting attack on NN-BaIoT dataset.
| Device Type | Average Detection Time (s) | ||||||
|---|---|---|---|---|---|---|---|
| SSA–ALO | SSA | ALO | IF [37] | LOF [37] | OCSVM [12] | GWO-OCSVM [12] | |
| Thermostat | 0.035 | 0.390 | 0.420 | 3.325 | 1.107 | 0.087 | 0.047 |
| Webcam | 0.091 | 0.821 | 0.199 | 11.589 | 2.875 | 0.406 | 0.156 |
| Baby monitor | 0.433 | 0.749 | 0.552 | 49.698 | 33.317 | 1.889 | 0.622 |
| Doorbell | 1.447 | 1.963 | 2.331 | 18.208 | 7.753 | 1.570 | 1.099 |
| Security camera | 22.659 | 29.856 | 31.588 | 42.398 | 29.579 | 36.549 | 27.837 |
Publisher’s Note: MDPI stays neutral with regard to jurisdictional claims in published maps and institutional affiliations. |
© 2021 by the authors. Licensee MDPI, Basel, Switzerland. This article is an open access article distributed under the terms and conditions of the Creative Commons Attribution (CC BY) license (https://creativecommons.org/licenses/by/4.0/).
Share and Cite
MDPI and ACS Style
Abu Khurma, R.; Almomani, I.; Aljarah, I. IoT Botnet Detection Using Salp Swarm and Ant Lion Hybrid Optimization Model. Symmetry 2021, 13, 1377. https://doi.org/10.3390/sym13081377
AMA Style
Abu Khurma R, Almomani I, Aljarah I. IoT Botnet Detection Using Salp Swarm and Ant Lion Hybrid Optimization Model. Symmetry. 2021; 13(8):1377. https://doi.org/10.3390/sym13081377
Chicago/Turabian StyleAbu Khurma, Ruba, Iman Almomani, and Ibrahim Aljarah. 2021. "IoT Botnet Detection Using Salp Swarm and Ant Lion Hybrid Optimization Model" Symmetry 13, no. 8: 1377. https://doi.org/10.3390/sym13081377
Note that from the first issue of 2016, this journal uses article numbers instead of page numbers. See further details here.