
Increasing Temperature Alters the Effects of Extracellular Copper on Thalassiosira Pseudonana Physiology and Transcription

Abstract
:1. Introduction
2. Materials & Methods
2.1. Cell Culture and Experimental Design
2.2. Growth Rates
2.3. Pigments and Chlorophyll Fluorescence Parameters
2.4. Intracellular Copper
2.5. Intracellular POC, PON, POP and BSi
2.6. RNA Extraction and Quantitative Real-Time PCR
2.7. Data analysis
3. Results
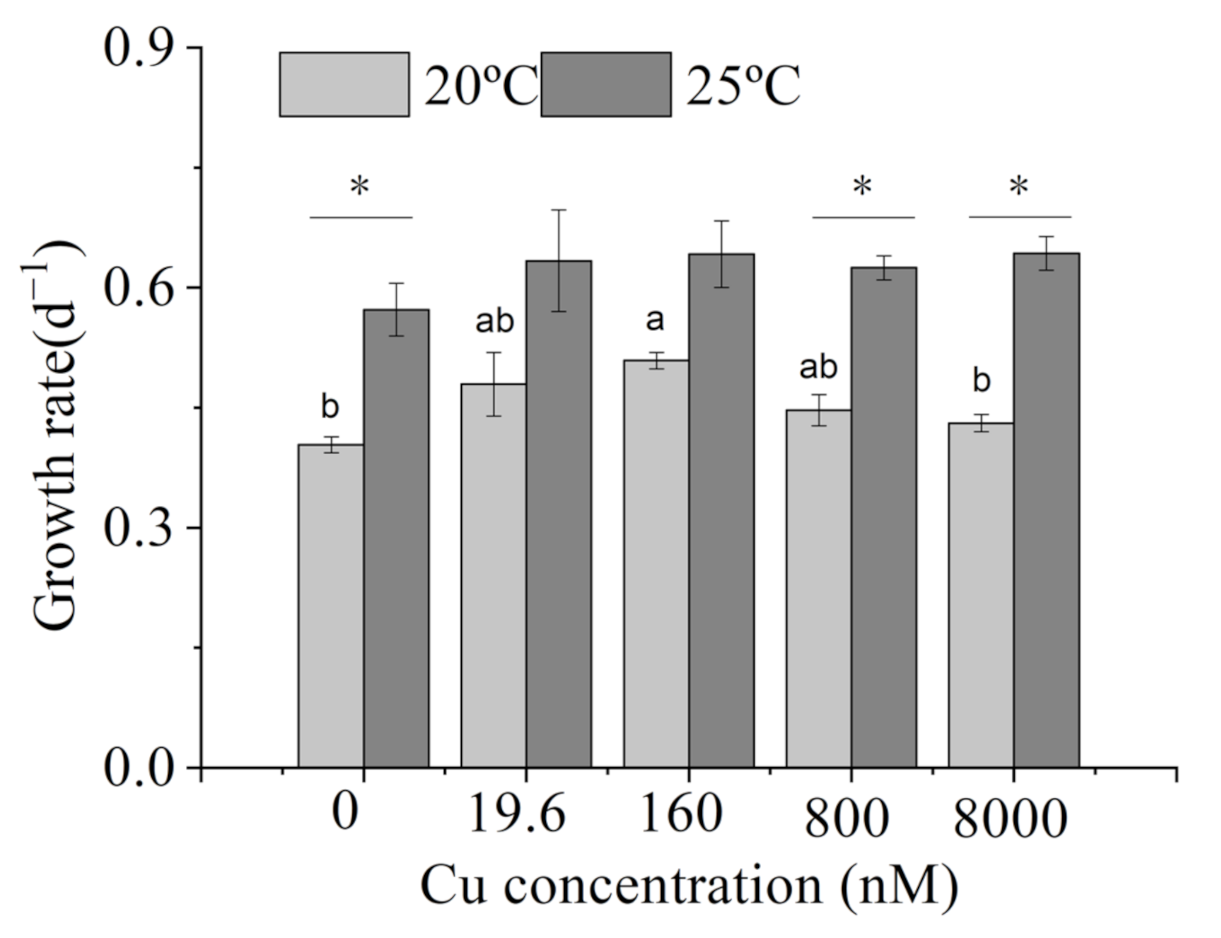
3.1. Growth Rates
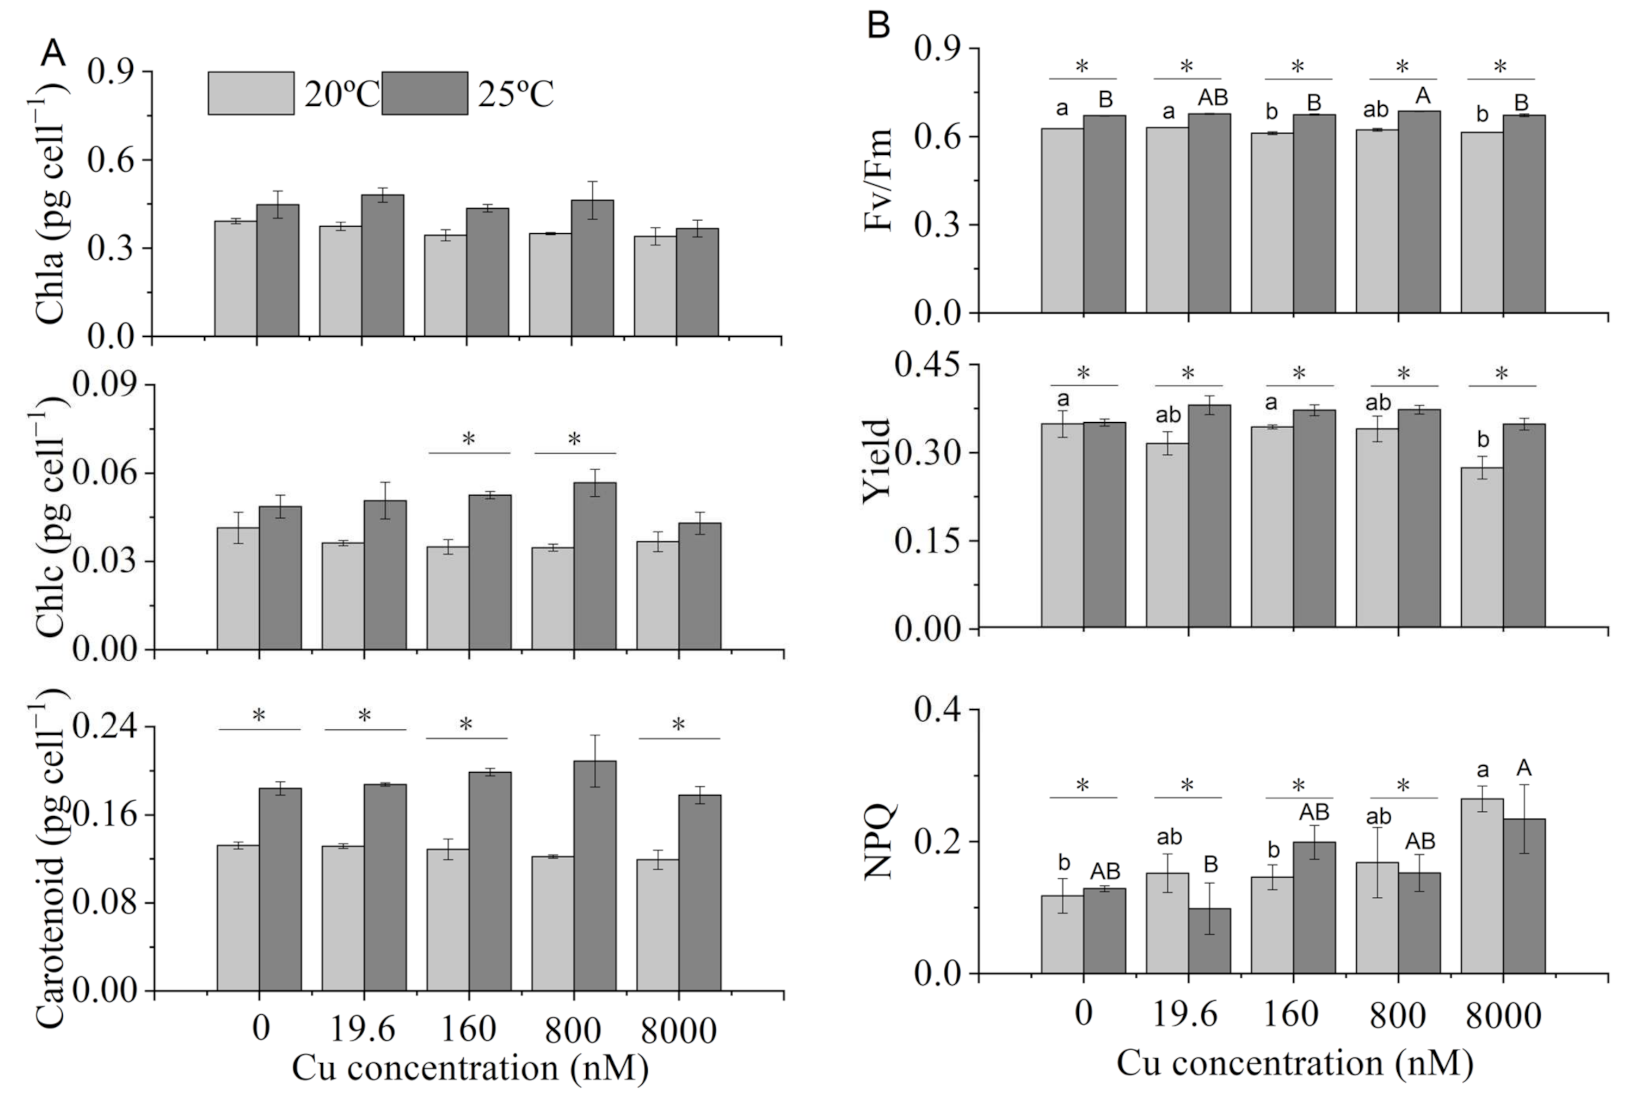
3.2. Pigments and Chlorophyll Fluorescence Parameters
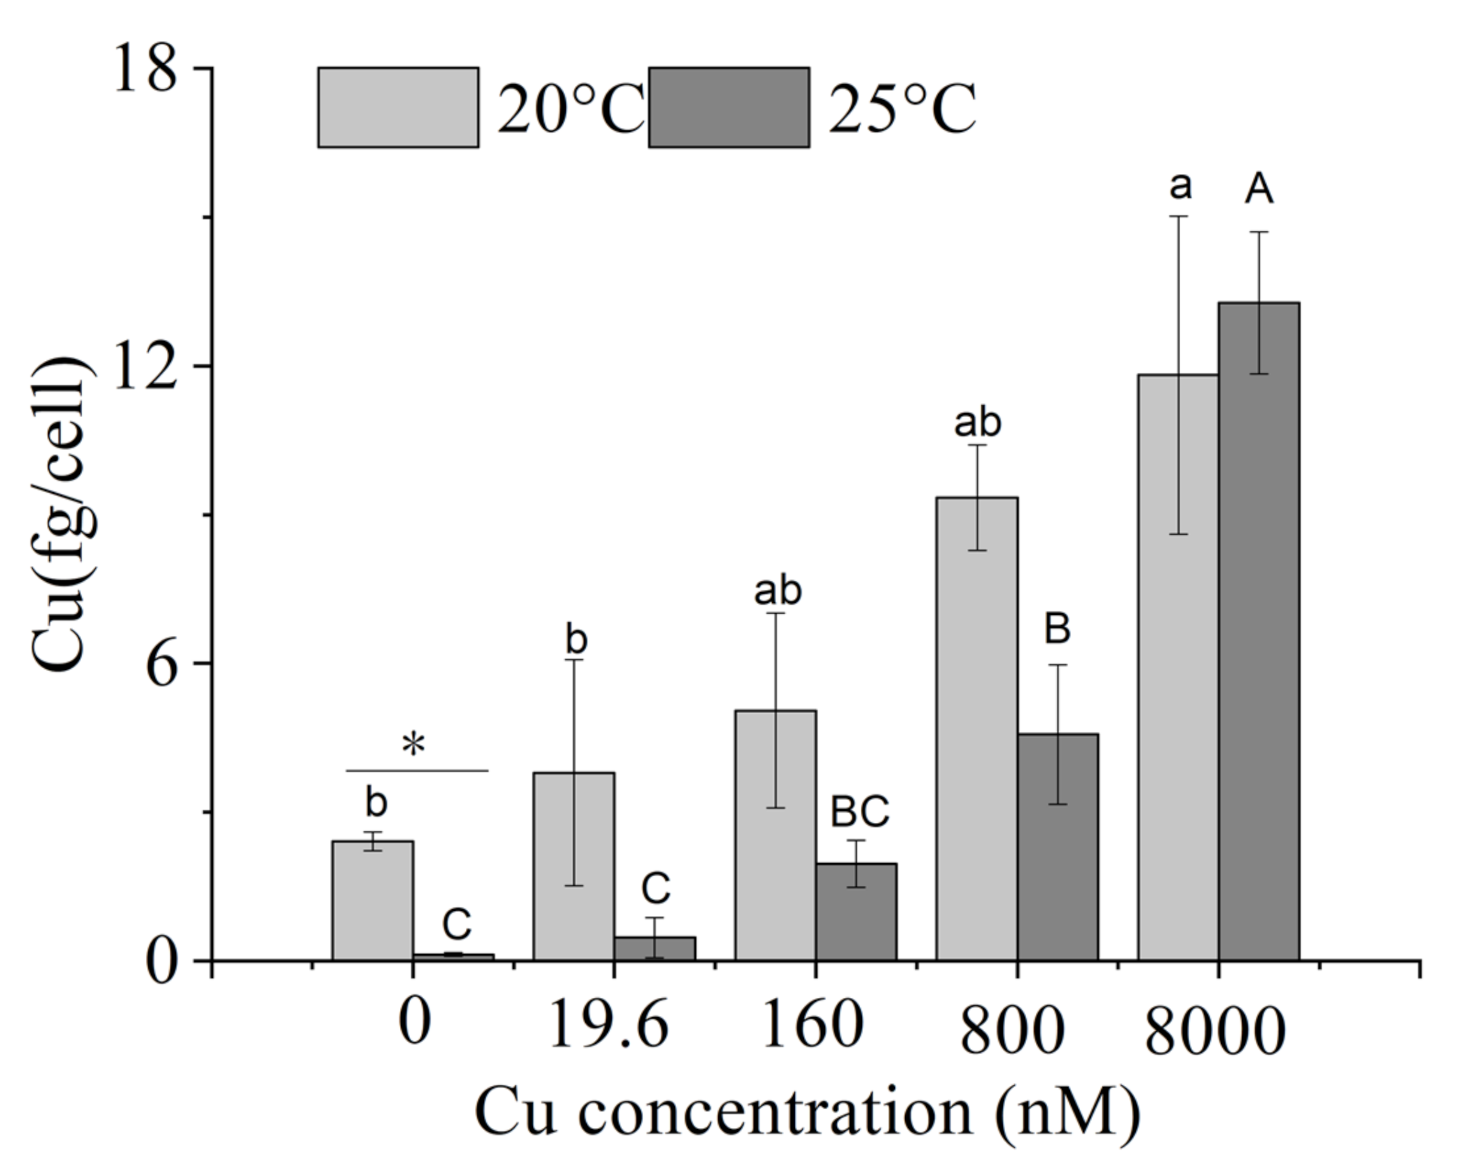
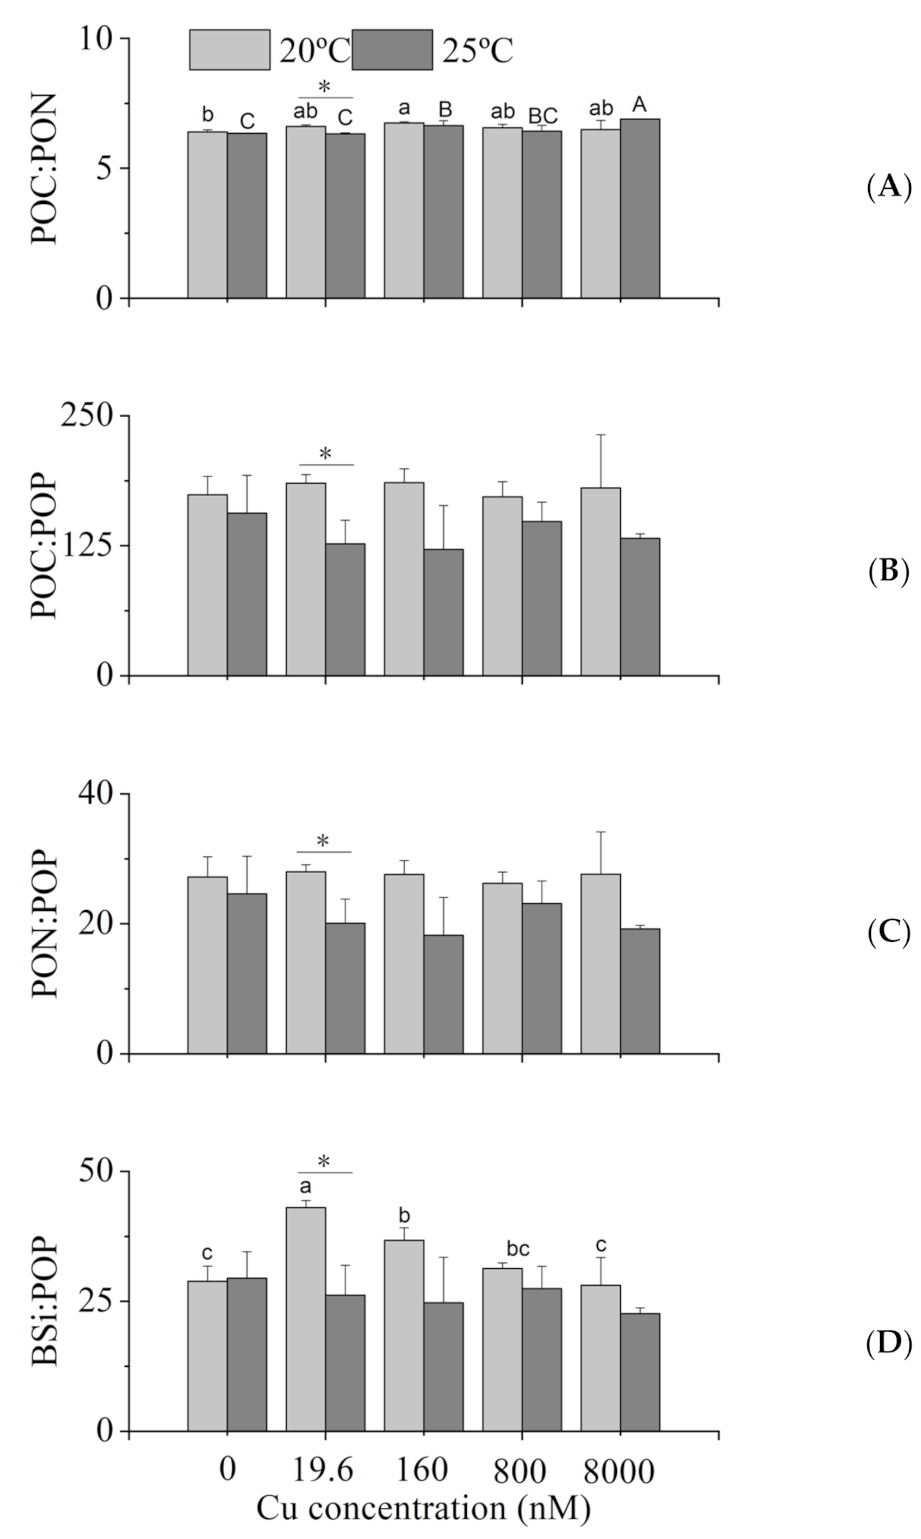
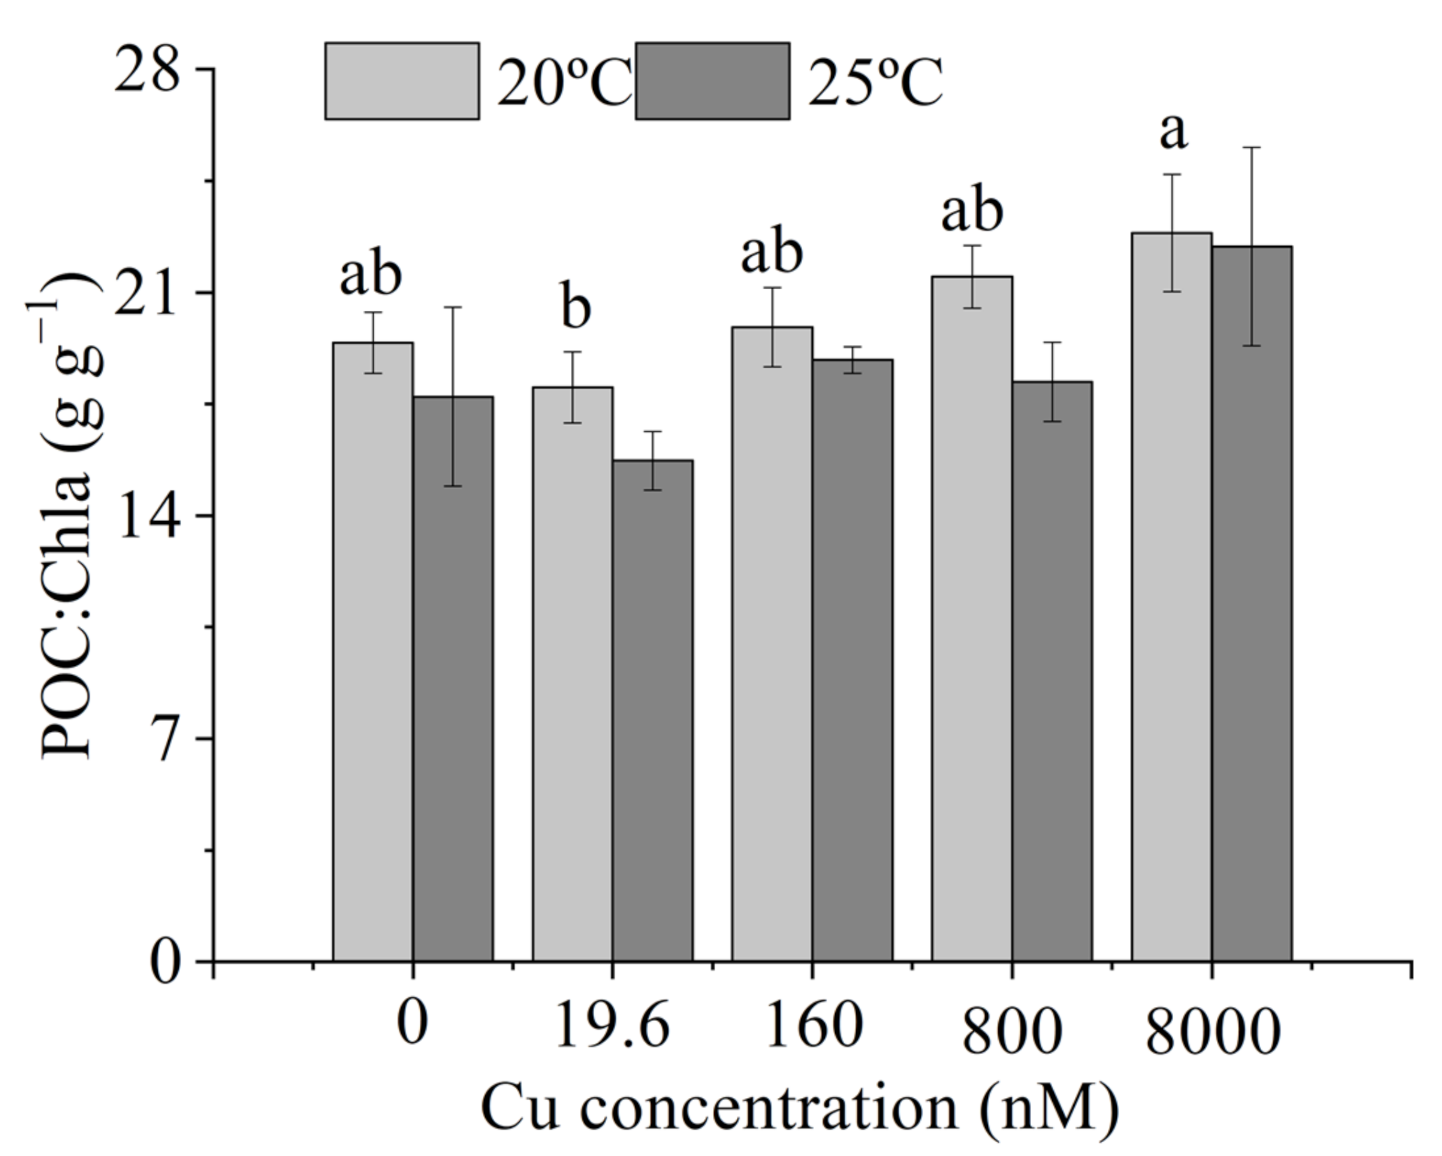
3.3. Intracellular Elemental Contents
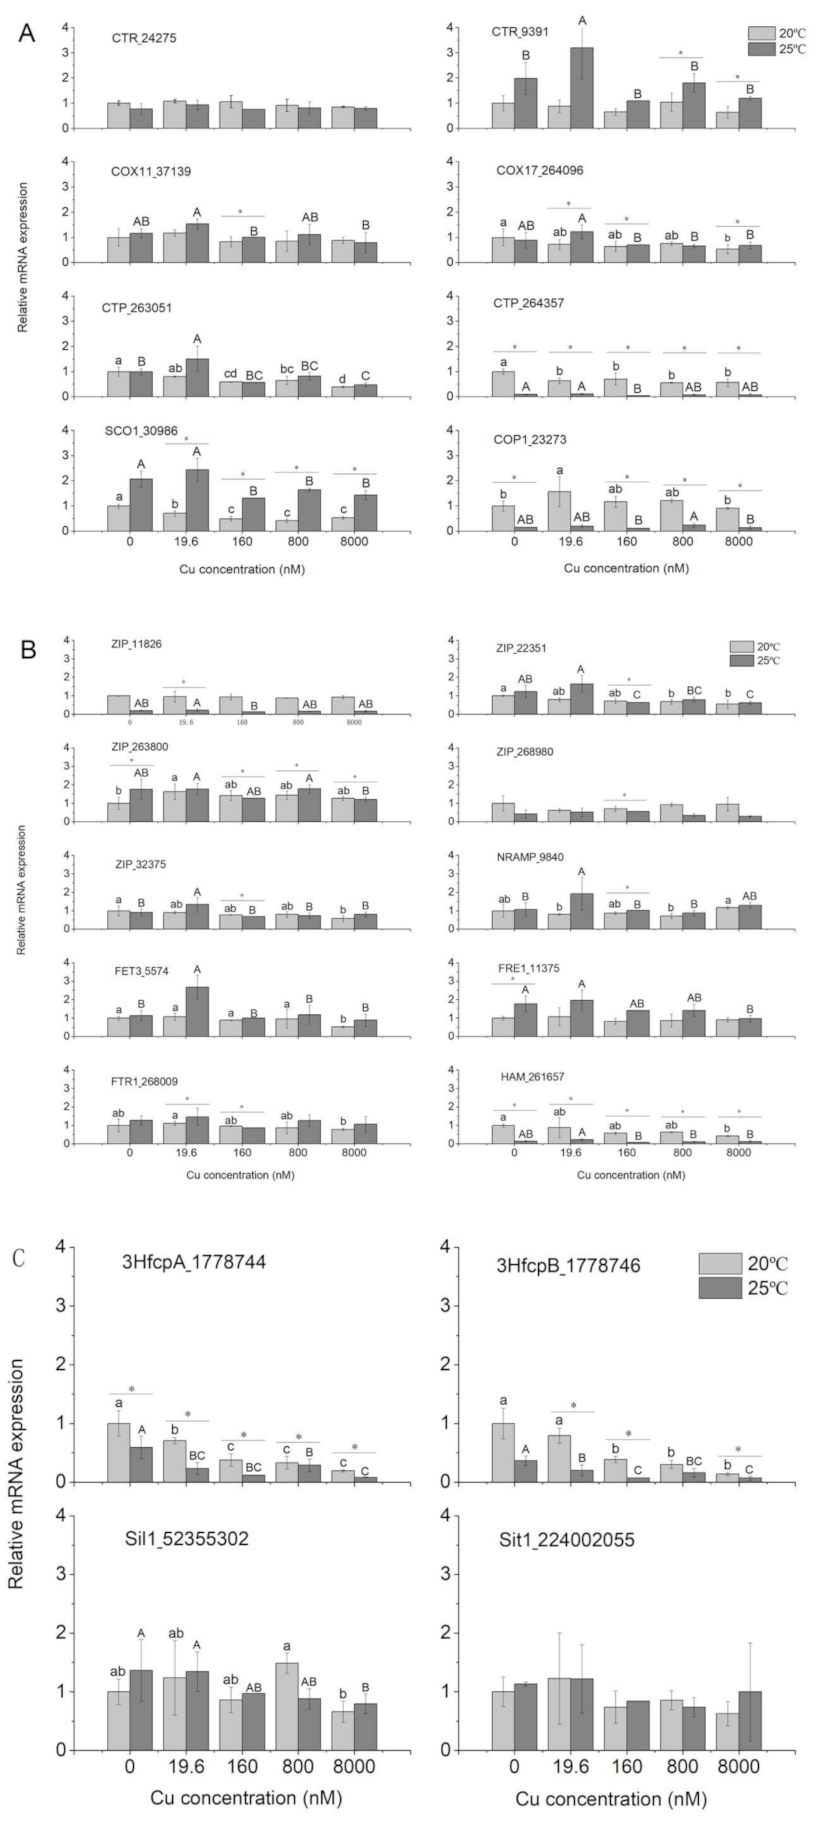
3.4. Gene Expression
4. Discussion
4.1. Growth Rates
4.2. Chlorophyll Fluorescence Parameters
4.3. Intracellular Elemental Contents
4.4. Gene Expression
5. Conclusions
Supplementary Materials
Author Contributions
Funding
Institutional Review Board Statement
Informed Consent Statement
Data Availability Statement
Acknowledgments
Conflicts of Interest
References
- Raven, J.A.; Evans, M.C.W.; Korb, R.E. The role of trace metals in photosynthetic electron transport in O 2 -evolving organisms. Photosynth. Res. 1999, 60, 111–150. [Google Scholar] [CrossRef]
- Peers, G.; Quesnel, S.A.; Price, N.M. Copper requirements for iron acquisition and growth of coastal and oceanic diatoms. Limnol. Oceanogr. 2005, 50, 1149–1158. [Google Scholar] [CrossRef]
- Blabyhaas, C.E.; Merchant, S.S. Regulating cellular trace metal economy in algae. Curr. Opin. Plant Biol. 2017, 39, 88–96. [Google Scholar] [CrossRef] [Green Version]
- Graham, P.; Price, N.M. Copper-containing plastocyanin used for electron transport by an oceanic diatom. Nature 2006, 441, 341. [Google Scholar]
- Kropat, J.; Gallaher, S.D.; Urzica, E.I.; Nakamoto, S.S.; Strenkert, D.; Tottey, S.; Mason, A.Z.; Merchant, S.S. Copper economy in Chlamydomonas: Prioritized allocation and reallocation of copper to respiration vs. photosynthesis. Proc. Natl. Acad. Sci. USA 2015, 112, 2644–2651. [Google Scholar] [CrossRef] [PubMed] [Green Version]
- Annett, A.L.; Lapi, S.; Ruth, T.J.; Maldonado, M.T. The effects of Cu and Fe availability on the growth and Cu : C ratios of marine diatoms. Limnol. Oceanogr. 2008, 53, 2451–2461. [Google Scholar] [CrossRef] [Green Version]
- Guo, J.; Lapi, S.; Ruth, T.J.; Maldonado, M.T. The effects of iron and copper availability on the copper stoichiometry of marine phytoplankton1. J. Phycol. 2012, 48, 312–325. [Google Scholar] [CrossRef]
- Brand, L.E.; Sunda, W.G.; Guillard, R.R.L. Reduction of marine phytoplankton reproduction rates by copper and cadmium. J. Exp. Mar. Biol. Ecol. 1986, 96, 225–250. [Google Scholar] [CrossRef]
- Sunda, W.G. The Relationship Between Cupric Ion Activity and the Toxicity of Copper to Phytoplankton. J. Mar. Res. 1975. [Google Scholar] [CrossRef]
- Kong, L.; Price, N.M. Functional CTR-type Cu(I) transporters in an oceanic diatom. Environ. Microbiol. 2019, 21, 98–110. [Google Scholar] [CrossRef] [Green Version]
- Manimaran, K.; Karthikeyan, P.; Ashokkumar, S.; Prabu, V.A.; Sampathkumar, P. Effect of Copper on Growth and Enzyme Activities of Marine Diatom, Odontella mobiliensis. Bull. Environ. Contam. Toxicol. 2012, 88, 30–37. [Google Scholar] [CrossRef]
- Nguyen-Deroche, T.L.N.; Le, T.T.; Bui, T.V.; Rince, Y.; Tremblin, G.; Morant-Manceau, A. Effects of copper on growth and photosynthesis in marine diatoms: A comparison between species from two different geographical areas. Cryptogam. Algol. 2009, 30, 97–109. [Google Scholar]
- Harrison, W.G.; Eppley, R.W.; Renger, E.H. Phytoplankton Nitrogen Metabolism, Nitrogen Budgets, and Observations on Copper Toxicity: Controlled Ecosystem Pollution Experiment. Bull. Mar. Sci. Miami 1977, 27, 44–57. [Google Scholar]
- Jgjr, R.; Chisholm, S.W.; Fmm, M. Effects of copper toxicity on silicic acid uptake and growth in Thalassiorsira Pseudonana. J. Phycol. 2010, 17, 270–278. [Google Scholar]
- Moore, C.M.; Mills, M.M.; Arrigo, K.R.; Bermanfrank, I.; Bopp, L.; Boyd, P.W.; Galbraith, E.D.; Geider, R.J.; Guieu, C.; Jaccard, S.L. Processes and patterns of oceanic nutrient limitation. Nat. Geosci. 2013, 6, 701–710. [Google Scholar] [CrossRef] [Green Version]
- Smith, A.D.; Logeman, B.L.; Thiele, D.J. Copper Acquisition and Utilization in Fungi. Annu. Rev. Microbiol. 2017, 71, 597. [Google Scholar] [CrossRef] [PubMed]
- Leung, P.T.; Yi, A.X.; Ip, J.C.; Mak, S.S.; Leung, K.M. Photosynthetic and transcriptional responses of the marine diatom Thalassiosira pseudonana to the combined effect of temperature stress and copper exposure. Mar. Pollut. Bull. 2017, 124, 938–945. [Google Scholar] [CrossRef]
- Twining, B.S.; Baines, S.B. The Trace Metal Composition of Marine Phytoplankton. In Annual Review of Marine Science; Carlson, C.A., Giovannoni, S.J., Eds.; Annual Review of Marine Science; Annual Reviews: Palo Alto, CA, USA, 2013; Volume 5, pp. 191–215. [Google Scholar]
- Falkowski, P.G.; Barber, R.T.; Smetacek, V.V. Biogeochemical Controls and Feedbacks on Ocean Primary Production. Science 1998, 281, 200–207. [Google Scholar] [CrossRef] [PubMed] [Green Version]
- Field, C.B.; Behrenfeld, M.J.; Randerson, J.T.; Falkowski, P. Primary production of the biosphere: Integrating terrestrial and oceanic components. Science 1998, 281, 237–240. [Google Scholar] [CrossRef] [Green Version]
- Davis, A.K.; Hildebrand, M.; Palenik, B. Gene Expression Induced by Copper Stress in the Diatom Thalassiosira pseudonana. Eukaryot. Cell 2006, 5, 1157. [Google Scholar] [CrossRef] [Green Version]
- Bao, V.W.; Leung, K.M.; Qiu, J.W.; Lam, M.H. Acute toxicities of five commonly used antifouling booster biocides to selected subtropical and cosmopolitan marine species. Mar. Pollut. Bull. 2011, 62, 1147–1151. [Google Scholar] [CrossRef]
- Guo, R.; Lee, M.A.; Ki, J.S. Different transcriptional responses of heat shock protein 70/90 in the marine diatom Ditylum brightwellii exposed to metal compounds and endocrine-disrupting chemicals. Chemosphere 2013, 92, 535–543. [Google Scholar] [CrossRef]
- Lürling, M.; Eshetu, F.; Faassen, E.J.; Kosten, S.; Huszar, V.L.M. Comparison of cyanobacterial and green algal growth rates at different temperatures. Freshw. Biol. 2013, 58, 552–559. [Google Scholar] [CrossRef]
- Wang, D.; Xia, W.; Kumar, K.S.; Gao, K. Increasing copper alters cellular elemental composition (Moand P) of marine diatom. Ecol. Evol. 2017, 7, 3362–3371. [Google Scholar] [CrossRef]
- Garcia, N.S.; Sexton, J.; Riggins, T.; Brown, J.; Lomas, M.W.; Martiny, A.C. High Variability in Cellular Stoichiometry of Carbon, Nitrogen, and Phosphorus Within Classes of Marine Eukaryotic Phytoplankton Under Sufficient Nutrient Conditions. Front. Microbiol. 2018, 9, 543. [Google Scholar] [CrossRef] [PubMed] [Green Version]
- Zhou, G.J.; Wang, Z.; Lau, E.T.C.; Xu, X.R.; Leung, K.M.Y. Can we predict temperature-dependent chemical toxicity to marine organisms and set appropriate water quality guidelines for protecting marine ecosystems under different thermal scenarios? Mar. Pollut. Bull. 2014, 87, 11–21. [Google Scholar] [CrossRef] [PubMed]
- Morin, S.; Lambert, A.S.; Rodriguez, E.P.; Dabrin, A.; Coquery, M.; Pesce, S. Changes in copper toxicity towards diatom communities with experimental warming. J. Hazard. Mater. 2017, 334, 223. [Google Scholar] [CrossRef] [Green Version]
- Wang, M.J.; Wang, W.X. Temperature-dependent sensitivity of a marine diatom to cadmium stress explained by subcelluar distribution and thiol synthesis. Environ. Sci. Technol. 2008, 42, 8603. [Google Scholar] [CrossRef]
- Van, H.A.; Ward, D.M.; Kaplan, J. Transition metal transport in yeast. Annu. Rev. Microbiol. 2002, 56, 237–261. [Google Scholar] [CrossRef]
- Pilon, M.; Abdel-Ghany, S.E.; Cohu, C.M.; Gogolin, K.A.; Ye, H. Copper cofactor delivery in plant cells. Curr. Opin. Plant Biol. 2006, 9, 256–263. [Google Scholar] [CrossRef]
- Knauer, K.; Behra, R.; Sigg, L. Adsorption and uptake of copper by the green alga scenedesmus subspicatus (chlorophyta). J. Phycol. 1997, 33, 596–601. [Google Scholar] [CrossRef]
- Guo, J.; Annett, A.L.; Taylor, R.L.; Lapi, S.; Ruth, T.J.; Maldonado, M.T. Copper-uptake kinetics of coastal and oceanic diatoms¹. J. Phycol. 2010, 46, 1218–1228. [Google Scholar] [CrossRef]
- Ritchie, R.J. Consistent sets of spectrophotometric chlorophyll equations for acetone, methanol and ethanol solvents. Photosynth. Res. 2006, 89, 27–41. [Google Scholar] [CrossRef]
- BRÄUTIGAM, A.; Schaumlöffel, D.; Preud’Homme, H.; Thondorf, I.; Wesenberg, D. Physiological characterization of cadmium-exposed Chlamydomonas reinhardtii. Plant Cell Environ. 2011, 34, 2071–2082. [Google Scholar] [CrossRef]
- Paasche, E. Silicon and the ecology of marine plankton diatoms. I. Thalassiosira pseudonana ( Cyclotella nana ) grown in a chemostat with silicate as limiting nutrient. Mar. Biol. 1973, 19, 117–126. [Google Scholar] [CrossRef]
- Solorzano, L.; Sharp, J.H. Determination of Total Dissolved Phosphorus and Particulate Phosphorus in Natural Waters. Limnol. Oceanogr. 1980, 25, 754–758. [Google Scholar] [CrossRef]
- Poong, S.W.; Lim, P.E.; Lai, J.W.S.; Phang, S.M. Optimization of high quality total RNA isolation from the microalga, Chlorella sp (Trebouxiophyceae, Chlorophyta) for next-generation sequencing. Phycol. Res. 2017, 65, 146–150. [Google Scholar] [CrossRef]
- Kustka, A.B.; Allen, A.E.; Morel, F.M.M. Sequence analysis and transcriptional regulation of iron acquisition genes in two marine diatoms. J. Phycol. 2007, 43, 715–729. [Google Scholar] [CrossRef]
- Guo, J.; Green, B.R.; Maldonado, M.T. Sequence Analysis and Gene Expression of Potential Components of Copper Transport and Homeostasis in Thalassiosira pseudonana. Protist 2015, 166, 58–77. [Google Scholar] [CrossRef]
- Pfaffl, M.W. A new mathematical model for relative quantification in real-time RT-PCR. Nucleic Acids Res. 2001, 29, e45. [Google Scholar] [CrossRef]
- Bopp, S.K.; Lettieri, T. Gene regulation in the marine diatom Thalassiosira pseudonana upon exposure to polycyclic aromatic hydrocarbons (PAHs). Gene 2007, 396, 293–302. [Google Scholar] [CrossRef] [PubMed]
- Bao, V.W.W.; Leung, K.M.Y.; Kwok, K.W.H.; Zhang, A.Q.; Lui, G.C.S. Synergistic toxic effects of zinc pyrithione and copper to three marine species: Implications on setting appropriate water quality criteria. Mar. Pollut. Bull. 2008, 57, 616–623. [Google Scholar] [CrossRef]
- Biswas, H.; Bandyopadhyay, D.; Waite, A. Copper addition helps alleviate iron stress in a coastal diatom: Response of Chaetoceros gracilis from the Bay of Bengal to experimental Cu and Fe addition. Mar. Chem. 2013, 157, 224–232. [Google Scholar] [CrossRef]
- Jordi, A.; Basterretxea, G.; Tovarsánchez, A.; Alastuey, A.; Querol, X. Copper aerosols inhibit phytoplankton growth in the Mediterranean Sea. Proc. Natl. Acad. Sci. USA 2012, 109, 21246–21249. [Google Scholar] [CrossRef] [Green Version]
- Lombardi, A.T.; Maldonado, M.T. The effects of copper on the photosynthetic response of Phaeocystis cordata. Photosynth. Res. 2011, 108, 77–87. [Google Scholar] [CrossRef]
- Schaum, C.E.; Buckling, A.; Smirnoff, N.; Studholme, D.; Yvondurocher, G. Environmental fluctuations accelerate molecular evolution of thermal tolerance in a marine diatom. Nat. Commun. 2018, 9, 1719. [Google Scholar] [CrossRef] [PubMed] [Green Version]
- Boyd, P.W.; Dillingham, P.W.; McGraw, C.M.; Armstrong, E.A.; Cornwall, C.E.; Feng, Y.Y.; Hurd, C.L.; Gault-Ringold, M.; Roleda, M.Y.; Timmins-Schiffman, E.; et al. Physiological responses of a Southern Ocean diatom to complex future ocean conditions. Nat. Clim. Chang. 2016, 6, 207–213. [Google Scholar] [CrossRef]
- Schaum, C.E.; Barton, S.; Bestion, E.; Buckling, A.; Garcia-Carreras, B.; Lopez, P.; Lowe, C.; Pawar, S.; Smirnoff, N.; Trimmer, M. Adaptation of phytoplankton to a decade of experimental warming linked to increased photosynthesis. Nat. Ecol. Evol. 2017, 1, 94. [Google Scholar] [CrossRef]
- Larras, F.; Lambert, A.S.; Pesce, S.; Rimet, F.; Bouchez, A.; Montuelle, B. The effect of temperature and a herbicide mixture on freshwater periphytic algae. Ecotoxicol. Environ. Saf. 2013, 98, 162–170. [Google Scholar] [CrossRef]
- Levy, J.L.; Angel, B.M.; Stauber, J.L.; Poon, W.L.; Simpson, S.L.; Cheng, S.H.; Jolley, D.F. Uptake and internalisation of copper by three marine microalgae: Comparison of copper-sensitive and copper-tolerant species. Aquat. Toxicol. 2008, 89, 82–93. [Google Scholar] [CrossRef] [Green Version]
- Debelius, B.; Forja, J.M.; Delvalls, A.; Lubián, L.M. Toxicity and bioaccumulation of copper and lead in five marine microalgae. Ecotoxicol. Environ. Saf. 2009, 72, 1503–1513. [Google Scholar] [CrossRef]
- Laroche, J. Redfield revisited: Variability of C[ratio]N[ratio]P in marine microalgae and its biochemical basis. Eur. J. Phycol. 2002, 37, 1–17. [Google Scholar]
- Reay, D.S.; Nedwell, D.B.; Priddle, J.; Ellis-Evans, J.C. Temperature dependence of inorganic nitrogen uptake: Reduced affinity for nitrate at suboptimal temperatures in both algae and bacteria. Appl. Environ. Microbiol 1999, 65, 2577–2584. [Google Scholar] [CrossRef] [PubMed] [Green Version]
- Lomas, M.W.; Glibert, P.M. Temperature Regulation of Nitrate Uptake: A Novel Hypothesis about Nitrate Uptake and Reduction in Cool-Water Diatoms. Limnol. Oceanogr. 1999, 44, 556–572. [Google Scholar] [CrossRef]
- Zhu, Z.; Qu, P.; Fu, F.; Tennenbaum, N.; Tatters, A.O.; Hutchins, D.A. Understanding the blob bloom: Warming increases toxicity and abundance of the harmful bloom diatom Pseudo-nitzschia in California coastal waters. Harmful Algae 2017, 67, 36. [Google Scholar] [CrossRef] [PubMed]
- Spilling, K.; Ylostalo, P.; Simis, S.; Seppala, J. Interaction Effects of Light, Temperature and Nutrient Limitations (N, P and Si) on Growth, Stoichiometry and Photosynthetic Parameters of the Cold-Water Diatom Chaetoceros wighamii. PLoS ONE 2015, 10, e0126308. [Google Scholar] [CrossRef] [PubMed] [Green Version]
- Yu, J.; Wang, P.; Wang, Y.; Chang, J.; Deng, S.; Wei, W. Thermal constraints on growth, stoichiometry and lipid content of different groups of microalgae with bioenergy potential. J. Appl. Phycol. 2018, 30, 1503–1512. [Google Scholar] [CrossRef]
- Bi, R.; Ismar, S.; Sommer, U.; Zhao, M. Environmental dependence of the correlations between stoichiometric and fatty acid-based indicators of phytoplankton nutritional quality. Limnol. Oceanogr. 2017, 62, 334–347. [Google Scholar] [CrossRef]
- Padfield, D.; Yvon-Durocher, G.; Buckling, A.; Jennings, S.; Yvon-Durocher, G.; Hillebrand, H. Rapid evolution of metabolic traits explains thermal adaptation in phytoplankton. Ecol. Lett. 2016, 19, 133–142. [Google Scholar] [CrossRef] [Green Version]
- Hillebrand, H.; Steinert, G.; Boersma, M.; Malzahn, A.M.; Meunier, C.L.; Plum, C.; Patcnik, R. Goldman revisited: Faster-growing phytoplankton has lower N : P and lower stoichiometric flexibility. Limnol. Oceanogr. 2013, 58, 2076–2088. [Google Scholar] [CrossRef]
- Geider, R.J. Light and temperature dependence of the carbon to chlorophyll a ratio in microalgae and cyanobacteria: Implications for physiology and growth of phytoplankton. New Phytol. 1987, 106, 1–34. [Google Scholar] [CrossRef]
- Xiu, P.; Chai, F. Spatial and temporal variability in phytoplankton carbon, chlorophyll, and nitrogen in the North Pacific. J. Geophys. Res. Ocean. 2012, 117, C11023. [Google Scholar] [CrossRef]
- Banting, G.S.; Glerum, D.M. Mutational analysis of the Saccharomyces cerevisiae cytochrome c oxidase assembly protein Cox11p. Eukaryot. Cell 2006, 5, 568–578. [Google Scholar] [CrossRef] [Green Version]
- Khalimonchuk, O.; Ostermann, K.; Rodel, G. Evidence for the association of yeast mitochondrial ribosomes with Cox11p, a protein required for the Cu-B site formation of cytochrome c oxidase. Curr. Genet. 2005, 47, 223–233. [Google Scholar] [CrossRef] [PubMed]
- Chojnacka, M.; Gornicka, A.; Oeljeklaus, S.; Warscheid, B.; Chacinska, A. Cox17 Protein Is an Auxiliary Factor Involved in the Control of the Mitochondrial Contact Site and Cristae Organizing System. J. Biol. Chem. 2015, 290, 15304–15312. [Google Scholar] [CrossRef] [PubMed] [Green Version]
- Horng, Y.C.; Cobine, P.A.; Maxfield, A.B.; Carr, H.S.; Winge, D.R. Specific copper transfer from the Cox17 metallochaperone to both Sco1 and Cox11 in the assembly of yeast cytochrome c oxidase. J. Biol. Chem. 2004, 279, 35334–35340. [Google Scholar] [CrossRef] [PubMed] [Green Version]
- Silva-Bailao, M.G.; da Silva, K.L.P.; dos Anjos, L.R.B.; Lima, P.D.; Teixeira, M.D.; Soares, C.M.D.; Bailao, A.M. Mechanisms of copper and zinc homeostasis in pathogenic black fungi. Fungal Biol. 2018, 122, 526–537. [Google Scholar] [CrossRef]
- Guerra-García, J.M.; García-Gómez, J.C. Assessing pollution levels in sediments of a harbour with two opposing entrances: Environmental implications. J. Environ. Manag. 2005, 77, 1–11. [Google Scholar] [CrossRef] [PubMed]
- Hong-Hermesdorf, A.; Miethke, M.; Gallaher, S.D.; Kropat, J.; Dodani, S.C.; Chan, J.; Barupala, D.; Domaille, D.W.; Shirasaki, D.I.; Loo, J.A.; et al. Subcellular metal imaging identifies dynamic sites of Cu accumulation in Chlamydomonas. Nat. Chem. Biol. 2014, 10, 1034–1042. [Google Scholar] [CrossRef] [Green Version]
- Castruita, M.; Casero, D.; Karpowicz, S.J.; Kropat, J.; Vieler, A.; Hsieh, S.I.; Yan, W.; Cokus, S.; Loo, J.A.; Benning, C. Systems biology approach in Chlamydomonas reveals connections between copper nutrition and multiple metabolic steps. Plant Cell 2011, 23, 1273. [Google Scholar] [CrossRef] [Green Version]


| Genes (Name_ID) | Primer Sequence (5′to3′) | Tm (°C) | Annotation | References | |
|---|---|---|---|---|---|
| CTR_24275 | Forward | GCATGCGTCGGCTTATTCTA | 58.50 | Cu transporter | [40] |
| Reverse | CACATGACCTGCCATCATTC | 56.85 | |||
| CTR_9391 | Forward | GTCAAATGCTCTGTCCAGCA | 58.47 | Cu transporter | |
| Reverse | CGTTTGATCCATTTGGAGGT | 56.02 | |||
| CTP_263051 | Forward | GTGCTGAGCAGAACAGTGAGC | 61.79 | Cu transporting p-type ATPase | |
| Reverse | GCAGATAGACAACGGCGATT | 58.43 | |||
| CTP_264357 | Forward | TTGACAAGACGGGAACCATT | 57.35 | Cu transporting p-type ATPase | |
| Reverse | TTCACTGCCGAGGGTAAATC | 57.60 | |||
| COX17_264096 | Forward | AAAGTGGGCATCAAATCAGG | 56.27 | Cu chaperone | |
| Reverse | CTCTTACAATCCGCGTCCTC | 58.16 | |||
| COX11_37139 | Forward | AGTCGCCACCTACAATGTCC | 59.75 | Cu chaperone | |
| Reverse | ACTGGCATATCCACCGTTTC | 57.96 | |||
| ZIP_32375 | Forward | AACGTAGGAACAGCCCTCCT | 60.54 | ZIP transporter | |
| Reverse | ATGACACCTGCCGACAAAC | 58.37 | |||
| ZIP_268980 | Forward | TGGTGTGTGGTCACTTCGTT | 59.75 | ZIP transporter | |
| Reverse | GCCTCCAACAACAACTCCAT | 58.38 | |||
| ZIP_22351 | Forward | CAACGCAGACGAAGAAAACA | 57.27 | ZIP transporter | |
| Reverse | GGGAACGCATACTTCGACAT | 58.06 | |||
| ZIP_11826 | Forward | CATTGGTTGCAGCACTATCG | 57.54 | ZIP transporter | |
| Reverse | CGACAATCGTTTACCAAGCA | 56.76 | |||
| ZIP_263800 | Forward | GCCATTGCTCAAACCGTATT | 57.06 | ZIP transporter | |
| Reverse | CTTAGCCGCAAGACCAAATC | 57.17 | |||
| SCO1_30986 | Forward | TTGGTTTCGCTCGGTGTC | 57.96 | Cu chaperone | In this study |
| Reverse | GTTCGCAATGCAACTTTCCT | 57.58 | |||
| COPⅠ_23273 | Forward | ATTCGGAGTGTTGTTGCC | 55.58 | Cu chaperone | |
| Reverse | CATTGTCAGGGAGTTGTTCT | 55.27 | |||
| FET3_5574 | Forward | GTCGTCGAGCAAGTTTCGTT | 59.15 | Multi-copper oxidase | [39] |
| Reverse | GGGAGCAACGTGGATAACAT | 57.96 | |||
| FTR1_268009 | Forward | GCTGGCTTGTGTTTGGAATTGT | 60.48 | Fe permease | |
| Reverse | CACCTTCCTCTGCCTCGTTGA | 62.04 | |||
| NRAMP_9840 | Forward | ATCGCCCAAGACGACAGAGTTGA | 64.04 | NRAMP protein | |
| Reverse | CACCGCTCCTAGAATCCCAGTAATG | 62.75 | |||
| TpActin_25772 | Forward | ACTGGATTGGAGATGGATGG | 56.66 | Actin | |
| Reverse | CAAAGCCGTAATCTCCTTCG | 56.62 | |||
| 3HfcpA_1778744 | Forward | CTCCCTCCAGGTTCCTGTTG | 56.66 | Photosynthetic proteins | [42] |
| Reverse | AGCGAGCTCAAGGAATCCAA | 59.38 | |||
| 3HfcpB_1778746 | Forward | AGTTCGATGAGGAGACCAAGCT | 61.16 | Photosynthetic proteins | |
| Reverse | GGCACGTCCGTTGTTCAAC | 60.01 | |||
| Sil1_52355302 | Forward | CCGTCACCCTCTCCTGAAAC | 60.04 | Silica shell formation | |
| Reverse | ATGGGAGCAGCGGTAATGG | 59.85 | |||
| Sit1_224002055 | Forward | TTGCCGAGGATGCCTAAACTT | 60.00 | Silica shell formation | |
| Reverse | TGACGAGCTACTGCAGGTTCA | 61.43 | |||
Publisher’s Note: MDPI stays neutral with regard to jurisdictional claims in published maps and institutional affiliations. |
© 2021 by the authors. Licensee MDPI, Basel, Switzerland. This article is an open access article distributed under the terms and conditions of the Creative Commons Attribution (CC BY) license (https://creativecommons.org/licenses/by/4.0/).
Share and Cite
Wang, X.; Cao, W.; Du, H.; Liu, W.; Li, P. Increasing Temperature Alters the Effects of Extracellular Copper on Thalassiosira Pseudonana Physiology and Transcription. J. Mar. Sci. Eng. 2021, 9, 816. https://doi.org/10.3390/jmse9080816
Wang X, Cao W, Du H, Liu W, Li P. Increasing Temperature Alters the Effects of Extracellular Copper on Thalassiosira Pseudonana Physiology and Transcription. Journal of Marine Science and Engineering. 2021; 9(8):816. https://doi.org/10.3390/jmse9080816
Chicago/Turabian StyleWang, Xinjie, Wang Cao, Hong Du, Wenhua Liu, and Ping Li. 2021. "Increasing Temperature Alters the Effects of Extracellular Copper on Thalassiosira Pseudonana Physiology and Transcription" Journal of Marine Science and Engineering 9, no. 8: 816. https://doi.org/10.3390/jmse9080816