Article

The Effect of Low Temperature on the Early Life Stages of the Walleye Pollock, Gadus chalcogrammus—A Laboratory Study

1
East Sea Fisheries Research Institute, National Institute of Fisheries Science, 1194 Haean-ro, Yeongok-myeon, Gangneung-si 25435, Gangwon-do, Korea
2
Field Science Center for Northern Biosphere, Hokkaido University, Hakodate 041-8611, Hokkaido, Japan
3
Hakodate Cephalopod Research Center, Fisheries and Oceans Hakodate, Hakodate 040-0051, Hokkaido, Japan
*
Author to whom correspondence should be addressed.
J. Mar. Sci. Eng. 2021, 9(8), 818; https://doi.org/10.3390/jmse9080818
Submission received: 7 June 2021 / Revised: 9 July 2021 / Accepted: 19 July 2021 / Published: 28 July 2021
(This article belongs to the Section Marine Biology)

Abstract

:
The walleye pollock Gadus chalcogrammus is an important commercial species in Japan whose larvae and eggs may be negatively affected by the cold water mass from the coastal Oyashio current that is present in the spawning ground of the Japanese Pacific stock of this species. Therefore, we investigated egg and larval specific density, larval mortality, and behavioral response to temperature change during the ontogenetic development of the walleye pollock to understand the effect of this cold surface water mass (<1.5 °C). Egg and larval specific density varied during development but were lower than the corresponding values from the coastal Oyashio waters. Within our study temperature range (0.3–10.0 °C), the number of days to 50% mortality (D50) was high at 3.1 °C. Below and above this temperature, the D50 showed a decreasing trend. Regarding larval response, at 1.5°C and 5.0°C, newly hatched larvae occurred abundantly in the surface layer, irrespective of the surface and rearing temperatures. When these larvae were released into a thermally stratified water column (surface: 1.5 °C, bottom: 5.0 °C), larvae reared at 5.0 °C with the mouth open and yolk sac completely absorbed moved to the lower layers. However, larvae reared at 1.5 °C remained in the surface layer. These results suggest that the cold water mass could negatively affect larval survival and may limit the escape ability of larvae from unfavorable cold conditions.

1. Introduction

The walleye pollock Gadus chalcogrammus is a commercially important species in Japan with four regional stocks: northern Japanese sea stock, southern Okhotsk sea stock, Nemuro Strait stock, and Japanese Pacific stock (JPS) [1,2,3,4], of which the JPS is the largest [3]. The JPS spawns from December to March (mainly January–February) near the mouth of Funka Bay, Hokkaido, at 100–120 m depth [5,6], and eggs and larvae, which are planktonic, are transported into the bay [7,8]. The eggs hatch after approximately 14 days at approximately 5 °C [9]. The optimal temperature range for the survival of walleye pollock eggs and larvae is 2–7 °C [10]. In the latter part of the spawning season, cold water from the coastal Oyashio current enters Funka Bay, and the temperature of the surface water layer decreases (<2 °C), alongside low salinity (<33.0) and low density [11,12,13]. Recruitment of the JPS decreases as the sea-surface temperature in the Funka Bay decreases [14]. The temperature range at which spawning occurs is −1 to 12°C, while larvae are seen at higher temperatures (2–9 °C) in the bay. Thus, the cold water mass from the coastal Oyashio current may negatively affect the survival and development of the eggs and larvae of the walleye pollock.
To understand the effect of the coastal Oyashio water mass on the survival and development of the eggs and larvae of the walleye pollock, we examined the following: (1) the specific densities of eggs and larvae the estimated hatching depth and vertical distribution of larvae in the spawning ground; (2) the change in larval mortality in relation to the change in water temperature, especially when influenced by temperature ranges of the coastal Oyashio water mass (<2 °C); and (3) the response of eggs and larvae to the surface layer of cold water using experimental tanks in which thermoclines of different magnitudes were induced [15].

2. Materials and Methods

2.1. Eggs and Larvae

30 live adult specimens of walleye pollock (40~50 cm) were collected using a fishing rod at the mouth of Funka Bay and transferred to a recirculating aquaculture tank (diameter 4.0 m, depth 1.0 m, 10 tons), at the Hakodate campus of Hokkaido University. The water temperature and salinity were maintained at 5 °C and 33 ppt, respectively. The fish were fed chopped frozen squid two or three times per week. Newly fertilized eggs from natural spawning were collected in a plastic beaker, rinsed with filtered seawater (0.22-µm membrane filter; temperature 5 °C, salinity 33 ppt), and divided equally into six plastic containers (Ziploc, approximately 591 mL) that were maintained at a salinity of 33 ppt and one of six temperatures: 0.0 °C, 1.5 °C, 3.0 °C, 5.0 °C, 7.5 °C, or 10.0 °C. The water was replaced with filtered seawater. The temperature and light intensity in the incubators were recorded using HOBO pendant data loggers (Onset HOBO® UA-002-64, Bourne, MA, USA). The photoperiod was 12 h light, 12 h dark.

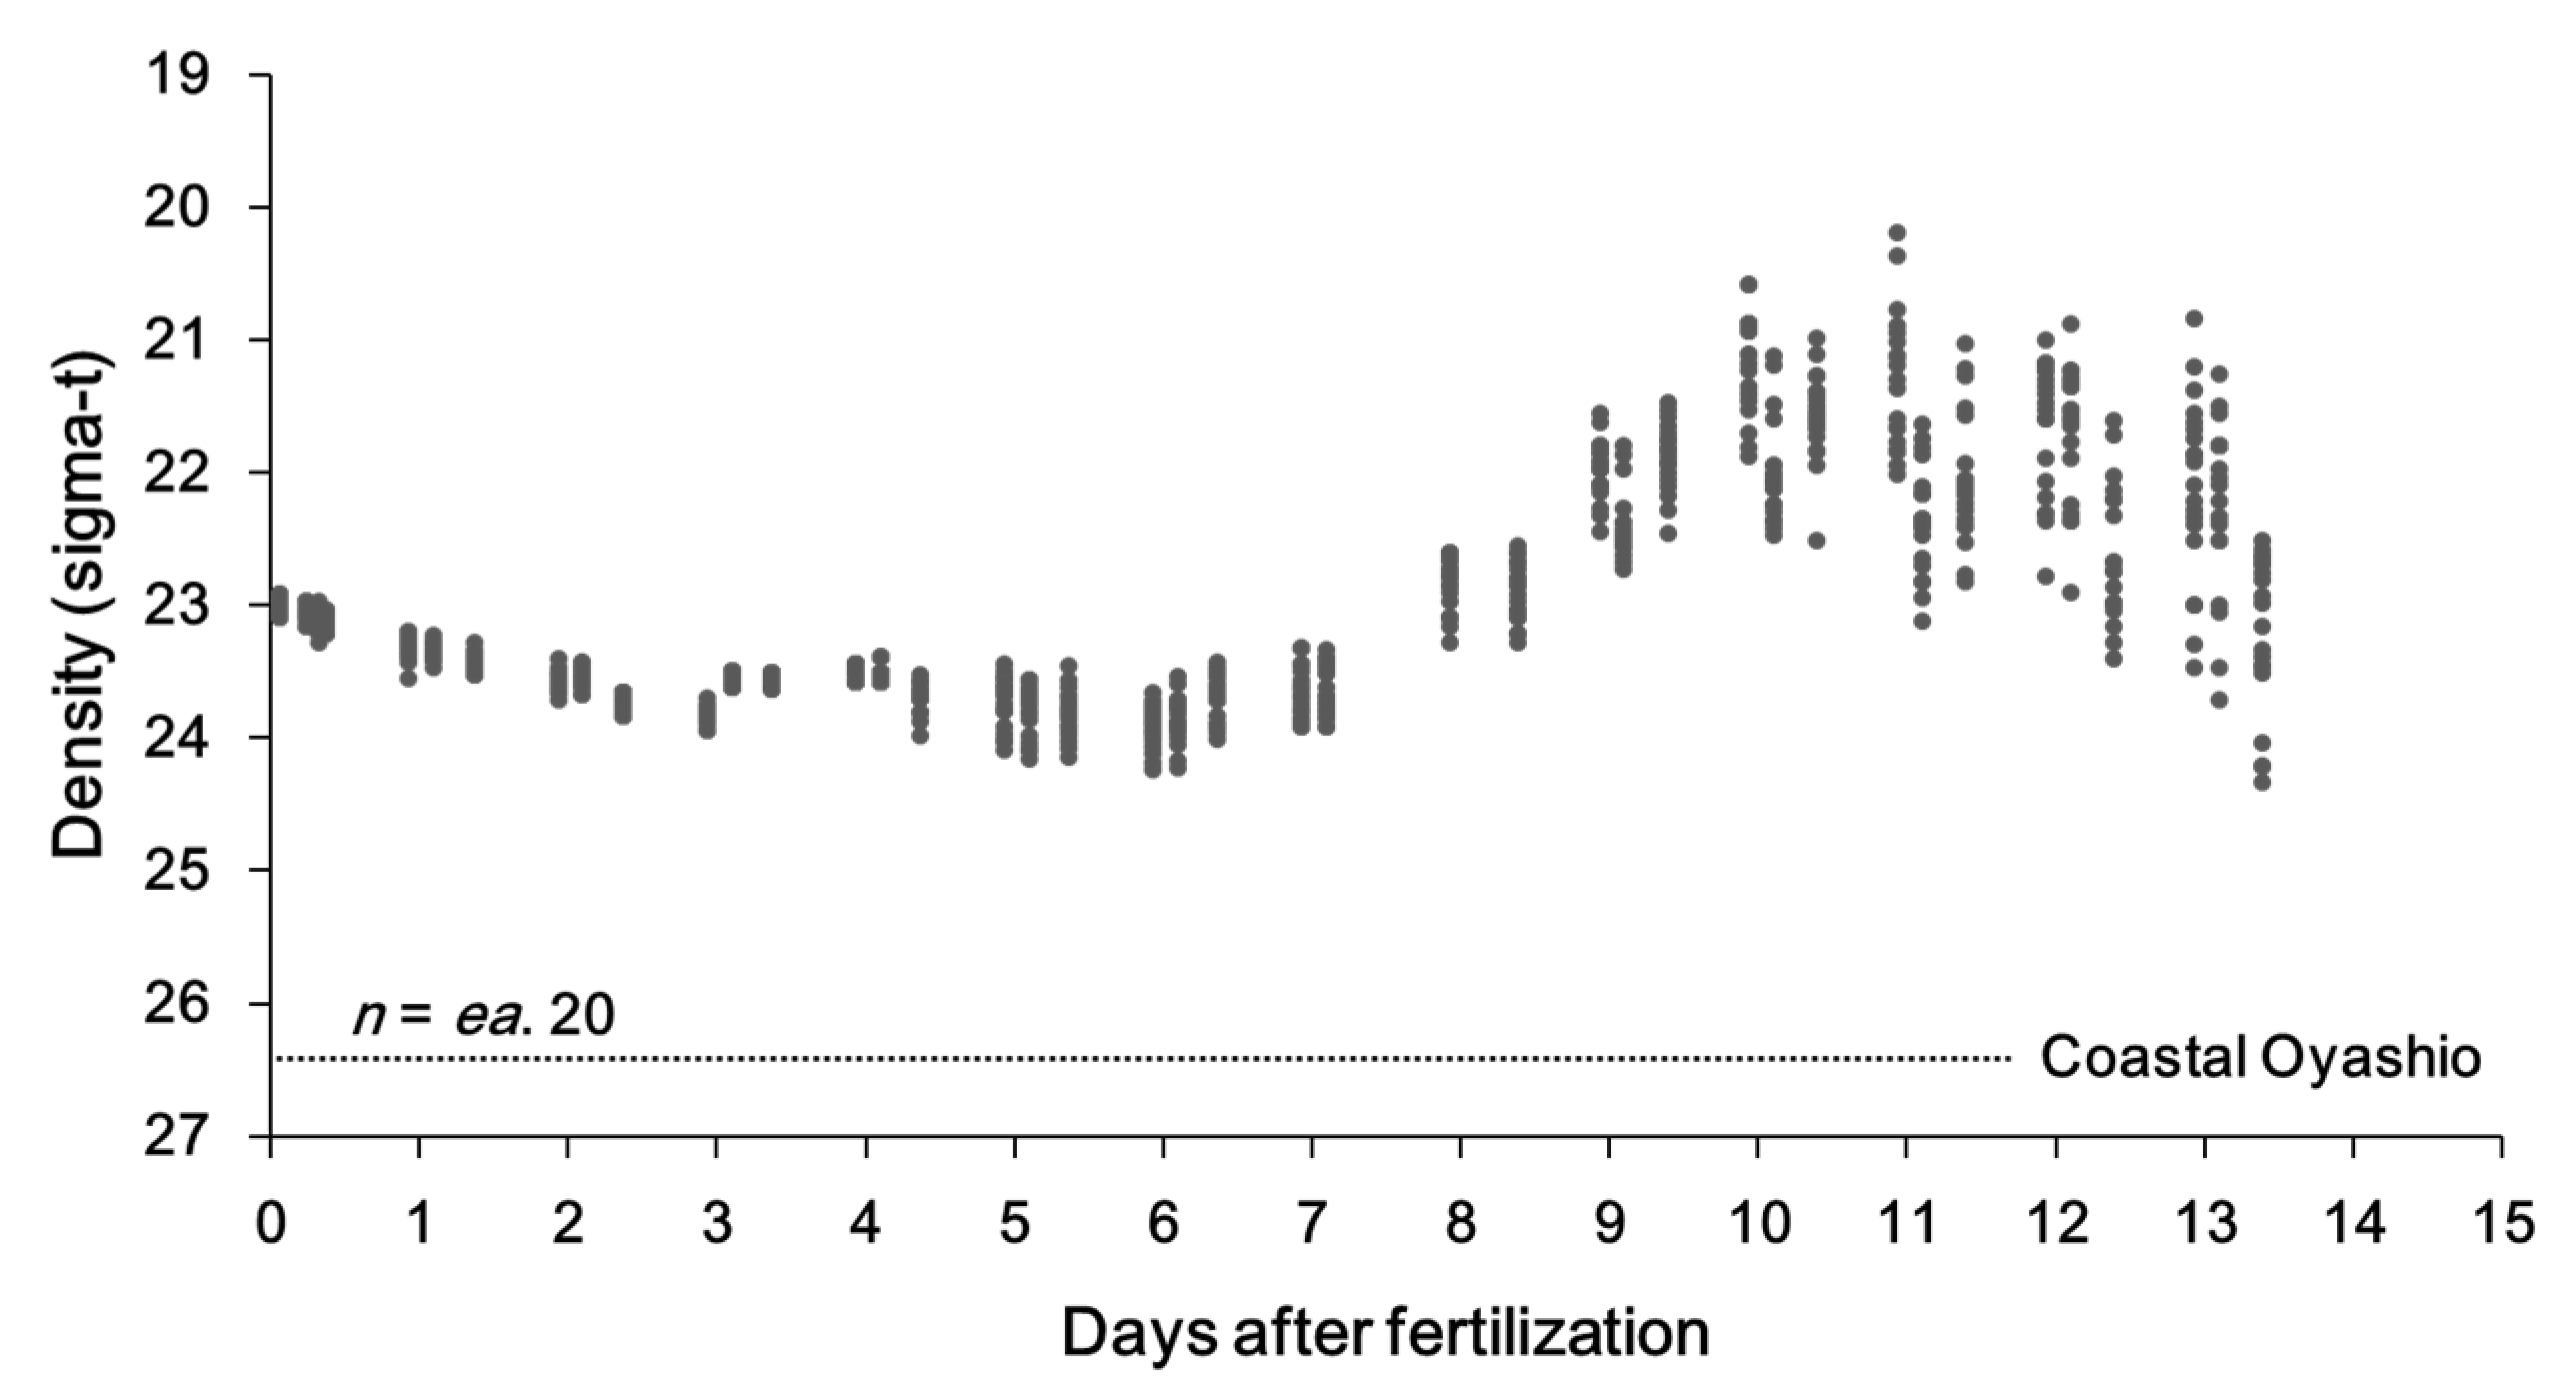
2.2. Specific Density during Early Ontogeny

The specific density of walleye pollock eggs and larvae was measured in a density gradient column as described by Coombs [16]. Distilled water and ordinary commercial salt were used to make low- (18 ppt) and high-salinity (48 ppt) water. Density gradients (height 35.5 cm) were formed in cylindrical tanks (height 40 cm, diameter 6 cm) and maintained at 5 °C. Four density floats (Martin Instrument Company, UK) were used as reference points of known specific density (range 1.0148–1.0300 g/cm3). The density of each of the floats was originally calibrated at 23 °C using certified instruments from the Marin Instrument Company. Therefore, density was corrected for 5 °C based on the equation of thermal expansion: calibration density = (float density) + (temperature difference) × (float density) × 0.000028.

2.3. Egg and Larval Treatment

Twenty naturally spawned eggs were used in each density column (total four batches). The eggs were photographed to determine size, and the developmental stage was determined as described by Kendall & Kim [17] and Blood et al. [9] prior to being introduced into the density gradient column.
Twenty anesthetized larvae (FA-100; 0.2 mL/L) were introduced into each density column after being photographed to measure their standard length. The position (depth in mm) of each larva was recorded after 15 min. The specific density of each larva was recorded daily until starvation.
In all experiments, the egg and larval depths in the density column were recorded under normal fluorescent light (at 20 cm above the density column surface) at 5 °C in an incubator. The eggs and larvae were photographed using a Macromax MVC-DU camera (GOKO, Kanagawa, Japan) mounted on a stereomicroscope (SMZ1500, Nikon, Tokyo, Japan), and analyzed using image analysis software (Macromax GOKO Measure 1.0; GOKO Camera, Kawasaki, Japan). The specific density values were measured as σt = (ρ − 1) × 103, where ρ is the specific density (g/cm3).

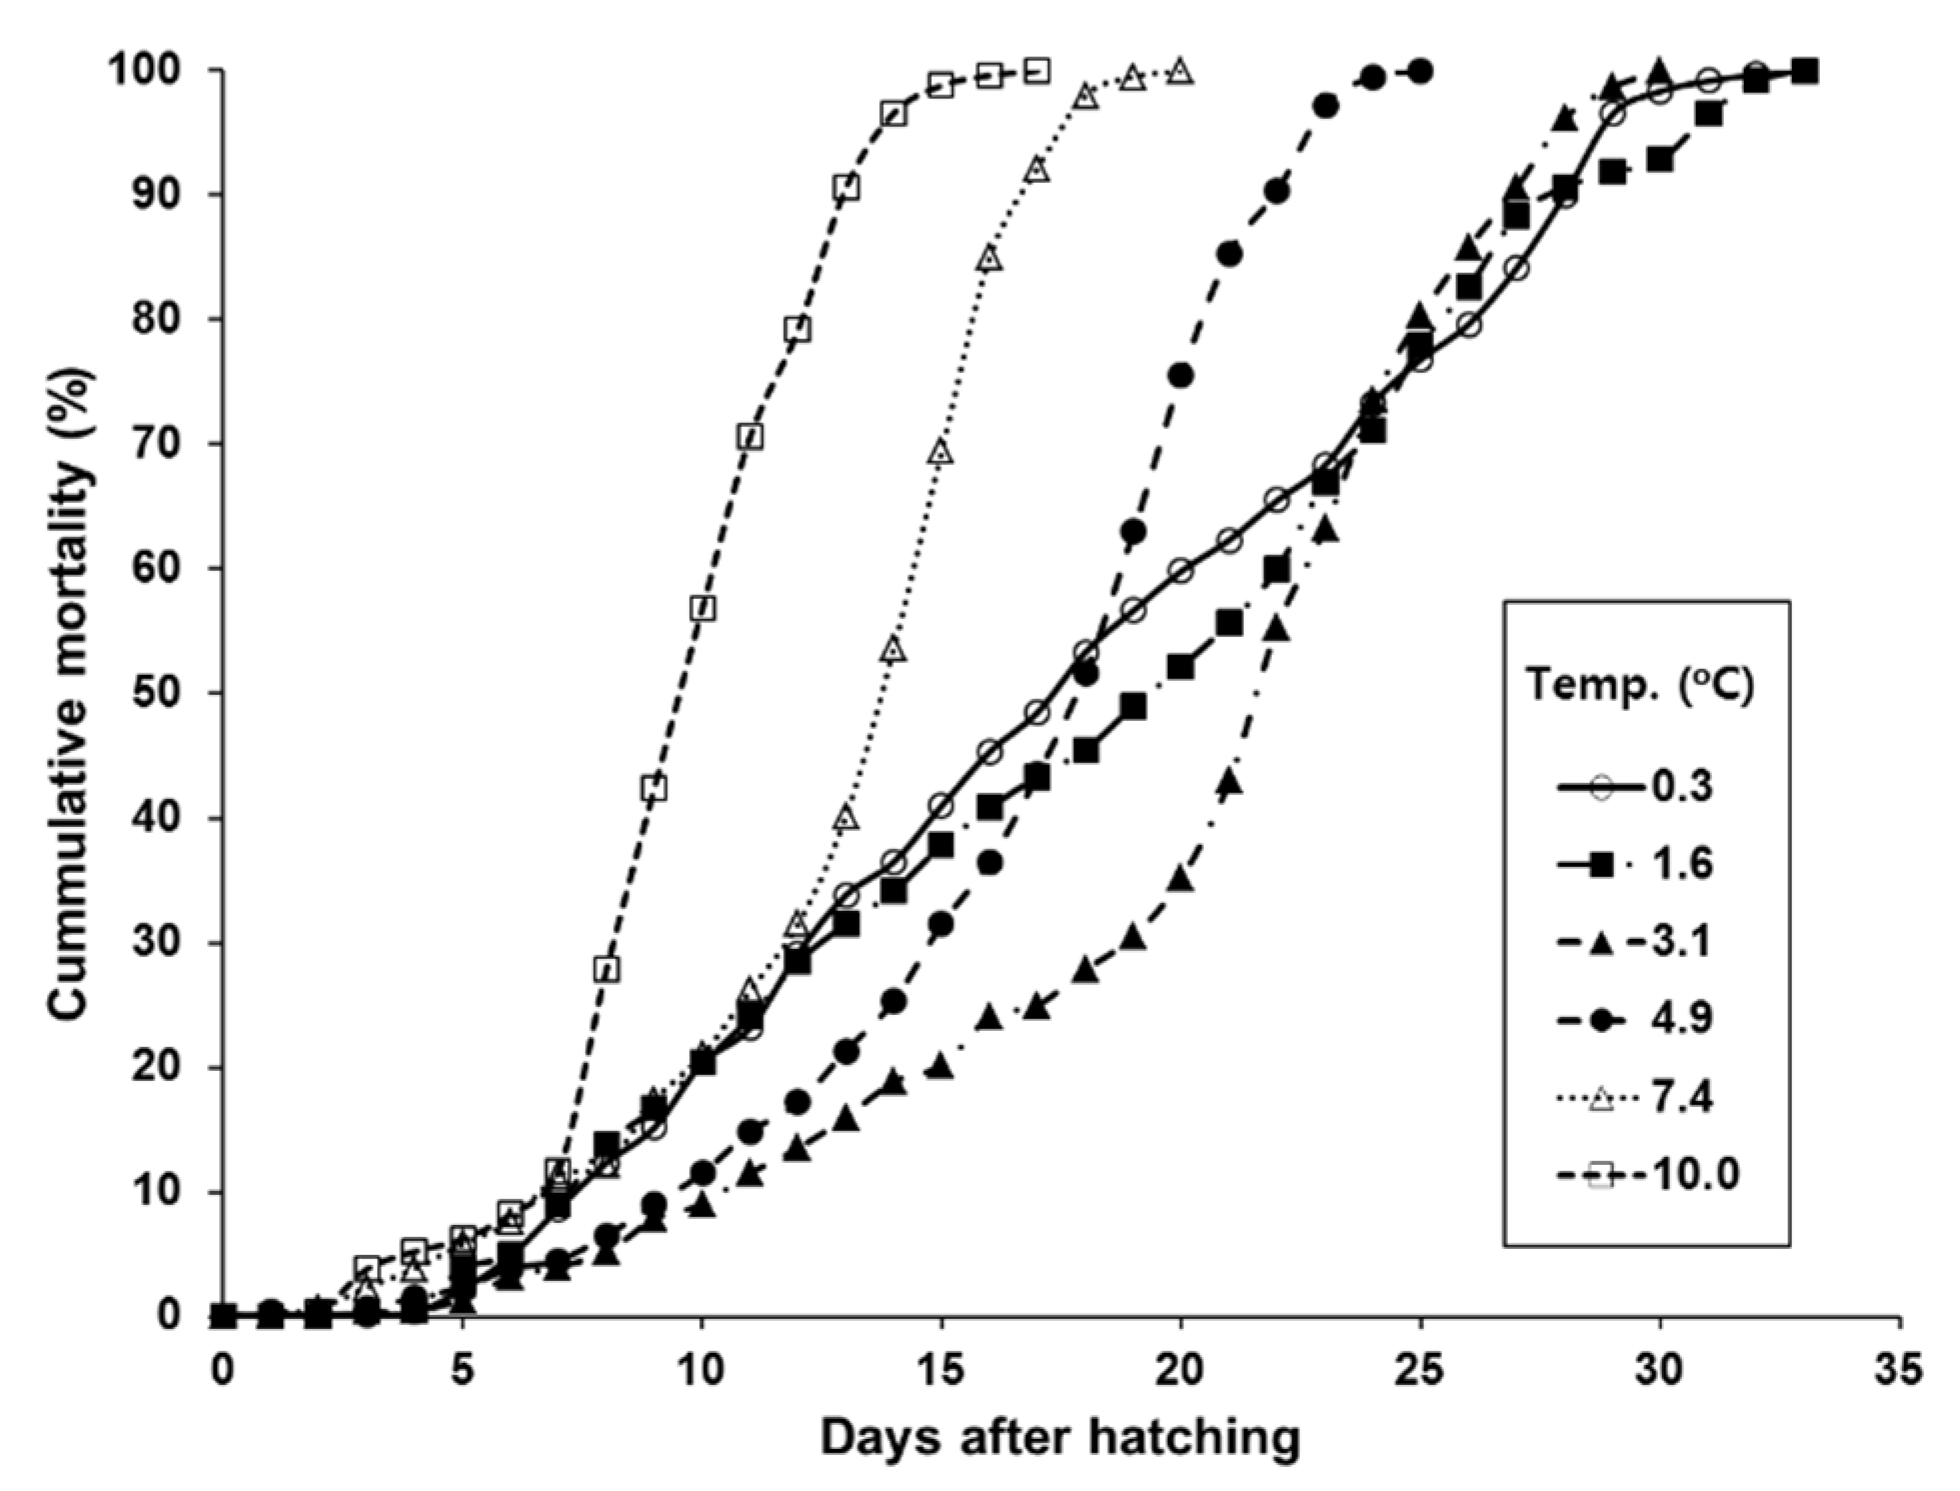
2.4. Mortality of Larvae at Different Temperatures

Newly hatched larvae were divided into groups of 20 per petri dish (diameter 60 mm, depth 12 mm) and maintained at the following six temperatures (mean ± SD): 0.3 ± 0.6 °C, 1.6 ± 0.3 °C, 3.1 ± 0.3 °C, 4.9 ± 0.1 °C, 7.4 ± 0.2 °C, and 10.0 ± 0.1°C. These temperatures included the coastal Oyashio water temperature of <2 °C [11,12,13]. A total of 600 larvae (20 larvae × 5 petri dishes × 6 batches) were exposed to each temperature (except for 10.0 °C, at which only 500 larvae were available) for 33 days. Dead larvae were counted and removed daily at which time the seawater in the petri dishes was replaced with filtered seawater. The larvae were not fed during the assessment of the effect of temperature on mortality.

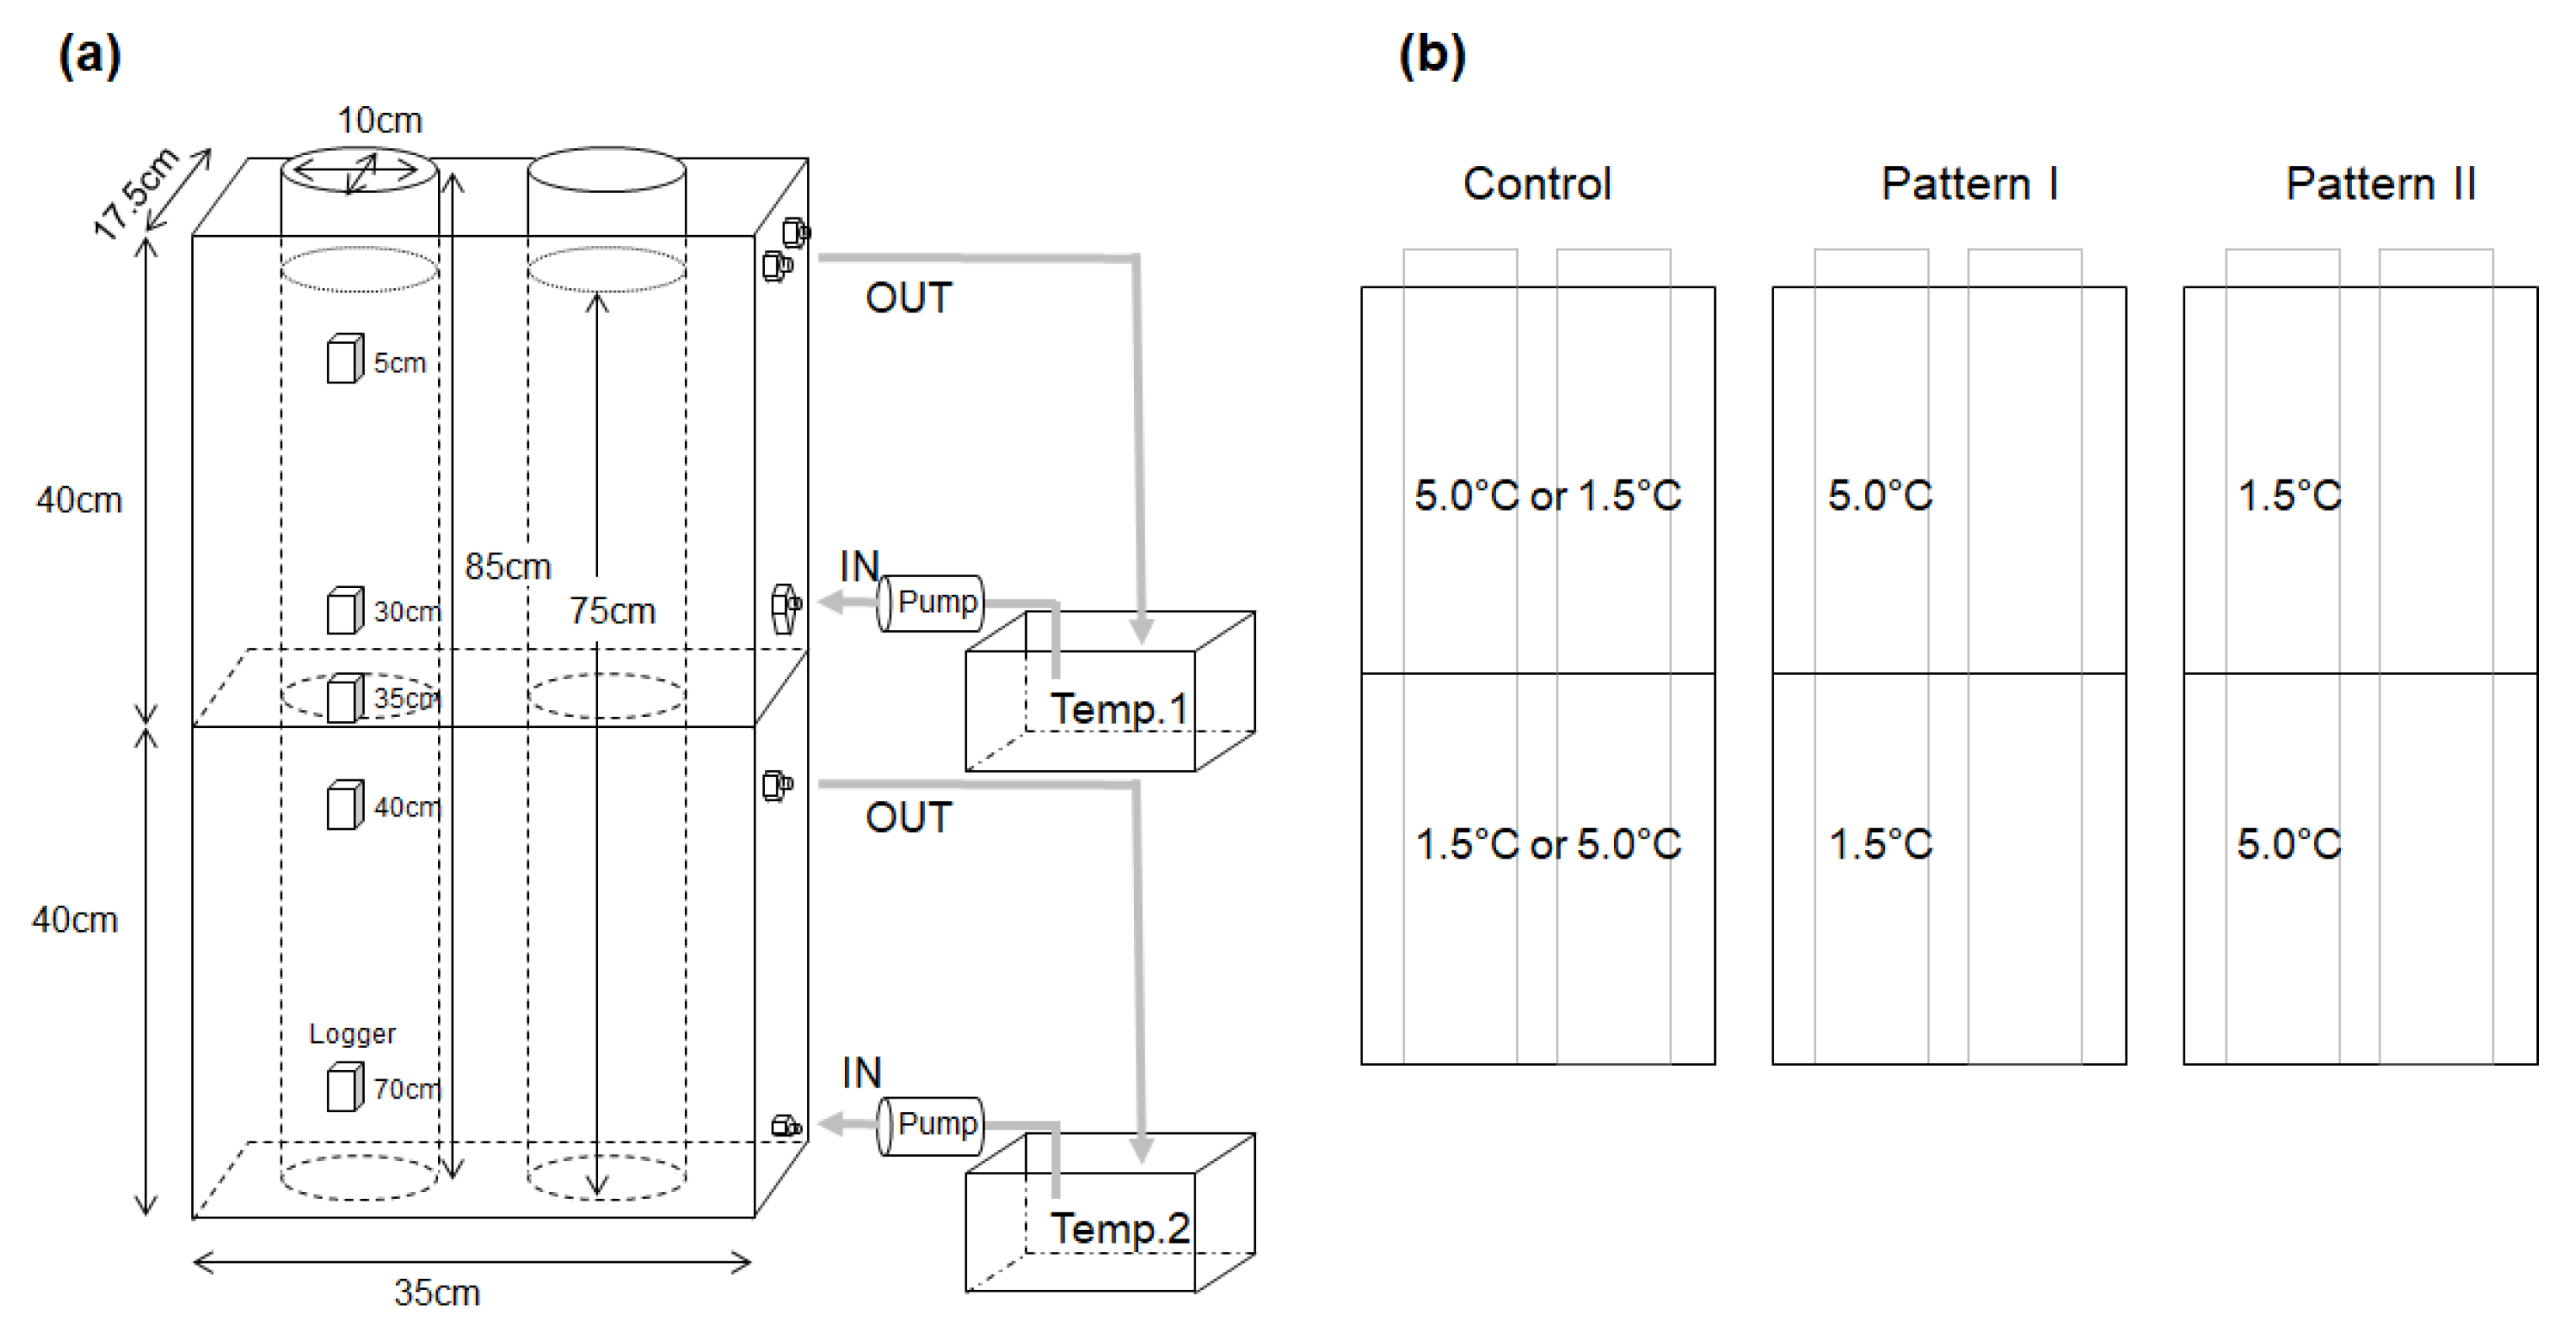
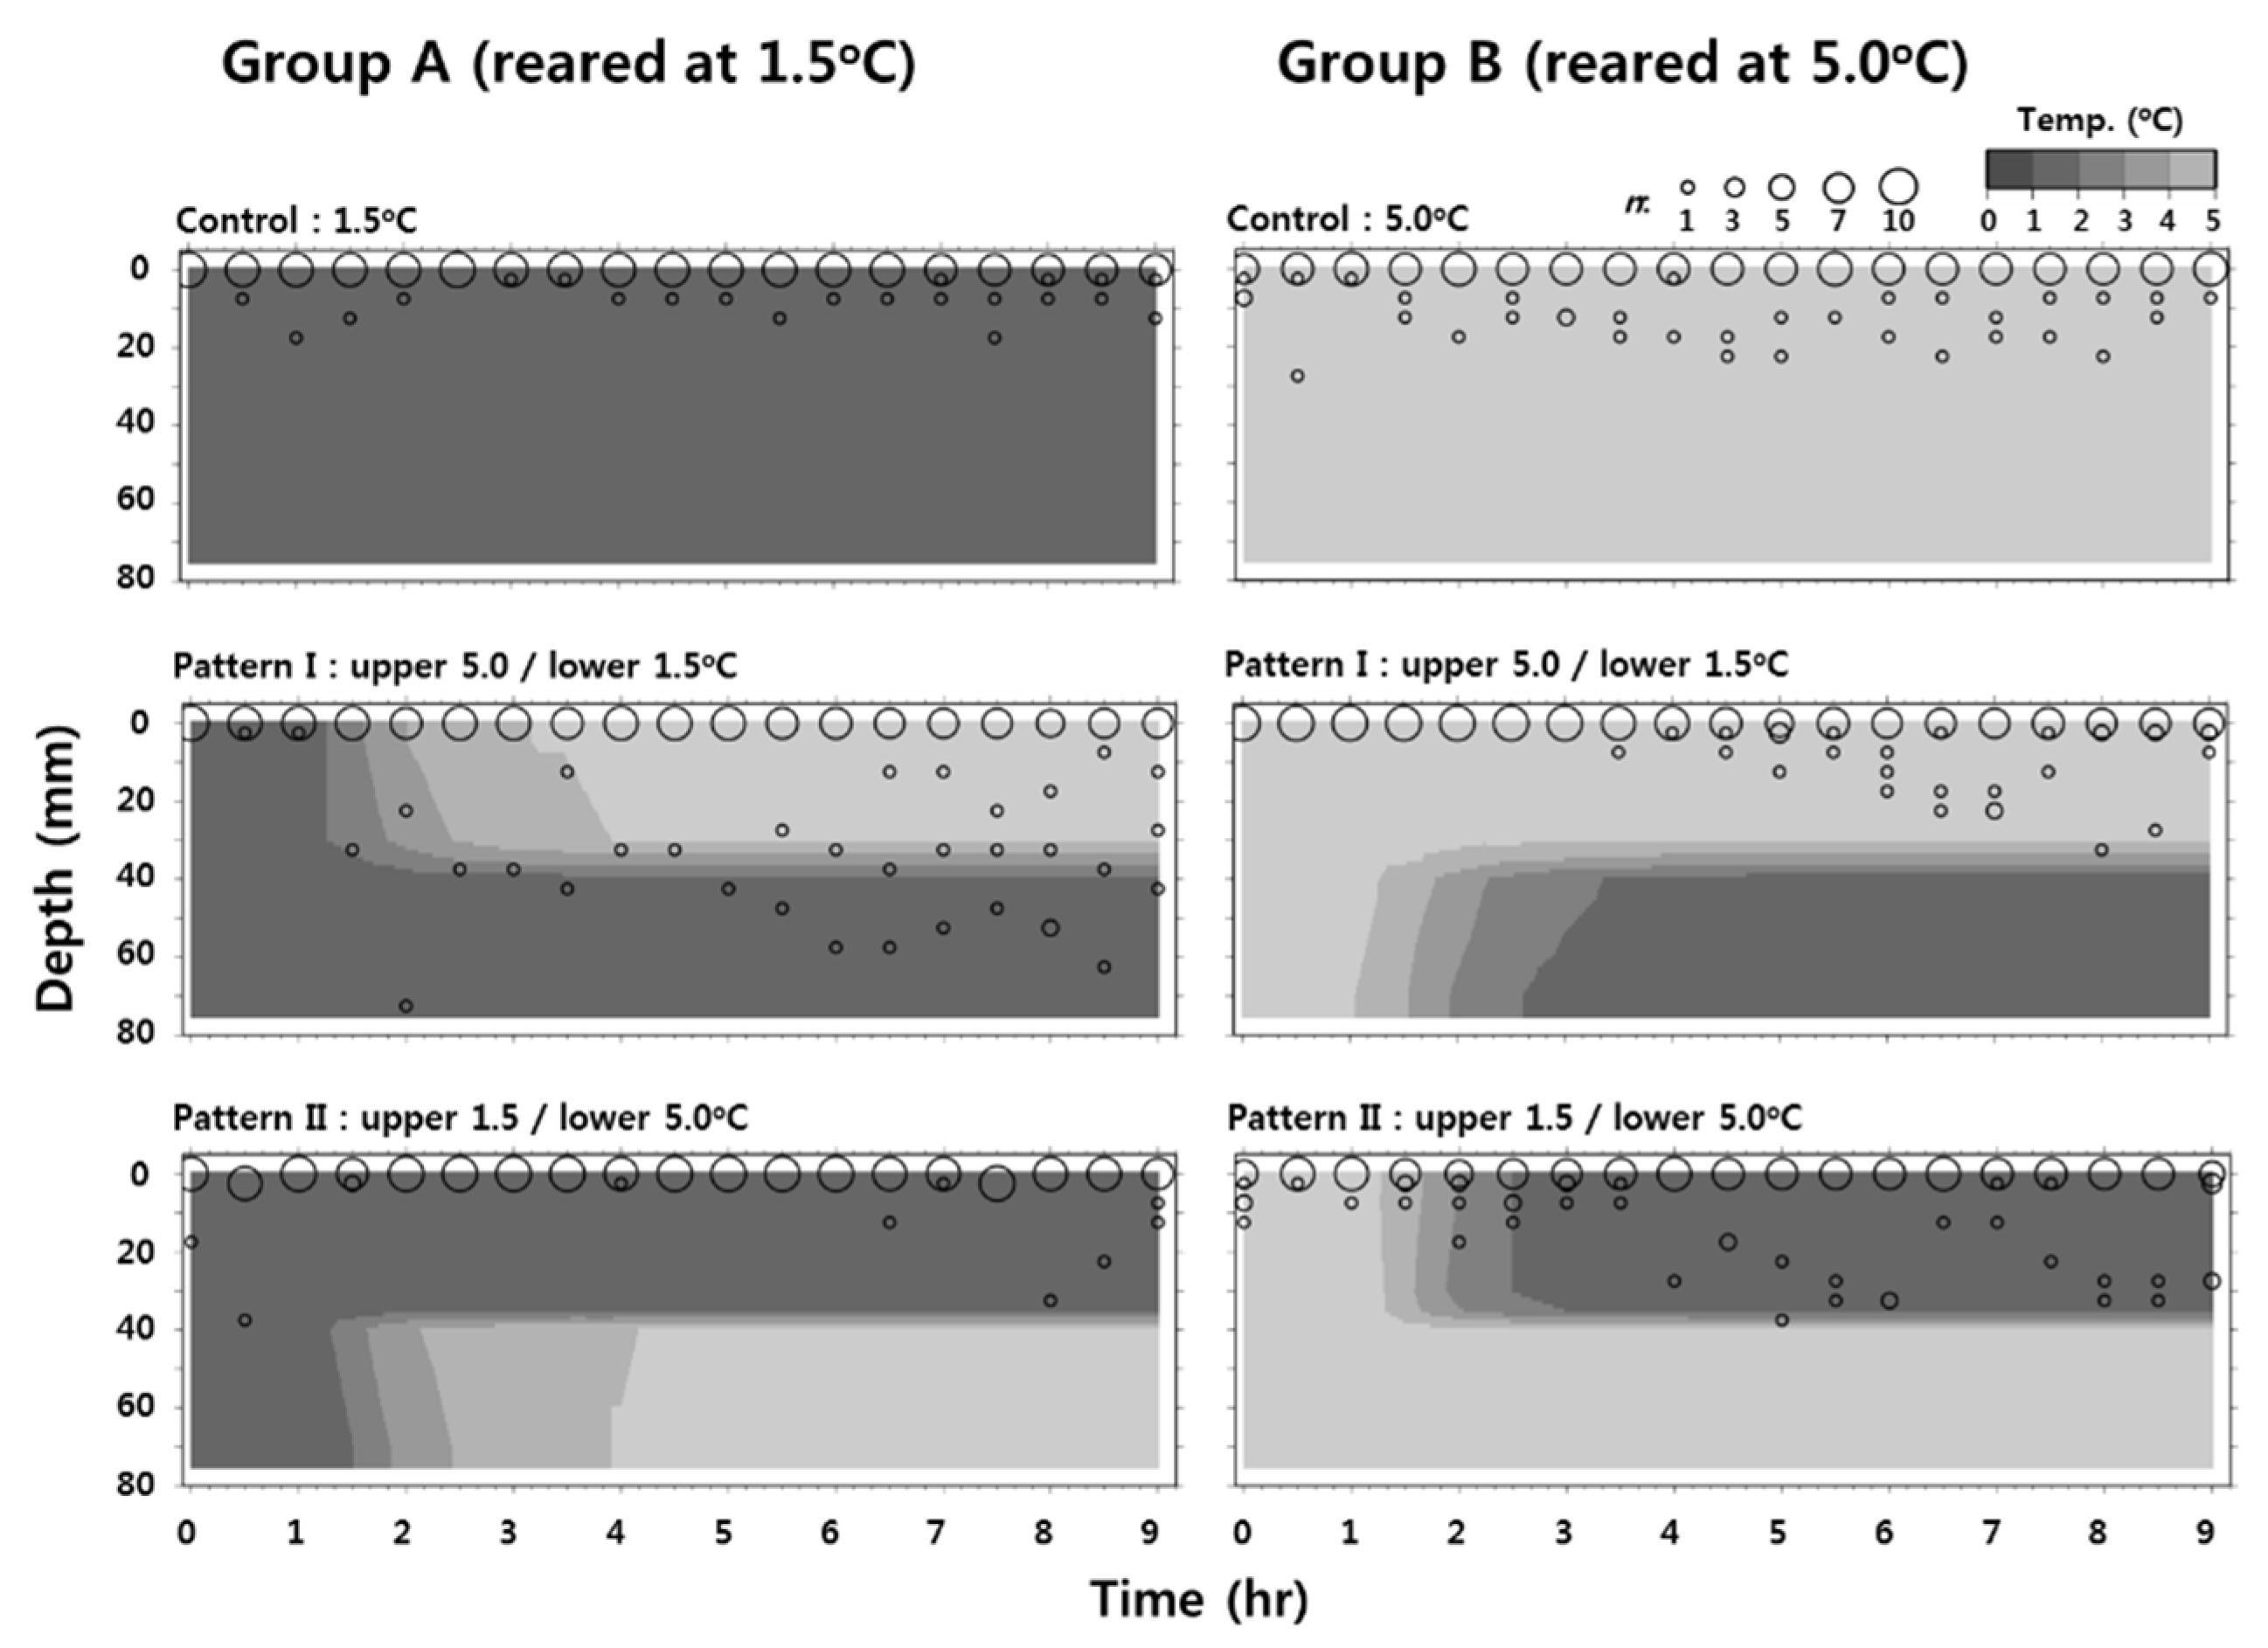
2.5. Behavioral Response of Larvae to Low Temperature

The behavioral response of larvae was observed in two vertical, cylindrical tanks (height 85 cm, diameter 10 cm). The tanks were surrounded by upper and lower water baths separated by a 10-mm insulation layer. The temperature in each tank was controlled using the baths (Figure 1).
In these experimental tanks, larval response to low temperature was recorded at three vertical patterns (Control: homogeneous across both layers at 5.0 °C or 1.5 °C, Pattern I: 5.0 °C in the upper layer/1.5°C in the lower layer, and Pattern II: 1.5 °C/5.0 °C) for two groups (A and B). The water temperature and light intensity in the tanks was recorded using five temperature loggers (Onset HOBO® UA-002-64, Bourne, MA, USA) at 5 cm, 30 cm, 35 cm, 40 cm, and 70 cm depths. Light intensity at the 5 cm depth was approximately 215-366 lx. Pattern II simulated the vertical profile in the ocean when the surface layer is made up of water brought in by the coastal Oyashio current. The larvae were reared at 1.5 °C for Group A and 5.0 °C for group B at three ontogenetic developmental stages: (1) larvae that had hatched within 24 h, (2) larvae with a discernable open mouth for the first time, and (3) larvae whose yolk sac was almost completely absorbed. The experimental setup was as follows: the temperature of both upper and lower parts of the water column was set at 1.5 °C (Group A) and 5.0 °C (Group B). Ten larvae were introduced into the surface of each experimental tank (Groups A and B). After 1 h, the temperature was changed to those in Patterns I and II. The number of larvae at each 50-mm-depth interval was counted visually and recorded every 30 min for 9 h. A total of six replicates were established for each group.

2.6. Statistical Analysis

The diameter of fertilized eggs and specific density of newly hatched larvae were compared by analysis of variance (ANOVA) followed by Tukey-HSD tests for post-hoc multiple comparisons, at a significance level of 0.05.
For the statistical analysis of the vertical distribution of larvae, the depth of the water column was divided into five layers: surface (0–4 cm depth), shallow (5–29 cm), thermocline (30–39 cm), deep (40–69 cm), and bottom (70–75 cm). Once the temperature of the water column stabilized (after 4–9 h), differences in larval abundance between layers were tested using the Chi-squared test, and Ryan’s [18] method for multiple comparisons was used when the abundance at each layer was different.

3. Results

3.1. Specific Density during Early Ontogeny

Egg size was significantly different among the four batches 1 day after fertilization (ANOVA, p < 0.001; Table 1).
The mean specific density σt at this developmental stage (<1 day post fertilization) ranged from 22.5 to 23.1 and showed significant differences among batches (ANOVA, p < 0.001; Table 2) except between batches 1 and 2 (Tukey-HSD test, p = 0.058). No significant relationship was observed between egg size and specific density (Pearson’s product-moment coefficient of correlation, r = −0.75, p = 0.25).
During subsequent development, the specific density remained similar within each batch (Figure 2). The specific density also remained somewhat constant until around day 7, after which it increased, with a peak around day 10, and then decreased subsequently, thus varying considerably in the days prior to hatching. The mean specific density of the eggs until hatching was lower than that of the coastal Oyashio water mass (σt, 26.4; temperature, 2 °C; salinity, 33 ppt), suggesting that the eggs rise after spawning and hatch at the surface. The specific density of newly hatched larvae differed among batches (ANOVA, p < 0.01), especially between batches 1 and 4 and batches 2 and 4 (Tukey-HSD test, p < 0.05) (Table 3).
During subsequent development, the specific density of the larvae varied among the batches, with no two batches being similar. Similar to eggs, the specific density of the larvae from hatching to death was also less than that of the coastal Oyashio water mass (Figure 3).

3.2. Mortality of Larvae at Different Temperatures

The cumulative mortality from hatching to death at each of the six temperatures (0.3 °C, 1.6 °C, 3.1 °C, 4.9 °C, 7.4 °C, and 10.0 °C) is shown in Figure 4 The time (number of days) to 100% mortality (D100) was determined to be a simple linear function of the temperature (T) (D100 = −1.84(T) + 34.7, R2 = 0.87, p < 0.01). The mortality itself appeared to increase logistically between 3.1 °C and 10.0 °C and linearly at lower temperatures (0.3 and 1.6 °C), suggesting a constant mortality rate at lower temperatures. The number of days to 50% mortality (D50) at each temperature was estimated by fitting to a linear regression model.
The D50 was plotted against the six temperatures (T) from hatching to starvation (Figure 5), since the cumulative mortality of larvae at each temperature increased logistically (logistic regression, p < 0.01). The D50 was approximately 18 days at 0.3 °C and increased with increasing temperature until peaking at 3.1 °C, and then decreased rapidly and in a non-linear manner, with the lowest value of around 9 days at 10.0 °C. The relationship between the D50 and temperature was not linear but could be expressed as a polynomial function: D50 = 18.121 + 0.5122(T) − 0.1447(T2) (p < 0.05, r2 = 0.92). These results show that D50 did not consistently increase with decreasing temperature but rather peaked at approximately 3 °C decreasing as the temperature increased or decreased.

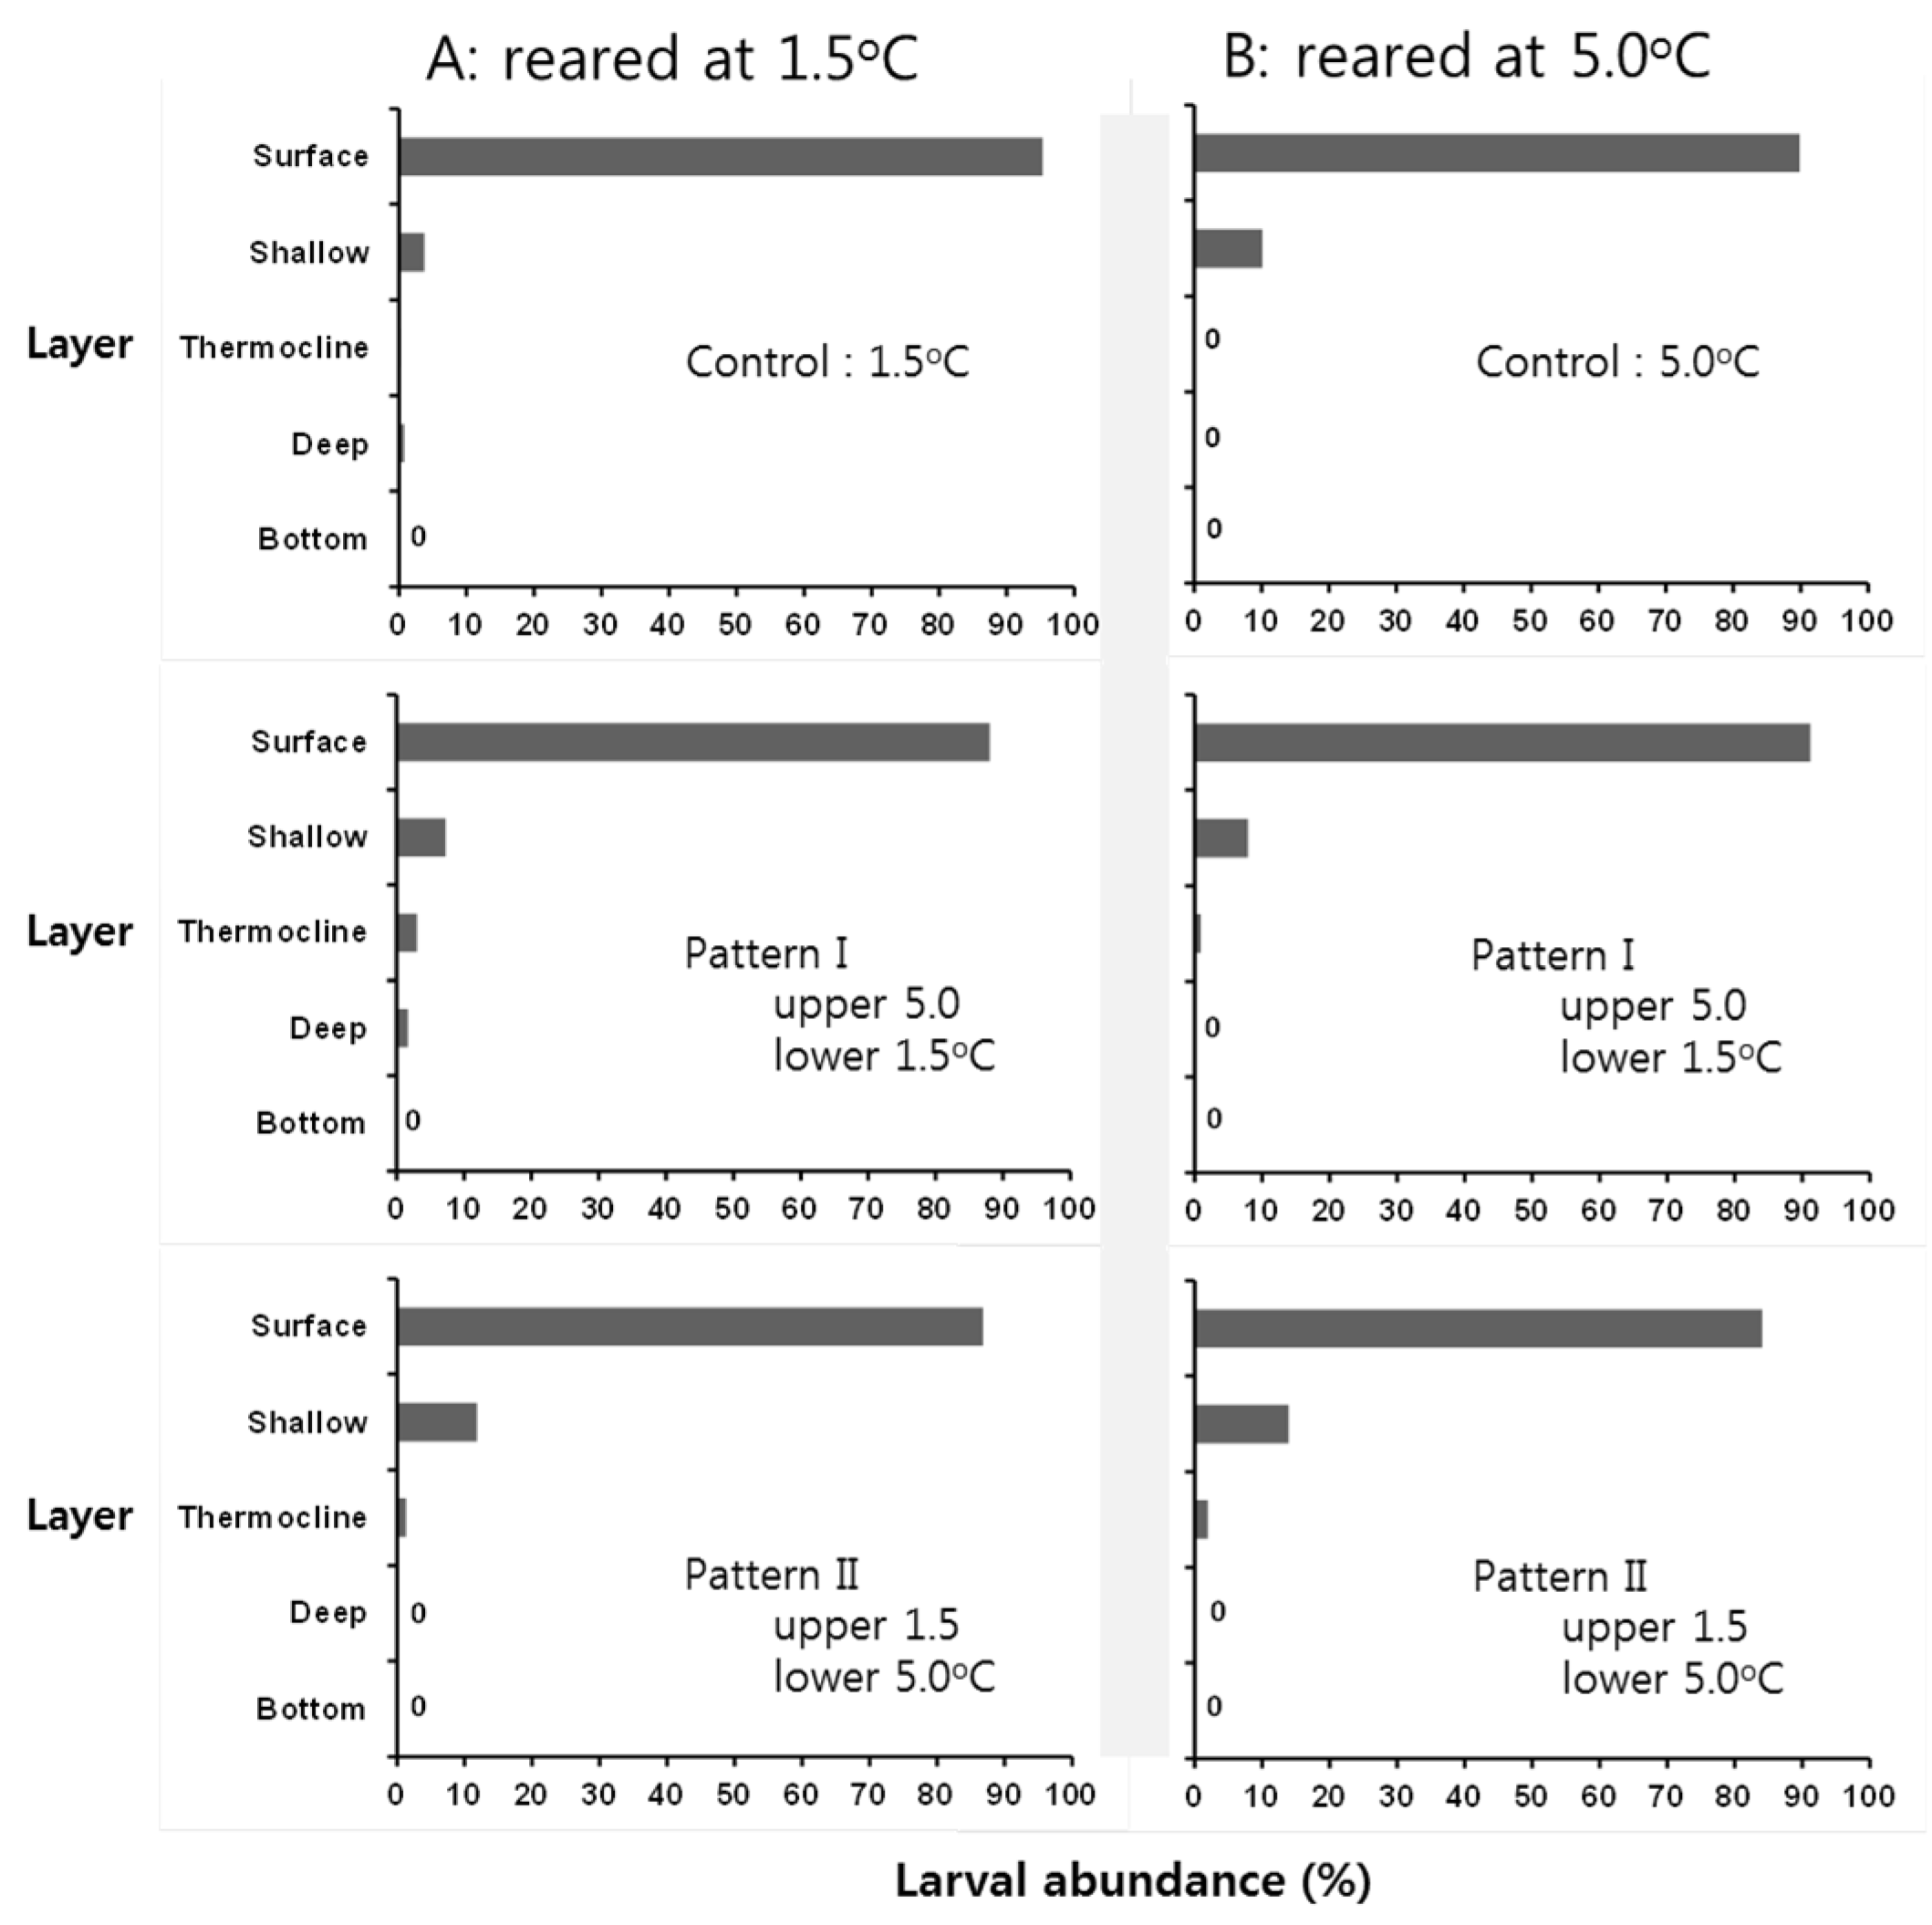
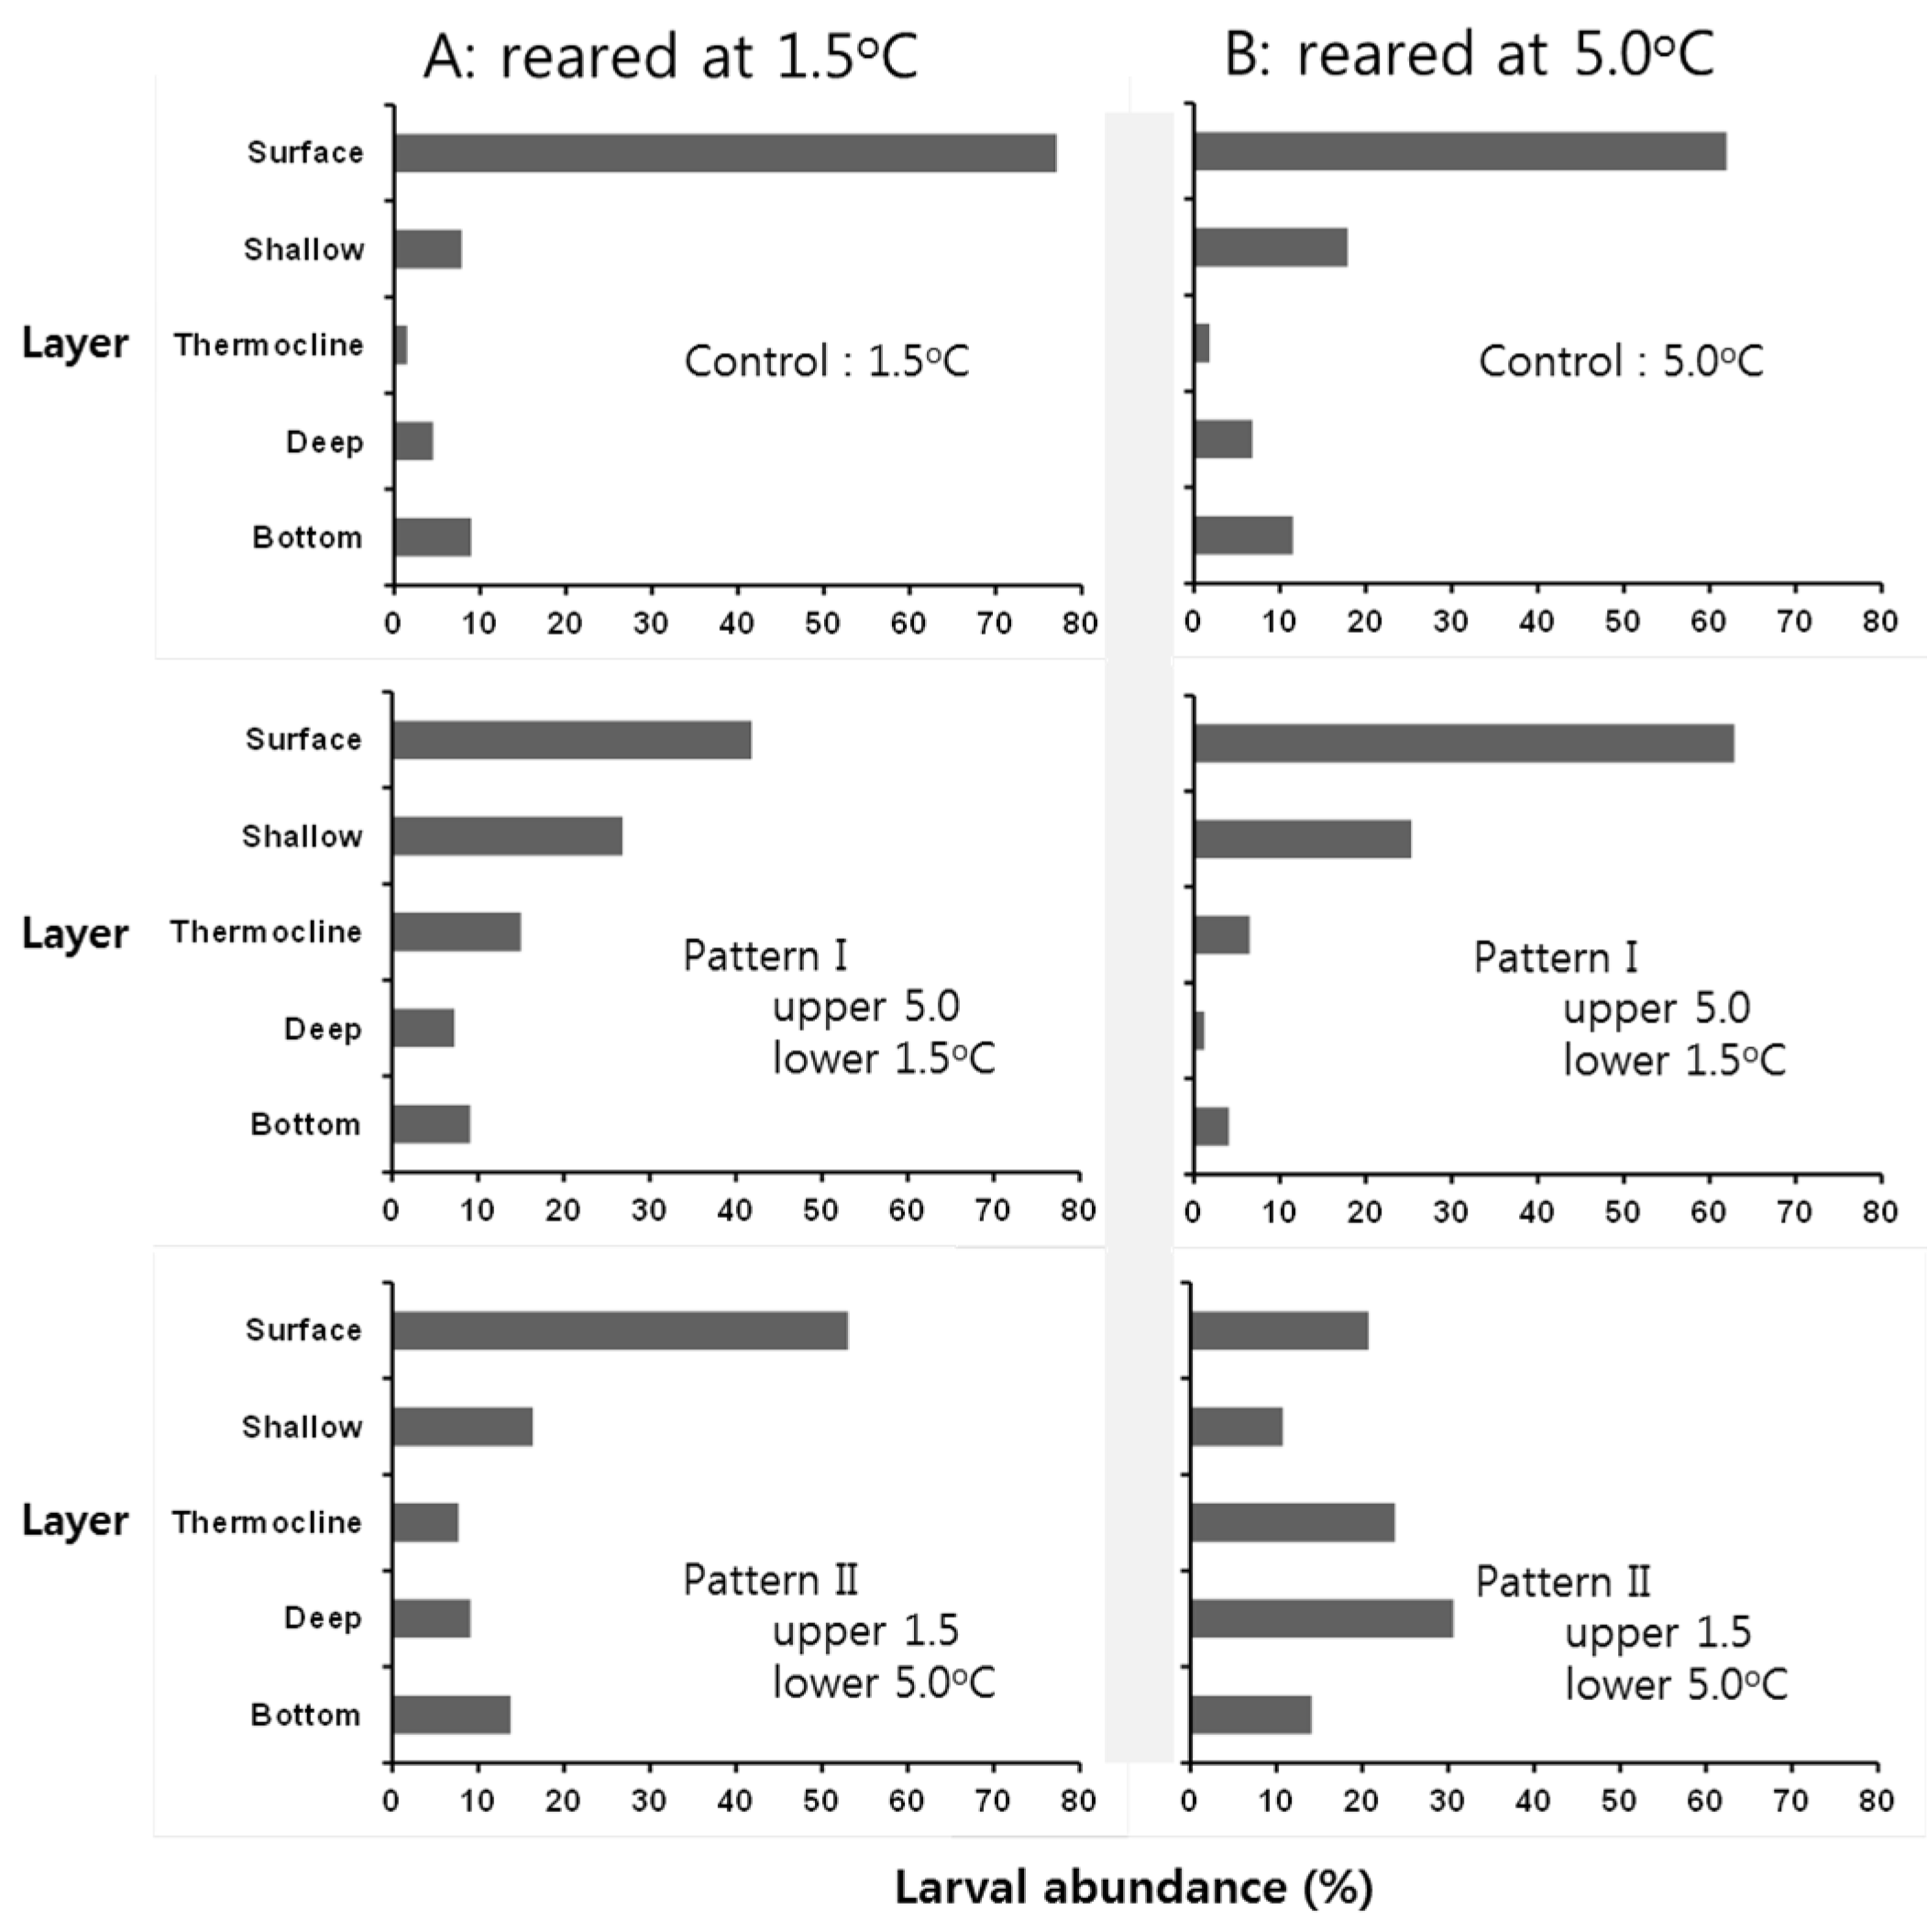
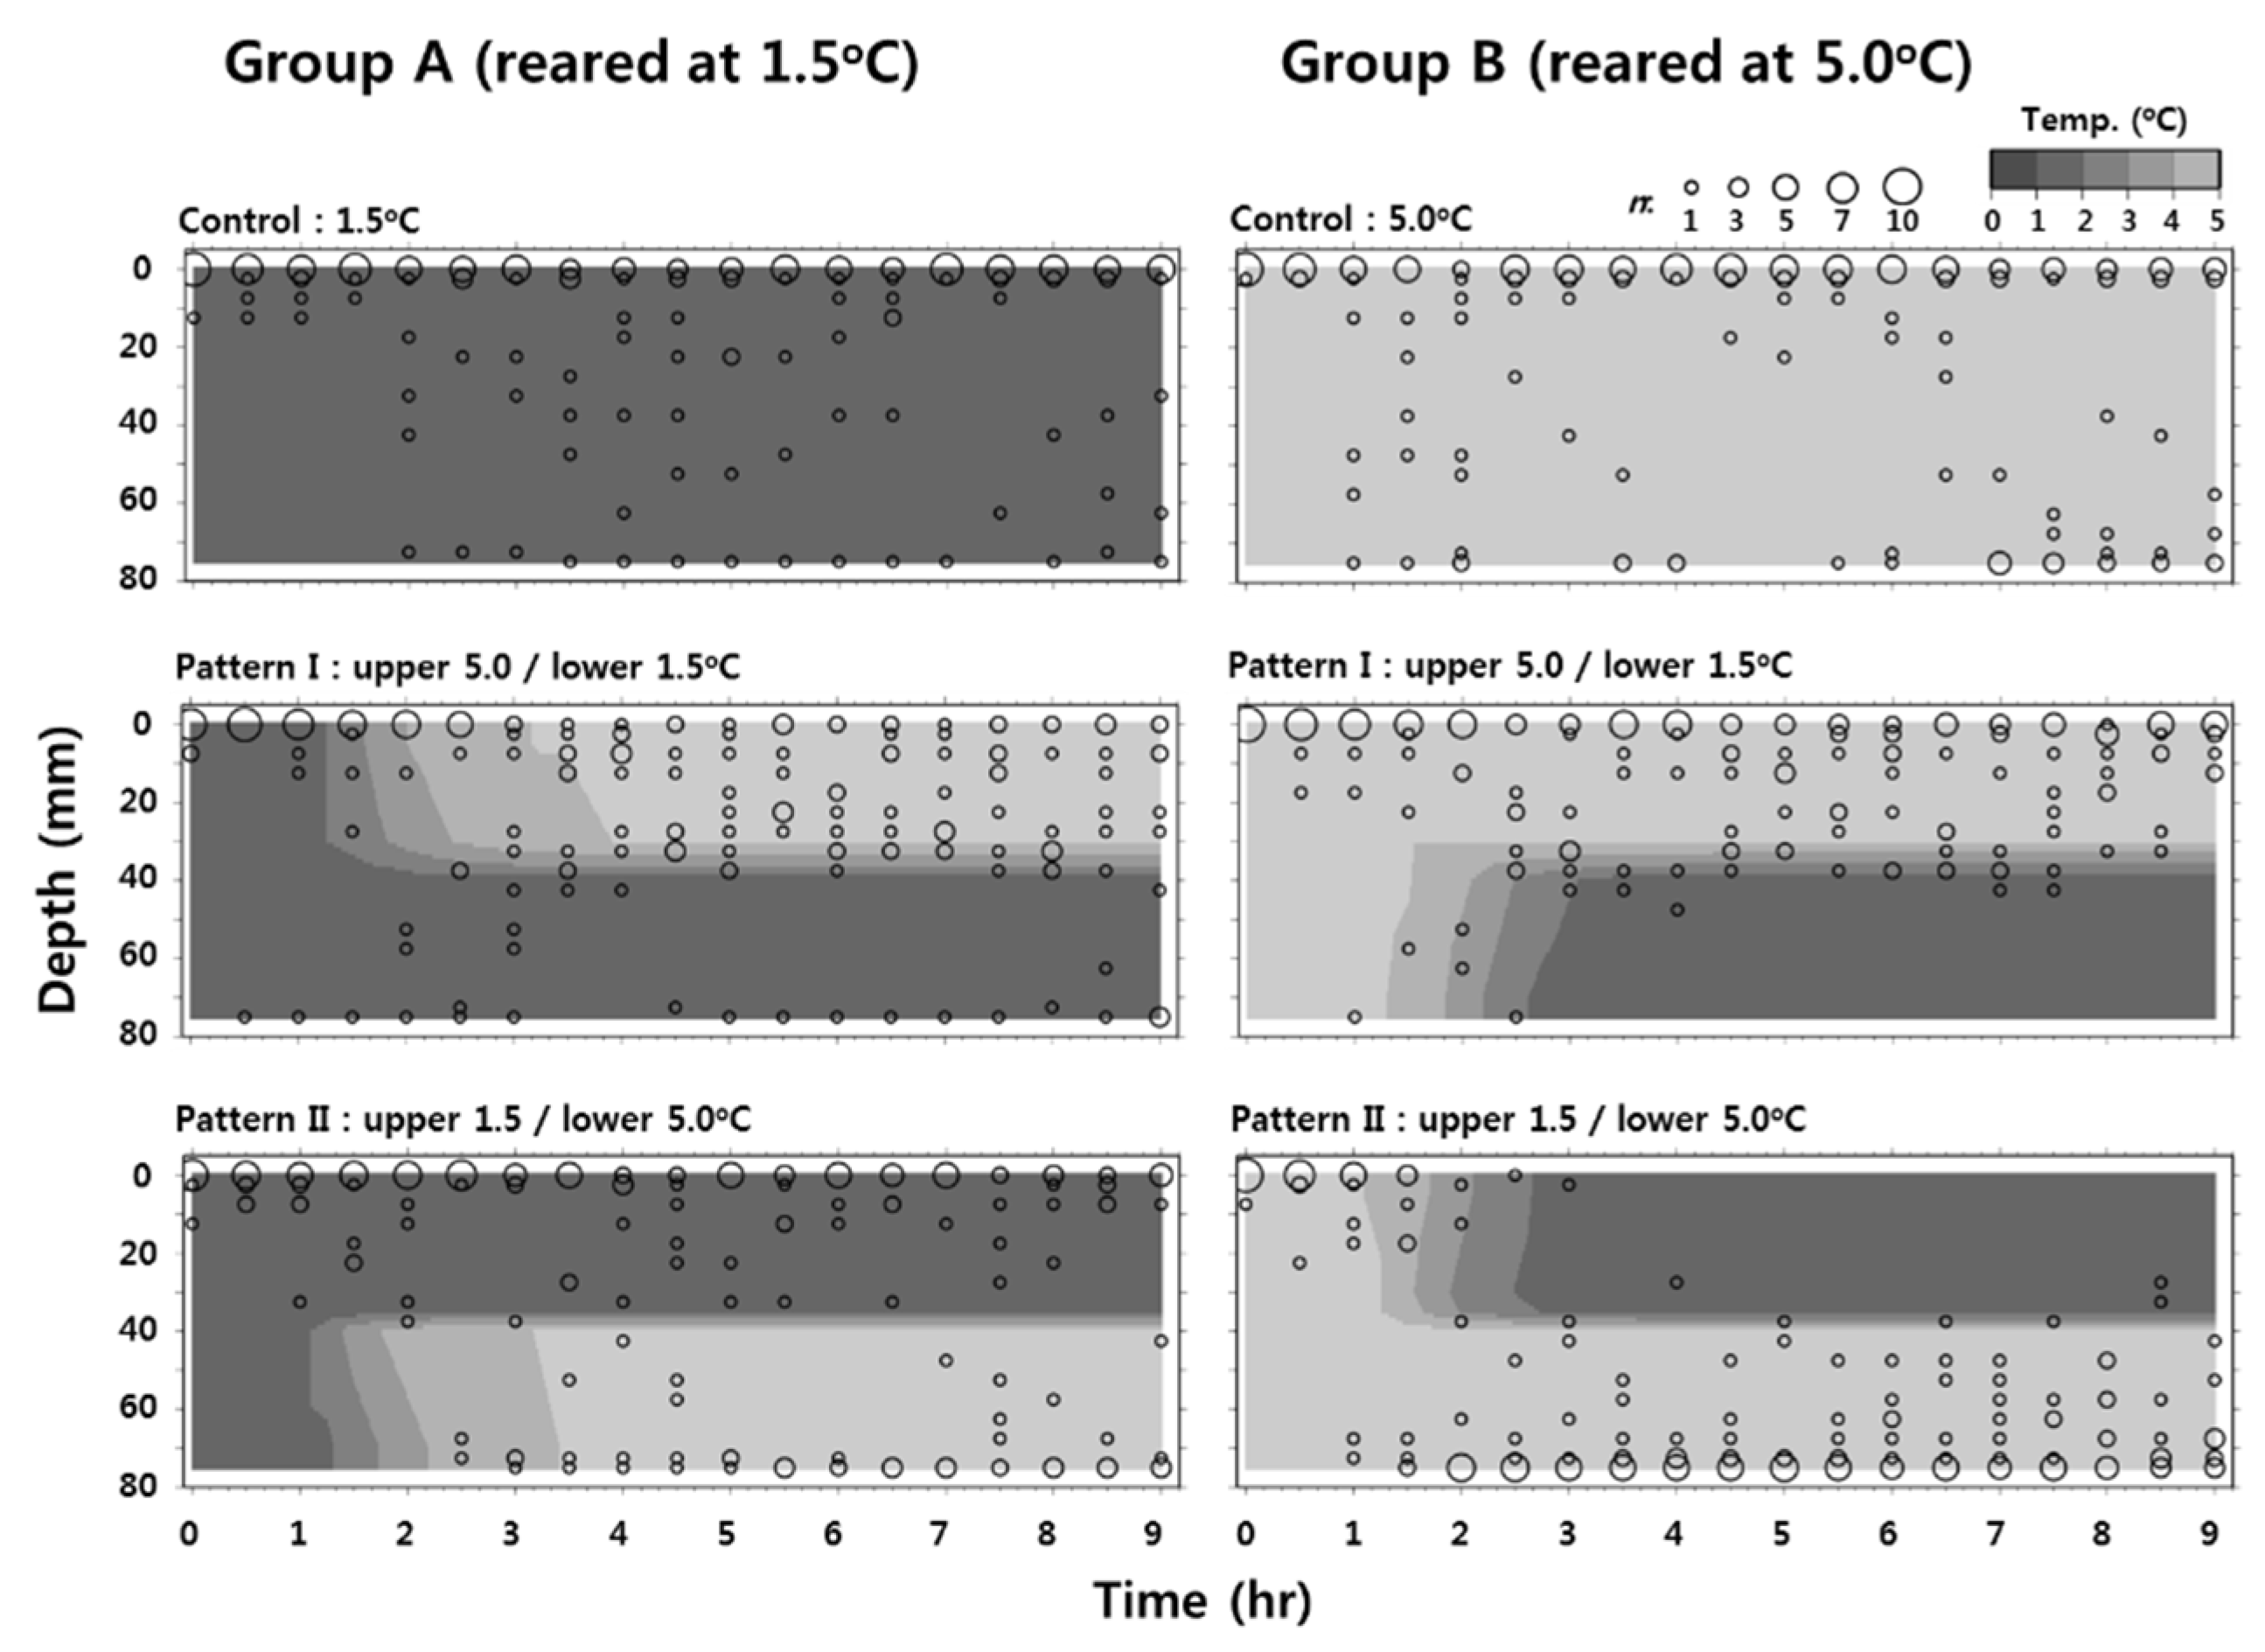
3.3. Behavioral Response of Larvae at Low Temperature

Temporal changes in the vertical distribution of larvae under three hydrographic patterns are shown in Figure 6, Figure 7, Figure 8, Figure 9, Figure 10 and Figure 11 for the three development stages. The experimental tanks formed a stable target vertical environment. Larval responses to low temperature varied depending on the rearing temperature and developmental stage. Since the larval distribution stabilized at approximately 4 h, data collected between 4 and 9 h were used for statistical analysis.
At the newly hatched stage, larvae remained in the surface layer independent of the vertical thermal pattern (Figure 6). Between 4 and 9 h, the larvae occurred most abundantly at the surface (Figure 7, χ2-test, Ryan’s method, p < 0.01). At the mouth opening stage, larvae generally occurred in the surface or the upper half of the columns except for Group B larvae in Pattern II (Figure 8). Group B larvae (rearing temperature 5.0 °C) in Pattern II (1.5 °C/5.0 °C) moved to the lower half of the water column where the temperature was 5.0 °C. With the exception of Group B larvae in Pattern II, larvae were most abundant in the surface layer (Figure 9, χ2-test, Ryan’s method, p < 0.01). Meanwhile, Group B larvae in Pattern II occurred most abundantly in the deep layer (Figure 9, χ2-test, Ryan’s method, p < 0.01). The distribution of the larvae with their yolk sac almost completely absorbed showed a pattern similar to that observed at the mouth opening stage. Except for the distribution of Group B in Pattern II, the larvae generally occurred in the surface or upper half of the columns (Figure 10). In these columns, larvae were most abundant in the surface layer (Figure 11, χ2-test, Ryan’s method, p < 0.01). Larvae of Group B in Pattern II were distributed in the lower half of the water column (Figure 10) and most abundantly in the bottom layers (Figure 11, χ2-test, Ryan’s method, p < 0.01).

4. Discussion

The aim of current study was to evaluate the effect of low temperature on the early life stage in walleye pollock. According to Craik and Harvey’s [19] report overall egg specific density is lowered by incorporating fluid with lower osmotic potential than marine environment. In this study, egg size and specific density varied in each batch; they were lighter than the coastal Oyashio water mass throughout development. These results indicate that eggs hatch near the surface.
Larval survival time increased as the temperature decreased, perhaps due to a decrease in the metabolic rate at lower temperatures [20]. However, the D50 was similar at 0.3 °C and 4.9 °C. Additionally, the specific density of larvae was lower than that of the coastal Oyashio water mass, suggesting that larvae remain in the surface layer if they do not swim. In the polar regions, many fish endure the freezing point of seawater with the help of antifreeze proteins and can survive under sea ice [21,22,23,24,25,26]. Since walleye pollock larvae do not produce such proteins in cold water [27], their ability to move decreases in the cold surface water mass, and they are stranded without the ability to escape.
Group A larvae (hatched and reared at 1.5 °C) occurred abundantly in the surface and upper half of the water column regardless of the vertical temperature pattern. Meanwhile, larvae of Group B (hatched and reared at 5.0 °C) sought the deeper layer when the temperature of the upper half of the water column decreased to 1.5 °C. Similarly to our result, Olla and Davis [28] showed avoidance of cold water (3 °C) in larvae from the thermal gradient. These behaviors suggested that larvae that hatched at a low temperature lacked the ability to escape the low temperature conditions, whereas larvae that hatched at 5 °C appeared to be able to exercise some temperature preference. Funamoto et al. [29] found that the recruitment of Japanese Pacific stocks of walleye pollock was low when the sea surface temperature in February around Funka Bay was <2 °C and increased with increasing temperature. Porter [30] reported a decrease in the metabolic rate and lower activity at 3 °C than at 6 °C, while Paul [31] suggested that larvae that hatched at 3 °C were less successful at capturing prey than those that hatched at 5 °C or 6 °C. Furthermore, Bailey and Stehr [32] showed through laboratory studies that a feeding delay of four days caused high mortality and a low growth rate in hatching larvae. Yokota et al. [33] suggested that growth and survival of walleye pollock larvae were relatively higher with shorter period of starvation after hatching at 5 °C. These results suggested that survival during the early life stages in walleye pollock is not significantly different at low temperature, but behavioral response is decreased at low temperature outside of optimal water temperature range.
The fact that eggs and larvae are lighter than the surrounding water is normally an advantage to the fish with respect to recruitment and survival. The Japanese Pacific stock’s nursery is in the Funka Bay [7], and the current driven by the northwest wind transports eggs into the Funka Bay from the spawning area [8]. Funamoto et al. [14] found that recruitment was high under predominant northwest winds in February, probably due to an increase in the transport of the eggs and larvae to the nursery area. Funka Bay likely provides a safe nursery for walleye pollock, and therefore, it is important that the eggs and larvae of this stock are transported into Funka Bay. A recent study suggested that buoyancy is the important factor to determine the proportion that is transported to and remains in Funka Bay [34]. The buoyancy of the eggs and larvae thus appear to allow transport to the nursery area. However, this property also can lead to increased mortality when the surface layer is made up of cold water, such as from the Oyashio current. Thus, it appears that the eggs and larvae need to contend with a trade-off between transport to the nursery and high mortality due to a possible influx of cold water.
In conclusion, survival of early life stages of walleye pollock in our laboratory study was not dramatically affected by low water temperature; however, a decrease of behavioral response could affect growth and/or survival by leading to a decrease in feeding and metabolic activity.

Author Contributions

Funding acquisition, W.-J.K.; Supervision, H.-K.Y. and Y.S.; Validation, H.-J.L.; Methodology, H.-K.Y.; Writing—original draft, H.-K.Y.; Writing—review and editing, S.-G.B., H.-K.Y. and J.Y. All authors have read and agreed to the published version of the manuscript.

Funding

Aquaculture technology development for the species inhabiting Korean coasts of the East Sea: R2021006.

Institutional Review Board Statement

Not applicable.

Informed Consent Statement

Not applicable.

Data Availability Statement

Not applicable.

Acknowledgments

This research was funded by Aquaculture technology development for the species inhabiting Korean coasts of the East Sea (grant number R2021006).

Conflicts of Interest

The authors declare no conflict of interest.

References

  1. Tsuji, S. Alaska pollack population, Theragra chalcogramma, of Japan and its adjacent waters, I: Japanese fisheries and population studies. Mar. Behav. Physiol. 1989, 15, 147–205. [Google Scholar] [CrossRef]
  2. Springer, A.M. A review: Walleye pollock in the North Pacific? How much difference do they really make? Fish. Oceanogr. 1992, 1, 80–96. [Google Scholar] [CrossRef]
  3. Hamatsu, T.; Yabuki, K.; Watanabe, K. Decadal changes in reproduction of walleye pollock (Theragra chalcogramma) off the Pacific coast of northern Japan. Fish. Oceanogr. 2004, 13, 74–83. [Google Scholar] [CrossRef]
  4. Funamoto, T. Temperature-dependent stock-recruitment model for walleye pollock (Theragra chalcogramma) around northern Japan. Fish. Oceanogr. 2007, 16, 515–525. [Google Scholar] [CrossRef]
  5. Maeda, T.; Takahashi, T.; Ijichi, M.; Hirakawa, H.; Ueno, M. Ecological studies on the Alaska pollack in the adjacent waters of the Funka Bay, Hokkaido [Japan], 2: Spawning season. Bull. Jpn. Soc. Sci. Fish. 1976, 42, 1213–1222. [Google Scholar] [CrossRef]
  6. Nakatani, T. Studies on the early life history of walleye pollock Theragra chalcogramma in Funka bay and vicinity, Hokkaido [Japan]. Mem. Fac. Fish. Hokkaido Univ. 1988, 35, 1–46. [Google Scholar]
  7. Nakatani, T.; Maeda, T. Transport Process of the Alaska Pollack Eggs in Funka Bay and the Adjacent Waters, Hokkaido. Nippon Suisan Gakkaishi Jpn. Ed. 1981, 47, 1115–1118. [Google Scholar] [CrossRef] [Green Version]
  8. Shimizu, M.; Isoda, Y. The transport process of walleye pollock eggs into Funka bay [Hokkaido, Japan] in winter. Bull. Jpn. Soc. Fish. Oceanogr. 1997, 61, 134–143, (In Japanese with English Abstract). [Google Scholar]
  9. Blood, D.M.; Matarese, A.C.; Yoklavich, M.M. Embryonic development of walleye pollock, Theragra chalcogramma, from Shelikof Strait, Gulf of Alaska. Fish. Bull. 1994, 92, 207–222. [Google Scholar]
  10. Nakatani, T.; Maeda, T. Thermal Effect on the Development of Walleye Pollock Eggs and Their Upward speed to the Surface. Nippon Suisan Gakkaishi 1984, 50, 937–942. [Google Scholar] [CrossRef]
  11. Ohtani, K. Studies on the change of the hydrographic conditions in the Funka Bay II. Characteristic of the waters occupying the Funka Bay. Bull. Fac. Fish. Hokkaido Univ. 1971, 22, 58–66, (In Japanese with English Abstract). [Google Scholar]
  12. Ohtani, K. Water exchange of the Funka Bay. Bull. Coast. Oceanogr. 1979, 17, 50–59. (In Japanese) [Google Scholar]
  13. Isoda, Y.; Hasegawa, N. Heat budget of Funka Bay. Umi to Sora 1997, 72, 93–101, (In Japanese with English Abstract). [Google Scholar]
  14. Funamoto, T.; Yamamura, O.; Kono, T.; Hamatsu, T.; Nishimura, A. Abiotic and biotic factors affecting recruitment variability of walleye pollock (Theragra chalcogramma) off the Pacific coast of Hokkaido, Japan. Fish. Oceanogr. 2013, 22, 193–206. [Google Scholar] [CrossRef]
  15. Yoo, H.K.; Yamamoto, J.; Saito, T.; Sakurai, Y. Laboratory observations on the vertical swimming behavior of Japanese common squid Todarodes pacificus paralarvae as they ascend into warm surface waters. Fish. Sci. 2014, 80, 925–932. [Google Scholar] [CrossRef]
  16. Coombs, S.H. A density-gradient column for determining the specific gravity of fish eggs, with particular reference to eggs of the mackerel Scomber scombrus. Mar. Biol. 1981, 63, 101–106. [Google Scholar] [CrossRef]
  17. Kendall, A.W.; Kim, S. Buoyancy of walleye pollock (Theragra chalcogramma) eggs in relation to water properties and movement in Shelikof Strait, Gulf of Alaska. Eff. Ocean Var. Recruit. Eval. Parameters Used Stock Assess. Model. 1989, 108, 169–180. [Google Scholar]
  18. Ryan, T.H. Significance tests for multiple comparison of proportions, variance, and other statistics. Psychol. Bull. 1960, 57, 318. [Google Scholar] [CrossRef]
  19. Craik, J.C.A.; Harvey, S.M. The causes of buoyancy in eggs of marine teleosts. J. Mar. Biol. Ass. UK 1987, 67, 169–182. [Google Scholar] [CrossRef]
  20. Yamashita, Y.; Bailey, K.M. A laboratory study of the bioenergetics of larval walleye pollock, Theragra chalcogramma. Fish. Bull. 1989, 87, 525–536. [Google Scholar]
  21. Scholander, P.F.; Van Dam, L.; Kanwisher, J.W.; Hammel, H.T.; Gordon, M.S. Supercooling and osmoregulation in Arctic fish. J. Cell. Comp. Physiol. 1957, 49, 5–24. [Google Scholar] [CrossRef]
  22. Gordon, M.S.; Amdus, B.H.; Scholander, P.F. Freezing resistance in some northern fishes. Biol. Bull. 1962, 122, 52–62. [Google Scholar] [CrossRef]
  23. DeVries, A.L.; Wohlschlag, D.E. Freezing resistance in some Antarctic fishes. Science 1969, 163, 1073–1075. [Google Scholar] [CrossRef]
  24. DeVries, A.L.; Komatsu, S.K.; Feeney, R.E. Chemical and physical properties of freezing point-depressing glycoproteins from Antarctic fishes. J. Biol. Chem. 1970, 245, 2901–2908. [Google Scholar] [CrossRef]
  25. Osuga, D.T.; Feeney, R.E. Antifreeze glycoproteins from arctic fish. J. Biol. Chem. 1978, 253, 5338–5343. [Google Scholar] [CrossRef]
  26. Harding, M.M.; Anderberg, P.I.; Haymet, A.D.J. “Antifreeze” glycoproteins from polar fish. Eur. J. Biochem. 2003, 270, 1381–1392. [Google Scholar] [CrossRef]
  27. Stevenson, D.E.; Lauth, R.R. Latitudinal trends and temporal shifts in the catch composition of bottom trawls conducted on the eastern Bering Sea shelf. Deep Sea Res. Part II 2012, 65–70, 251–259. [Google Scholar] [CrossRef]
  28. Olla, B.L.; Davis, M.W. Effects of physical factors on the vertical distribution of larval walleye Pollock Theragra chalcogramma under controlled laboratory conditions. Mar. Ecol. Prog. Ser. 1990, 63, 10–112. [Google Scholar] [CrossRef]
  29. Funamoto, T.; Yamamura, O.; Shida, O.; Itaya, K.; Mori, K.; Hiyama, Y.; Sakurai, Y. Comparison of factors affecting recruitment variability of walleye pollock Theragra chalcogramma in the Pacific Ocean and the Sea of Japan off northern Japan. Fish. Sci. 2014, 80, 117–126. [Google Scholar] [CrossRef]
  30. Porter, S.M. Effects of size and light on respiration and activity of walleye pollock (Theragra chalcogramma) larvae. J. Exp. Mar. Bio. Ecol. 2001, 256, 253–265. [Google Scholar] [CrossRef]
  31. Paul, A.J. Light, temperature, nauplii concentrations, and prey capture by first feeding pollock larvae Theragra chalcogramma. Mar. Ecol. Prog. Ser. 1983, 13, 175–179. [Google Scholar] [CrossRef]
  32. Bailey, K.M.; Stehr, C.L. Laboratory studies on the early life history of the walleye pollock, Theragra chalcogramma (Pallas). J. Exp. Mar. Bio. Ecol. 1986, 99, 233–246. [Google Scholar] [CrossRef]
  33. Yokota, T.; Nakagawa, T.; Murakami, N.; Chimura, M.; Tanaka, H.; Yamashita, Y.; Funamoto, T. Effects of starvation at the first feeding stage on the survival and growth of walleye Pollock Gadus chalcogrammus larvae. Fish. Sci. 2016, 82, 73–83. [Google Scholar] [CrossRef]
  34. Kuroda, H.; Takahashi, D.; Mitsudera, H.; Azumaya, T.; Setou, T. A preliminary study to understand the transport process for the eggs and larvae of Japanese Pacific walleye pollock Theragra chalcogramma using particle-tracking experiments based on a high-resolution ocean model. Fish. Sci. 2014, 80, 127–138. [Google Scholar] [CrossRef]
Figure 1. General design of the experimental tank system (Reprinted by permission from Springer Nature: Fisheries Science, Laboratory observations on the vertical swimming behavior of Japanese common squid Todarodes pacificus paralarvae as they ascend into warm surface waters, Yoo et al., copyright. 2014. [15]). (a) The two cylindrical tanks were each surrounded by an upper and lower water bath. (b) Three vertical patterns.
Jmse 09 00818 g001
Figure 2. Change in specific density of walleye pollock eggs over time; n = 20 at each measurement. The horizontal line shows the density of the coastal Oyashio water (σt 26.4).
Jmse 09 00818 g002
Figure 3. Change in specific density of walleye pollock larvae; n = 20. (NB: This experiment was incomplete as sufficient larvae were unavailable.) The horizontal line shows the density of the coastal Oyashio water (σt 26.4).
Jmse 09 00818 g003
Figure 4. Cumulative mortality (%) of walleye pollock larvae at six temperatures (n = 600 at 0.3–7.4 °C; n = 500 at 10.0 °C).
Jmse 09 00818 g004
Figure 5. Number of days to 50% mortality (D50) in walleye pollock larvae at six temperatures.
Jmse 09 00818 g005
Figure 6. Temporal changes in the vertical distribution of newly hatched walleye pollock larvae. Three thermal vertical patterns were used: Control and Pattern I and II. The size of the open circles reflects the number of larvae seen at each time (h) and depth.
Jmse 09 00818 g006
Figure 7. Relative number (%) of newly hatched walleye pollock larvae in the three hydrographic patterns; average calculated from six replicates (n = 610).
Jmse 09 00818 g007
Figure 8. Temporal changes in vertical distributions of walleye pollock larvae at mouth opening stage larvae. Three thermal vertical patterns were used: Control and Patterns I and II. The size of the open circles reflects the number of larvae seen at each time (h) and depth.
Jmse 09 00818 g008
Figure 9. Relative number (%) of walleye pollock larvae at the mouth opening stage in the three hydrographic patterns; average calculated from six replicates (n = 610).
Jmse 09 00818 g009
Figure 10. Temporal changes in the vertical distribution of walleye pollock larvae with yolk sac almost completely absorbed. Three thermal vertical patterns were used: Control and Patterns I and II. The size of the open circles reflects the number of larvae seen at each time (h) and depth.
Jmse 09 00818 g010
Figure 11. Relative number (%) of walleye pollock larvae with yolk sac almost completely absorbed in the three hydrographic patterns; average calculated from six replicates (n = 610).
Jmse 09 00818 g011
Table 1. Mean and standard deviation of fertilized walleye pollock egg diameter (mm) less than 1 day post fertilization; n = 30. (ANOVA, F = 225.9, d.f. = 3,116, p < 0.001).
BatchMeanSDRange
11.3560.0141.331–1.386
21.4060.0101.385–1.429
31.4140.0091.398–1.432
41.4250.0121.403–1.451
Table 2. Specific density (σt) of fertilized walleye pollock eggs (<1 day post fertilization; n = 20). For comparison, the density of the coastal Oyashio water mass is 26.4 (σt).
BatchMeanSDRange
123.0580.08422.909–23.195
222.9950.05322.924–23.103
322.8700.08922.719–23.032
422.5490.07722.403–22.637
Table 3. Specific density (sigma-t) of newly hatched walleye pollock larvae, n = 20. (Tukey-HSD test, p < 0.05).
BatchMeanSDRange
123.1210.983 ab21.135–24.493
223.2680.439 a22.623–24.289
322.9350.965 abc21.739–24.614
422.3531.006 c20.6791–24.162
Values with different letters are significantly different (p < 0.05).
Publisher’s Note: MDPI stays neutral with regard to jurisdictional claims in published maps and institutional affiliations.

