
Shortcut Faults and Lateral Spreading Activated in a Pull-Apart Basin by the 2018 Palu Earthquake, Central Sulawesi, Indonesia


1
Central Research Institute of Electric Power Industry, 1646 Abiko, Abiko-shi 270-1194, Japan
2
PASCO Corporation, 1-1-2 Higashiyama, Meguro-ku, Tokyo 153-0043, Japan
*
Author to whom correspondence should be addressed.
Remote Sens. 2021, 13(15), 2939; https://doi.org/10.3390/rs13152939
Submission received: 8 June 2021
/
Revised: 19 July 2021
/
Accepted: 21 July 2021
/
Published: 27 July 2021
(This article belongs to the Special Issue Into the Seismic Cycle: Remote Sensing of Ground Deformation and Earthquake Activity)
Abstract
:Our understanding of pull-apart basins and their fault systems has been enhanced by analog experiments and simulations. However, there has been scarce interest to compare the faults that bound pull-apart basins with surface ruptures during earthquakes. In this study, we investigated the effects of a 2018 earthquake (Mw 7.5) on a pull-apart basin in the Palu–Koro fault system, Sulawesi Island, Indonesia, using geomorphic observations on digital elevation models and optical correlation with pre- and post-earthquake satellite images. A comparison of active fault traces determined by geomorphology with the locations of surface ruptures from the 2018 earthquake shows that some of the boundary faults of the basin are inactive and that active faulting has shifted to basin-shortcut faults and relay ramps. We also report evidence of lateral spreading, in which alluvial fan materials moved around the end of the alluvial fan. These phenomena may provide insights for anticipating the location of future surface ruptures in pull-apart basins.
1. Introduction
Pull-apart basins are tensile structures associated with lateral-displacement faults; they form by the development of a group of secondary normal faults oblique to the main lateral-displacement fault [1,2,3,4,5,6,7,8]. The development of pull-apart basins has been explored with analog sandbox models [7,8,9,10,11,12,13,14] and model calculations [15,16,17,18,19]. Wu et al. [8] used sandbox models of pure strike-slip and transtensional basement fault systems to investigate the development of pull-apart basins in both contexts. They reported that en-echelon sidewall faults oblique to the principal displacement zones develop first (Figure 1a), forming a primary pull-apart basin. Eventually, lateral faults form shortcuts that transfer displacement across the basin (Figure 1b), and the basin subsides further upon the formation of relay ramps connecting the sidewall faults (Figure 1c). Next, lateral and vertical displacements separate into distinct domains along the basin-boundaries, enabling smaller internal basins to form and elongating the entire pull-apart basin (Figure 1d). The mature pull-apart basin eventually transitions into a simple lateral fault zone [6,20]. The Dead Sea Basin of the Dead Sea fault system [3,21,22] and the Gulf of California along the San Andreas fault zone [23,24,25] have been shown to display active fault properties that are consistent with sandbox experiments, and their development has been compared with analog experiments [12]. On the other hand, we have had the opportunity to compare the submerged coseismic surface ruptures with the faults that constitute a pull-apart basin during the 1912 Marmara and 1999 Izmit earthquakes in the northern Anatolian fault system [26,27,28] and the 1995 Nuweiba earthquake in the Gulf of Aqaba in the southern Dead Sea fault system [29]. However, there are few opportunities to compare the coseismic surface rupture and active fault using detailed remote sensing and high-precision topographic data on the ground.
In Sulawesi Island, Indonesia, a pull-apart basin is present near the city of Palu along the Palu–Koro fault (Figure 2), which ruptured during the Mw 7.5 earthquake on 28 September 2018 (‘the 2018 earthquake’ hereafter), causing extensive damage, mainly in the Palu basin, the southward structural continuation of Palu Bay, due to the subsequently generated tsunami waves and liquefaction landslides [30,31,32]. The earthquake produced distinct surface ruptures in the Palu basin [33,34,35,36], and many studies have used satellite and seismic data to estimate fault models and rupture propagation [37,38,39,40,41,42,43,44,45]. However, only a few studies [34,35,36] have adequately compared the distribution of active faults, defined on the basis of geomorphic features, with the location of the 2018 surface ruptures. Such a study may provide insights that can improve predictions of where surface ruptures will appear during earthquakes in this and other pull-apart basins.
In this study, we used optical correlation method using Sentinel-2 and SPOT-6 optical satellite imagery to locate the surface ruptures of the 2018 earthquake. We also used digital elevation model (DEM) data to determine the detailed topography of the Palu–Koro fault system and identified active segments of the faults defining the Palu pull-apart basin on the basis of geomorphology (‘geomorphically active faults’ hereafter). As a result, we found that some of the geomorphically active boundary faults of the Palu basin were inactive and that a newly identified basin-shortcut fault was active during the 2018 earthquake. Furthermore, we found that lateral spreading, which is independent of the direction of fault movement, may have occurred simultaneously within the nearly flat interior of the basin.
2. The 2018 Palu Earthquake
The 28 September 2018 earthquake caused extensive damage, mainly within the Palu basin (Figure 3). The earthquake was triggered by the rupture of more than 200 km of the Palu–Koro fault extending from the Tanimbaya Peninsula in the north to near Labua in the south [37,38,39,40,41,42,43]. Post-earthquake field surveys mapped a surface rupture 70 km long in the Palu basin [33,34,35,36], and surface ruptures on the seafloor of Palu Bay were documented after the earthquake [36]. The earthquake caused left-lateral displacements as great as about 6 m and vertical displacements of about 5 m at the surface [33,34,35,36]. Liquefaction-induced landslides within the Palu basin also caused significant damage [30,31,32].
The Sulawesi Island is a complex of several microplates near the Eurasian, Philippine Sea, and Australian plates added to the Early Cretaceous, Late Cretaceous, and Early Miocene orogen [48,49,50,51,52]. The Palu–Koro fault is the suture of the Sula and Makassar blocks (Figure 2) [46] and cuts the Cenozoic volcanic and plutonic rocks in the center of the island [52,53,54,55]. The active part of this fault is a left-lateral fault between the Sula and Makassar blocks that strikes N20° W and extends about 500 km from beneath the Makassar Strait into the central section of Sulawesi Island. The onshore section of the Palu–Koro fault has been mapped based on satellite images and 30-m DEMs [56,57,58,59]. A post-earthquake airborne lidar survey allowed the active fault to be mapped in detail [36]. A geologic slip rate of 35 ± 8 mm/yr was reported for the Palu–Koro fault based on cumulative river offsets within the Palu basin [59]. A geodetic slip velocity of ~40 mm/year was estimated from GPS surveys since 1992 [47,60,61,62]. The paleoseismic record estimated from trenching studies includes at least three events in the past 2000 years for an average recurrence interval of 700 years [57]. Furthermore, paleoseismic trenching conducted in the southern part of the basin after the 2018 earthquake [63] revealed that five earthquakes had occurred since A.D. 1338, including the 2018 earthquake, and estimated a shorter average activity interval of 130 years, suggesting that recent paleoseismic events may have been missed in the trench survey [57] conducted on the left flank of the Palu basin.
3. Methods
Although the Palu–Koro fault has been mapped from satellite imagery and 30-m DEMs, tectonic features may have been missed given the dense tropical vegetation on Sulawesi Island. Even mapping based on the post-earthquake lidar survey [36] does not fully clarify the relationship of active fault traces to terraces, fans, or offset rivers. In this study, we performed an integrated topographic interpretation along the Palu–Koro fault using stereopaired morphometric protection index red relief image maps (MPI-RRIMs) [64] based on DEMNAS, a free DEM in Indonesia with an accuracy of about 8.3 m (Figure 4). Stereopaired MPI-RRIMs simultaneously represent the basic terrain parameters of elevation, slope, and convexity and are effective for extracting small tectonic geomorphic features [64]. We created the stereopairs using ArcGIS software (ESRI), QGIS (QGIS Development Team), and the MPI-RRIMs Calculator software package [64], and we extracted fluvial terraces, alluvial fans, landslides, river offsets, wind gaps, and pressure ridges and identified both geomorphically active and presumed fault traces with high reliability.
To determine the location of the 2018 surface rupture in plain view, we used optical correlation with the Cosi-Corr method [65,66]. The Cosi-Corr method is used to construct maps of E–W and N–S horizontal displacement based on optical images obtained by satellites and aircraft. It has been used extensively for studies of earthquakes, landslides, and glacier dynamics [67,68,69,70,71,72], and several studies have used optical correlation to model the faulting of the 2018 earthquake [38,40,41,43,44]. For this study, we used Sentinel-2 images (orthorectified Level-1C) from before and after the earthquake (Table 1) to create maps of N–S and E–W horizontal displacement for the entire epicentral region. The primary images were taken on 27 September 2018, the day before the earthquake, and on 2 October 2018, four days after the earthquake, to avoid the influence of afterslip. For the Tanimbaya Peninsula (Figure 3), images from 17 September and 22 October 2018 were used to avoid cloud cover. The Cosi-Corr software parameters were as follows: window size, 32 × 32; X and Y step size, 1; robustness iteration, 3 times; and mask threshold, 0.9. A Non-Local Means Filter [73] was applied to the output results, with the H noise parameter set to 2, search area dimension to 21, and patch size to 5 × 5. ENVI software and ENVI classic (both from ESRI) were used for this analysis.
The Level-1c image of Sentinel-2 is orthorectified using band 4 (Red) image, using the previous Sentinel-2 image as a reference image, and obtaining the ground control point by image correlation [74]. The absolute value of the output result may not be correct because the orthorectification was not done by image correlation pre- and post-earthquake. Therefore, when using the Level-1c image, it is possible to determine the location of the discontinuity line that appeared with the earthquake, but it is difficult to determine the exact direction and amount of crustal deformation. Therefore, we additionally conducted an optical correlation using SPOT-6 images (Table 2) to determine the exact direction of crustal deformation (vector field) during an earthquake. The bands used were those of the bundle (P+MS), and the DEM of DEMNAS was used to orthorectify the pre-earthquake images. The post-earthquake images were orthorectified by matching them to the orthorectified pre-earthquake images. The orthorectification process described above was performed using the RPC Orthorectification Workflow and RPC Orthorectification Using Reference Image of ENVI software. The parameters of Cosi-Corr were as follows: window size, 128 × 32; X and Y step size, 8; and the rest of the parameters were the same as for the Sentinel-2 image. Using the output N–S and E–W displacement maps, a vector field was created using the model builder function on the Arc GIS software (Data S2 of Supplementary Materials). In particular, the Raster Calculator tool was used to calculate the amount and direction of displacement from both images, and the Focal Statistics tool was used to smooth the vector spacing to the desired output. We created a shapefile containing the displacement values and the direction of displacement (−180 to 180 degrees).
4. Results
4.1. Fluvial Terraces and Fans
Our geomorphic mapping from MPI-RRIM stereopairs shows that fluvial terraces are widely distributed in the study area (Figure 5). We divided the terraces into five levels from high to low (H2, H1, M2, M1, and L1) on the basis of their height with respect to the modern riverbed and their continuity. We also mapped many steeply sloping alluvial fans in the Palu basin. Although it is sometimes difficult to clearly distinguish terraces from alluvial fans, we considered them to be geomorphic surfaces of approximately the same age and classified them as parts of the same surfaces (Figure 6). We did not distinguish between marine and fluvial terraces, although some terraces along the coast were probably more strongly influenced by marine than fluvial forces.
The L1 surface extends from about the same elevation as the modern riverbed to about 10 m above it and includes the largest area of terraces in the study area. Although there is no direct evidence of the age of terrace, they are thought to be abandoned surfaces no older than 7–5 ka, the Holocene sea-level high in the Pacific Rim [75].
The M1 surface is about 30–50 m above the modern riverbed and is widely present in the study area. Bellier et al. [58] reported a 10Be exposure age of 11,000 ± 2300 years from the gravel of a fan on the M1 surface at an elevation of 60 m on the west flank of the Palu basin (Figure 5c). Therefore, the M1 surface is considered a geomorphic surface abandoned by rapid incision during the Younger Dryas [76], immediately after the Last Glacial Maximum.
The M2 surface is about 100–130 m above the modern riverbed and has a more fragmented distribution than the L1 and M1 surfaces. Uplift associated with faulting appears to have affected the preservation of the surface. Bellier et al. [58] reported 10Be exposure ages of 40,000 ± 6800, 62,000 ± 11,000, and 80,000 ± 13,000 years from the gravels of a fan on the west flank of the Palu basin at elevations of 125–145 m, corresponding to the M2 terraces. However, they concluded that these ages reflected rejuvenation by reworking after the formation of the terrace surface and that the M2 terraces were abandoned at 125 ± 20 ka during MIS 6.
The H1 surface is about 170 m above the modern riverbed, and although it is widely distributed from the Tanimbaya Peninsula to the Palu basin (Figure 5a–d), it is highly fragmented in the southernmost part of the study area (Figure 5e). The H1 surface is relatively well preserved along the coast in the northern part of the study area (Figure 5a,b), but poorly preserved in the inland part (Figure 5c,d) due to dissection. Bellier et al. [58] reported anomalously young 10Be exposure ages (5000 ± 1200 years BP) from the gravel at 190 m elevation on the west flank of the Palu basin (Figure 5c), which we are convinced is also a rejuvenated age. Perhaps they have measured young gravel that has recently rolled over the terrace. The H1 surface is likely a topographic surface that was abandoned during the 250–145 ka glacial period.
The H2 surface is mapped only in a small part of the hills east of the head of Palu Bay (Figure 5c). It is very high, more than 450 m above the modern riverbed, and its origin and the age of its abandonment are unconstrained.
4.2. Tectonic Geomorphology
Our geomorphic mapping detected many fault scarps, flexures, tilts, systematic river offsets, wind gaps, and pressure ridges in the study area, which we used to identify geomorphically active fault traces. Here, these are described from north to south in the order of their locality (Loc.) numbers shown in Figure 5.
Near the Tanimbaya Peninsula (Figure 5a), near the epicenter of the 2018 earthquake, no distinct features of fault displacement were seen on the terrace surfaces. Nonetheless, an alignment of debris-filled valleys and multiple terrace planes (Locs. 1 and 2) and wind gaps (Loc. 3) in the inland area suggests that it was the site of faulting activity that caused relative uplift in the west, and we inferred an active fault line there. However, this presumed active fault line ends farther south near Loc. 4 (Figure 5b) as signs of activity appear on a right-offset fault segment near the coast.
Farther south, the H1 terraces form a N–S alignment near the west coast (Loc. 5, Figure 5b). Inland from these is a debris-filled valley near Loc. 6 and a wind gap near Loc. 7, defining a presumed active transtensive fault with uplift on the west side. The right-stepping arrangement of this fault segment and the segment to the north shows a sense of left-lateral displacement consistent with the present fault sense of motion, dating back as far as the time the H1 surface formed (250–145 ka).
Farther south near the head of Palu Bay, several west-facing fault scarps were identified on the terrace surface, including one on the H1 plane at Loc. 8 and another between the L1 and M2 planes at Loc. 9 (Figure 5c). The presence of these scarps implies that the fault was active after the M2 surface was abandoned (125 ± 20 ka). South of Loc. 9, distinct fault features appear on both flanks of the Palu basin (Figure 5d). On the east flank, the N–S-trending faults bend sharply just south of Loc. 10 into a set of short faults 1–6 km in length, oriented northwest–southeast (Loc. 11). The left-lateral river offsets on the H1 terrace at Loc. 10 and on the M2 terrace at Loc. 11 indicate that these faults on the east flank were likely continuously active from 250 ka to 11 ka. On the west flank, several faults show strong left-lateral displacement. A river crossing an alluvial fan correlated with the M1 terrace at Loc. 13 is laterally displaced more than 300 m, from which an average slip rate of 35 ± 8 mm/year has been estimated [59]. On the mountainside near Loc. 14, a fault displaces a river that dissects the H1 terrace, and two other faults that border the H1 and M1 terraces have east-facing scarps. To the south, the faults bend to southeast and display a stairstep series of east-facing scarps near the sampling point of Bellier et al. [58]. In addition, Patria and Putra [34] pointed out several pressure ridges in the interior of the basin from Palu Bay to Loc. 15 (Figure 5c), but we could not determine whether these are pressure ridges with certainty, except for the clear one in Loc. 15.
Toward the south, tectonic features continue on both flanks of the Palu basin (Figure 5d). On the east side, several short, parallel faults about 1.5 to 5 km long and trending NW–SE are present at Loc. 16 with downdropped western sides. These faults displace the H1, M2, and M1 planes, suggesting that they were active between 250 and 11 ka. At Loc. 17, the relatively well-preserved surface of the H1 plane tilts about 8% (4.5°) toward the southwest. Although we cannot rule out the possibility that this tilt is an original feature, it may result from repeated faulting. South of Loc. 17, the basin-bounding fault divides into a southward-continuing fault and an eastward splay mapped as the Sapu Valley fault system [56]. From Loc. 17 to Loc. 18, a series of fresh alluvial fans are classified as M1 terraces, but they display no clear fault scarps. However, the well-developed H1 terraces around Loc. 18 display dextral pressure ridges [77], and the rivers that dissect the H1 terraces show consistent left-lateral displacement, suggesting that there are two parallel faults in this section. On the west flank, some fresh pressure ridges and east-facing fault scarps appear on the M1 terraces south of Loc. 15, and the presumed active fault is mapped on the M1 terrace. Around Loc. 19, the mountain-basin boundary is well defined but alluvial fans are poorly developed, implying that subsidence to the west exceeded the sediment supply. Watkinson and Hall [56] pointed out that the flow paths of meandering rivers are regulated in a straight line and that a cross-basin fault system is hidden inside the basin (Figure 5d). However, their speculations can be explained by differential erosion due to basement rocks, and decisive features such as fault scarps and lateral offset of tributaries could not be extracted from the basin interior by our topographic interpretation. The presumed active fault continues south and curves eastward around Loc. 20. In the vicinity of Loc. 20, the rivers on the alluvial fan that constitutes the M1 terraces show left-lateral displacement, suggesting that the fault has been active repeatedly since at least the abandonment of the M1 terrace (11,000 ± 2300 years). The faults on the east and west flanks converge at the south end of the basin near Loc. 21, where the presence of several systematic lateral river offsets and pressure ridges upon terraces suggests a very high average displacement rate. Furthermore, of the three parallel faults in the vicinity of Loc. 21, a trench survey conducted on the middle fault identified a total of five paleoseismic events in the past 700 years, including the 2018 earthquake [63]. Therefore, of the three parallel faults near Loc. 21, it is likely that the middle fault was used to release strain in relatively recent times.
From the south end of the Palu basin to its end at Labua, the Palu–Koro fault strikes N15° W and is relatively linear (Figure 5e). A well-formed, continuous pressure ridge on the M1 terrace near Loc. 22 indicates that this part of the fault has experienced repeated displacement at least since the abandonment of the M1 terrace (11,000 ± 2300 years). The active trace steps to the right south of Loc. 22, and in the vicinity of Pangana, a pressure ridge [78] and a west-facing fault scarp are present in a debris-filled valley. Between Pangana and Labua, alluvial fans equivalent to M1 or M2 terraces are present along the valleys, and the tributary rivers that dissect them display systematic left-lateral displacement.
4.3. Optical Correlation and Vector Field Results
Our optical correlation analysis revealed a linear discontinuity of N–S displacement extending about 150 km from the epicentral area of the 2018 earthquake to the south of Labua. The absolute value of the displacement shows positive (northward) in the whole area (Figure 7a) but is probably due to the ortho-correlation of Sentinel-2 at Level-1C, not the actual crustal movement. The relative displacements show that the east side moves to the north, and the west side moves to the south across the optical discontinuity. Indications of surface ruptures appeared in a segment 65 km long between the north end of Palu Bay and the area south of Pangana. Areas to the north and south of this section, however, display fragmentary color contrasts but no clear discontinuities. Profiles A–A′ and E–E′ in these respective areas (Figure 8) show broadly distributed N–S displacements of about 2 m and suggest that coseismic slips did not reach the surface.
The distribution of E–W displacement (Figure 7b) also features a linear discontinuity extending from Palu Bay to Pangana, although it is weak and fragmented compared to the distribution of the N–S displacement. All absolute values show eastward displacement, which is also considered to be an unnatural value due to orthorectification errors in Sentinel-2. The relative displacements show that the east side across the optical discontinuity shows a more significant east displacement than the west side.
In the vector field (Figure 7c) within the Palu Basin generated from SPOT-6 optical correlation, the eastern basin shows a sense of relatively northeastward movement, and the western basin shows a sense of southeastward movement after the appearance of the surface ruptures, defining the west-side fault of the basin is left-lateral component. The vectors within the basin do not uniformly show the northeast direction; for example, near Loc. 23 on the northeast side of the basin, the vectors show random disturbance. An area around Loc. 24 in the deep (southern) part of the basin shows a similar disturbance zone. They are possible that non-tectonic phenomena, different from elastic deformation associated with fault movement.
5. Discussion
5.1. Comparison of Optical Correlation Results and Tectonic Geomorphology
With our geomorphic observations and optical correlation results, we can compare our geomorphically active fault traces with the surface ruptures from the 2018 earthquake. Comparisons with the surface ruptures mapped by field surveys [33,34,35,36] may also shed light on the development of the Palu basin in the Palu–Koro fault system.
Optical correlation documented slight left-lateral displacement around Ombo, near the epicenter (Figure 7a and Figure 9a). Because the linear discontinuity of this displacement is indistinct, it is unlikely that a surface rupture occurred there. Furthermore, this discontinuity does not coincide with any of the geomorphically active fault lines in this study, indicating that these faults were not activated during the 2018 earthquake. The presence of the 2018 rupture on the floor of Palu Bay [36] suggests that the western seafloor part is more active recently. We interpret the geomorphically active faults near Ombo as en-echelon basin sidewall faults, which are likely to remain inactive in the future based on analog experiments (Figure 1a) [8]. Fragmentary surface ruptures associated with the 2018 earthquake described near Ombo [33] do not correspond to the lineaments identified by optical correlation; they are more likely to be passive and gravitational ruptures associated with seismic shaking and static crustal strain. With the development of remote sensing technology, similar phenomena have often been detected during recent earthquakes [79,80,81,82].
Farther south, around Towaja, optical correlation shows a relatively clear linear discontinuity indicating left-lateral displacement broadly consistent with the seismic mechanism of the 2018 earthquake (Figure 7a and Figure 9b). Field surveys around Towaja also reported 2018 surface ruptures with left-lateral displacement [33,35]. However, these ruptures lie west of the optical discontinuity (Figure 9b) and may be nontectonic displacements. The linear discontinuity is oblique to the geomorphically inferred active fault. This may be due to the possibilities that (1) a new fault is growing that connects the seafloor fault in Palu Bay [36] with the presumed active fault to the east, and/or (2) fault-related features are obscured by sediment supplied from highlands to the east, or we think it is more likely to be a combination of both effects.
The largest displacements of the 2018 ruptures were recorded 20 km south of Palu Bay on the west flank of the Palu basin [33,35,36] at a location that almost perfectly coincides with the optical discontinuity (Figure 7a and Figure 9c). The N–S displacement was up to 5.0–5.5 m (see profiles B-B′ and C-C′ in Figure 8), which is likely an underestimate compared to the largest lateral displacement of about 6 m measured in the field [33,35,36] and is probably due to the strikes slightly west of north. The geomorphically active faults are located farther west in the highlands and appear to be right-stepping en-echelon faults, and tension cracks on these active faults have been recognized by field survey [35]. However, both the N–S and E–W results failed to detect discontinuities corresponding to these tension cracks (Figure 7a,c and Figure 9c). In particular, the tension cracks detected by the field survey [35] are of a scale that cannot be detected by optical correlation, and we interpret these faults as having been abandoned, and the current activity appears to have shifted to basin-shortcut faults (Figure 1b) and relay ramps (Figure 1c) in the interior of the Palu basin (Figure 5c and Figure 9c). The presence of several pressure ridges between Palu Bay and Loc. 15 [34] suggests that this basin-shortcut fault has been active at least several times since the abandonment of the L1 terrace (7–5 ka). Yet the mountainside fault has a very high average slip rate of 35 ± 8 mm/year since the M1 abandonment (11,000 ± 2300 years) (Figure 5c), and paleoseismic trenching indicates that the most recent previous surface rupture event on it occurred at 900–800 years BP [57,59]. In other words, the 2018 event may be the first major earthquake that fault activity had moved from the mountains to the interior of the basin. Of course, there is no certainty that the mountainside faults will be abandoned forever, but analog experiments (Figure 1) suggest that they are unlikely to become reactive in the future.
Similarly, there is an area farther south in the Palu basin (Figure 9d) where the geomorphically active faults and the 2018 ruptures are far apart. The faults on the flanks of basin converge here (Figure 5d), but the optical correlation and the field survey [35,36] both indicate that the mountainside faults have been abandoned and the 2018 earthquake activated new shortcut faults in the basin. Although the 2018 surface ruptures in the basin appear on the L1 terraces, no fault-related geomorphic features are discernible on the L1 terrace (Figure 5d), which implies that these surface ruptures are the first to appear here since abandonment of the L1 terrace (7–5 ka).
The southern end of the 2018 surface ruptures mapped by field surveys is located around Pangana [33,35,36], consistent with our optical correlation results (Figure 9e). The locations of the geomorphically active faults and the 2018 surface ruptures are generally consistent with each other, suggesting that the same fault plane is repeatedly active in the inland mountains. The displacements measured in the field near Pangana are about 30–60 cm [36], which suggests that, where the fault strikes as close to N–S as possible, the optical correlation technique using Sentinel-2 imagery may be able to extract surface displacements with 30–60 cm accuracy.
We can compare the above results with the pull-apart basin model [8] shown in Figure 1. For example, the abandonment of mountainside faults and the activity of basin-shortcut faults (Figure 9d) inferred on the west flank of the Palu basin are consistent with the stages shown in Figure 1b,c. The abandonment of the en-echelon basin sidewall faults and the appearance of basin-shortcut faults and relay ramps in the northern part of the basin near Palu Bay (Figure 9c) is consistent with the stage shown in Figure 1c. Thus, the Palu basin is in a relatively mature stage of the pull-apart basin. If the Palu–Koro fault continues to develop in accordance with this model, the abandoned mountainside faults are unlikely to be reactivated in future earthquakes, and only the basin-shortcut faults will be activated to release lateral displacement. In fact, a mature pull-apart basin that predicts the future of the Palu basin is the Dayinshui basin, China, where only the part that completely short-cuts the basin interior was active in the 1920 earthquake [6].
5.2. Lateral Spreading Phenomena Occurring at the Pull-Apart Basin
In the N–S displacement map of the Palu basin (Figure 9c), left-lateral basin-shortcut faults appear on the west flank, but there is no evidence of activity along the east flank. According to the optical correlation result, some blank areas on the northeast side of the basin show no correlation (Figure 9c). The vector field also shows that the random ground moves (around Loc. 23 in Figure 7c), indicating that this area was subject to liquefaction landslides that caused extensive damage. Bradley et al. [30] and Watkinson and Hall [31] pointed out that the rise in groundwater level due to irrigation caused landslides on gentle slopes of only about 1°. Masson et al. [32] mentioned that these landslides coincided with the terminal part of the alluvial fan.
In the N–S displacement map of the southern Palu basin (Figure 9d), left-lateral basin-shortcut faults appear on the west flank, but there is activity along the east flank. On the other hand, the E–W displacement map shows a linear discontinuity in the basin about 1.0–1.5 km west of the geomorphically active fault trace on the east flank, from which it appears that an area of about 79,000 m2 moved relatively westward as a block by about 1 to 2 m (Figure 10a). The detailed vector field shows disturbance in the basin, although the overall trend is towards the north and there is no significant aftershock distribution along the linear discontinuity (Figure 10b). This movement cannot be explained by crustal deformation caused by the 2018 surface rupture and may indicate a lateral flow phenomenon similar to those on northwest of the basin (around Loc. 23 in Figure 7c and Figure 9c). Nevertheless, this phenomenon is called “lateral spreading” in this study to distinguish it from the northwest part of the basin because of its more extensive scale. The linear discontinuity in the E–W displacement on the east flank corresponds well with the terminal part on the east flank of the basin (Figure 11). This is consistent with the characteristics of liquefaction landslides, as pointed out by Masson et al. [32]. Although shaking-related landslides have not been reported in the southern Palu basin, lateral spreading may have occurred there by similar mechanisms. Similar lateral spreading on flat or gently sloping surfaces during earthquakes has also been reported in the Aso caldera, Japan, during the 2016 Kumamoto earthquake [83,84]. Some have argued on the basis of cumulative activity that the lateral spreading of the Aso caldera is a tectonically active fault [85]. It can be difficult to distinguish among tectonic and nontectonic linear discontinuities and lateral flow phenomena, but it should be noted that similar phenomena occur around the margins of pull-apart basins.
5.3. Lessons from the 2018 Palu Earthquake
The 2018 Palu earthquake produced surface ruptures in several locations inside the basin that did not correspond to geomorphically active faults; however, these do correspond to elements of the pull-apart basin model shown in Figure 1 [8]. Similar instances have been reported elsewhere in the world. For example, basin-shortcut faults were identified in the Haiyuan fault system, China, where they were interpreted as part of the terminal stage of the pull-apart basin [6]. The left-lateral Dead Sea fault system has two distinct pull-apart basins, the Dead Sea Basin and Elat Bay, where en-echelon basin-margin faults and short fault clusters have been identified [87,88,89,90]. The 2018 Palu earthquake is the first time, to our knowledge, that a fault has been observed transitioning into a pull-apart basin interior [8], and the characteristics of the surface ruptures from the Palu earthquake may be useful in anticipating surface ruptures in other pull-apart basins. For example, the Lake Suwa basin, a distinct pull-apart basin along the Itoigawa–Shizuoka Tectonic Line in Japan (Figure 12), is one area where the estimated risk of near-future earthquakes is increasing because the probability of a major earthquake occurring in the central section of the tectonic line within the next 30 years is 0.9–8.0% based on trenching studies documenting the paleoearthquake history [91]. In the Lake Suwa area, two groups of active dip-slip faults have been identified: the Suwako Nangan faults to the southwest and the Suwako Hokugan faults to the northeast [92,93,94]. Both fault groups converge southeastward into the co-linear, left-lateral Chino and Aoyagi faults [95]. Farther to the southeast, the Oosawa and Wakamiya faults exhibit Riedel-shear pop-up structures on their southwest slopes [96]. The sinistral fault sense, the basin spread out from a mountainous constriction, and the wet irrigation in the basin are similar to those of the Palu–Koro fault system, and it should be noted that coseismic offsets on basin-shortcut faults and lateral spreading of alluvial fans (Figure 13) may occur in the Lake Suwa area during the next major earthquake there. Borehole investigations [93] and seismic reflection surveys [97] in the Lake Suwa basin have suggested the presence of blind and negative flower-structural faults within the basin, which may represent basin-shortcut faults that have been active recently. Many rivers pour into Lake Suwa from the surrounding area, and the basin is in wet condition. Therefore, there is a high risk of coseismic lateral spreading as in the 2018 Palu earthquake.
In the Palu basin, Watkinson and Hall [56] predicted the existence of hidden faults in the basin from the width of the meandering rivers is regulated in a straight line (Figure 5d). Some basin-shortcut faults that are accompanied by weak fault scarps or pressure ridges (e.g., Loc. 15 in Figure 5c) could have been mapped as if they had used high-precision DEM data, they might have been able to predict the detailed location of the basin shortcut fault before the 2018 earthquake. In other words, we cannot rule out the possibility that the activity is not shifting to a short-cut fault instantly but is gradually shifting. The tectonic geomorphology of pull-apart basins should be evaluated on the basis of high-precision topographic data with a developmental model (Figure 1 and Figure 13) in mind.
6. Conclusions
The 26 September 2018 Palu earthquake (Mw 7.5) produced 180 km of surface ruptures along the Palu–Koro fault system on land and on the seafloor. This study used stereopairs of MPI-RRIMs to visualize the topography and map the geomorphically active faults in the Palu–Koro fault system. We also used optical correlation of Sentinel-2 and SPOT-6 satellite imagery to map the surface ruptures and surface deformation caused by the 2018 earthquake.
Our geomorphic analysis revealed multiple terrace surfaces and overlying alluvial fans. By correlation with terraces dated by 10Be age classification in previous studies, we were able to interpret these terraces as features of climate-related origin corresponding to specific marine isotope stages. Deformational geomorphic features of these terraces, such as fault scarps, flexures, pressure ridges, systematic river offsets, and wind gaps, enabled us to map detailed traces of the Palu–Koro fault. By comparing these fault traces with the locations of the 2018 ruptures and our optical correlation results, we showed that some surface ruptures on the west flank of the Palu basin do not match the geomorphic fault trace. In terms of the analog model of pull-apart basin development, the Palu basin is mature, such that the en-echelon basin sidewall faults at the mountain–basin boundary were inactive in the 2018 earthquake, while the basin-shortcut faults and relay ramps in the basin displayed the greatest coseismic activity. Previous field surveys reported a damaging landslide in the northern part of the Palu basin, and our optical correlation and its vector field also suggest that large-scale lateral spreading in a direction unrelated to the fault displacement occurred in the southern Palu basin.
Although pull-apart basins exist throughout the world and their development typically occurs on the scale of tens of thousands of years or more, the 2018 Palu earthquake revealed a snapshot of a transitional stage in which en-echelon basin sidewall faults that were active during the previous large earthquake were abandoned and an incipient area of fault activity existed in the basin interior that was not yet clearly visible in the topography. However, with high-precision topographical data, it may have been possible to identify them in advance. Our findings may be of importance in reducing hazards associated with surface ruptures; for example, at Lake Suwa, Japan, in a tectonic setting similar to that of the Palu–Koro fault system, it may be possible to anticipate the locations of surface ruptures that may appear in the near future. Future studies of pull-apart basins based on the developmental model of the pull-apart basin and informed by this case study of the 2018 Palu earthquake may yield new and significant results wherever high-precision topographic data are available.
Supplementary Materials
Data S1 (zip files). Stereopaired MPI-RRIMs corresponding to Figure 5 in the text. To perform stereoscopic observations using MPI-RRIMs, the free software StereoPhoto Maker (http://stereo.jpn.org/eng/stphmkr/index.html, last accessed 8 March 2021) and the Pocket 3Dvu stereoscope (http://www.berezin.com/3d/pocket_3dvu.htm, last accessed 8 March 2021) are required. For more details on stereopaired MPI-RRIMs and their use, see ref. [64]. Data S2 (pdf). (a) ArcGIS model builder flow for creating vector fields. The ellipse represents the input data, the blue ellipse represents the input parameter (“P” means parameter), and the rectangle represents the tool to be executed, respectively. (b) N–S displacement and (c) E–W displacement maps from SPOT-6 images used to create the vector field. Data S3 (kmz file). Active fault traces identified in this study.
Author Contributions
Conceptualization, K.K.; methodology, K.K. and J.S.; visualization, K.K.; writing—original draft, K.K.; writing—review and editing, K.K. and J.S. All authors have read and agreed to the published version of the manuscript.
Funding
This work was financially supported in part by the Central Research Institute of Electric Power Industry (CRIEPI) under its “Fault survey for recent earthquakes” program.
Institutional Review Board Statement
Not applicable.
Informed Consent Statement
Not applicable.
Data Availability Statement
Not applicable.
Acknowledgments
We thank Keiichi Ueta and Yasuhira Aoyagi (CRIEPI) for useful discussions about the analog model of the pull-apart basin and vector field. We are also grateful to academic editor Franz Livio. The constructive comments provided by the Giovanni Luca Cardello and an anonymous reviewer greatly improved the manuscript. The DEM data used in this study were provided by the Geospatial Information Agency (BIG) of Indonesia (http://tides.big.go.id/DEMNAS/index.html, accessed on 8 June 2021) and the Geospatial Information Authority of Japan. The MPI-RRIM image was produced by the DEM visualization method of Asia Air Survey Co., Ltd. (protected by Japanese Patents No. 3670274 and 4272146 but open to academic use).
Conflicts of Interest
The authors declare no conflict of interest.
References
- Burchfiel, B.C.; Stewart, J.H. “pull-apart” origin of the central segment of Death Valley, California. Bull. Geol. Soc. Am. 1966, 77, 439–442. [Google Scholar] [CrossRef]
- Crowell, J.C. Sedimentation along the San Andreas Fault, California. In Modern and Ancient Geosynclinal Sedimentation; Society for Sedimentary Geology: Tulsa, OK, USA, 1974; pp. 292–303. [Google Scholar]
- Garfunkel, Z. Internal structure of the Dead Sea leaky transform (rift) in relation to plate kinematics. Tectonophysics 1981, 80, 81–108. [Google Scholar] [CrossRef]
- Aydin, A.; Nur, A. Evolution of pull-apart basins and their scale independence. Tectonics 1982, 1, 91–105. [Google Scholar] [CrossRef]
- Mann, P.; Hempton, M.R.; Bradley, D.C.; Burke, K. Development of pull-apart basins. J. Geol. 1983, 91, 529–554. [Google Scholar] [CrossRef]
- Zhang, P.; Burchfiel, B.C.; Chen, S.; Deng, Q. Extinction of pull-apart basins. Geology 1989, 17, 814–817. [Google Scholar] [CrossRef]
- McClay, K.; Dooley, T. Analogue models of pull-apart basins. Geology 1995, 23, 711–714. [Google Scholar] [CrossRef]
- Wu, J.E.; McClay, K.; Whitehouse, P.; Dooley, T. 4D analogue modelling of transtensional pull-apart basins. Mar. Pet. Geol. 2009, 26, 1608–1623. [Google Scholar] [CrossRef]
- Dooley, T.; McClay, K. Analog modeling of pull-apart Basins. Am. Assoc. Pet. Geol. Bull. 1997, 81, 1804–1826. [Google Scholar] [CrossRef]
- Rahe, B.; Ferrill, D.A.; Morris, A.P. Physical analog modeling of pull-apart basin evolution. Tectonophysics 1998, 285, 21–40. [Google Scholar] [CrossRef]
- Sims, D.; Ferrill, D.A.; Stamatakos, J.A. Role of a ductile decollement in the development of pull-apart basins: Experimental results and natural examples. J. Struct. Geol. 1999, 21, 533–554. [Google Scholar] [CrossRef]
- Dooley, T.P.; Schreurs, G. Analogue modelling of intraplate strike-slip tectonics: A review and new experimental results. Tectonophysics 2012, 574–575, 1–71. [Google Scholar] [CrossRef]
- Sugan, M.; Wu, J.E.L.; McClay, K. 3D analogue modelling of transtensional pull-apart basins: Comparison with the Cinarcik basin, Sea of Marmara, Turkey. Boll. Geofis. Teor. Appl. 2014, 55, 699–716. [Google Scholar] [CrossRef]
- Corti, G.; Nencini, R.; Skyttä, P. Modelling the influence of pre-existing brittle fabrics on the development and architecture pull-apart basins. J. Struct. Geol. 2020, 131. [Google Scholar] [CrossRef]
- Rodgers, D.A. Analysis of Pull-Apart Basin Development Produced by En Echelon Strike-Slip Faults. In Sedimentation in Oblique-Slip Mobile Zones; Wiley: Hoboken, NJ, USA, 2009; pp. 27–41. ISBN 9781444303735. [Google Scholar]
- Katzman, R.; Ten Brink, U.S.; Lin, J. Three-dimensional modeling of pull-apart basins: Implications for the tectonics of the Dead Sea Basin. J. Geophys. Res. 1995, 100, 6295–6312. [Google Scholar] [CrossRef] [Green Version]
- Kusumoto, S.; Fukuda, Y.; Takemura, K.; Takemoto, S. Forming Mechanism of the Sedimentary Basin at the Termination of the Right-lateral Left-stepping Faults and Tectonics around Osaka Bay. J. Geogr. Chigaku Zasshi 2001, 110, 32–43. [Google Scholar] [CrossRef]
- Van Wijk, J.; Axen, G.; Abera, R. Initiation, evolution and extinction of pull-apart basins: Implications for opening of the Gulf of California. Tectonophysics 2017, 719–720, 37–50. [Google Scholar] [CrossRef]
- Liu, Y.; Konietzky, H. Particle-Based Modeling of Pull-Apart Basin Development. Tectonics 2018, 37, 343–358. [Google Scholar] [CrossRef]
- Schattner, U.; Weinberger, R. A mid-Pleistocene deformation transition in the Hula basin, northern Israel: Implications for the tectonic evolution of the Dead Sea Fault. Geochem. Geophys. Geosystems 2008, 9. [Google Scholar] [CrossRef]
- Quennell, A.M. The structural and geomorphic evolution of the dead sea rift. Q. J. Geol. Soc. Lond. 1958, 114, 1–24. [Google Scholar] [CrossRef]
- Freund, R.; Garfunkel, Z.; Zak, I.; Goldberg, M.; Weissbrod, T.; Derin, B.; Bender, F.; Wellings, F.E.; Girdler, R.W. The Shear along the Dead Sea Rift [and Discussion]. Philos. Trans. R. Soc. Lond. A Math. Phys. Eng. Sci. 1970, 267, 107–130. [Google Scholar]
- Aragón-Arreola, M.; Morandi, M.; Martín-Barajas, A.; Delgado-Argote, L.; González-Fernández, A. Structure of the rift basins in the central Gulf of California: Kinematic implications for oblique rifting. Tectonophysics 2005, 409, 19–38. [Google Scholar] [CrossRef]
- Aragón-Arreola, M.; Martin-Barajas, A. Westward migration of extension in the northern Gulf of California, Mexico. Geology 2007, 35, 571–574. [Google Scholar] [CrossRef]
- Seiler, C.; Fletcher, J.M.; Quigley, M.C.; Gleadow, A.J.W.; Kohn, B.P. Neogene structural evolution of the Sierra San Felipe, Baja California: Evidence for proto-gulf transtension in the Gulf Extensional Province? Tectonophysics 2010, 488, 87–109. [Google Scholar] [CrossRef]
- Armijo, R.; Pondard, N.; Meyer, B.; Ucarkus, G.; De Lépinay, B.M.; Malavieille, J.; Dominguez, S.; Gustcher, M.A.; Schmidt, S.; Beck, C.; et al. Submarine fault scarps in the Sea of Marmara pull-apart (North Anatolian Fault): Implications for seismic hazard in Istanbul. Geochem. Geophys. Geosyst. 2005, 6, 6009. [Google Scholar] [CrossRef] [Green Version]
- Pondard, N.; Armijo, R.; King, G.C.P.; Meyer, B.; Flerit, F. Fault interactions in the Sea of Marmara pull-apart (North Anatolian Fault): Earthquake clustering and propagating earthquake sequences. Geophys. J. Int. 2007, 171, 1185–1197. [Google Scholar] [CrossRef] [Green Version]
- Kuşçu, I. Cross-basin faulting and extinction of pull-apart basins in the sea of Marmara, NW Turkey. Turkish J. Earth Sci. 2009, 18, 331–349. [Google Scholar] [CrossRef]
- Ribot, M.; Klinger, Y.; Jónsson, S.; Avsar, U.; Pons-Branchu, E.; Matrau, R.; Mallon, F.L. Active Faults’ Geometry in the Gulf of Aqaba, Southern Dead Sea Fault, Illuminated by Multibeam Bathymetric Data. Tectonics 2021, 40, e2020TC006443. [Google Scholar] [CrossRef]
- Bradley, K.; Mallick, R.; Andikagumi, H.; Hubbard, J.; Meilianda, E.; Switzer, A.; Du, N.; Brocard, G.; Alfian, D.; Benazir, B.; et al. Earthquake-triggered 2018 Palu Valley landslides enabled by wet rice cultivation. Nat. Geosci. 2019, 12, 935–939. [Google Scholar] [CrossRef]
- Watkinson, I.M.; Hall, R. Impact of communal irrigation on the 2018 Palu earthquake-triggered landslides. Nat. Geosci. 2019, 12, 940–945. [Google Scholar] [CrossRef]
- Mason, H.B.; Montgomery, J.; Gallant, A.P.; Hutabarat, D.; Reed, A.N.; Wartman, J.; Irsyam, M.; Simatupang, P.T.; Alatas, I.M.; Prakoso, W.A.; et al. East Palu Valley flowslides induced by the 2018 MW 7.5 Palu-Donggala earthquake. Geomorphology 2021, 373. [Google Scholar] [CrossRef]
- Jaya, A.; Nishikawa, O.; Jumadil, S. Distribution and morphology of the surface ruptures of the 2018 Donggala–Palu earthquake, Central Sulawesi, Indonesia. Earth Planets Sp. 2019, 71. [Google Scholar] [CrossRef] [Green Version]
- Patria, A.; Putra, P.S. Development of the Palu–Koro Fault in NW Palu Valley, Indonesia. Geosci. Lett. 2020, 7. [Google Scholar] [CrossRef]
- Wu, D.; Ren, Z.; Liu, J.; Chen, J.; Guo, P.; Yin, G.; Ran, H.; Li, C.; Yang, X. Coseismic Surface Rupture During the 2018 Mw 7.5 Palu Earthquake, Sulawesi Island, Indonesia. Bull. Geol. Soc. Am. 2021, 133, 1157–1166. [Google Scholar] [CrossRef]
- Natawidjaja, D.H.; Daryono, M.R.; Prasetya, G.; Udrekh; Liu, P.L.F.; Hananto, N.D.; Kongko, W.; Triyoso, W.; Puji, A.R.; Meilano, I.; et al. The 2018 Mw7.5 Palu “supershear” earthquake ruptures geological fault’s multisegment separated by large bends: Results from integrating field measurements, LiDAR, swath bathymetry and seismic-reflection data. Geophys. J. Int. 2020, 224, 985–1002. [Google Scholar] [CrossRef]
- Bao, H.; Ampuero, J.P.; Meng, L.; Fielding, E.J.; Liang, C.; Milliner, C.W.D.; Feng, T.; Huang, H. Early and persistent supershear rupture of the 2018 magnitude 7.5 Palu earthquake. Nat. Geosci. 2019, 12, 200–205. [Google Scholar] [CrossRef]
- Socquet, A.; Hollingsworth, J.; Pathier, E.; Bouchon, M. Evidence of supershear during the 2018 magnitude 7.5 Palu earthquake from space geodesy. Nat. Geosci. 2019, 12, 192–199. [Google Scholar] [CrossRef]
- Fang, J.; Xu, C.; Wen, Y.; Wang, S.; Xu, G.; Zhao, Y.; Yi, L. The 2018 Mw 7.5 Palu earthquake: A supershear rupture event constrained by InSAR and broadband regional seismograms. Remote Sens. 2019, 11, 1330. [Google Scholar] [CrossRef] [Green Version]
- Song, X.; Zhang, Y.; Shan, X.; Liu, Y.; Gong, W.; Qu, C. Geodetic Observations of the 2018 Mw 7.5 Sulawesi Earthquake and Its Implications for the Kinematics of the Palu Fault. Geophys. Res. Lett. 2019, 46, 4212–4220. [Google Scholar] [CrossRef]
- He, L.; Feng, G.; Li, Z.; Feng, Z.; Gao, H.; Wu, X. Source parameters and slip distribution of the 2018 Mw 7.5 Palu, Indonesia earthquake estimated from space-based geodesy. Tectonophysics 2019, 772. [Google Scholar] [CrossRef]
- Wang, Y.; Feng, W.; Chen, K.; Samsonov, S. Source characteristics of the 28 September 2018 Mw 7.4 Palu, Indonesia, earthquake derived from the advanced land observation satellite 2 data. Remote Sens. 2019, 11, 1999. [Google Scholar] [CrossRef] [Green Version]
- Bacques, G.; de Michele, M.; Foumelis, M.; Raucoules, D.; Lemoine, A.; Briole, P. Sentinel optical and SAR data highlights multi-segment faulting during the 2018 Palu-Sulawesi earthquake (Mw 7.5). Sci. Rep. 2020, 10. [Google Scholar] [CrossRef]
- Li, C.; Zhang, G.; Shan, X.; Zhao, D.; Song, X. Geometric variation in the surface rupture of the 2018 mw7.5 palu earthquake from subpixel optical image correlation. Remote Sens. 2020, 12, 3436. [Google Scholar] [CrossRef]
- Okuwaki, R.; Hirano, S.; Yagi, Y.; Shimizu, K. Inchworm-like source evolution through a geometrically complex fault fueled persistent supershear rupture during the 2018 Palu Indonesia earthquake. Earth Planet. Sci. Lett. 2020, 547. [Google Scholar] [CrossRef]
- Bellier, O.; Sébrier, M.; Seward, D.; Beaudouin, T.; Villeneuve, M.; Putranto, E. Fission track and fault kinematics analyses for new insight into the Late Cenozoic tectonic regime changes in West-Central Sulawesi (Indonesia). Tectonophysics 2006, 413, 201–220. [Google Scholar] [CrossRef]
- Socquet, A.; Simons, W.; Vigny, C.; McCaffrey, R.; Subarya, C.; Sarsito, D.; Ambrosius, B.; Spakman, W. Microblock rotations and fault coupling in the SE Asia triple junction (Sulawesi, Indonesia) from GPS and earthquake slip vector data. J. Geophys. Res. Solid Earth 2006, 111, 8409. [Google Scholar] [CrossRef] [Green Version]
- Hall, R. The Eurasian SE Asian margin as a modern example of an accretionary orogen. Geol. Soc. Spec. Publ. 2009, 318, 351–372. [Google Scholar] [CrossRef] [Green Version]
- Hall, R. Australia-SE Asia collision: Plate tectonics and crustal flow. Geol. Soc. Spec. Publ. 2011, 355, 75–109. [Google Scholar] [CrossRef] [Green Version]
- Hall, R. Late Jurassic-Cenozoic reconstructions of the Indonesian region and the Indian Ocean. Tectonophysics 2012, 570–571, 1–41. [Google Scholar] [CrossRef] [Green Version]
- Hall, R.; Sevastjanova, I. Australian crust in Indonesia. Aust. J. Earth Sci. 2012, 59, 827–844. [Google Scholar] [CrossRef]
- Advokaat, E.L.; Hall, R.; White, L.T.; Watkinson, I.M.; Rudyawan, A.; BouDagher-Fadel, M.K. Miocene to recent extension in NW Sulawesi, Indonesia. J. Asian Earth Sci. 2017, 147, 378–401. [Google Scholar] [CrossRef] [Green Version]
- Hall, R.; Wilson, M.E.J. Neogene sutures in eastern Indonesia. J. Asian Earth Sci. 2000, 18, 781–808. [Google Scholar] [CrossRef]
- Kadarusman, A.; Miyashita, S.; Maruyama, S.; Parkinson, C.D.; Ishikawa, A. Petrology, geochemistry and paleogeographic reconstruction of the East Sulawesi Ophiolite, Indonesia. Tectonophysics 2004, 392, 55–83. [Google Scholar] [CrossRef]
- White, L.T.; Hall, R.; Armstrong, R.A.; Barber, A.J.; BouDagher Fadel, M.; Baxter, A.; Wakita, K.; Manning, C.; Soesilo, J. The geological history of the Latimojong region of western Sulawesi, Indonesia. J. Asian Earth Sci. 2017, 138, 72–91. [Google Scholar] [CrossRef]
- Watkinson, I.M.; Hall, R. Fault systems of the eastern Indonesian triple junction: Evaluation of Quaternary activity and implications for seismic hazards. Geol. Soc. Spec. Publ. 2017, 441, 71–120. [Google Scholar] [CrossRef]
- Bellier, O.; Beaudouin, T.; Sebrier, M.; Villeneuve, M.; Bahar, I.; Putranto, E.; Pratomo, I.; Massault, M.; Seward, D. Active Faulting in Central Sulawesi (Eastern Indonesia). In The Geodynamics of S and SE Asia (GEODYSSEA) Project Final Report; Wilson, P., Michel, G.M., Eds.; GFZ Public: Postdam, Germany, 1998. [Google Scholar]
- Bellier, O.; Bourles, D.L.; Beaudouin, T.; Braucher, R. Cosmic Ray Exposure (CRE) dating in a wet tropical domain: Late Quaternary fan emplacements in central Sulawesi (Indonesia). Terra Nov. 1999, 11, 174–180. [Google Scholar] [CrossRef]
- Bellier, O.; Siame, L.; Beaudouin, T.; Villeneuve, M.; Braucher, R. High slip rate for a low seismicity along the Palu-Koro active fault in Central Sulawesi. Terra Nov. 2001, 13, 463–470. [Google Scholar] [CrossRef]
- Walpersdorf, A.; Vigny, C.; Subarya, C.; Manurung, P. Monitoring of the Palu-Koro Fault (Sulawesi) by GPS. Geophys. Res. Lett. 1998, 25, 2313–2316. [Google Scholar] [CrossRef] [Green Version]
- Stevens, C.; McCaffrey, R.; Bock, Y.; Genrich, J.; Endang; Subarya, C.; Puntodewo, S.S.O.; Fauzi; Vigny, C. Rapid rotations about a vertical axis in a collisional setting revealed by the Palu fault, Sulawesi, Indonesia. Geophys. Res. Lett. 1999, 26, 2677–2680. [Google Scholar] [CrossRef]
- Vigny, C.; Perfettini, H.; Walpersdorf, A.; Lemoine, A.; Simons, W.; van Loon, D.; Ambrosius, B.; Stevens, C.; McCaffrey, R.; Morgan, P.; et al. Migration of seismicity and earthquake interactions monitored by GPS in SE Asia triple junction: Sulawesi, Indonesia. J. Geophys. Res. Solid Earth 2002, 107, ETG 7-1–ETG 7-11. [Google Scholar] [CrossRef]
- Daryono, M.R.; Natawidjaja, D.H. Surface Rupture of the 1909 Event (M7) on Palukoro Fault in Tropical Forest of Central Sulawesi, Indonesia. In Proceedings of the Joint Convention Yogyakarta 2019, Yogyakarta, Indonesia, 25–29 November 2019. JCY_0087. [Google Scholar]
- Kaneda, H.; Chiba, T. Stereopaired morphometric protection index red relief image maps (Stereo MPI-RRIMs): Effective visualization of high-resolution digital elevation models for interpreting and mapping small tectonic geomorphic features. Bull. Seismol. Soc. Am. 2019, 109, 99–109. [Google Scholar] [CrossRef]
- Leprince, S.; Barbot, S.; Ayoub, F.; Avouac, J.P. Automatic and precise orthorectification, coregistration, and subpixel correlation of satellite images, application to ground deformation measurements. IEEE Trans. Geosci. Remote Sens. 2007, 45, 1529–1558. [Google Scholar] [CrossRef] [Green Version]
- Ayoub, F.; Leprince, S.; Avouac, J.P. Co-registration and correlation of aerial photographs for ground deformation measurements. ISPRS J. Photogramm. Remote Sens. 2009, 64, 551–560. [Google Scholar] [CrossRef]
- Avouac, J.P.; Ayoub, F.; Leprince, S.; Konca, O.; Helmberger, D.V. The 2005, Mw 7.6 Kashmir earthquake: Sub-pixel correlation of ASTER images and seismic waveforms analysis. Earth Planet. Sci. Lett. 2006, 249, 514–528. [Google Scholar] [CrossRef] [Green Version]
- Leprince, S.; Musé, P.; Avouac, J.P. In-flight CCD distortion calibration for pushbroom satellites based on subpixel correlation. IEEE Trans. Geosci. Remote Sens. 2008, 46, 2675–2683. [Google Scholar] [CrossRef]
- Bridges, N.T.; Ayoub, F.; Avouac, J.P.; Leprince, S.; Lucas, A.; Mattson, S. Earth-like sand fluxes on Mars. Nature 2012, 485, 339–342. [Google Scholar] [CrossRef] [PubMed] [Green Version]
- Hollingsworth, J.; Leprince, S.; Ayoub, F.; Avouac, J.P. Deformation during the 1975-1984 Krafla rifting crisis, NE Iceland, measured from historical optical imagery. J. Geophys. Res. B Solid Earth 2012, 117. [Google Scholar] [CrossRef] [Green Version]
- Milliner, C.W.D.; Dolan, J.F.; Hollingsworth, J.; Leprince, S.; Ayoub, F.; Sammis, C.G. Quantifying near-field and off-fault deformation patterns of the 1992 Mw 7.3 Landers earthquake. Geochem. Geophys. Geosyst. 2015, 16, 1577–1598. [Google Scholar] [CrossRef] [Green Version]
- Turner, D.; Lucieer, A.; de Jong, S.M. Time series analysis of landslide dynamics using an Unmanned Aerial Vehicle (UAV). Remote Sens. 2015, 7, 1736–1757. [Google Scholar] [CrossRef] [Green Version]
- Ayoub, F.; Leprince, S.; Keene, L. User’s Guide to COSI-CORR Co-registration of Optically Sensed Images and Correlation. Calif. Inst. Technol. 2009, 1–38. [Google Scholar]
- Meygret, A.; Baillarin, S.; Gascon, F.; Hillairet, E.; Dechoz, C.; Lacherade, S.; Martimort, P.; Spoto, F.; Henry, P.; Duca, R. SENTINEL-2 image quality and level 1 processing. In Proceedings of the Earth Observing Systems XIV, San Diego, CA, USA, 21 August 2009; Volume 7452, p. 74520D. [Google Scholar]
- Chen, W.S.; Yang, C.Y.; Chen, S.T.; Huang, Y.C. New insights into Holocene marine terrace development caused by seismic and aseismic faulting in the Coastal Range, eastern Taiwan. Quat. Sci. Rev. 2020, 240. [Google Scholar] [CrossRef]
- Broecker, W.S.; Andree, M.; Wolfli, W.; Oeschger, H.; Bonani, G.; Kennett, J.; Peteet, D. The chronology of the last Deglaciation: Implications to the cause of the Younger Dryas Event. Paleoceanography 1988, 3, 1–19. [Google Scholar] [CrossRef]
- Philip, H.; Rogozhin, E.; Cisternas, A.; Bousquet, J.C.; Borisov, B.; Karakhanian, A. The Armenian earthquake of 1988 December 7: Faulting and folding, neotectonics and palaeoseismicity. Geophys. J. Int. 1992, 110, 141–158. [Google Scholar] [CrossRef] [Green Version]
- Yeats, R.S.; Sieh, K.; Allen, C.R. The Geology of Earthquakes; Oxford University Press: New York, NY, USA, 1997; p. 568. ISBN 9780195078275. [Google Scholar]
- Price, E.J.; Sandwell, D.T. Small-scale deformations associated with the 1992 Landers, California, earthquake mapped by synthetic aperture radar interferometry phase gradients. J. Geophys. Res. Solid Earth 1998, 103, 27001–27016. [Google Scholar] [CrossRef]
- Fialko, Y.; Sandwell, D.; Agnew, D.; Simons, M.; Shearer, P.; Minster, B. Deformation on nearby faults induced by the 1999 Hector Mine earthquake. Science 2002, 297, 1858–1862. [Google Scholar] [CrossRef] [Green Version]
- Fujiwara, S.; Yarai, H.; Kobayashi, T.; Morishita, Y.; Nakano, T.; Miyahara, B.; Nakai, H.; Miura, Y.; Ueshiba, H.; Kakiage, Y.; et al. Small-displacement linear surface ruptures of the 2016 Kumamoto earthquake sequence detected by ALOS-2 SAR interferometry. Earth Planets Space 2016, 68, 160. [Google Scholar] [CrossRef] [Green Version]
- Fujiwara, S.; Nakano, T.; Morishita, Y. Detection of triggered shallow slips caused by large earthquakes using L-band SAR interferometry. Earth Planets Space 2020, 72, 1–23. [Google Scholar] [CrossRef]
- Tsuji, T.; Ishibashi, J.; Ishitsuka, K.; Kamata, R. Horizontal sliding of kilometre-scale hot spring area during the 2016 Kumamoto earthquake. Sci. Rep. 2017, 7. [Google Scholar] [CrossRef] [PubMed] [Green Version]
- Fujiwara, S.; Morishita, Y.; Nakano, T.; Kobayashi, T.; Yarai, H. Non-tectonic liquefaction-induced large surface displacements in the Aso Valley, Japan, caused by the 2016 Kumamoto earthquake, revealed by ALOS-2 SAR. Earth Planet. Sci. Lett. 2017, 474, 457–465. [Google Scholar] [CrossRef]
- Lin, A.; Chen, P.; Sado, K. Recurrent large earthquakes related with an active fault-volcano system, southwest Japan. Sci. Rep. 2018, 8. [Google Scholar] [CrossRef]
- Supendi, P.; Nugraha, A.D.; Widiyantoro, S.; Pesicek, J.D.; Thurber, C.H.; Abdullah, C.I.; Daryono, D.; Wiyono, S.H.; Shiddiqi, H.A.; Rosalia, S. Relocated aftershocks and background seismicity in eastern Indonesia shed light on the 2018 Lombok and Palu earthquake sequences. Geophys. J. Int. 2020, 221, 1845–1855. [Google Scholar] [CrossRef]
- Ben-Avraham, Z.; Almagor, G.; Garfunkel, Z. Sediments and structure of the Gulf of Elat (Aqaba)-Northern Red Sea. Sediment. Geol. 1979, 23, 239–267. [Google Scholar] [CrossRef]
- Ben-Avraham, Z. Structural framework of the Gulf of Elat (Aqaba), northern Red Sea. J. Geophys. Res. 1985, 90, 703–726. [Google Scholar] [CrossRef]
- Garfunkel, Z.; Ben-Avraham, Z. The structure of the Dead Sea basin. Tectonophysics 1996, 266, 155–176. [Google Scholar] [CrossRef]
- Ehrhardt, A.; Hübscher, C.; Ben-Avraham, Z.; Gajewski, D. Seismic study of pull-apart-induced sedimentation and deformation in the Northern Gulf of Aqaba (Elat). Tectonophysics 2005, 396, 59–79. [Google Scholar] [CrossRef]
- Earthquake Research Committee, Headquarters for Earthquake Research Promotion. In Long-Term Evaluation of Seismic Risk in the Itoigawa-Shizuoka Tectonic Line Fault Zone, 2nd ed. Available online: https://www.jishin.go.jp/main/chousa/katsudansou_pdf/41_42_44_itoigawa-shizuoka_2.pdf (accessed on 8 July 2021). (In Japanese)
- Fujimori, T. Active faults in the Suwa Basin, and its evolution as a pull-apart basin on the Itoigawa-Shizuoka Tectonic Line, central Japan. Geogr. Rev. Jpn. Ser. A 1991, 64, 665–696, (In Japanese with English abstract). [Google Scholar] [CrossRef] [Green Version]
- Fujimori, T.; Ota, Y. Strip map of active faults on the Suwa Basin, Central Japan. Act. Fault Res. 1992, 27–39, (In Japanese with English abstract). [Google Scholar] [CrossRef]
- Imaizumi, T.; Togo, M.; Sawa, H.; Ikeda, Y.; Matsuta, N. 1:25,000 Active Fault Map, Itoigawa-Shizuoka Tectonic Line and Its Vicinity “Suwa”; D1-No.368; Geospatial Information Authority of Japan: Tsukuba, Japan, 1998; Volume 56. (In Japanese) [Google Scholar]
- Sawa, H.; Togo, M.; Imaizumi, T.; Ikeda, Y. 1:25,000 Active Fault Map, Itoigawa-Shizuoka Tectonic Line and Its Vicinity “Chino”; D1-No.355; Geospatial Information Authority of Japan: Tsukuba, Japan, 1997; Volume 46. (In Japanese) [Google Scholar]
- Sugito, N.; Sawa, H.; Taniguchi, K.; Sato, Y.; Watanabe, M.; Suzuki, Y. Evolution of Riedel-shear pop-up structures during cumulative strike-slip faulting: A case study in the Misayama-Godo area, Fujimi Town, central Japan. Geomorphology 2019, 327, 446–455. [Google Scholar] [CrossRef]
- Miyakoshi, K.; Ueta, K.; Hataya, R.; Abe, S.; Miura, D.; Hamada, Y.; Aoyagi, Y.; Inoue, D. A proposal of surveying and evaluating system of active faults for earthquake assessment. Denryoku Chuo Kenkyusho Hokoku 2004, U46, 1–8. Available online: https://inis.iaea.org/search/search.aspx?orig_q=RN:36014835 (accessed on 8 July 2021).
Figure 1.
Schematic diagram showing development of a transtensional pull-apart basin, based on sandbox experiments; modified from Wu et al. [8]. (a) Early development of en-echelon faults. (b) Formation of the pull-apart basins and initiation of shortcut faults. (c) Deepening and expansion of the basin and emergence of relay ramps. (d) Mature pull-apart basin.

Figure 2.
Location map showing the topography of Sulawesi Island. Major tectonic faults are based on Bellier et al. [46]. Circles are epicenters of earthquakes larger than Mw 6.0 between 1900 and 2020 based on the USGS catalog (https://earthquake.usgs.gov/earthquakes/search/) (accessed on 8 July 2021). Gray arrows indicate horizontal plate displacements based on GPS data [47]. Black lines indicate major transcurrent and thrust faults (teeth on upthrown side).

Figure 3.
Topographic map of the epicentral region of the 2018 earthquake. The background elevation map is from the ALOS-3D 30-m DEM. (a–e) correspond to the range of each figure in Figure 5.
Figure 3.
Topographic map of the epicentral region of the 2018 earthquake. The background elevation map is from the ALOS-3D 30-m DEM. (a–e) correspond to the range of each figure in Figure 5.

Figure 4.
Stereopair of MPI-RRIMs used in this study. See Figure 3 for the location.
Figure 4.
Stereopair of MPI-RRIMs used in this study. See Figure 3 for the location.

Figure 5.
(a–e) Geomorphic maps along the Palu–Koro fault based on MPI-RRIM stereopairs. See Figure 3 for locations. Base map and contours (10-m interval) were created from DEMNAS.
Figure 5.
(a–e) Geomorphic maps along the Palu–Koro fault based on MPI-RRIM stereopairs. See Figure 3 for locations. Base map and contours (10-m interval) were created from DEMNAS.


Figure 6.
Schematic cross-section across fluvial terraces and alluvial fans along the Palu–Koro fault. The specific heights above the modern riverbed vary from place to place. Sediment thicknesses are not drawn to scale. Also shown are 10Be exposure ages of surface gravels on the west flank of Palu basin (Figure 5c) [58]. Correlations with paleoclimatic events are also shown: MIS, marine isotopic stage; YD, Younger Dryas.

Figure 7.
(a) Distribution of horizontal displacement in the N–S direction by optical correlation of Sentinel-2 images (Table 1). The area is the same as in Figure 3. (b) Horizontal displacement distribution in the E–W direction. Profiles A–A′ to F–F′ are shown in Figure 8. (c) Vector field based on the optical correlation result of SPOT-6 images (Table 2). The grid size of the vectors is 1 km. The original optical correlation results used in the field are shown in Data S2 in the Supplementary Materials. The 2018 surface ruptures and tension cracks based on the field surveys [35,36] are also shown.

Figure 8.
Profiles of horizontal displacement in the N–S direction (A–A′ to E–E′) and the E–W direction (F–F′). Profile lines are shown in Figure 7a,b. Red arrows denote identified surface ruptures.
Figure 8.
Profiles of horizontal displacement in the N–S direction (A–A′ to E–E′) and the E–W direction (F–F′). Profile lines are shown in Figure 7a,b. Red arrows denote identified surface ruptures.

Figure 9.
(a–e) Horizontal displacement in the N–S direction (colors); also shown are active fault traces identified by geomorphic observation (black lines) and the location of 2018 surface ruptures or tension cracks confirmed in field surveys [33,35,36] (symbols). Panel locations are shown in Figure 7a.

Figure 10.
(a) Horizontal displacement in the E–W direction around the southern Palu basin (location in Figure 7b). (b) Vector field of the same area. The grid size of the vectors is 500 m. Base results of the optical correlation of SPOT-6 images are shown in Data S2 in Supplementary Materials. Aftershock distribution for 28 September 2018–22 November 2018 [86] is also shown.

Figure 11.
Superimposes geomorphic information and topographic contours (from Figure 5d) on an enlarged portion of the Figure 10a.

Figure 12.
(a) MPI-RRIM of the area around Lake Suwa along the Itoigawa–Shizuoka Tectonic Line, central Japan, based on the 5-m-grid DEM of the Geospatial Information Authority of Japan. (b) Geomorphic map and distribution of active faults [92,93,94,95,96] in the same area.

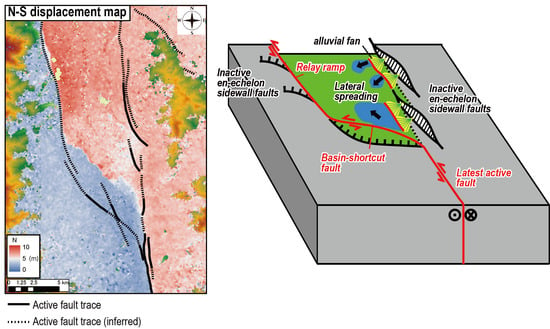
Figure 13.
Schematic illustration of a pull-apart basin showing active features including basin-shortcut faults, relay ramps, and lateral spreading.
Figure 13.
Schematic illustration of a pull-apart basin showing active features including basin-shortcut faults, relay ramps, and lateral spreading.


Table 1.
Sentinel-2 images used in the optical correlation analysis.
| Pair No. | Timing | Date | Pass Direction | Resolution | Filename |
|---|---|---|---|---|---|
| 1 | Pre-earthquake | 27 September 2018 | Descending | 10 m | S2B_MSIL1C_20180927T022319_N0206_R103_T50MRD_20180927T055542 |
| Post-earthquake | 2 October 2018 | Descending | 10 m | S2A_MSIL1C_20181002T022321_N0206_R103_T50MRD_20181002T054141 | |
| 2 | Pre-earthquake | 27 September 2018 | Descending | 10 m | S2B_MSIL1C_20180927T022319_N0206_R103_T50MRE_20180927T055542 |
| Post-earthquake | 2 October 2018 | Descending | 10 m | S2A_MSIL1C_20181002T022321_N0206_R103_T50MRE_20181002T054141 | |
| 3 | Pre-earthquake | 17 September 2018 | Descending | 10 m | S2B_MSIL1C_20180917T022319_N0206_R103_T50MRE_20180917T054239 |
| Post-earthquake | 22 October 2018 | Descending | 10 m | S2A_MSIL1C_20181022T022321_N0206_R103_T50MRE_20181022T063218 |
Table 2.
SPOT-6 images used in the optical correlation analysis.
| Pair No. | Timing | Date | Resolution | Filename |
|---|---|---|---|---|
| 4 | Pre-earthquake | 16 May 2017 | 1.5 m | DS_SPOT6_201705160155554_FR1_FR_1_SV1_E120S01_06499 |
| Post-earthquake | 18 October 2018 | 1.5 m | DS_SPOT6_201810180156380_JS3_JS3_JS2_JS2_E120S01_02845 |
Publisher’s Note: MDPI stays neutral with regard to jurisdictional claims in published maps and institutional affiliations. |
© 2021 by the authors. Licensee MDPI, Basel, Switzerland. This article is an open access article distributed under the terms and conditions of the Creative Commons Attribution (CC BY) license (https://creativecommons.org/licenses/by/4.0/).
Share and Cite
MDPI and ACS Style
Komura, K.; Sugimoto, J. Shortcut Faults and Lateral Spreading Activated in a Pull-Apart Basin by the 2018 Palu Earthquake, Central Sulawesi, Indonesia. Remote Sens. 2021, 13, 2939. https://doi.org/10.3390/rs13152939
AMA Style
Komura K, Sugimoto J. Shortcut Faults and Lateral Spreading Activated in a Pull-Apart Basin by the 2018 Palu Earthquake, Central Sulawesi, Indonesia. Remote Sensing. 2021; 13(15):2939. https://doi.org/10.3390/rs13152939
Chicago/Turabian StyleKomura, Keitaro, and Jun Sugimoto. 2021. "Shortcut Faults and Lateral Spreading Activated in a Pull-Apart Basin by the 2018 Palu Earthquake, Central Sulawesi, Indonesia" Remote Sensing 13, no. 15: 2939. https://doi.org/10.3390/rs13152939
Note that from the first issue of 2016, this journal uses article numbers instead of page numbers. See further details here.