
Ten Years of SNPP VIIRS Reflective Solar Bands On-Orbit Calibration and Performance


1
Science Systems and Applications, Inc., 10210 Greenbelt Road, Lanham, MD 20706, USA
2
Sciences and Exploration Directorate, NASA/GSFC, Greenbelt, MD 20771, USA
*
Author to whom correspondence should be addressed.
Remote Sens. 2021, 13(15), 2944; https://doi.org/10.3390/rs13152944
Submission received: 21 June 2021
/
Revised: 23 July 2021
/
Accepted: 26 July 2021
/
Published: 27 July 2021
(This article belongs to the Special Issue Frontiers in Remote Sensing Techniques and Applications Using Visible Infrared Imaging Radiometer Suites)
Abstract
:The Visible Infrared Imaging Radiometer Suite (VIIRS) onboard the Suomi National Polar-orbiting Partnership (SNPP) has successfully operated on-orbit for nearly ten years since its launch in October 2011, continuously making global observations and improving studies of changes in the Earth’s climate and environment. VIIRS has 22 spectral bands, among which 14 are reflective solar bands (RSBs) covering a spectral range from 0.41 to 2.25 μm. The SNPP VIIRS RSBs are primarily calibrated by the onboard solar diffuser (SD), with its on-orbit degradation tracked by an onboard SD stability monitor (SDSM). The near-monthly scheduled lunar observations, together with the sensor responses over stable ground targets, have contributed to the sensor’s mission-long on-orbit calibration and characterization. Numerous improvements have been made in the RSB calibration methodology since SNPP VIIRS was launched, and the RSB calibration has reached a mature stage after almost ten years of on-orbit operation. SNPP is a joint NASA/NOAA mission and there are two teams, the NASA VIIRS Calibration Support Team (VCST) and the NOAA VIIRS Sensor Data Record Team, which are dedicated to SNPP VIIRS on-orbit calibration. In this paper, we focus on the calibration performed by the NASA VCST. The SNPP VIIRS RSB calibration methodologies used to produce the calibration coefficient look up tables for the latest NASA Level 1B Collection 2 products are reviewed and the calibration improvements incorporated in this collection are described. Recent calibration changes include the removal of image striping caused by non-uniform degradation of the SD, improvements to the method for combining lunar and SD data, mitigation of the effects due a recent anomaly in the SD measurements, estimation of the SD degradation beyond 935 nm, and fitting strategy improvements for look-up table delivery. Overall, the SNPP VIIRS RSBs have performed well since its launch and continue to meet design specifications.
1. Introduction
The Visible Infrared Imaging Radiometer Suite (VIIRS) onboard the Suomi National Polar-orbiting Partnership (SNPP) will be completing ten years of successful on-orbit operations on 28 October 2021 [1,2]. The VIIRS instrument observes the entire surface of the Earth twice each day via 22 spectral channels ranging from 0.41 to 11.45 μm [3,4]. Various Environmental Data Records (EDRs) and high-level science products [5,6] are produced based on the instrument’s observations, which facilitate various applications for the study of the Earth’s systems, and its changes over different temporal scales and geographic regions [7,8,9,10,11,12,13,14]. These studies and applications are strongly affected by the quality and accuracy of the instrument’s sensor data records (SDRs) or Level 1B (L1B) data, which depend on the instrument’s calibration accuracy and stability [15,16,17].
Among the 22 VIIRS channels, 14 are reflective solar bands (RSBs) covering a spectral range from 0.41 to 2.25 μm with three imaging bands (I-bands with resolution of 371 m × 387 m) of higher spatial resolution and 11 moderate resolution bands (M-bands with resolution of 742 m × 776 m) [18,19]. Among the 11 M-bands, 6 are dual-gain bands whereas the remaining M-bands as well as all I-bands are single-gain bands. Each I-band has 32 detectors whereas each M-band has 16 detectors. The center wavelengths of the 14 SNPP VIIRS RSBs and their band gain (dual-gain or single-gain) are listed in Table 1 [18,19]. Primary calibration on-orbit is provided by an on-board solar diffuser (SD) and SD stability monitor (SDSM), with additional inputs provided by scheduled lunar observations acquired via the instrument’s space view (SV) port, which is also used to provide the instrument’s background response [17,20,21,22,23,24,25,26,27,28]. Earth view (EV) data from select stable ground targets are used to monitor the performance of the RSBs as well [2,29,30]. VIIRS RSBs view on-board calibrators (OBC), SV and EV sequentially in each scan via a rotating telescope assembly (RTA) and a half-angle mirror (HAM). A schematic diagram of VIIRS, including the main components and OBCs, is shown in Figure 1.
There are two dedicated teams, the VIIRS Characterization Support Team (VCST) at NASA Goddard Space Flight Center (GSFC) and the NOAA VIIRS SDR team, who provide independent calibration support for the SNPP VIIRS instrument. There are two independent sets of calibrated sensor data, L1B products and sensor data records, by NASA and NOAA, generated using the calibration coefficients look up tables (LUTs) provided by VCST and SDR teams, respectively. Independent calibrations for the RSB are also performed by the NOAA Ocean Color Team [15,16] and the NASA Ocean Biology Processing Group (OBPG) [17]. In this paper, we focus on NASA L1B products and the calibration effort and activities by the VCST. Thus far, SNPP L1B has three data product versions. Numerous calibration improvements have been continuously developed and applied in each version and from one version to the next. The most recent version is collection 2 (C2). The algorithms used for collection 1 (C1) were documented in detail earlier [31,32]. The algorithms used for C2 are similar, but with a few key improvements that have been developed recently. The initial C2 mission-long calibration coefficients were delivered for science testing in the summer of 2020, and their forward updates have been continued as needed since then. The L1B C2 reflects the most recent calibration algorithm from VCST and provides an improved quality of calibrated sensor data products.
The SNPP VIIRS SD, with a near-Lambertian reflectance profile, is located inside the instrument, as shown in Figure 1, and provides a light source for the RSB calibration. The bidirectional reflectance factor (BRF) of the SD was measured prelaunch [19] and validated on-orbit using measurements from early mission yaw maneuvers [33,34,35]. Its on-orbit degradation, the H-factor, is tracked by the SDSM [23,24,25]. The SD degradation tracked by the SDSM is adopted as the SD degradation towards the RTA in the standard SD calibration methodology [18]. Due to the non-uniformity of the SD degradation in respect to the view direction [36,37], the SD degradation at the two view directions, towards the SDSM and the RTA, have non-negligible differences, which increase with time. This introduces long-term bias in the RSB calibration coefficients (SD F-factors), especially at short wavelengths [15,16,17,31]. Lunar calibration has become a widely accepted calibration approach for the calibration of satellite sensors because it can accurately evaluate the multi-year variations in satellite sensors [38,39,40,41,42,43]. As a result, the lunar calibration results (lunar F-factors) are used to derive the SD degradation at the view direction towards the RTA and to remove the long-term bias in the SD F-factors, resulting in a long-term consistency of the instrument’s L1B products [15,16,17,31].
The SD surface also degrades non-uniformly due to the uneven illumination of the sunlight and different optical paths. This non-uniformity behavior cannot be tracked by the SDSM but can be identified in the EV imagery because it induces detector-level striping in EV images; the striping becomes stronger as the non-uniformity increases [29,30]. By removing the striping, the non-uniformity of the SD degradation with respect to the location on the SD surface can be characterized. The impact of the location-dependent SD degradation non-uniformity on the detector-dependent calibration coefficients can be corrected and mitigated. The correction improves the quality of the L1B EV imagery for the visible (VIS) and near-infrared (NIR) bands [29,30].
In contrast to its follow-on VIIRS instrument aboard the NOAA-20 satellite, a couple of SNPP VIIRS RSBs have a large out-of-band (OOB) relative spectral response (RSR) [44]. The optical system, especially the RTA, degrades very differently at different wavelengths; therefore, the RSRs of the RSBs change significantly on-orbit, especially in early mission and for the bands with short wavelengths. A model has been developed to characterize the RSR on-orbit changes and to calculate the time-dependent RSRs for all the RSBs [45]. The derived time-dependent RSRs have been applied to both the SD and the lunar calibrations as well as in the L1B products to mitigate the impacts of the RSR on-orbit changes.
SNPP VIIRS has performed very well since its launch in 2011, even though it has passed its design lifetime of five years on-orbit. Nevertheless, instrument events on-orbit, such as the anomaly impacting the SD and SDSM calibrations that occurred on 24 February 2019, warranted corrective measures in the H-factor and F-factors algorithms. Although the actual root cause of the anomaly is unknown, these algorithm modifications have ensured no impact on the L1B products.
In this paper, the SNPP VIIRS RSB calibration algorithms are briefly reviewed, calibration improvements are described, and the RSB performance based on NASA SNPP L1B C2 is presented. Many abbreviations are used in this paper; therefore, a list of them is given in Table 2 for convenience. In Section 2, the SNPP VIIRS RSB calibration methodology is reviewed. In Section 3, the RSB calibration results and performance are shown. In Section 4, challenging issues and future improvements are addressed. Section 5 summarizes and concludes the work.
2. Calibration Algorithms
2.1. Radiance
The top-of-atmosphere (TOA) radiance is the baseline for all science products. For VIIRS RSB, a quadratic function is used to relate the radiance at the VIIRS entrance aperture to the instrument background-subtracted response dn(B,D,S,N), which is,
where B, D, S, and N are the band number, detector number, sample index, and scan number, respectively, M is the side index of the HAM for the scan N, and G is the gain status of the band B at the scan N. The coefficients c0, c1, and c2 are prelaunch-determined calibration coefficients which include the temperature-dependent variation of the instrument response [19], dn(B,D,S,N) is the background subtracted digital response, RVS(B,M,α) is the response versus scan angle (RVS) at incident angle α, and F(B,D,M,G) is a time-dependent correction factor to the calibration coefficients which is determined from on-orbit measurements and is also called the F-factor. Equation (1) can be applied to calculate the EV, the SD view, as well as the lunar view radiance. F(B,D,M,G) changes with time and needs to be updated regularly. For SNPP VIIRS RSBs, SD/SDSM and lunar calibration as well as EV targets are used to calibrate the RSBs and update the F-factors routinely.
2.2. SDSM Calibration
The SDSM is a ratioing radiometer, which views the SD, the Sun, and the dark interior alternatively. Figure 2 is a schematic of the VIIRS SDSM and SD calibration. The SD and SDSM aperture are fully illuminated by the sunlight passing through the SD port and SDSM Sun view port in front of the instrument, respectively. This happens only for a very short time period when the satellite crosses the terminator from Earth nightside to dayside. A time window of about 1 min in the full illumination time range is selected as the so-called “sweet spot” [20,21,31]. Only SDSM data collected in the “sweet spot” are used to track the SD degradation. VIIRS SDSM has eight detectors, the center wavelengths of which are listed in Table 1. Figure 3a illustrates an example of the illumination of the SD and SDSM aperture in the background-subtracted digital count (dc) of SDSM detector 1 (D1) versus φV,SD, the angle between the solar vector and the surface of the SD, during an SDSM calibration event. The dashed vertical lines designate the boundaries of the calibration “sweet spot”, where . From Figure 3a, it can be seen that both SD and SD aperture are in the fully illumination range when the solar angle is in the “sweet spot”.
The SD degradation as measured by each SDSM detector D can be tracked on-orbit by taking the ratio of the detector’s response when viewing the SD to its response when viewing the Sun view [25,31], i.e.,
where S and N denote the sample and scan number, respectively, dcSD,D and dcSun,D are background-subtracted responses from the SD view and direct Sun view, respectively, for the SDSM detector D, ρSD,SDSM(λD) is the BRF of the SD at the time the instrument was launched for light with outgoing direction toward the SDSM, and τSDS and τSVS are the transmittances or vignetting functions (VFs) of the SD port screen and SDSM sun-view port screen, respectively. Two screens were installed to reduce the light intensity reaching the SD and the SDSM aperture so as to prevent the potential saturation of the SDSM detector response. The BRF and the VFs were measured at various angles during prelaunch testing and the functional form of the angular dependence was updated on-orbit using data from yaw maneuvers as well as data from regular on-orbit SDSM measurements [33,34]. The θSD is the solar-zenith angle to the SD and <…>S,N indicates the average over the samples in each scan and the scans in the “sweet spot”. For the SD on-orbit degradation, the derived H-factors were normalized to one at the time of launch for all detectors. The SDSM has eight detectors; therefore, we obtained eight measured H-factors, , from each SDSM calibration event using Equation (2).
Each SDSM detector has a wide spectrum, which means that the RSR of a SDSM detector spans a large spectral range and the RSRs of the eight SDSM detectors may overlap. If is the SD degradation for the view direction towards the SDSM at wavelength λ, we can write
where ISun(λ) is the solar irradiance using MODTRAN Version 4.3 Revision 1 [46] and RSRSDSM,D is the RSR of SDSM detector D. There are eight measured H-factors, , from each event that result in eight coupled equations [47]. By assuming that the RSRs of the eight detectors are smooth functions of the wavelength, the equations described in Equation (3) can be resolved using an iteration approach and the SD degradation at eight center wavelengths, , of the SDSM detectors can be derived. All the eight derived H-factors are normalized to the instrument launch date, 28 October 2011.
The SD degradation, , can only be derived from the SDSM calibration at center wavelengths of the eight SDSM detectors, which span a spectral range from 412 nm to 935 nm. for any wavelength λ in this range can be obtained by a linear interpolation of the SD degradation at the center wavelengths of the eight detectors. The SD degradation beyond 935 nm cannot be directly derived from the SDSM calibration.
The SD degradation in the SWIR spectral range has become non-negligible, especially for band M8, after ten years in operation. Hence, the SD degradation beyond 935 nm needs to be addressed. A model describing the wavelength dependency of the SD degradation has been developed [48],
where β and η are obtained by fitting Equation (4) to the SD degradations measured by the SDSM detectors 5–8 at the wavelengths in the NIR spectral range. In VCST’s calibration methodology, Equation (4) is then extrapolated to longer wavelengths to derive the SD degradation, , for the wavelength range beyond 935 nm. The SD degradation can then be obtained for the entire spectral range of the SNPP VIIRS RSBs.
2.3. SD Calibration
The SD is illuminated by the sunlight through the SD port in front of the instrument for only a few minutes every orbit when the satellite crosses the terminator from the night-side to the dayside of the Earth, as mentioned previously [20,21]. Figure 3b illustrates an example of the illumination of the SD in the background-subtracted detector digital number with respect to solar angle in the SD coordinate system for detector 1 of band M1 in the high-gain stage. The plateau in the middle of the curve is the range where the SD is fully illuminated by the sunlight through the SD port and only the measured data in this range can be used to calibrate the RSBs. In actual VIIRS SD calibrations, only the data in the “sweet spot” bounded by the two dashed vertical lines at 34° to 37° are used to derive the RSB gain on-orbit changes [31]. The “sweet spot” used in SD calibration is slightly larger than that used in SDSM calibration. There is no constraint about the illumination of the sunlight on the aperture in SD calibration, resulting in the possibility that the “sweet spot” can be selected in a larger solar angle range.
The radiance of the sunlight reflected by the SD at wavelength λ, LSD(λ), in the full illumination time period can be calculated by [21,31]
where ISun is the solar irradiance at a Sun–Earth distance of one astronomical unit (AU), τSDS is the transmittance of the SD screen, BRFRTA is the bidirectional reflectance factor of the SD for light with outgoing direction toward the RTA, h(λ) is the on-orbit SD degradation, HSDSM(λ), described in the previous subsection and normalized at the instrument’s launch time, θSD is the zenith angle of the incident light on the SD surface, and dVS is the VIIRS–Sun distance in AU. The BRF, VF, and cos(θSD) describe the dependence of the reflected solar radiance as a function of solar angles. The BRF and VF were measured prelaunch and updated on-orbit using the early mission yaw maneuver data [33].
With the radiance calculated by Equation (5) and the instrument background-subtracted response dn, the calibration coefficients, F-factors, using the SD observation can be calculated by [21,31]
where SD indicates that the F-factors are derived from the SD calibration to distinguish from those derived using the lunar calibration, RVSB,SD is the response versus scan angle at the angle of incidence (AOI) of the SD for band B, RSRB is the RSR of band B, and <…>S,N indicates the average over the samples in each scan and then all the scans of the “sweet spot”.
The RSR, denoted as RSRB(λ, t) in Equation (6), may change on orbit, especially for short wavelength bands that have larger OOB RSR contributions than expected [44], which was found during prelaunch RSR measurements [19,44]. For band M1, the OOB RSR contribution from the prelaunch characterization was seen to be as large as 2.83% [21]. The VIIRS optical components, particularly the mirrors in the RTA, have different rates of degradation at different wavelengths; therefore, the RSR can change with time and the change will be more significant for bands with a larger OOB RSR. With the assumption that the degradation of the optical system mainly occurs due to optical components in the common path, the RSR on-orbit change can be derived from the on-orbit change differences between the F-factors obtained by Equation (6) [21,45]. The equation to derive the time-dependent RSR is coupled with Equation (6) and can be solved iteratively [21,45].
2.4. Lunar Calibration
The lunar surface has a highly stable reflectance over long time periods in the spectral range of the RSBs. Therefore, the Moon is an excellent light source for the calibration of RSBs on-orbit. Figure 4 is an image observed by SNPP VIIRS band I1 on 23 February 2021. The lunar surface is not smooth as seen in Figure 4; therefore, the lunar irradiance instead of lunar radiance is used to monitor the VIIRS RSB on-orbit changes. The Moon can automatically intrude the SV multiple times for about three months every year, and a partial Moon is observed in most of these events with large variation in the view geometry. The lunar irradiance exhibits a strong dependence on the illumination and view geometry, especially the phase angle; therefore, these lunar observations are not a good choice for routine RSB calibration. Therefore, SNPP VIIRS is scheduled to view the Moon approximately monthly through its SV with the lunar phase angles kept within a range of −51.5° to −50.5° [26], where the negative sign indicates a waxing moon, and gain stage is fixed at high-gain for all the dual-gain bands.
The detector-averaged relative F-factor can be derived from each of the scheduled lunar observations, with the approximation of negligible detector difference, by the expression [27,28]
where g(B) represents the view geometry effect on the lunar irradiance, NM is the number of scans which fully cover the lunar surface from HAM-side M, and δ(M,MN) is the Kronecker delta function. The predicted lunar irradiance of the Robotic Lunar Observatory (ROLO) model is used to correct for the view geometric effects [39,40,41,42,43]. During each lunar observation event, the instrument can observe at least a portion of the Moon in multiple scans. The full surface of the Moon is only seen by the instrument in a few scans in the center of the lunar observation event, whereas in other scans, the partial lunar surface is observed by the instrument. For our lunar calibration algorithm, we only used data from scans where the full surface of the Moon is observed to calculate the lunar irradiance and F-factors. The calculation could alternatively be performed using all scans that contain at least a partial image of the Moon, with a correction to account for the oversampling effect, although both versions of the calculation give similar results. For simplicity, all scans with a full lunar disk image were used for each event, although the number of available full-disk scans was not consistent but varied from event to event [27,28]. To distinguish from the F-factor derived from the SD/SDSM calibration, the F-factors obtained from the lunar calibration will be referred to as lunar F-factors.
2.5. SD and Lunar Calibration Comparison
VIIRS was designed so that the SD and the SV port, through which lunar observations are made, both view the HAM at the same AOI, although the optical paths on the HAM surface are in opposite directions. Thus, the SD and lunar calibrations should provide the exact same on-orbit changes of the RSBs if they are accurate, without concern for any possible AOI-dependent changes in the HAM reflectivity. As mentioned previously, the SD degradation for the view direction towards the SDSM is adopted as that for the view direction towards the RTA (or RSB), which may induce long-term bias in the SD F-factors, especially in short-wave RSBs. The lunar F-factors have no such long-term bias due to the stable reflectance of the lunar surface. Thus, the trending differences between the SD and lunar F-factors provide the information of the SD degradation differences between the two view directions.
To obtain the SD degradation differences at the two view directions, the ratios, RMoon,SD, of the lunar F-factors over the detector-averaged SD F-factors were calculated. To predict the ratios at any other time at which there is no lunar measurement and remove seasonal oscillations, the ratios, RMoon,SD, were fitted to the following analytical model [31]
where HSDSM(λ) is the SD degradation for the SDSM view direction at wavelength λ and has been described in Section 2.2, and are the solar azimuth angle for the RTA SD view with respect to the SD surface normal and a reference angle, set at 48°, respectively, and c,, and are three parameters to be fitted. Since the launch of SNPP VIIRS on 28 October 2011, the SD has experienced degradation on-orbit. At the time, the H-factors for all view directions can be approximated to be unity and the ratios of the lunar and then SD F-factors for each RSB should be unity as well. As mentioned previously, the lunar calibration only provides the SNPP VIIRS RSB on-orbit changes and needs to be normalized to the SD result at the time when the instrument was first turned in order to be used for an absolute calibration of the RSBs. The fitted constant c provides information for the normalization of the lunar F-factors to SD F-factors at the time the instrument was first turned on. The SD degradation, HSDSM(λ), is still small, even though it is non-negligible for SWIR bands. It will also be demonstrated that the SD degradation difference with respect to outgoing direction decreases with increasing wavelength and becomes negligible in the SWIR spectral range. Therefore, Equation (8) is only applied to visible and near-infrared bands to obtain the ratios at the center wavelength of each band independently.
Equation (8) can describe the ratios of the lunar F-factors over the SD F-factors early in the mission. After the instrument has been on-orbit for about ten years, this function cannot accurately describe the ratios for the entire mission, especially at short wavelengths that have experienced the most degradation. In the latest L1B C2 version, we used the single fit function in Equation (8) for most VIS and NIR (VNIR) bands. However, for bands M1 and M2, we used smoothly connected multiple pieces of the function to describe the ratios. Each piece of the function is derived by fitting to the data in a separate time period. The first piece is the function, , fitted to the data of the ratios, RMoon,SD, for the time period of the first four years on-orbit from 2012 to 2015, where the superscript 1 in and indicates that they are the parameters obtained in the first fitting. The coefficient corrects for the magnitude of seasonal oscillations in the SD F-factors that are correlated with the azimuth angle. This is determined from empirical fitting of the SD F-factors over the first few years of the mission, and for multi-piece fitting, the value of is kept constant for all time segments. Then, the ratios of the lunar F-factors over SD F-factors for the entire mission are normalized by the fitted constant . The first piece of the fitted function is also normalized by the constant. The second piece of the function, , is fitted to the data of the re-normalized ratios, , for the time period of four years from 2013 to 2016. Keeping the same procedure, we can obtain multiple pieces of fit functions to construct an entire-mission fit. A fit-segment is added on a yearly basis at the end of the calendar year with a smoothly connected transition with the previous segment. We can use to denote this smoothly connected fitted function for band B, where λB is the center wavelength of the band at time t. Each VNIR band has a fitted smooth function , although only bands M1 and M2 use multiple segments. By linear interpolation, we can obtain for any λ for the spectral range from 412 nm to 935 nm. As mentioned previously, the SD degradation differences in the SWIR spectral range are negligible. Then, we can expand the function to the wavelength range beyond 935 nm with a constant value of unity.
2.6. SDSM and SD Calibration Correction
As shown in the previous subsection, the SD degradation differences between the two view directions can be described by either a single piece or multiple smoothly connected pieces of a model function, , which is derived from the lunar and SD F-factor ratios for the wavelength range from 412 nm to 935 nm and set to unity for wavelengths larger than 935 nm. Therefore, the SD degradation for the view direction towards the RTA (or RSBs) can be calculated by
This degradation is required in the SD calibration. By applying Equation (9) into Equation (5), we can recalculate the SD F-factors using Equation (6). Then, the recalculated SD F-factors have long-term stability as well as short-term frequency. In this paper, we designate the recalculated SD F-factors as corrected SD F-factors, which have the same long-term trending as the lunar F-factors.
The corrected SD F-factors are used to generate RSB look-up tables, which are used to produce the L1B products. In SNPP L1B C2, there are two time periods, before the time when the reprocessing LUTs were generated and after VCST began delivering forward updates to the L1B C2 LUTs in July 2020. In the former, each F-factor LUT is generated by fitting the corrected SD F-factors around the time stamp of the LUT to a quadratic form for each band, detector, HAM side, and gain stage, and then calculating the LUT using the fitted quadratic forms at the time stamp. In the latter, an LUT for forward prediction is produced by fitting the F-factors in the last 1.5 years to a linear function for each band, detector, HAM side, and gain stage and calculating the value of the linear function at the time stamp of the LUT. The fitting removes the noise in the SD F-factors and provides smooth functions which can be used to predict the calibration coefficients into the future. The measured F-factors are continuously monitored and forward LUT updates are provided as needed.
2.7. EV Striping and Its Removal
Evaluating the EV imagery is an effective way to assess the quality of the calibration [29,30]. The L1B Collection 1 (C1) images observed by SNPP VIIRS band M1 at the Libya 4 desert site early in the mission demonstrate that the striping along the track direction, which is representative of the detector differences, is very weak [29,30]. By comparing to the images of the site observed in later years, it is seen that the striping gradually increases with time [29,30]. Figure 5 is the image observed by band M1 at the Libya 4 site on 10 January 2021. We used a rainbow color map to display the radiance of the M1 image for a better demonstration of the striping. The remarkable striping is clearly seen in the image. The striping and its magnitude increase are also observed in other types of scenes. The striping is likely induced by errors in the calibration. It can also be induced by other reasons such as polarization [49], if the polarization sensitivity of the band has strong detector dependence. However, there is no evidence to suggest that the polarization sensitivity of band M1 has changed on-orbit.
In C1 SD calibration methodology, the SD degradation, HSDSM(λ) or HRTA(λ), are detector-independent. The footprints of the 16 detectors of band M1 when viewing the SD surface are slightly different and the optical paths of the 16 detectors are not exactly the same either; thus, any spatially non-uniform degradation of the SD surface could lead to a detector-dependent error. In fact, the SD surface is not evenly illuminated during an SD calibration event. This uneven illumination induces non-uniform degradation of the SD across different detectors. These degradation differences are not included in C1 SD calibration methodology and induce detector-dependent errors in the derived F-factors, which result in striping in the EV imagery and the striping becomes stronger as the errors become larger with time [29].
The striping is also observed in EV imagery of a few other short wavelength bands. It becomes stronger with time but is smaller in magnitude than that observed for band M1. The striping strength is band-dependent and varies with the band wavelength.
To describe the striping and determine its strength, we can calculate the averaged radiance observed by each detector in a band and the differences of the averaged radiances. Figure 6 shows the annual averaged ratios of the radiance of each detector over the detector-averaged radiance for band M1 over the Libya 4 site from the L1B C1. The differences among all 16 detectors are smaller than 0.7% in 2012, gradually increase with time, and become greater than 2% by 2020. We see a similar behavior in other bands as well. We can fit the ratios of each band to a linear function of the detector number [30]
where DB,mid is the detector number of the middle detector of the band, 7 and 15 for an M- and I-band, respectively, and and are coefficients of the linear function, which are band-dependent. Table 3 lists the fitted coefficients for bands I1–I2, M1–M5, and M7. The coefficients for band M5 are zero, which indicates that the striping in the C1 EV imagery for the band is negligible. Band M6 is saturated at a lot of pixels when it views the Libya 4 site and the deep convective clouds (DCC). Thus, the striping correction coefficients have not been derived with the current methodology for band M6. From the fitted coefficients in Table 3 and the strong degradation of the SD at the short wavelengths, the striping in general increases faster in short wavelength bands than in long wavelength bands. This is understandable because the SD is more sensitive to short wavelength sunlight and then the uneven illumination by the sunlight at different spots of the SD surface induces more nonuniformity at the SD surface for short wavelengths than for long wavelengths.
In SNPP C2 methodology, the lunar-corrected SD F-factors are further divided by the function in Equation (10) with fitted coefficients in Table 3 for each band of bands I1–I2, M1–M5, and M7 to produce the final SD F-factors which are then used to generate the F-factor LUTs for L1B C2 [30]. With the detector difference-corrected F-factor LUTs for an RSB, the striping in EV imagery of the band is reduced, which will be demonstrated in the next section.
3. Calibration Results and Performance
3.1. H-Factors
The SNPP VIIRS SDSM calibration was operated very frequently in the first few months on-orbit, and the frequency was gradually reduced over the subsequent ten years [21,25]. The SDSM calibration is currently operated on a weekly basis. Thus far, more than 2500 SDSM calibrations have been implemented on SNPP VIIRS. Solid lines in Figure 7 show the SD degradation, , directly derived from the SDSM observations over the entire mission. The eight curves are all normalized to unity at the time of launch, 28 October 2011. It is seen from the figure that the SD degrades with time at each of the eight SDSM detector wavelengths and degrades faster at the shorter wavelengths. The measured degradation by each SDSM detector changes smoothly with time, except for some oscillations between 2014 and 2015 and a discontinuity in 2019. It is already known that the former was a true performance of the SD [21] and the latter was due to an instrument anomaly that occurred on 24 February 2019. The discontinuity seen in each solid curve in Figure 7 is probably an artifact and the root cause is still unknown. The anomaly has similar impact on the F-factors derived from the SD calibration, which will be discussed in the next subsection. The impacts of the anomaly in SDSM calibration and SD calibration cancel each other. Thus, we do not need to mitigate the discontinuity in each solid curve in Figure 7. It is worth mentioning that the seasonal oscillations in the H-factors measured by detectors 7 and 8 became larger after the anomaly, but they were still within 0.1%.
The H-factors measured by an SDSM detector, shown as solid curves in Figure 7, are the SD degradation weighted with the RSR of the detector in a spectral range. With the deconvolution approach described in Section 2.2, we can derive the SD degradation for the view direction towards the SDSM at the center wavelengths (see Table 1), of the eight SDSM detectors. Dashed curves in Figure 7 show the SD degradations, HSDSM(λ), at the center wavelengths of the SDSM detectors. By comparing the solid and dashed curves in Figure 7, we can see that the two sets of H-factors are in good agreement for the SDSM detectors 5–8, although they diverge more at short wavelengths. The differences between the two sets of H-factors for detectors 1 and 2 are about 0.035 (6.3%) and 0.015 (2.3%), respectively. Thus, the SDSM detector RSR correction has a larger impact at shorter wavelengths. In the ten years since VIIRS launched, the SD has degraded from the view direction of the SDSM (with the artifact of the discontinuity on 24 February 2019 excluded) about 45.5%, 36.5%, 28.0%, 19.5%, 8.8%, 5.5%, 2.8%, and 2.0% at wavelengths of the SDSM detectors D1–D8, respectively.
The SDSM degradation beyond 935 nm cannot be tracked by the SDSM. However, the SD degradation in this spectral range can be predicted by the model described in Equation (4). Figure 8 shows the predicted SD degradations at the center wavelengths of the SWIR bands. Same as in Figure 7, the discontinuities due to the anomaly on 24 February 2019 are clearly seen in the SD degradation. It is worth paying attention to the oscillations after the anomaly. They are mainly induced by the oscillations in the H-factors measured by SDSM detectors 7 and 8, as mentioned previously. The model described in Equation (4) is an extrapolation of the SDSM measured H-factors. Any error in the measured SDSM H-factors is amplified in the predicted H-factors for the SWIR bands, especially the errors in the H-factors measured by SDSM detectors 7 and 8. It is seen that the SD has degraded (with the artifact of the anomaly on 24 February 2019 excluded) about 0.7%, 0.4%, 0.2%, and less than 0.1% at the wavelengths of bands M8, M9, M10, and M11, respectively. The degradations for bands M8 and M9 are indeed non-negligible and need to be considered in the SD calibration.
3.2. Time-Dependent RSR and SD F-Factors
The SD is fully illuminated by the sunlight through the SD port in each orbit when SNPP VIIRS passes the South Pole, and the SD calibration can then be performed for every orbit. From each SD calibration event, the F-factors are calculated for each RSB, detector, gain stage, and HAM side. There are about 14.2 orbits every day. Then, either 14 or 15 sets of F-factors from the SD observations can be calculated on a daily basis. Thus far, we have had more than 50,000 SD calibration opportunities in the nearly ten years of SNPP VIIRS operation. As described in Section 2.3, the RSRs of the RSBs may change on-orbit due to nonnegligible OOB contributions, especially for short wavelength bands, and the SD F-factors and the time-dependent RSR need to be calculated iteratively because the RSR and the F-factors are coupled and cannot be determined separately. In this subsection, the F-factors calculated with the linear interpolation of the H-factors displayed by dotted curves in Figure 7, and solid curves and dots in Figure 8 are used as inputs for SD degradation.
Figure 9 displays the RSR for band M1 at four different times represented with four different colors: prelaunch (black), 8 May 2012 (red), 8 November 2013 (green), and 8 November 2020 (blue). From the figure, it can be seen that the band has OOB contributions from all spectral regions of visible, NIR, and SWIR. The total OOB contribution to the band’s RSR was about 2.83% at prelaunch [21], which is not small and much larger than those in other RSBs. The OOB contributions in the NIR and SWIR regions gradually reduce with time because the RTA degrades faster in the two spectral regions. The figure also shows that the RSR changes comparatively fast in the early mission, then the change slows afterward, and it becomes negligible after about November 2013, demonstrated by the two curves of 8 November 2013 and 8 November 2020 being very close to each other, considering the y-axis in a logarithmic scale. The time-dependent RSRs have been calculated for other RSBs as well. The RSR on-orbit changes for other RSBs are relatively smaller than that of band M1.
As seen in Equation (6), the F-factors depend on the RSRs. The F-factors for an RSB derived with time-dependent RSR differ from those derived with prelaunch-measured RSR, and these differences increase as the RSR changes increase. The RSB on-orbit changes are band-dependent, as previously mentioned, and their impacts on the calculated F-factors are band-dependent, as expected [21]. The percentage differences of the band-averaged F-factors on 1 July 2021 were 0.016, −0.072, 0.029, −0.209, −0.013, 0.128, 0.343, 0.071, −0.060, −0.104, 0.308, −0.014, 0.039, and 0.001 for bands I1–I3 and M1–M11, respectively. For most bands, the impacts are negligible except for bands M1, M4, and M8, which have larger OOB RSR contributions [44]. Even for these three bands, the impacts of the RSR on-orbit changes are still relatively small.
The F-factors (inverse of gain) for odd detectors of band M1 high-gain, and HAM side 1 are shown in Figure 10. They are stable even though they have some visible seasonal oscillations which are due to the uncertainty of the SD BRF and SD screen VF. It is clearly shown that the F-factors are detector-dependent and fairly stable with time, with a slight decrease over the mission. It is also noticeable that the rate of F-factor change is different among detectors. For other RSBs, the F-factors have similar behavior with respect to detector dependence. It is worth mentioning that the F-factors are the ratios of the on-orbit calibration coefficients to those from prelaunch measurements. In principle, they should be one or close to one at the time the instrument was launched. However, Figure 10 shows that the M1 F-factors were all greater than 1.27 at the first measurement. This large discrepancy is induced by the large OOB RSR, and a different radiance distribution of the light source used in the prelaunch measurements in the visible, NIR, and SWIR regions compared to the solar spectrum [19,20]. For other RSBs that have fewer OOB RSR contributions, the F-factors at the time of the first measurement are indeed close to unity, as expected.
The detector-averaged F-factors for VNIR bands with high-gain status and HAM side 1 are shown in Figure 11a. They were normalized at the first measurement on 8 November 2011 when the instrument was turned on. From the figure, it can be seen that the F-factors of bands I2 and M7 had the largest increase, of about 83.0%. I2 and M7 had a similar RSR and behaved similarly, as expected. M6 had the second largest F-Factor increase, of about 40.0%. The F-factors of bands M1 and M2, which had shortest wavelengths among all RSBs, had the smallest increase. In fact, the F-factors of the two bands decreased with time, especially band M2, which decreased 2% since launch. In orbit, the F-factors of bands M3, M4, I1, and M5 increased about 0.5%, 3%, 11.0%, and 19.0%, respectively. The gain of a band is inversely proportional to the F-factor of the band; therefore, the gains of all VNIR bands decrease with time in the past ten years since launch. In other words, all VNIR bands have been degrading on-orbit with time. From Figure 11a, it is also seen that the NIR bands have generally degraded much faster than the VIS bands. The fast degradation of the NIR bands is mainly due to the large degradation of the RTA around a wavelength of 1000 nm due to an anomaly related to the tungsten oxide coating [50,51].
The detector-averaged F-factors for SWIR bands, I3, and M8–M11 are displayed in Figure 11b. The SWIR bands are located on the S/MWIR focal plane assembly (FPA). They were not stable until 20 January 2012, when the temperature of S/MWIR FPA started to be controlled as designed. The F-factors shown in Figure 11b before 20 January 2012 are the simulated results and represented by dashed lines. From Figure 11b, it is seen that the F-factors for the SWIR bands increase smoothly with time, similar to the VNIR bands. Among the five SWIR bands, the F-factors of the bands with shorter wavelengths increase more. Since launch, band M8 has had the largest increase in time, about 76%, whereas band M11 had the smallest increase, about 7%. The primary reason for band M8’s faster degradation is the large degradation of the RTA at the wavelength of the band [50,51]. Bands I3 and M10 have a similar RSR, and they degrade similarly.
The F-factors are the ratios of the on-orbit calibration coefficients over those measured prelaunch. To investigate the actual HAM side difference, we need to calculate the calibration coefficients first, by multiplying the F-factors, , and the linear term, , of the prelaunch calibration coefficients and then computing the HAM side ratios of the calculated calibration coefficients instead of the F-factor HAM side ratios. Figure 12 shows the HAM side ratios of the calibration coefficients for bands M1, M3, M5, M7, M9, and M11. The HAM side differences for these bands are within 1% for all RSBs. For each RSB, the ratio is very stable, within 0.3% in general, and the on-orbit change in entire mission is less than 0.1%. Similar performance is seen in other RSBs. This is different from MODIS instruments, where the mirror side differences for the RSBs are larger and change with time [2].
As listed in Table 1, VIIRS bands M1–M5 and M7 are dual-gain bands. Each of them has two gain stages, high-gain and low-gain. The F-factors for high-gain are shown in Figure 11a,b. The F-factors of each dual gain band for the low-gain stage perform about the same as those for high-gain. Figure 13 shows the ratios of the band-averaged F-factors for high-gain over those for low-gain. It is seen that the ratios are stable to within 0.3% for all dual-gain bands. This indicates that the F-factors of dual-gain bands for the low-gain stage increase smoothly with time, and their increase rates are the same as the high-gain stages.
It is worth mentioning that no discontinuities were observed in Figure 10, Figure 11, Figure 12 and Figure 13 at the time of the anomaly on 24 February 2019, which induced a discontinuity in the H-factors shown in Figure 7 and Figure 8. This is because the effect is cancelled in the SDSM and SD calibrations. If corrections were applied to remove the discontinuities in the H-factors, the F-factors shown in this subsection would have discontinuities at the time of the anomaly. The perfect cancellation of the impacts on the two calibrations indicates that the anomaly is possibly due to change in the SD screen transmission, which alters the amount of light reaching the SD and impacts both the SD and SDSM calibrations in a similar manner. As discussed earlier, the actual root cause for the anomaly is not yet known. Nevertheless, the anomaly has no real impact on the F-factors derived from the SD and SDSM calibrations or the L1B products.
3.3. Lunar F-Factors
SNPP VIIRS has been scheduled to view the Moon approximately monthly, as previously mentioned. However, there are three months in summer every year during which the Moon cannot be observed by the instrument within the designed phase range from −51.5° to −50.5°. Thus, SNPP VIIRS has about nine scheduled lunar observations every year. Thus far, there have been 81 scheduled SNPP VIIRS lunar observations since launch. From each of the lunar observations, we can derive a set of F-factors, which are called lunar F-factors in this analysis, for each band and HAM side using the algorithm described in Section 2.4.
The lunar F-factors for SNPP VIIRS visible bands, M1–M4, NIR bands, I1–I2 and M5–M7, and SWIR bands, I3 and M8–M11 are shown with symbols in Figure 14a–c, respectively. They are normalized to the SD F-factors at the first SD measurement because the lunar calibration can only provide the RSB on-orbit change with the current methodology. There are visible oscillations with an amplitude of less than 1% in the F-factors which might be partially induced by the errors in the geometric correction provided by the ROLO model. The lunar calibration is only used to track the RSBs on-orbit degradation; therefore, the absolute uncertainty of the ROLO model prediction is not a concern in this analysis. However, the relative uncertainty of the prediction is because the errors of geometry effect correction induces oscillations in the calculated lunar F-factors, as seen in Figure 14a–c. The relative uncertainty is estimated to be about 1% for the entire view geometry range [39,40,41,42,43], and the oscillations seen in Figure 14a–c are consistent with that estimate. As expected, the F-factors change with time and the changes are band- or wavelength-dependent. The SD F-factors shown in Figure 11a,b are replotted as the solid lines in Figure 14a–c for direct comparison to the lunar F-factors. The lunar F-factors for band I2 and band M7 have the largest increase, of about 85% in the past ten years, which is about the same as that of the corresponding SD F-factors.
The lunar F-factors for the SWIR bands are shown in Figure 14c. They have been normalized to the SD F-factor at the first SD measurement time as well. As for the VNIR bands, there is an increase with time and a clear wavelength dependency. Similar to the SD F-factor trends, the lunar F-factors of band M8 had the largest increase since launch. The total increase since launch is about 77%, which is about the same as that seen in the corresponding SD F-factors. The bands with longer wavelengths have less degradation and the lunar F-factors of bands I3 and M10 are perfectly consistent with each other. These are all consistent with those seen in the SD F-factors, as evidenced by the close overlap of the symbols and solid lines in Figure 14c. It can be estimated that the lunar F-factors and SD F-factor for the SWIR bands increased by the same amount in the past ten years, which is different from the VNIR bands, especially short-wavelength visible bands. The consistency between the SD and lunar F-factors indicates that the simulated H-factors for wavelengths beyond 935 nm are accurate and the SD degradation change with respect to view direction is negligible for the SWIR spectral range.
3.4. SD and Lunar F-Factor Comparison
As mentioned previously, the SD F-factors may have long-term bias in comparison with the lunar F-factors. For comparison, the SD F-factors shown in Figure 11a,b are also displayed in Figure 14a–c with solid lines. It is shown in Figure 14a that the two sets of F-factors for each visible band diverge with time, and band M1 has the largest divergence. For a clear demonstration of the divergence, the ratios of the lunar F-factors over those of SD for all VNIR bands are calculated and shown in Figure 14d with symbols. The ratios increase with time for all VNIR bands. The increase rates are strongly band (or wavelength)-dependent. The SD and lunar F-factors of band M1 have the largest difference, of about 9.8%. For bands M2–M5, and I1, the differences vary from about 5.8% to 1%. The longest wavelength VIS/NIR bands M7 and I2 have the least difference, less than 0.2%, which is negligible considering the uncertainties of the calibrations or the noise in the ratio trends. As mentioned previously, the ratios show the difference of the SD degradation at the two view directions towards the RTA and SDSM. The ratios in Figure 14d demonstrate that the differences between the SD degradations for the two view directions decrease with increasing wavelength and become negligible at the center wavelength of band M7 or I2 (862 nm). The wavelengths of the SWIR bands are much longer than 862 nm; therefore, we can assume that the differences of the SD degradations for the two directions are negligible for these bands. This assumption is justified by the good agreement between the lunar and SD F-factor tendencies, as shown in Figure 14c.
It is worth mentioning that the lunar and SD F-factor differences demonstrated by the ratios of the two F-factors shown in Figure 14d are much larger than those shown in similar analyses from other groups [15,16,17,22]. This is mainly due to the application of the SDSM detector RSR correction in the SDSM calibration. The H-factors with correction of the RSR effect decrease faster than those without the correction, as shown in Figure 7, resulting in a greater divergence between the SD and lunar F-factors.
3.5. Corrected H-Factors and F-Factors
The lunar and SD F-factor ratios provide the SD degradation differences between the two view directions, towards the SDSM and towards RTA. The ratios as well as the SD degradation for the SDSM view can be used to derive the SD degradation for the RTA view. To reduce the impact of the noise, the ratios for each band need to be fitted using an analytical function. A multi-piece smoothly connected model function, R(λ,t), for the ratios has been described in Section 2.6. By fitting the ratios shown in Figure 14d to the model function in Equation (8) for each band with least-mean-square approach, the parameters in the model can be determined. The SD degradation, HRTA(λΒ,t), for RTA view can then be calculated by multiplying the fitted lunar and SD F-factor ratios, F(λΒ,t), and the H-factors, HSDSM(λΒ,t), for the SDSM view at the center wavelength of each RSB B. Then, HRTA(λ,t) at any wavelength λ can be calculated via a linear interpolation of the SD degradation, HRTA(λΒ,t), at the center wavelengths of the RSBs. Figure 15 shows the obtained H-factors, HRTA(λD,t), for the RTA view at the center wavelengths of the SDSM detectors. For comparison purpose, the corresponding H-factors, HSDSM(λD,t), for the SDSM view are also drawn in the figure with dashed lines. As expected, the two sets of H-factors diverge with time and the divergence depends on the wavelength. They diverge more at shorter wavelengths.
With derived H-factors, HRTA(λ,t), for the RTA view applied in Equations (5) and (6), the SD F-factors can be recalculated. The recalculated SD F-factors are referred to as corrected SD F-factors, FSD,C(B,D,M,G,t), and should have the same long-term stability as the lunar F-factors. Figure 16a,b show the corrected SD F-factors for VIS and NIR bands, respectively. The lunar F-factors are displayed in the two figures as well by symbols. It is clearly seen in the figures that the two sets of F-factors are in excellent agreement. The corrected SD F-factors have both long-term stability and short-term accuracy. For SWIR bands, the corrected SD F-factors are the same as the original F-factors because the SD degradation differences for the two view directions are negligible and no correction based on lunar F-factor trending is applied.
The final SD F-factors, FSD,f(B,D,M,G,t), are obtained by dividing the corrected SD F-factors, FSD,c(B,D,M,G,t), with the detector difference, , which is described in Equation (10) in Section 2.7. The final SD F-factors are fitted to smooth functions that are used to calculate the F-factor LUTs for generating the L1B products.
Compared to SNPP L1B C1, the first improvement is that the detector differences are remarkably improved, which will be demonstrated in Section 3.6. The second improvement is the better description of the lunar and SD F-factor ratios early in the mission, resulting in smaller SNPP L1B EV radiance and reductions in the SNPP and NOAA-20 RSB differences, which will be discussed in Section 4. The third improvement is the removal of errors and artifacts in the C1 LUTs due to forward LUT updates, resulting in smoother and more accurate F-factors over time. The fourth improvement is long-term stability enhancement due to the timely and properly incorporation of the lunar results as described in Section 2.5 and Section 2.6. In fact, the methodology and algorithm improvements developed for L1B C2 have been applied in L1B C1 whenever they are mature. There are discontinuities in L1B C1 LUTs due to calibration methodology and algorithm improvements, but the L1B C1 LUTs for recent time periods are about the same as those of the L1B C2.
3.6. Improved EV Imagery with Striping Removal
It is shown in Figure 5 that there is detector striping in the EV imagery of previous SNPP VIIRS L1B collections or in EV L1B products generated with F-factor LUTs derived only from SD/SDSM and lunar calibrations. As mentioned in Section 2.7, the detector-dependent calibration errors in the SD F-factors can be removed using the detector difference factor, , derived from the Libya 4 desert site and DCC data. As a result, the striping in SNPP VIIRS L1B C2 products is significantly reduced.
Figure 17 shows the M1 EV images of SNPP VIIRS L1B C2 on 10 January 2021. In comparison with the images in Figure 5, the striping is largely eliminated. The striping reduction is seen in all types of EV images over the entire mission. Similar improvements are also observed in the EV images of all other RSBs listed in Table 3. The removal of the detector-dependent errors in the F-factors by using the detector difference factor, , improves the quality of the L1B EV products. The detector difference factor, , will be updated as needed in L1B C2 forward processing.
3.7. Uncertainty
Calibration uncertainty is important in order to assess the accuracy of the calibration coefficients and the quality of the L1B products. The uncertainty of the SNPP VIIRS RSBs depends on four components: uncertainty of the prelaunch calibration and characterization of the SD BRF, the SD screen VF, and the RVS of the HAM; the uncertainty of on-orbit SD/SDSM and lunar calibrations; the pixel-level signal noise uncertainty; and the degradation of the SD for the time period from the prelaunch measurements to the launch. The prelaunch measurements were traceable to National Institute of Standards and Technology (NIST) standards and the uncertainties of the measured BRF and VF were analyzed before the instrument was launched [52]. The RVS uncertainty was analyzed based on the uncertainty of the prelaunch RVS measurements and the residual of the fitting which fits a selected smooth function, describing the HAM AOI dependency, to measured values of the RVS at select AOIs [19]. The RSB on-orbit calibration uncertainty can be calculated according to the uncertainty of each input in the SD/SDSM and lunar calibrations [52,53]. The signal noise was measured pre-launch [19] and also tracked on-orbit using data from SD observations [54]. The fourth component of the contribution is unknown and assumed to be negligible due to the use of careful preservation procedures and was not considered in our uncertainty analysis. Therefore, the contributions of the first three components are considered when the uncertainty of the RSB calibration is analyzed.
Let us examine the signal noise in more detail because it is not only a key contribution to the uncertainty of the RSB calibration but also a measure of accuracy of EV instrument response. VIIRS has specifications for the signal-to-noise ratios (SNRs) of each RSB, which are listed in column 7 in Table 1. The noise performance of each VIIRS RSB detector is tracked on-orbit at varying signal levels using data from regular SD observations [54]. Overall, the noise of each SNPP VIIRS RSB detector at fixed signal level is stable on-orbit. The SNR is calculated for signals at the typical radiance level and tracked as a function of time on-orbit for each detector. Figure 18a–c show the SNR at typical radiance divided by the VIIRS SNR specification listed in Table 1 for the VIS, NIR, and SWIR bands, respectively. The trends for each band are the average over all detectors and both HAM sides for each band. Although the noise performance is stable in time, some bands have a decreasing SNR performance due to the decreasing signal level caused by the on-orbit degradation of the optics. The bands with the largest F-factor changes are also the bands with the largest degradation of the SNR: bands M8, M7, I2. However, for all RSB after ten years of operation, the SNR remained comfortably above the specification. In Figure 18c, the values of SNR/spec for band I3 are in the range 21–25 (SNR values in the range 125–150, with specification value of 6), well above the scale of the plot. It is worth mentioning that the SNRs are calculated with the un-aggregated SD view data. The SNR could be larger than those shown in Figure 18a–c for the aggregated EV pixels. All individual RSB detectors continue to perform well, with no detectors identified as noisy, inoperable, or out-of-family in their performance.
The detail analysis algorithms for the first and second components of the RSB uncertainties have been documented in the literature [52,53]. Here, we only show our uncertainty analysis results based on the L1B C2 calibration algorithms. Figure 19a,b show the uncertainties of the SNPP VIIRS, VNIR, and SWIR bands L1B C2 products at typical radiance, respectively. The uncertainties are band-dependent and increase slightly with time. They are smaller than the uncertainty specification, 2%, except for band M11, which has the longest wavelength among all RSBs. M11 has an uncertainty of 5%, which is more than double the specification. The typical radiance of band M11 is very low compared with those of other bands. At the typical radiance, the background-subtracted for band M11 is around 10. As a result, the signal-to-noise ratio at typical radiance for band M11 is only about 20 and the uncertainty of the band is dominated by the contribution of the signal–noise term. From Figure 19a,b, it is seen that the I-bands have higher uncertainties than the M-bands, except the M11 band. This is mainly due to the fact that I-bands have relatively lower SNRs at their typical radiances compared to the M-bands. The uncertainties shown in Figure 19a,b are smaller than those we reported earlier [31,32], which were derived based on the L1B C1 algorithms and products. The improvements of calibration algorithms in the L1B C2 have reduced the calibration uncertainties of the SNPP RSBs.
3.8. Desert Monitoring
The on-orbit calibration performance of the SNPP VIIRS RSBs is routinely monitored using vicarious techniques such as multi-year reflectance trending using pseudo-invariant calibration sites (PICS) in the North African desert, Dome Concordia in Antarctica and DCC [55,56]. In addition, simultaneous nadir overpasses with the well-calibrated Aqua Moderate Resolution Imaging Spectroradiometer (MODIS) instrument are also used to assess the stability and accuracy of the calibration. The repeat views of these targets result in acquisitions with similar solar and viewing geometry, which, in turn, facilitates the removal of these effects using simple semi-empirical models. The VIIRS SDR data used in the analysis are derived from a consistent calibration approach as applied to the NASA Land Product Evaluation and Algorithm Test Element (PEATE) production using the LUTs provided by NASA VCST. Using the PICS-based approaches, most of the VIIRS RSBs in the VIS and NIR spectral regions are shown to be stable to within 1%. The stability assessments provided from the SNO measurements show comparable results, but with a larger uncertainty due to varying atmospheric effects involved with this comparison. The DCC and desert trends are also used to monitor the reflectance trending at different scan-angles to ensure the validity of the prelaunch RVS coefficients [19]. Results indicate that the reflectance trends for the VIS and NIR bands across the scan-angle range are within 1%, with the exception of bands M4 and M5 that show differences up to 1.5%, a trend that warrants further monitoring [56]. In the case of SWIR bands, slightly greater deviations are observed. However, they are attributed to the unaccounted directional effects as well as atmospheric variations.
4. Discussion
After almost ten years on-orbit, the calibration methodology of the SNPP VIIRS RSBs has reached a mature stage. Nevertheless, it is still a challenge to accurately calibrate the SNPP VIIRS RSBs, especially considering that the instrument has passed its designed life of five years. With continued aging, more instrument anomalies are likely to occur. With algorithm improvements to the EDR and high-level science products, their requirements on the calibration accuracy of the RSBs may become higher, resulting in a necessity of further improvements in the RSB calibration algorithm. There are topics which need further investigation and existing issues that need to be resolved with better methodologies. It is also possible that our current methodology can be restructured such that the calibrations can be performed more efficiently.
Each SNPP VIIRS RSB has a dynamic range specified by minimum radiance, Lmin, and maximum radiance, Lmax, that were also measured prelaunch [19]. When the incident radiance is higher than Lmax, the response of the band is usually saturated. However, for a few bands, M5–M11, in NIR and SWIR spectral ranges, the detector responses do not stay at their saturated values when the radiance increases above Lmax, but instead decrease with increasing radiance. This phenomenon is called radiance rollover. It was found during prelaunch tests [19] and confirmed during post-launch validation. A major concern is that for such a band, when scene radiance is higher than its Lmax, the band response may appear as a valid, unsaturated value and be recorded in the L1B as an erroneous radiance value which is smaller than Lmax, causing serious problem in the EDR and high-level science products. Band M6 has been most impacted by this phenomenon among all the affected bands. Therefore, it is critical to identify the pixels that are impacted by the rollover and flag them appropriately in the L1B products, especially for band M6. Algorithms have previously been developed and applied to identify the data with rollover, but they use a conservative approach that may flag a large number of good pixels in addition to the true rollover pixels. These algorithms need to be improved, especially considering the large gain changes of the NIR and SWIR bands over the mission. We are currently investigating the rollover phenomenon and working to develop a better mitigation methodology for use in future L1B versions.
The calibration uncertainty is an important parameter to assess the quality and accuracy of the calibration. Preliminary results of the SNPP VIIRS RSB calibration reflectance uncertainties are shown in Figure 19a,b. Further investigation and analysis of the RSB calibration uncertainty algorithm are ongoing, especially considering the large differences between SNPP and NOAA-20 L1B EV reflectance. To assist the science product evaluation, the L1B products should have uncertainty information for each pixel, but this has not yet been implemented for VIIRS L1B products. Refining the reflectance uncertainty algorithm and adding an uncertainty index to the L1B products for each EV pixel is in progress.
It is known that the EV reflectance measurements from SNPP VIIRS and NOAA-20 VIIRS have large differences. The differences are band-dependent, roughly 4% to 6% for the VNIR bands and 2% to 3% for the SWIR bands. Intensive effort has been engaged to analyze the differences. Desert, DCC, Dome C, and other types of scenes have been used to compare the two instruments. The SNO approach has also been applied to track the differences of the two instruments. The differences between the two instruments for each RSB are determined for each type of EV scenes and methodology, and they are generally consistent with each other. The current calibration differences between SNPP and NOAA-20 VIIRS RSB cannot be explained by the uncertainty of the prelaunch test and that of the on-orbit calibrations. Further investigation of the differences between the two instruments and its root cause is required and is being addressed. Meanwhile, empirical approaches to mitigate the differences may be a temporary choice, and investigation on this issue is ongoing in the VIIRS calibration and science community as well.
5. Conclusions
We have presented and reviewed the SNPP VIIRS RSB on-orbit calibrations using SD, Moon, and EV scenes and the calibration performance for entire mission based on SNPP L1B C2. The calibration algorithm improvements have been addressed and discussed. The instrument has performed well in the last ten years since its launch, although an anomaly occurred in SD calibration, the impact of which was mitigated in a timely manner. All RSBs degrade continuously on-orbit with time since launch. The largest degradation occurs in bands I2 and M7, which have the same center wavelength, and RSR and bands with wavelengths in the spectral range from 800 nm to 1300 nm degrade faster than other RSBs due to the degradation of the RTA in that spectral range. In spite of the observed degradation, the SNR for all RSBs continues to meet and exceed the design specification. Among the four visible bands, band M1 degrades most. The lunar calibration is used as a baseline to track the long-term degradation of the SD due to the limitations associated with the SDSM, particularly at short wavelengths. The de-striping approach based on EV scene data has successfully mitigated the striping in L1B EV imagery. The accuracy and quality of SNPP VIIRS RSB L1B products are significantly improved in the latest C2. The challenging issues and future improvements of the RSB calibration are also addressed and discussed. One of the major challenges is to address the calibration differences between SNPP and N20 VIIRS. This is of particular importance with the upcoming launch of the JPSS-2 VIIRS in late 2022 that will continue the observations performed by the first two VIIRS instruments.
Author Contributions
Conceptualization, J.S. and X.X.; Data curation, N.L., S.L., K.T. and A.A.; Formal analysis, N.L., S.L., A.A. and K.T.; Methodology, J.S., N.L. and X.X.; Writing—original draft, J.S.; Writing—review and editing, A.A. and K.T. All authors have read and agreed to the published version of the manuscript.
Funding
This work received no external funding.
Institutional Review Board Statement
Not applicable.
Informed Consent Statement
Not applicable.
Acknowledgments
We would like to thank Gal Sarid for his valuable comments and suggestions.
Conflicts of Interest
The authors declare no conflict of interest.
References
- Cao, C.; Zhang, B.; Shao, X.; Wang, W.; Uprety, S.; Choi, T.; Blonski, S.; Gu, Y.; Bai, Y.; Lin, L.; et al. Mission-Long Recalibrated Science Quality Suomi NPP VIIRS Radiometric Dataset Using Advanced Algorithms for Time Series Studies. Remote Sens. 2021, 13, 1075. [Google Scholar] [CrossRef]
- Xiong, X.; Angal, A.; Chang, T.; Chiang, K.; Lei, N.; Li, Y.; Sun, J.; Twedt, K.; Wu, A. MODIS and VIIRS Calibration and Characterization in Support of Producing Long-Term High-Quality Data Products. Remote Sens. 2020, 12, 3167. [Google Scholar] [CrossRef]
- Ardanuy, P.E.; Schueler, C.F.; Miller, S.W.; Kealy, P.M.; Cota, S.A.; Haas, M.; Welsch, C. NPOESS VIIRS design process. Int. Symp. Opt. Sci. Technol. 2002, 4483, 24–34. [Google Scholar] [CrossRef]
- Schueler, C.; Clement, J.; Darnton, L.; Deluccia, F.; Scalione, T.; Swenson, H. VIIRS sensor performance. In Proceedings of the IGARSS 2003 IEEE International Geoscience and Remote Sensing Symposium. Proceedings (IEEE Cat. No.03CH37477), Toulouse, France, 21–25 July 2003; Institute of Electrical and Electronics Engineers (IEEE): Piscataway, NJ, USA, 2003; Volume 1, pp. 369–372. [Google Scholar]
- Murphy, R.E.; Ardanuy, P.; Deluccia, F.J.; Clement, J.E.; Schueler, C.F. The Visible Infrared Imaging Radiometer Suite. In Earth Science Satellite Remote Sensing; Springer: New York, NY, USA, 2007; Volume 1, pp. 199–223. [Google Scholar]
- Zhou, L.; Divakarla, M.; Liu, X.; Layns, A.; Goldberg, M. An Overview of the Science Performances and Calibration/Validation of Joint Polar Satellite System Operational Products. Remote Sens. 2019, 11, 698. [Google Scholar] [CrossRef] [Green Version]
- Justice, C.O.; Román, M.O.; Csiszar, I.; Vermote, E.F.; Wolfe, R.; Hook, S.J.; Friedl, M.; Wang, Z.; Schaaf, C.; Miura, T.; et al. Land and cryosphere products from Suomi NPP VIIRS: Overview and status. J. Geophys. Res. Atmos. 2013, 118, 9753–9765. [Google Scholar] [CrossRef] [Green Version]
- Vargas, M.; Miura, T.; Shabanov, N.; Kato, A. An initial assessment of Suomi NPP VIIRS vegetation index EDR. J. Geophys. Res. Atmos. 2013, 118, 12,301–12,316. [Google Scholar] [CrossRef] [Green Version]
- Csiszar, I.; Schroeder, W.; Giglio, L.; Ellicott, E.; Vadrevu, K.; Justice, C.O.; Wind, B. Active fires from the Suomi NPP Visible Infrared Imaging Radiometer Suite: Product status and first evaluation results. J. Geophys. Res. Atmos. 2014, 119, 803–816. [Google Scholar] [CrossRef]
- Wang, M.; Jiang, L. VIIRS-derived ocean color product using the imaging bands. Remote Sens. Environ. 2018, 206, 275–286. [Google Scholar] [CrossRef] [Green Version]
- Minnett, P.J.; Evans, R.H.; Podestá, G.; Kilpatrick, K.A. Sea-surface temperature from Suomi-NPP VIIRS: Algorithm development and uncertainty estimation. Proc. SPIE 2014, 9111, 91110C. [Google Scholar]
- Bouali, M.; Ignatov, A. Adaptive Reduction of Striping for improved SST Imagery from S-NPP VIIRS. J. Tech. 2014, 31, 150–163. [Google Scholar]
- Meyer, K.; Platnick, S.; Holz, R.; Dutcher, S.; Quinn, G.; Nagle, F. Derivation of Shortwave Radiometric Adjustments for SNPP and NOAA-20 VIIRS for the NASA MODIS-VIIRS Continuity Cloud Products. Remote Sens. 2020, 12, 4096. [Google Scholar] [CrossRef]
- Lee, J.; Hsu, N.C.; Bettenhausen, C.; Sayer, A.; Seftor, C.J.; Jeong, M. Retrieving the height of smoke and dust aerosols by synergistic use of VIIRS, OMPS, and CALIOP observations. J. Geophys. Res. Atmos. 2015, 120, 8372–8388. [Google Scholar] [CrossRef] [Green Version]
- Sun, J.; Wang, M. Radiometric calibration of the Visible Infrared Imaging Radiometer Suite reflective solar bands with robust characterizations and hybrid calibration coefficients. Appl. Opt. 2015, 54, 9331–9342. [Google Scholar] [CrossRef]
- Sun, J.; Wang, M. VIIRS Reflective Solar Bands Calibration Progress and Its Impact on Ocean Color Products. Remote Sens. 2016, 8, 194. [Google Scholar] [CrossRef] [Green Version]
- Eplee, R.E.; Turpie, K.R.; Meister, G.; Patt, F.S.; Franz, B.A.; Bailey, S. On-orbit calibration of the Suomi National Polar-Orbiting Partnership Visible Infrared Imaging Radiometer Suite for ocean color applications. Appl. Opt. 2015, 54, 1984–2006. [Google Scholar] [CrossRef] [PubMed]
- Baker, N. Joint Polar Satellite System (JPSS) VIIRS Radiometric Calibration Algorithm Theoretical Basis Document (ATBD); NASA Goddard Space Flight Center: Greenbelt, MA, USA, 2013.
- Oudrari, H.; McIntire, J.; Xiong, X.; Butler, J.; Lee, S.; Lei, N.; Schwarting, T.; Sun, J. Prelaunch Radiometric Characterization and Calibration of the S-NPP VIIRS Sensor. IEEE Trans. Geosci. Remote Sens. 2014, 53, 2195–2210. [Google Scholar] [CrossRef]
- Cardema, J.C.; Rausch, K.W.; Lei, N.; Moyer, D.I.; De Luccia, F.J. Operational calibration of VIIRS reflective solar band sensor data records. Earth Obs. Syst. XVII 2012, 8510, 851019. [Google Scholar] [CrossRef]
- Sun, J.; Wang, M. On-orbit calibration of Visible Infrared Imaging Radiometer Suite reflective solar bands and its challenges using a solar diffuser. Appl. Opt. 2015, 54, 7210–7223. [Google Scholar] [CrossRef]
- Choi, T.; Shao, X.; Cao, C. On-orbit radiometric calibration of Suomi NPP VIIRS reflective solar bands using the Moon and solar diffuser. Appl. Opt. 2018, 57, 9533–9542. [Google Scholar] [CrossRef] [PubMed]
- Haas, E.; Moyer, D.; De Luccia, F.; Rausch, K.; Fulbright, J. VIIRS solar diffuser bidirectional reflectance distribution function (BRDF) degradation factor operational trending and update. Earth Obs. Syst. XVII 2012, 8510, 851016. [Google Scholar] [CrossRef]
- Fulbright, J.; Lei, N.; Efremova, B.; Xiong, X. Suomi-NPP VIIRS Solar Diffuser Stability Monitor Performance. IEEE Trans. Geosci. Remote Sens. 2015, 54, 631–639. [Google Scholar] [CrossRef]
- Sun, J.; Wang, M. Visible Infrared Imaging Radiometer Suite solar diffuser calibration and its challenges using a solar diffuser stability monitor. Appl. Opt. 2014, 53, 8571–8584. [Google Scholar] [CrossRef]
- Sun, J.; Xiong, X. Solar and lunar observation planning for Earth-observing sensor. Sens. Syst. Next-Gener. Satell. XV 2011, 8176, 817610. [Google Scholar] [CrossRef]
- Xiong, X.; Sun, J.; Fulbright, J.; Wang, Z.; Butler, J.J. Lunar Calibration and Performance for S-NPP VIIRS Reflective Solar Bands. IEEE Trans. Geosci. Remote Sens. 2015, 54, 1052–1061. [Google Scholar] [CrossRef]
- Sun, J.; Xiong, X. SNPP VIIRS Reflective Solar Bands On-Orbit Calibration Using the Moon. IEEE Trans. Geosci. Remote Sens. 2021, 59, 4499–4512. [Google Scholar] [CrossRef]
- Li, S.C.; Xiong, X.; Lei, N. S-NPP and N20 VIIRS RSB bands detector-to-detector calibration differences assessment using a homogeneous ground target. Proc. SPIE 2020, 11501, 115011N. [Google Scholar]
- Lei, N.; Xiong, X.; Mu, Q.; Li, S.; Chang, T. Positional Dependence of SNPP VIIRS Solar Diffuser BRDF Change Factor: An Empirical Approach. IEEE Trans. Geosci. Remote Sens. 2021, 1–6. [Google Scholar] [CrossRef]
- Lei, N.; Xiong, X.; Wang, Z.; Li, S.; Twedt, K. SNPP VIIRS RSB on-orbit radiometric calibration algorithms Version 2.0 and the performances, part 1: The algorithms. J. Appl. Remote Sens. 2020, 14, 047501. [Google Scholar] [CrossRef]
- Lei, N.; Xiong, X.; Wang, Z.; Li, S.; Twedt, K. SNPP VIIRS RSB on-orbit radiometric calibration algorithms Version 2.0 and the performances, part 2: The performances. J. Appl. Remote Sens. 2020, 14, 047502. [Google Scholar] [CrossRef]
- Sun, J.; Wang, M. On-orbit characterization of the VIIRS solar diffuser and solar diffuser screen. Appl. Opt. 2015, 54, 236–252. [Google Scholar] [CrossRef] [PubMed]
- Lei, N.; Chen, X.; Xiong, X. Determination of the SNPP VIIRS SDSM Screen Relative Transmittance From Both Yaw Maneuver and Regular On-Orbit Data. IEEE Trans. Geosci. Remote Sens. 2015, 54, 1390–1398. [Google Scholar] [CrossRef]
- Choi, T.; Cao, C. S-NPP VIIRS on-orbit calibration coefficient improvements with yaw maneuver reanalysis. IEEE Trans. Geosci. Remote Sens. 2019, 57, 7460–7465. [Google Scholar] [CrossRef]
- Sun, J.; Chu, M.; Wang, M. Degradation nonuniformity in the solar diffuser bidirectional reflectance distribution function. Appl. Opt. 2016, 55, 6001–6016. [Google Scholar] [CrossRef] [PubMed]
- Lei, N.; Xiong, X. Impacts of the Angular Dependence of the Solar Diffuser BRDF Degradation Factor on the SNPP VIIRS Reflective Solar Band On-Orbit Radiometric Calibration. IEEE Trans. Geosci. Remote Sens. 2017, 55, 1537–1543. [Google Scholar] [CrossRef]
- Lane, A.P.; Irvine, W.M. Monochromatic phase curves and albedos for the lunar disk. Astron. J. 1973, 78, 267. [Google Scholar] [CrossRef]
- Kieffer, H.H.; Wildey, R.L. Establishing the Moon as a Spectral Radiance Standard. J. Atmos. Oce. Technol. 1996, 13, 360–375. [Google Scholar] [CrossRef] [Green Version]
- Kieffer, H.H. Photometric Stability of the Lunar Surface. Icarus 1997, 130, 323–327. [Google Scholar] [CrossRef]
- Stone, T.C.; Kieffer, H.H.; Becker, K.J. Modeling the radiance of the moon for on-orbit calibration. Proc. SPIE 2003, 5151, 463–470. [Google Scholar]
- Kieffer, H.H.; Stone, T.C. The Spectral Irradiance of the Moon. Astron. J. 2005, 129, 2887–2901. [Google Scholar] [CrossRef] [Green Version]
- Stone, T.C.; Kieffer, H.H. Use of the Moon to support on-orbit sensor calibration for climate change measurements. Proc. SPIE 2006, 6296, 62960Y. [Google Scholar] [CrossRef]
- Moeller, C.; McIntire, J.; Schwarting, T.; Moyer, D.; Costa, J. Suomi NPP VIIRS spectral characterization: Understanding multiple RSR releases. Proc. SPIE 2012, 8510, 85101S. [Google Scholar]
- Lei, N.; Guenther, B.; Wang, Z.; Xiong, X. Modeling SNPP VIIRS reflective solar bands optical throughput degradation and its impacts on the relative spectral response. Proc. SPIE 2013, 8866, 88661H. [Google Scholar]
- Cao, C.; Xiong, J.; Blonski, S.; Liu, Q.; Uprety, S.; Shao, X.; Bai, Y.; Weng, F. Suomi NPP VIIRS sensor data record verification, validation, and long-term performance monitoring. J. Geophys. Res. Atmos. 2013, 118, 11664–11678. [Google Scholar] [CrossRef]
- Lei, N.; Wang, Z.; Fulbright, J.; Xiong, X. Effect of the SDSM detector relative spectral response in determining the degradation coefficient of the SNPP VIIRS solar diffuser reflectance. Earth Obs. Syst. XVIII 2013, 8866, 88661I. [Google Scholar] [CrossRef]
- Lei, N.; Xiong, X. Suomi NPP VIIRS Solar Diffuser BRDF Degradation Factor at Short-Wave Infrared Band Wavelengths. IEEE Trans. Geosci. Remote Sens. 2016, 54, 6212–6216. [Google Scholar] [CrossRef]
- Sun, J.; Xiong, X.; Waluschka, E.; Wang, M. Suomi National Polar-Orbiting Partnership Visible Infrared Imaging Radiometer Suite polarization sensitivity analysis. Appl. Opt. 2016, 55, 7645–7658. [Google Scholar] [CrossRef]
- Barrie, J.D.; Fuqua, P.D.; Meshishnek, M.J.; Ciofalo, M.R.; Chu, C.T.; Chaney, J.A.; Moision, R.M.; Graziani, L. Root cause determination of on-orbit degradation of the VIIRS rotating telescope assembly. In Earth Observing Systems XVII; SPIE: San Diego, CA, USA, 2012; Volume 8510, p. 85101B. [Google Scholar] [CrossRef] [Green Version]
- Iona, G.; Butler, J.; Guenther, B.; Graziani, L.; Johnson, E.; Kennedy, B.; Kent, C.; Lambeck, R.; Waluschka, E.; Xiong, X. VIIRS on-orbit optical anomaly: Investigation, analysis, root cause determination and lessons learned. Earth Obs. Syst. XVII 2012, 8510, 85101C. [Google Scholar] [CrossRef] [Green Version]
- Lessel, L.; McClain, S. Low Uncertainty Measurements of Bidirectional Reflectance Factor on the NPOESS/VIIRS Solar Diffuser. Proc. SPIE 2007, 6677, 667710. [Google Scholar]
- Twedt, K.; Lei, N.; Xiong, X.J. On-orbit noise characterization of the SNPP VIIRS reflective solar bands. Earth Obs. Syst. XXII 2017, 10402, 104021X. [Google Scholar] [CrossRef]
- Lei, N.; Twedt, K.; McIntire, J.; Xiong, X. SNPP VIIRS RSB earth view reflectance uncertainty. In Proceedings of the 2017 IEEE International Geoscience and Remote Sensing Symposium (IGARSS), Fort Worth, TX, USA, 23–28 July 2017; pp. 5916–5919. [Google Scholar] [CrossRef] [Green Version]
- Wu, A.; Xiong, X.; Cao, C.; Chiang, K.-F. Assessment of SNPP VIIRS VIS/NIR Radiometric Calibration Stability Using Aqua MODIS and Invariant Surface Targets. IEEE Trans. Geosci. Remote Sens. 2016, 54, 2918–2924. [Google Scholar] [CrossRef]
- Mu, Q.; Xiong, X.; Chang, T.; Wu, A. Exploring the stability and residual response versus scan angle effects in SNPP VIIRS sensor data record reflectance products using deep convective clouds. J. Appl. Remote Sens. 2018, 12, 034006. [Google Scholar] [CrossRef]
Figure 1.
A schematic diagram of the VIIRS instrument.

Figure 2.
Schematic of the VIIRS SD assembly, including the SDSM, SD, and SD view and Sun view screens.
Figure 2.
Schematic of the VIIRS SD assembly, including the SDSM, SD, and SD view and Sun view screens.

Figure 3.
SDSM SD, SDSM Sun, and band RSB SD view profiles during an SDSM and SD calibration event on November 5, 2014: (a) SDSM D1 SD and Sun view profiles; (b) band M1 D1 SD view profile. The two vertical lines in (a,b) define the “sweet spot” for the SDSM calibration and the SD calibration, respectively.

Figure 4.
A lunar image observed by band I1 in one scan which sees a full lunar disk (23 February 2021).
Figure 4.
A lunar image observed by band I1 in one scan which sees a full lunar disk (23 February 2021).

Figure 5.
SNPP VIIRS C1 band M1 image at the Libya 4 site on 10 January 2021.

Figure 6.
SNPP VIIRS band M1 HAM side 1 detector difference observed at Libya 4.

Figure 7.
SNPP VIIRS H-factors after SDSM RSR corrections. The solid lines denote the measured H-factor, and the dashed curves denote the HSDSM(λ).
Figure 7.
SNPP VIIRS H-factors after SDSM RSR corrections. The solid lines denote the measured H-factor, and the dashed curves denote the HSDSM(λ).

Figure 8.
H-factors for SWIR bands (results from modeling). The H-factors are exactly the same for I3 and M10 due to same center wavelengths of the two bands.
Figure 8.
H-factors for SWIR bands (results from modeling). The H-factors are exactly the same for I3 and M10 due to same center wavelengths of the two bands.

Figure 9.
Time-dependent RSR of SNPP VIIRS band M1.

Figure 10.
Band M1 SD F-factors (high-gain) for each individual detector with an odd detector number.
Figure 10.
Band M1 SD F-factors (high-gain) for each individual detector with an odd detector number.

Figure 11.
Band-averaged F-factors with high-gain HAM side 1 normalized at the first measurement on 8 November 2011: (a) VNIR bands; (b) SWIR bands.
Figure 11.
Band-averaged F-factors with high-gain HAM side 1 normalized at the first measurement on 8 November 2011: (a) VNIR bands; (b) SWIR bands.

Figure 12.
SNPP VIIRS RSB calibration coefficients and HAM side ratios.

Figure 13.
Ratios of band-averaged high-gain and low-gain F-factors for dual-gain bands.

Figure 14.
SNPP VIIRS lunar F-factors and lunar and SD F-factor ratios: (a) Visible bands: Symbol, lunar F-factors; solid lines, SD F-factors (H_sdsm); (b) NIR bands: Symbol, lunar F-factors; solid lines, SD F-factors (Hsdsm); (c) SWIR bands: Symbol, lunar F-factors; solid lines, SD F-factors (Hsdsm); (d) VNIR bands lunar and SD F-factor ratios. Symbols are measured values. The function used to fit these lunar/SD ratios is described in Section 2.5.

Figure 15.
SNPP VIIRS H-factors for VNIR bands: solid lines for RTA view and dotted lines for SDSM view.
Figure 15.
SNPP VIIRS H-factors for VNIR bands: solid lines for RTA view and dotted lines for SDSM view.

Figure 16.
Detector-averaged F-factors of the SNPP VIIRS VNIR bands with high-gain HAM side 1: Symbols, lunar F-factors; lines, corrected SD F-factors; (a) VIS bands; (b) NIR bands.
Figure 16.
Detector-averaged F-factors of the SNPP VIIRS VNIR bands with high-gain HAM side 1: Symbols, lunar F-factors; lines, corrected SD F-factors; (a) VIS bands; (b) NIR bands.

Figure 17.
L1B C2 band M1; recent EV image on 10 January 2021.

Figure 18.
Detector-averaged SNR at typical radiance divided by the SNR specification (Table 1) for the SNPP VIIRS RSBs: (a) VIS bands; (b) NIR bands; (c) SWIR bands. Solid lines, high-gain or single-gain; dashed lines, low-gain. The SNR/spec. value for band I3 is in the range 21 to 25, well above the scale of the chart.

Figure 19.
Calibration uncertainties of SNPP VIIRS RSBs: (a) VNIR bands; (b) SWIR bands.


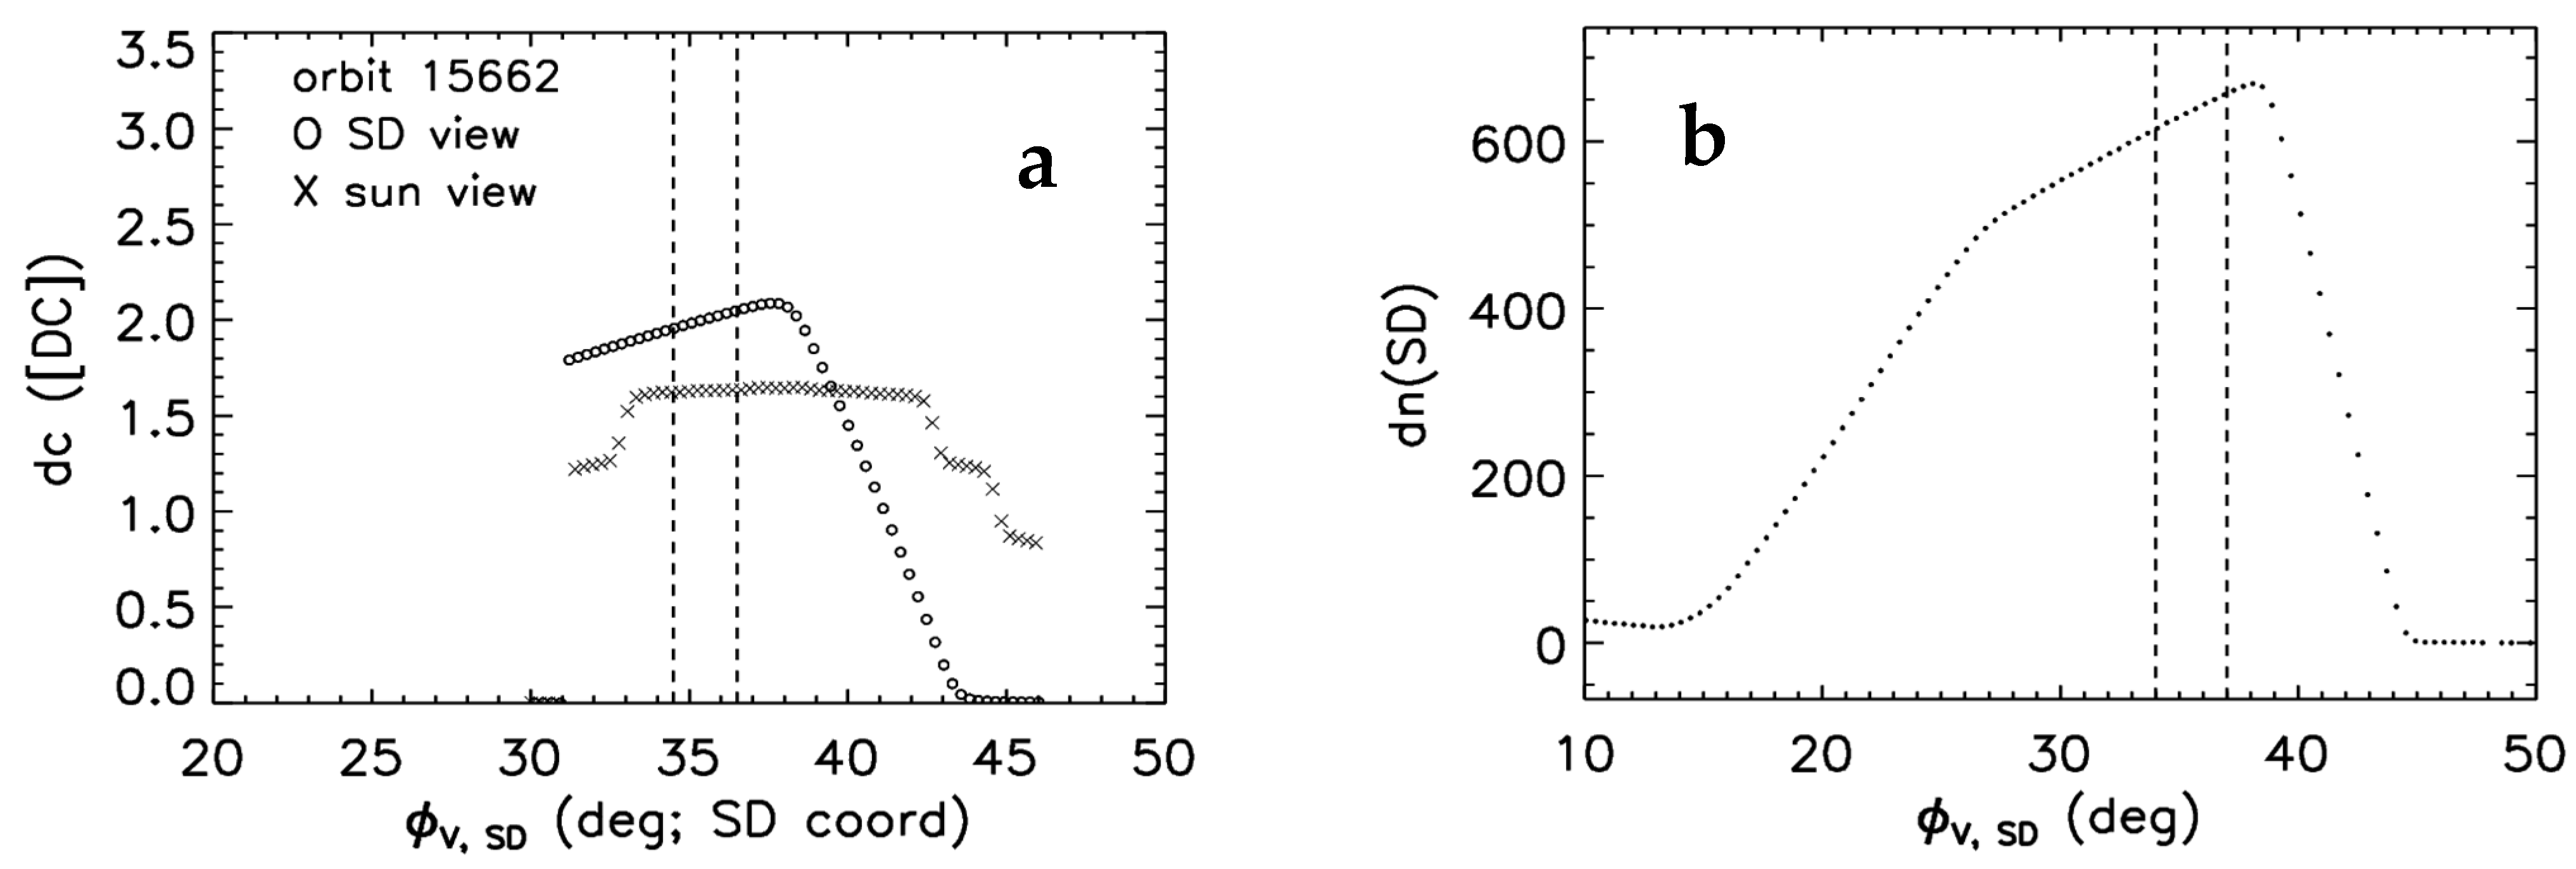
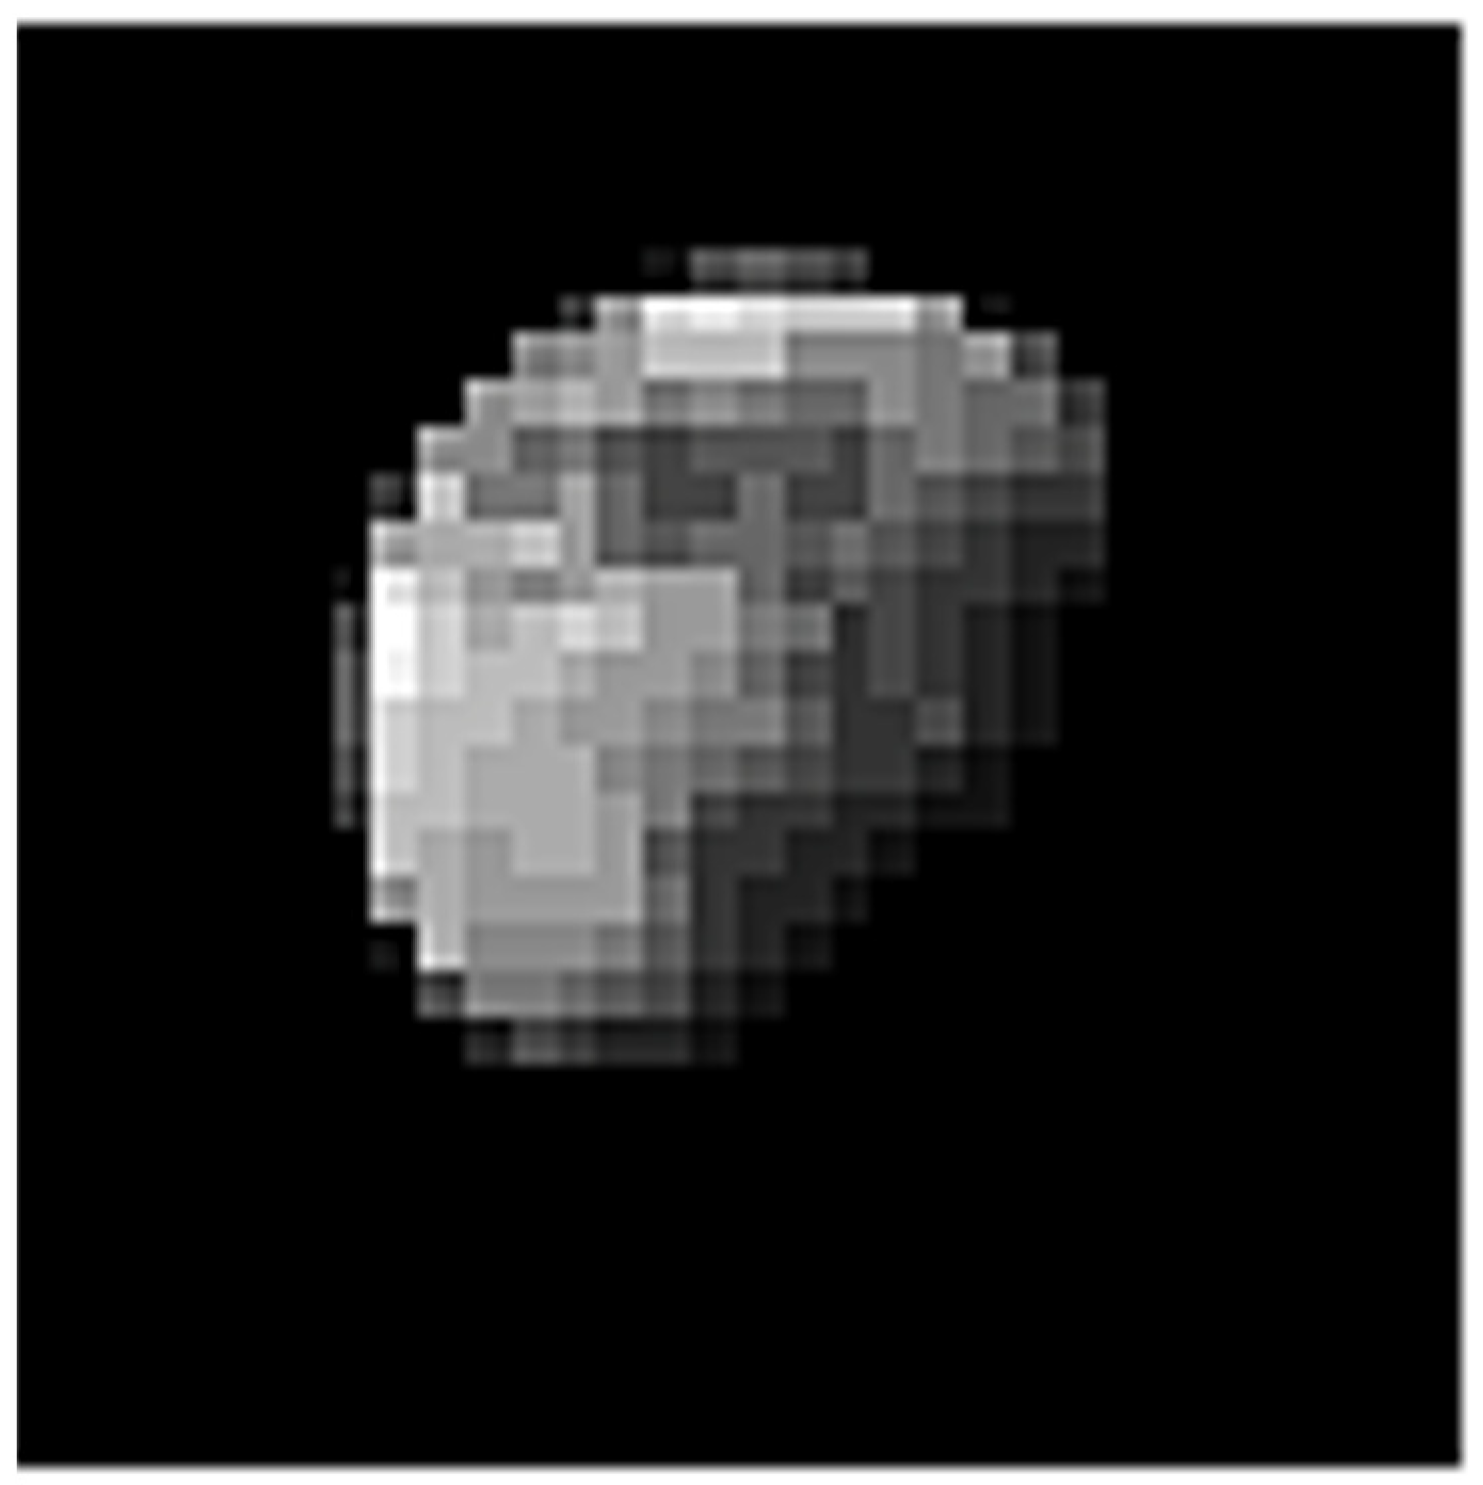
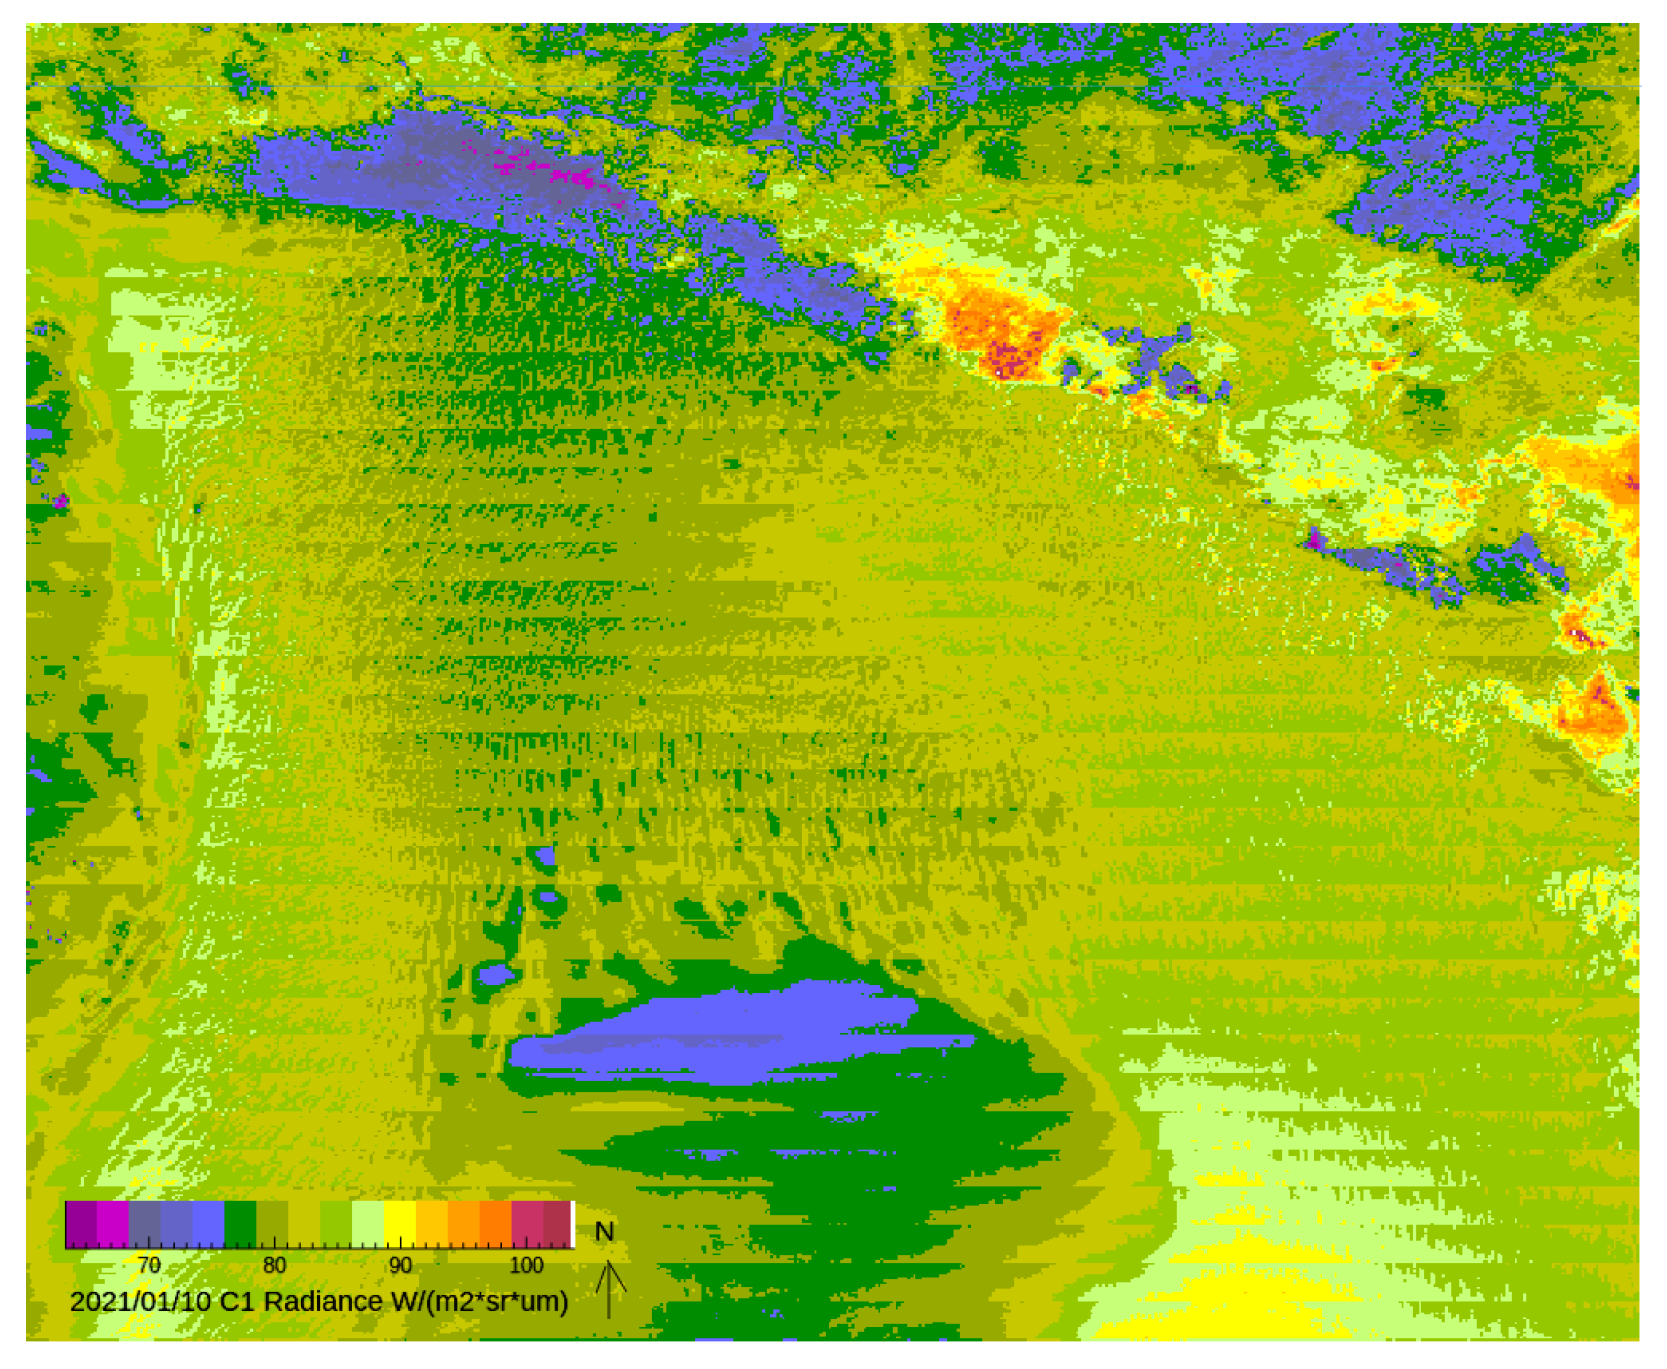
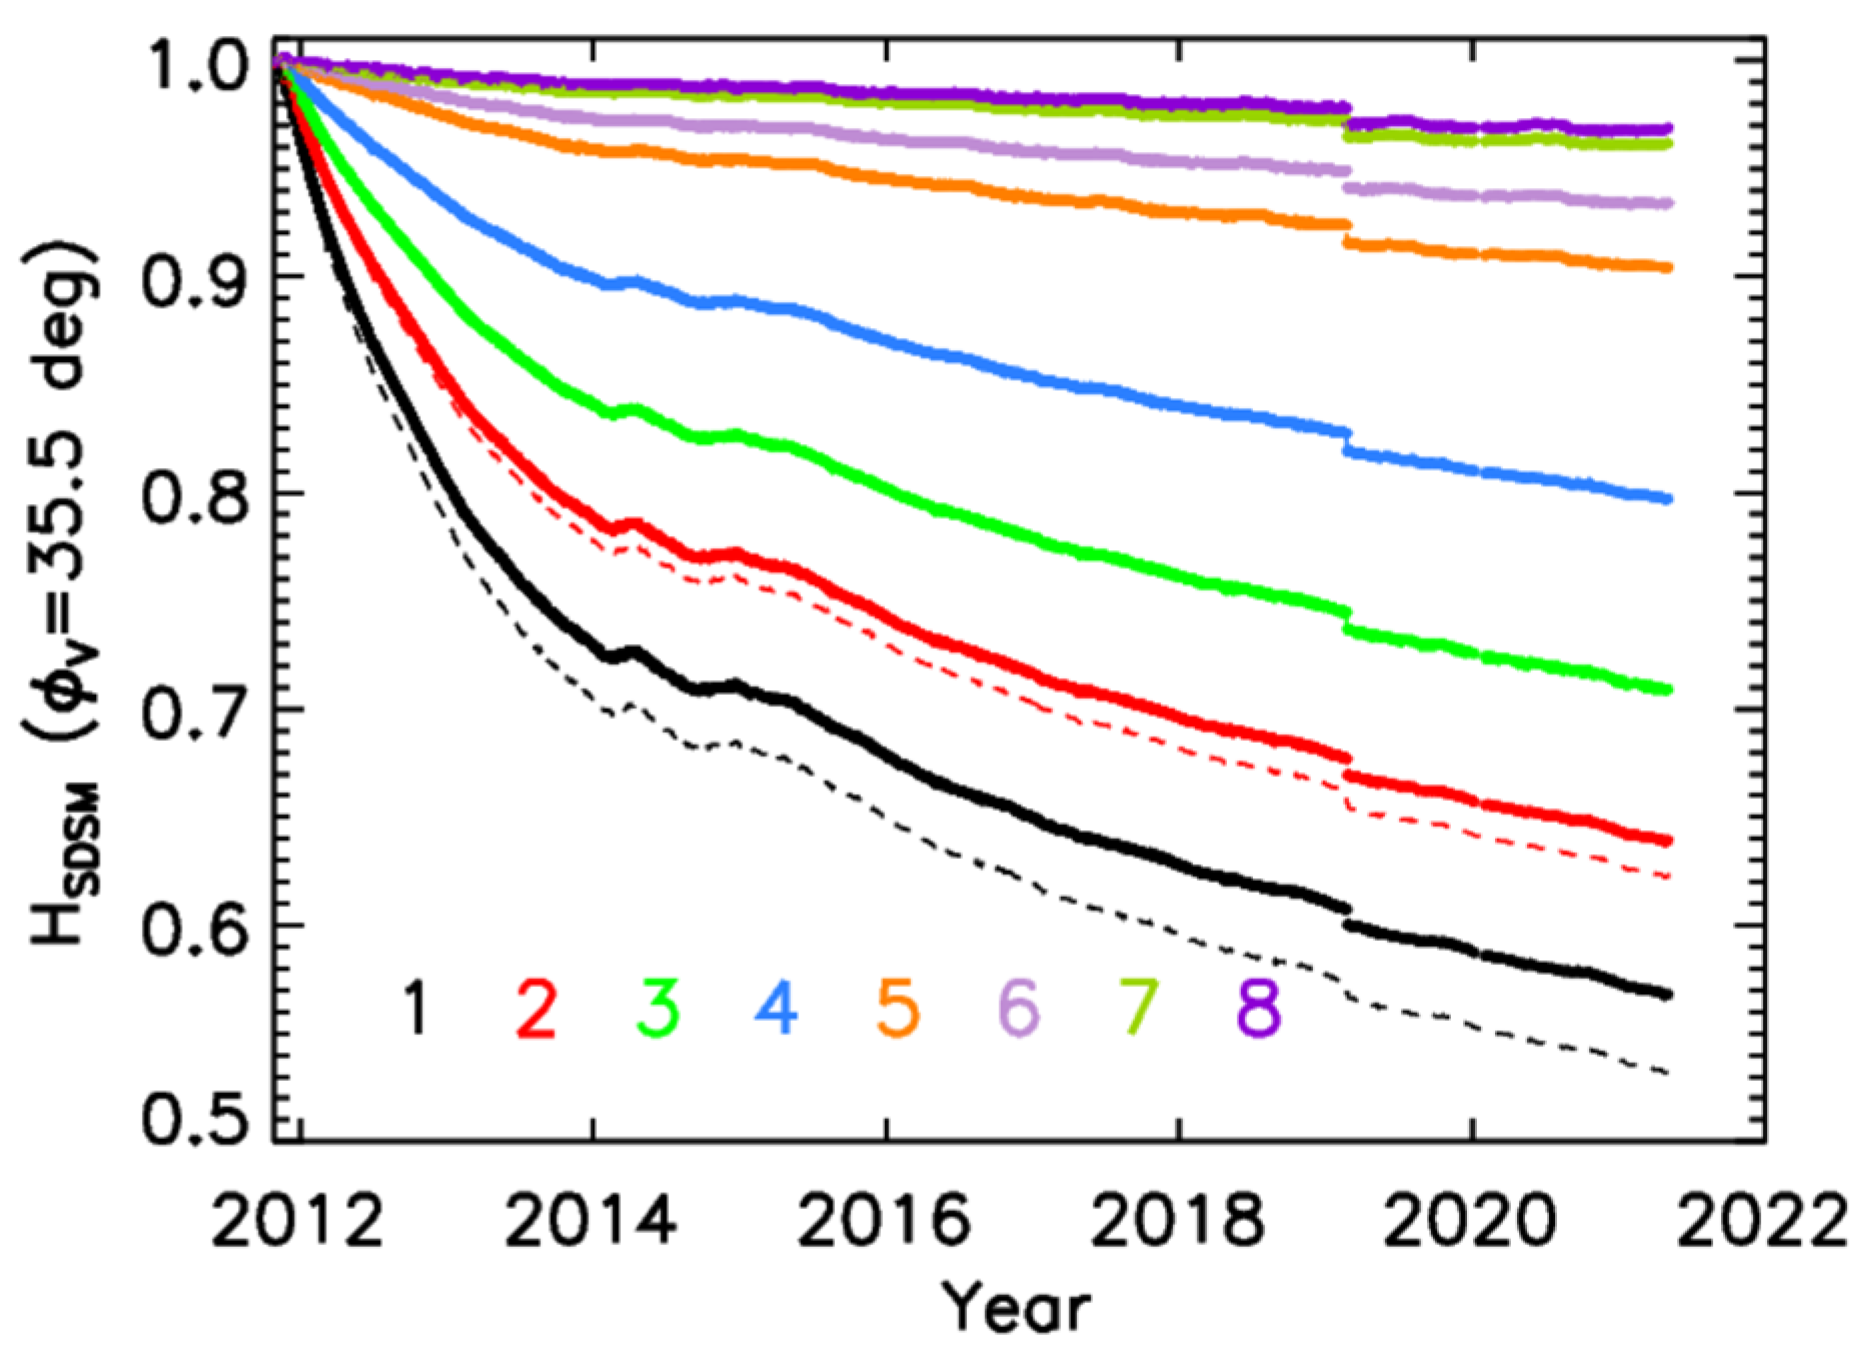
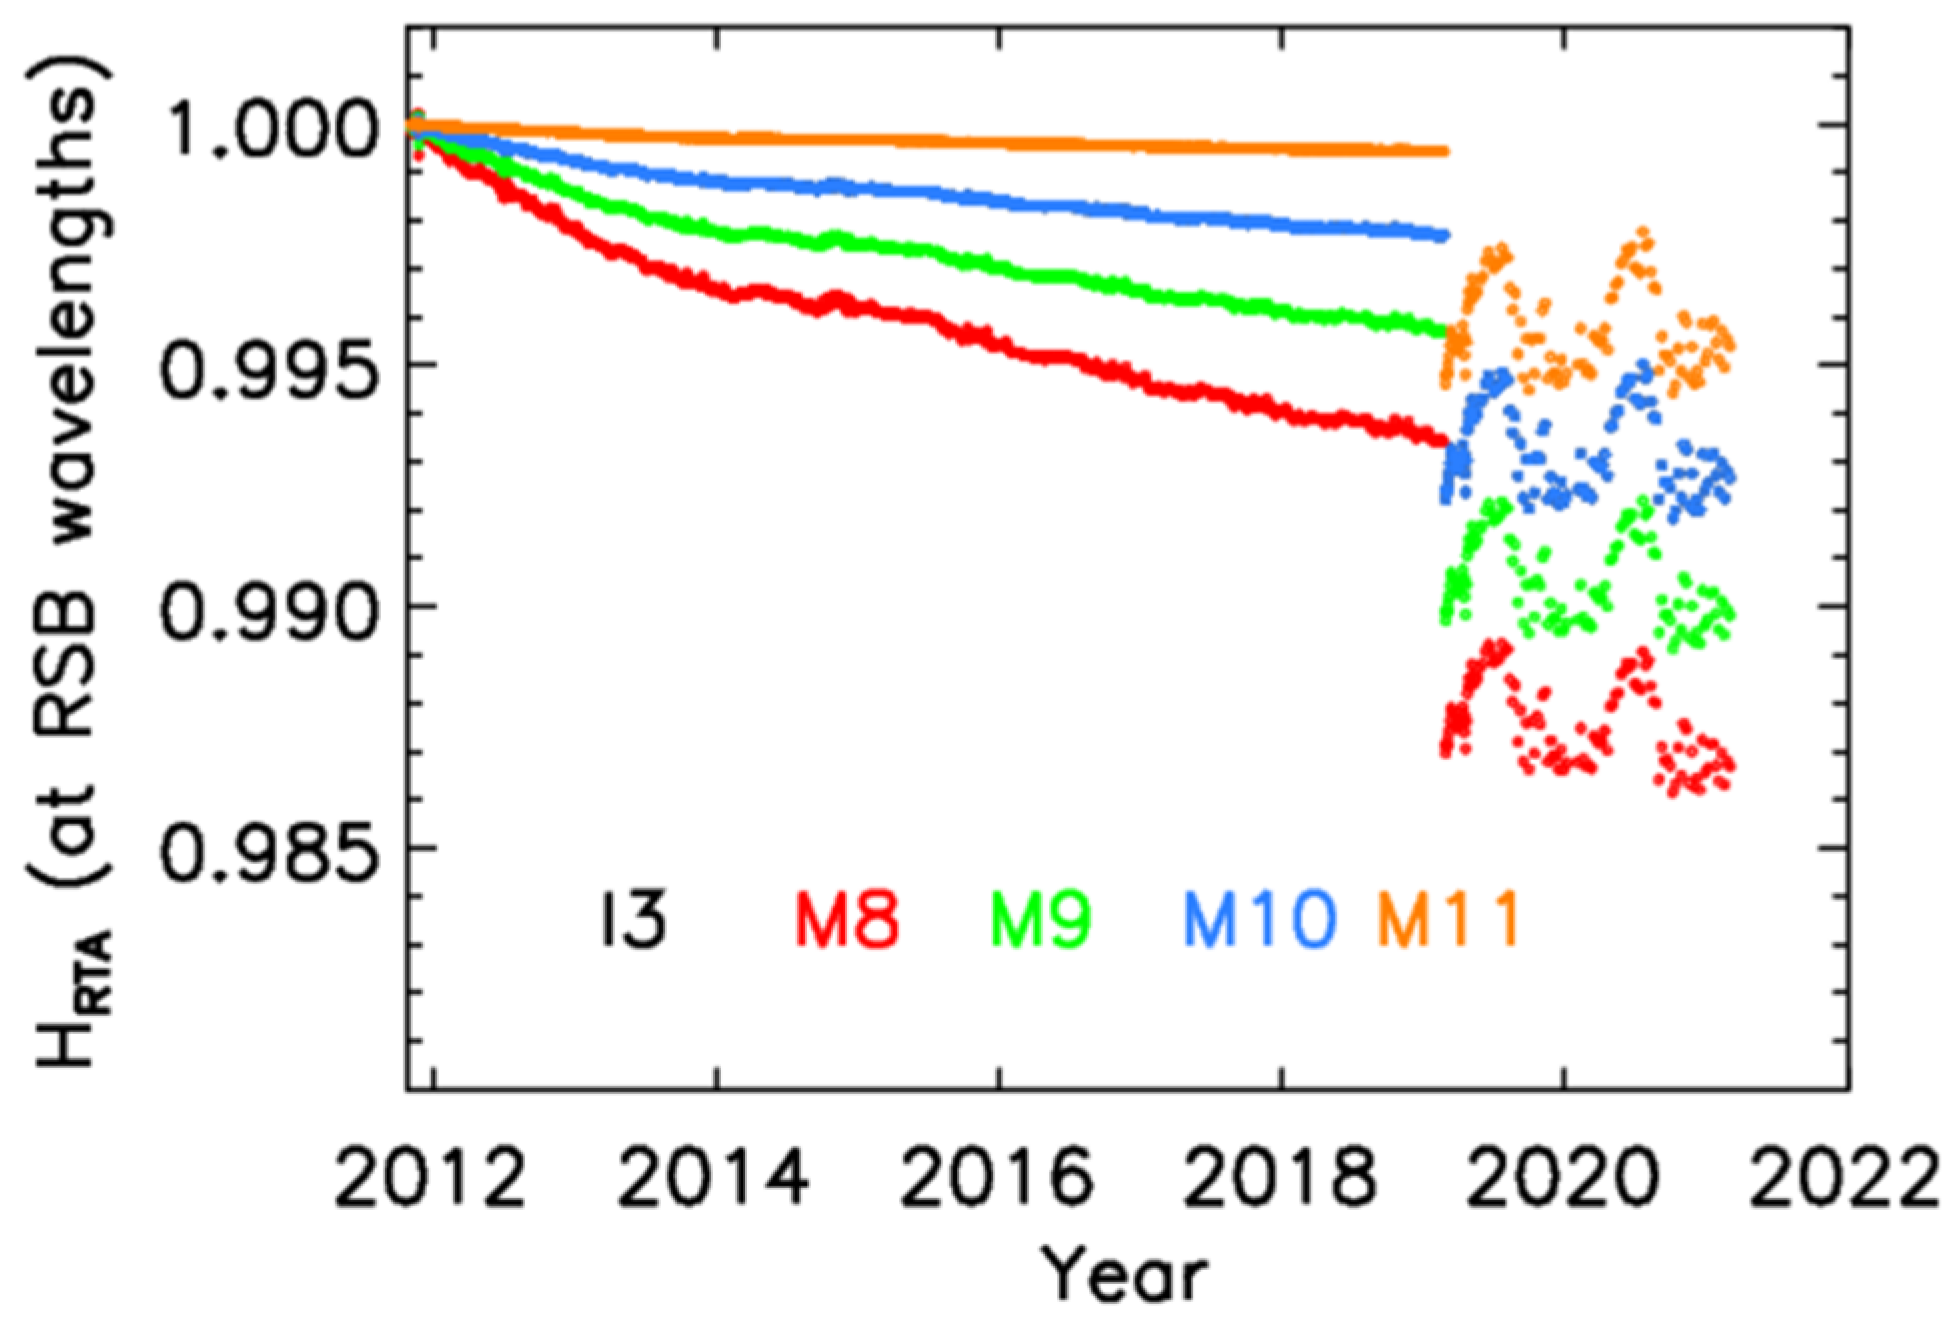
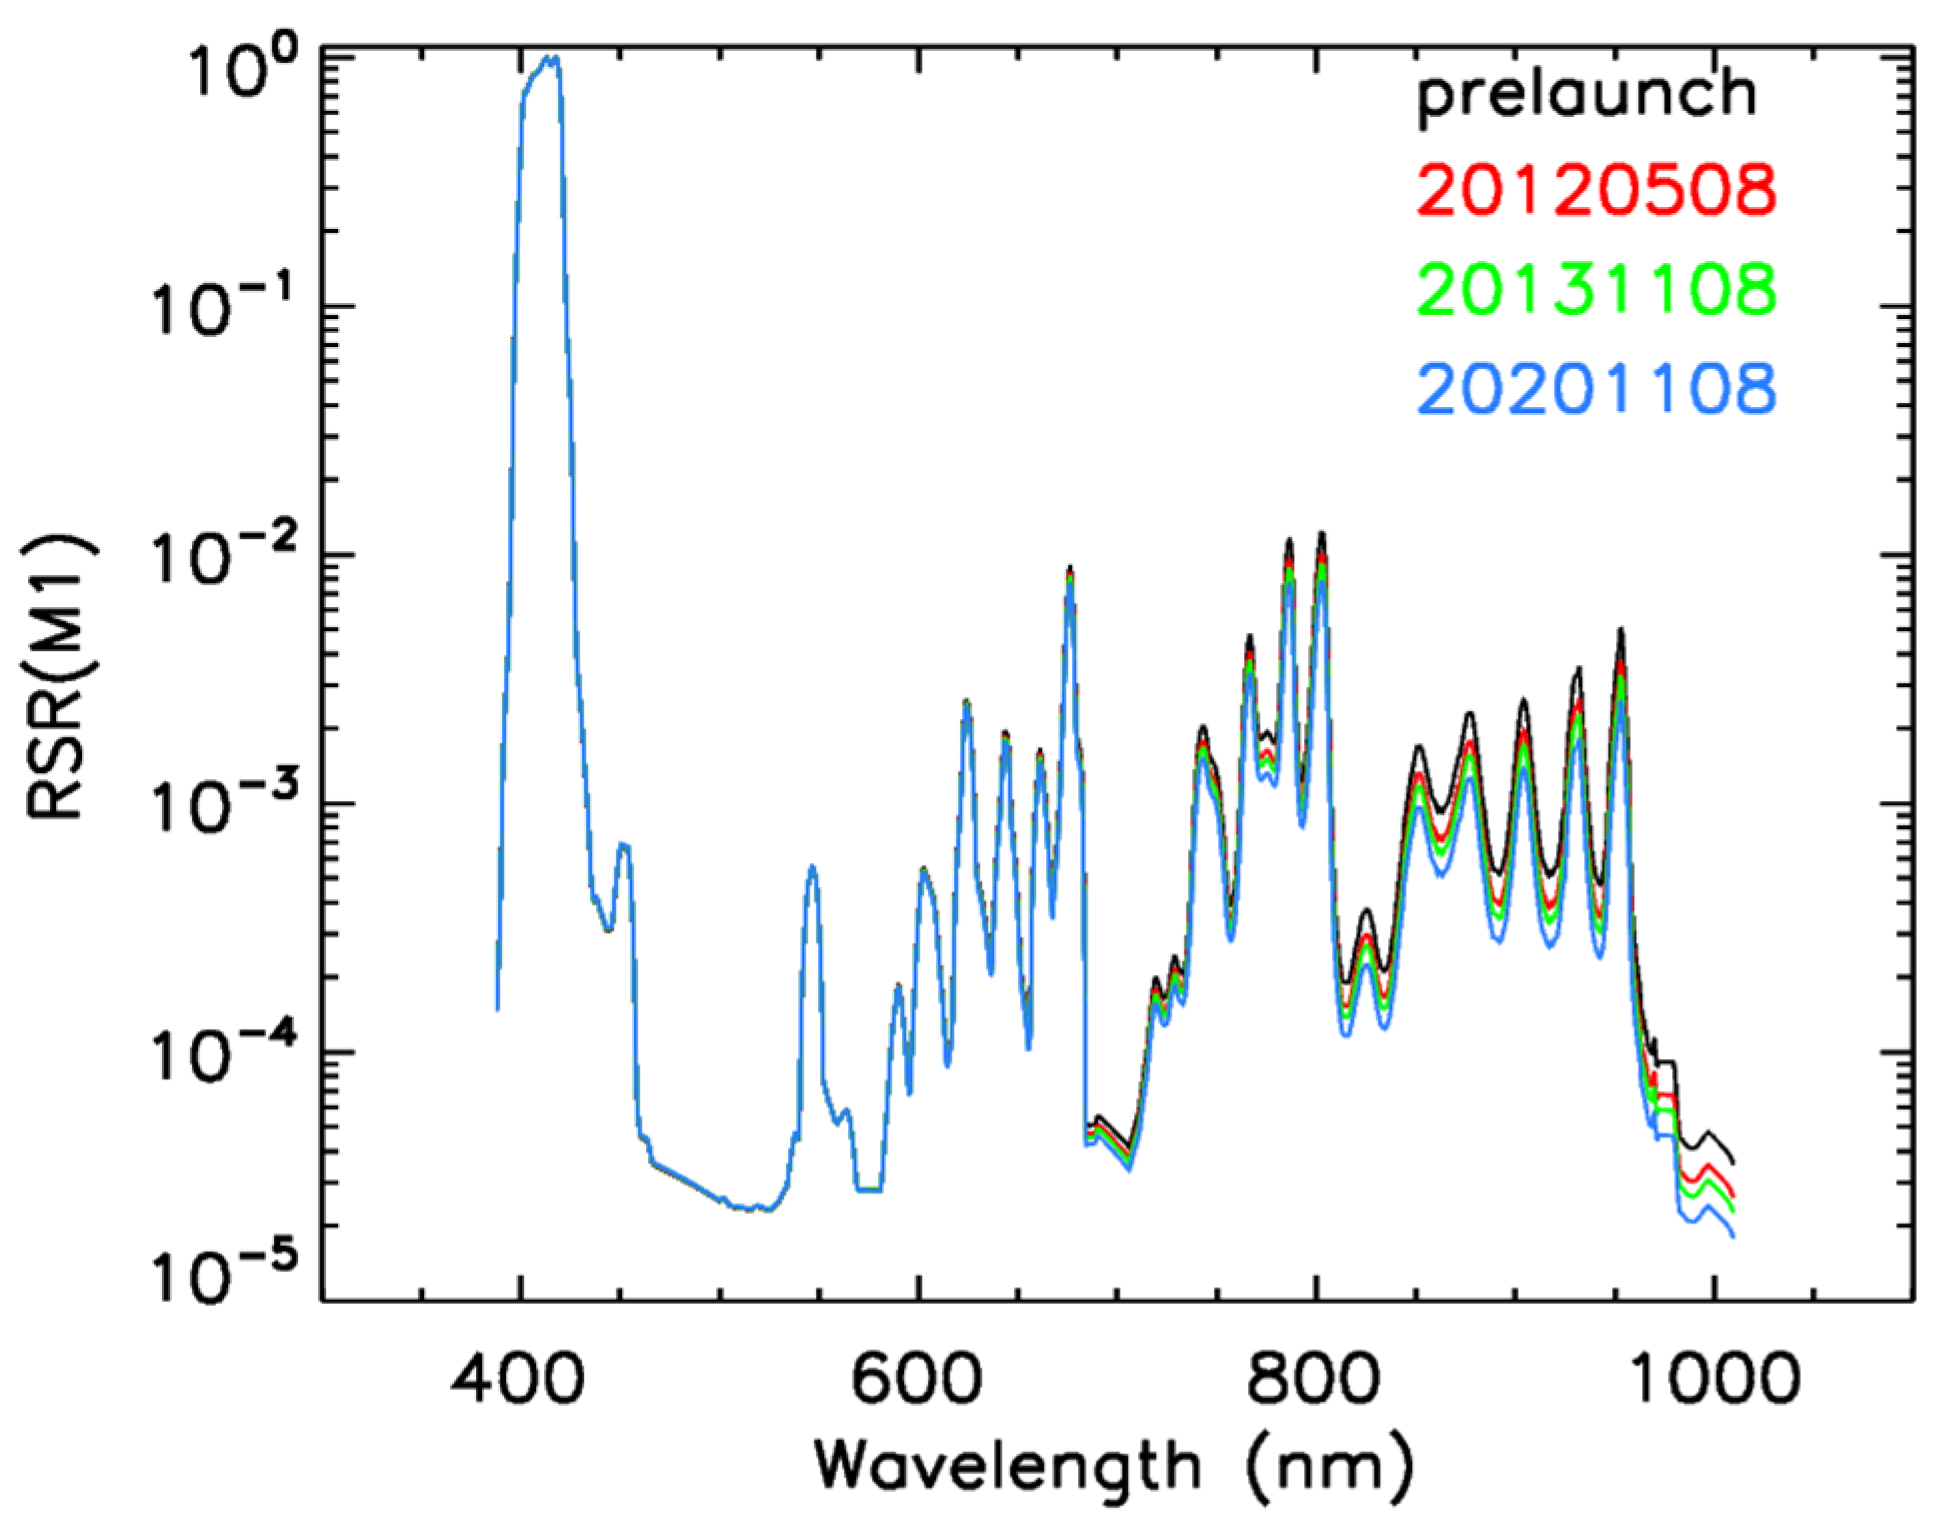
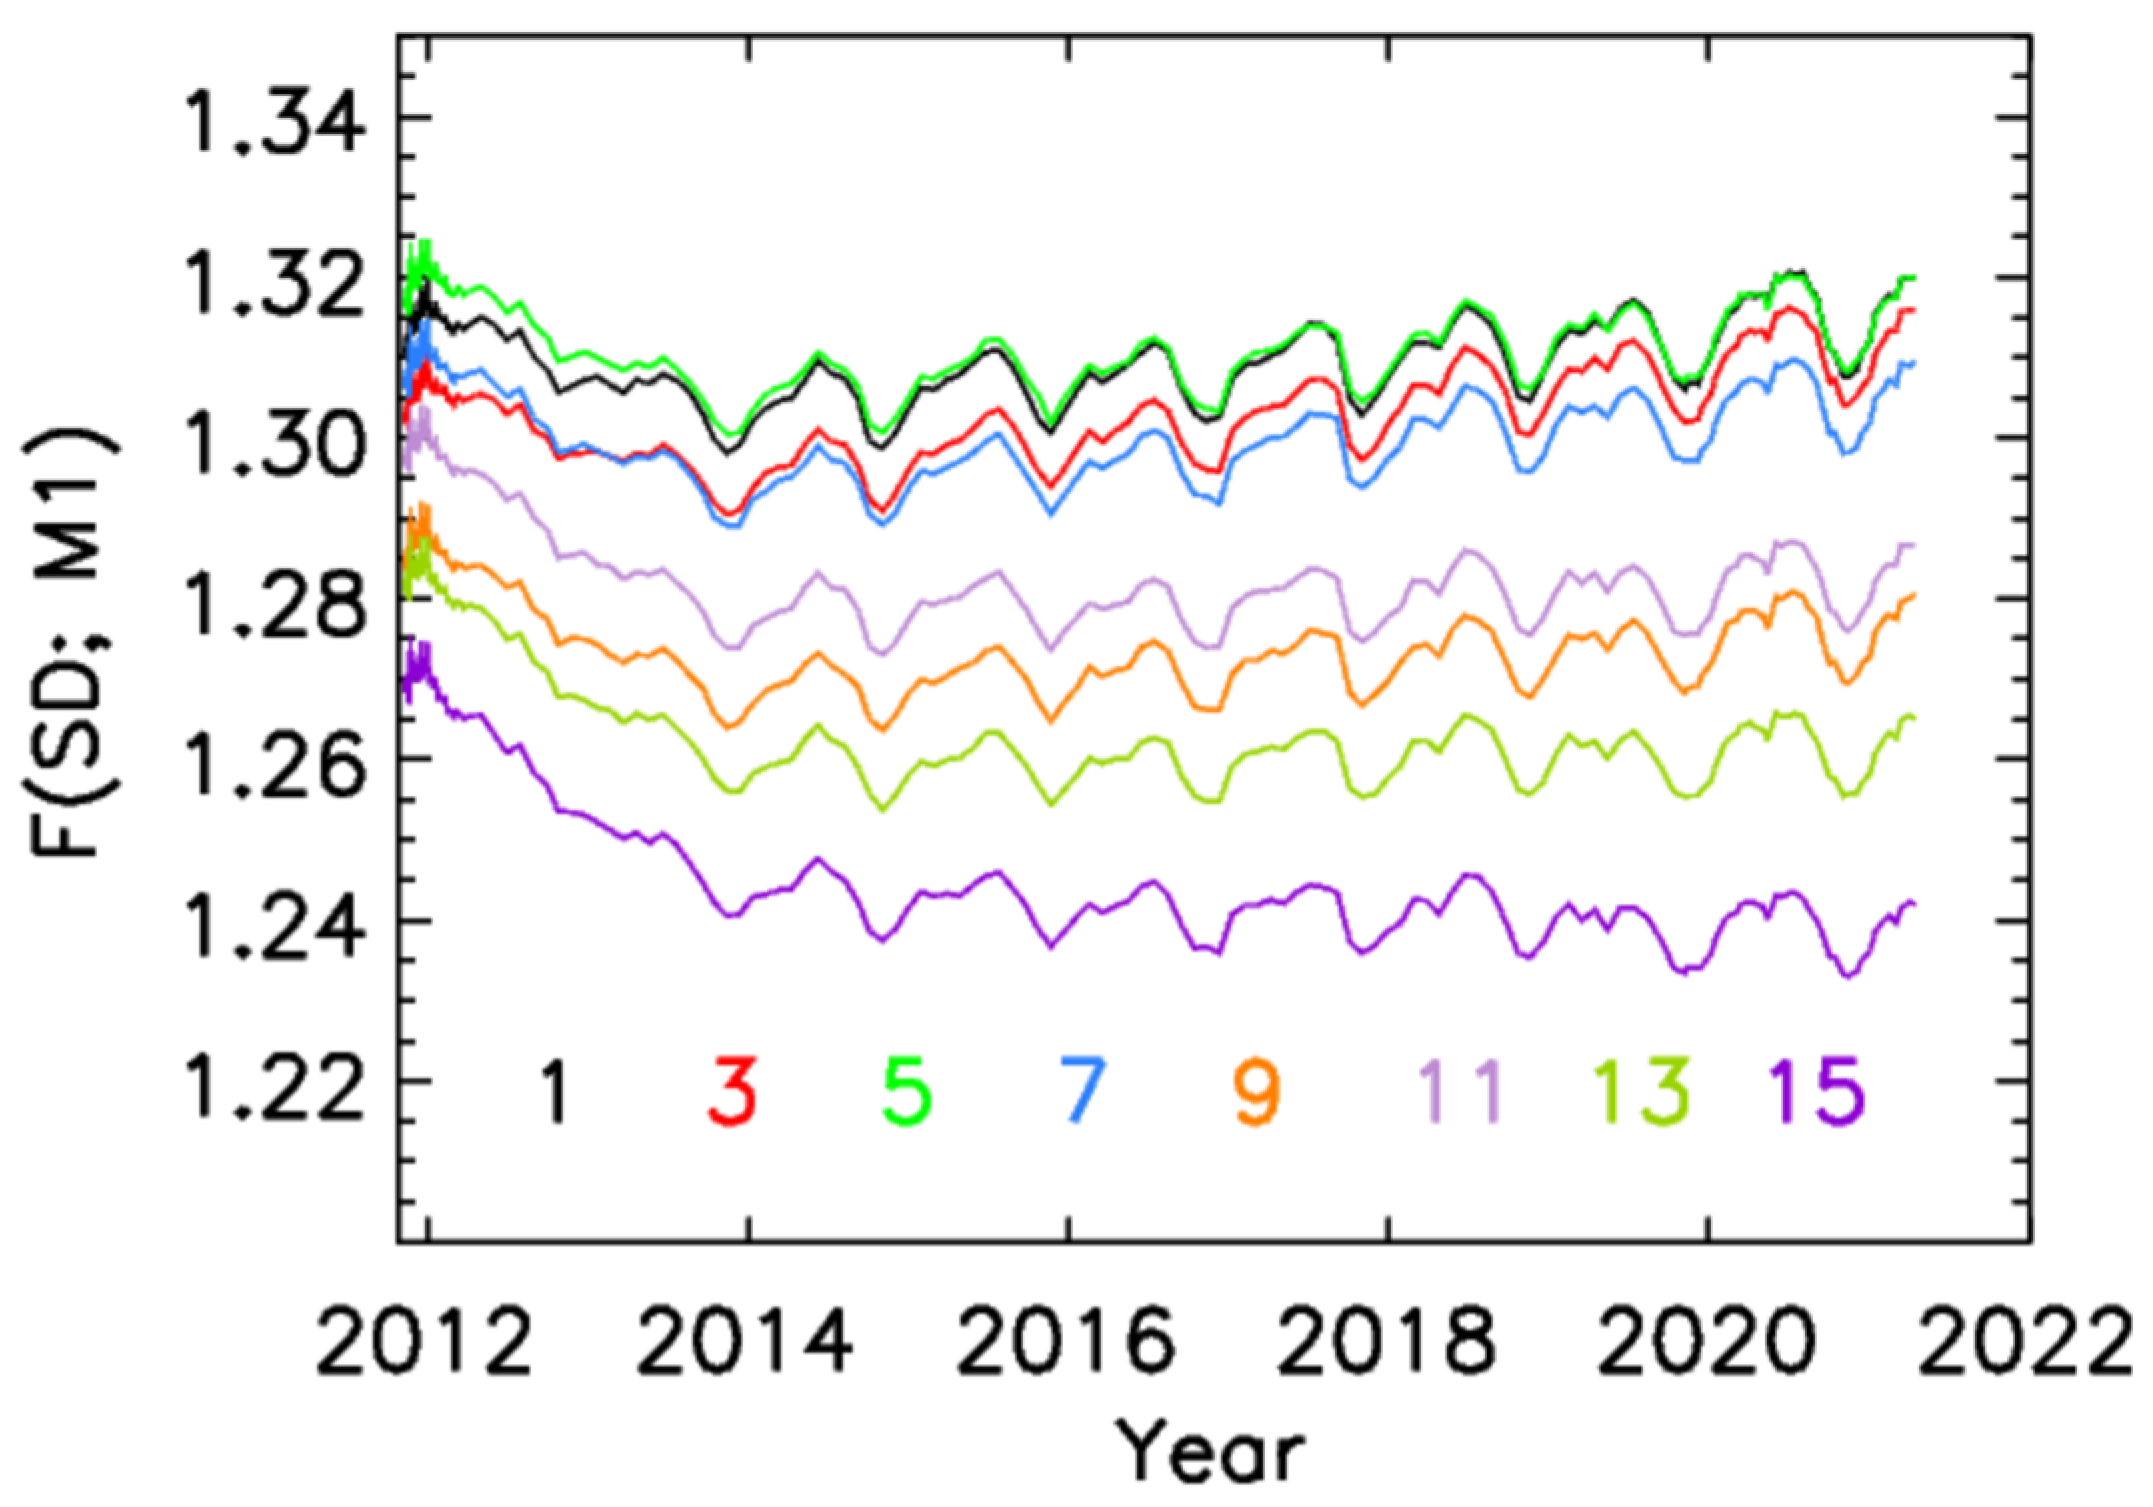
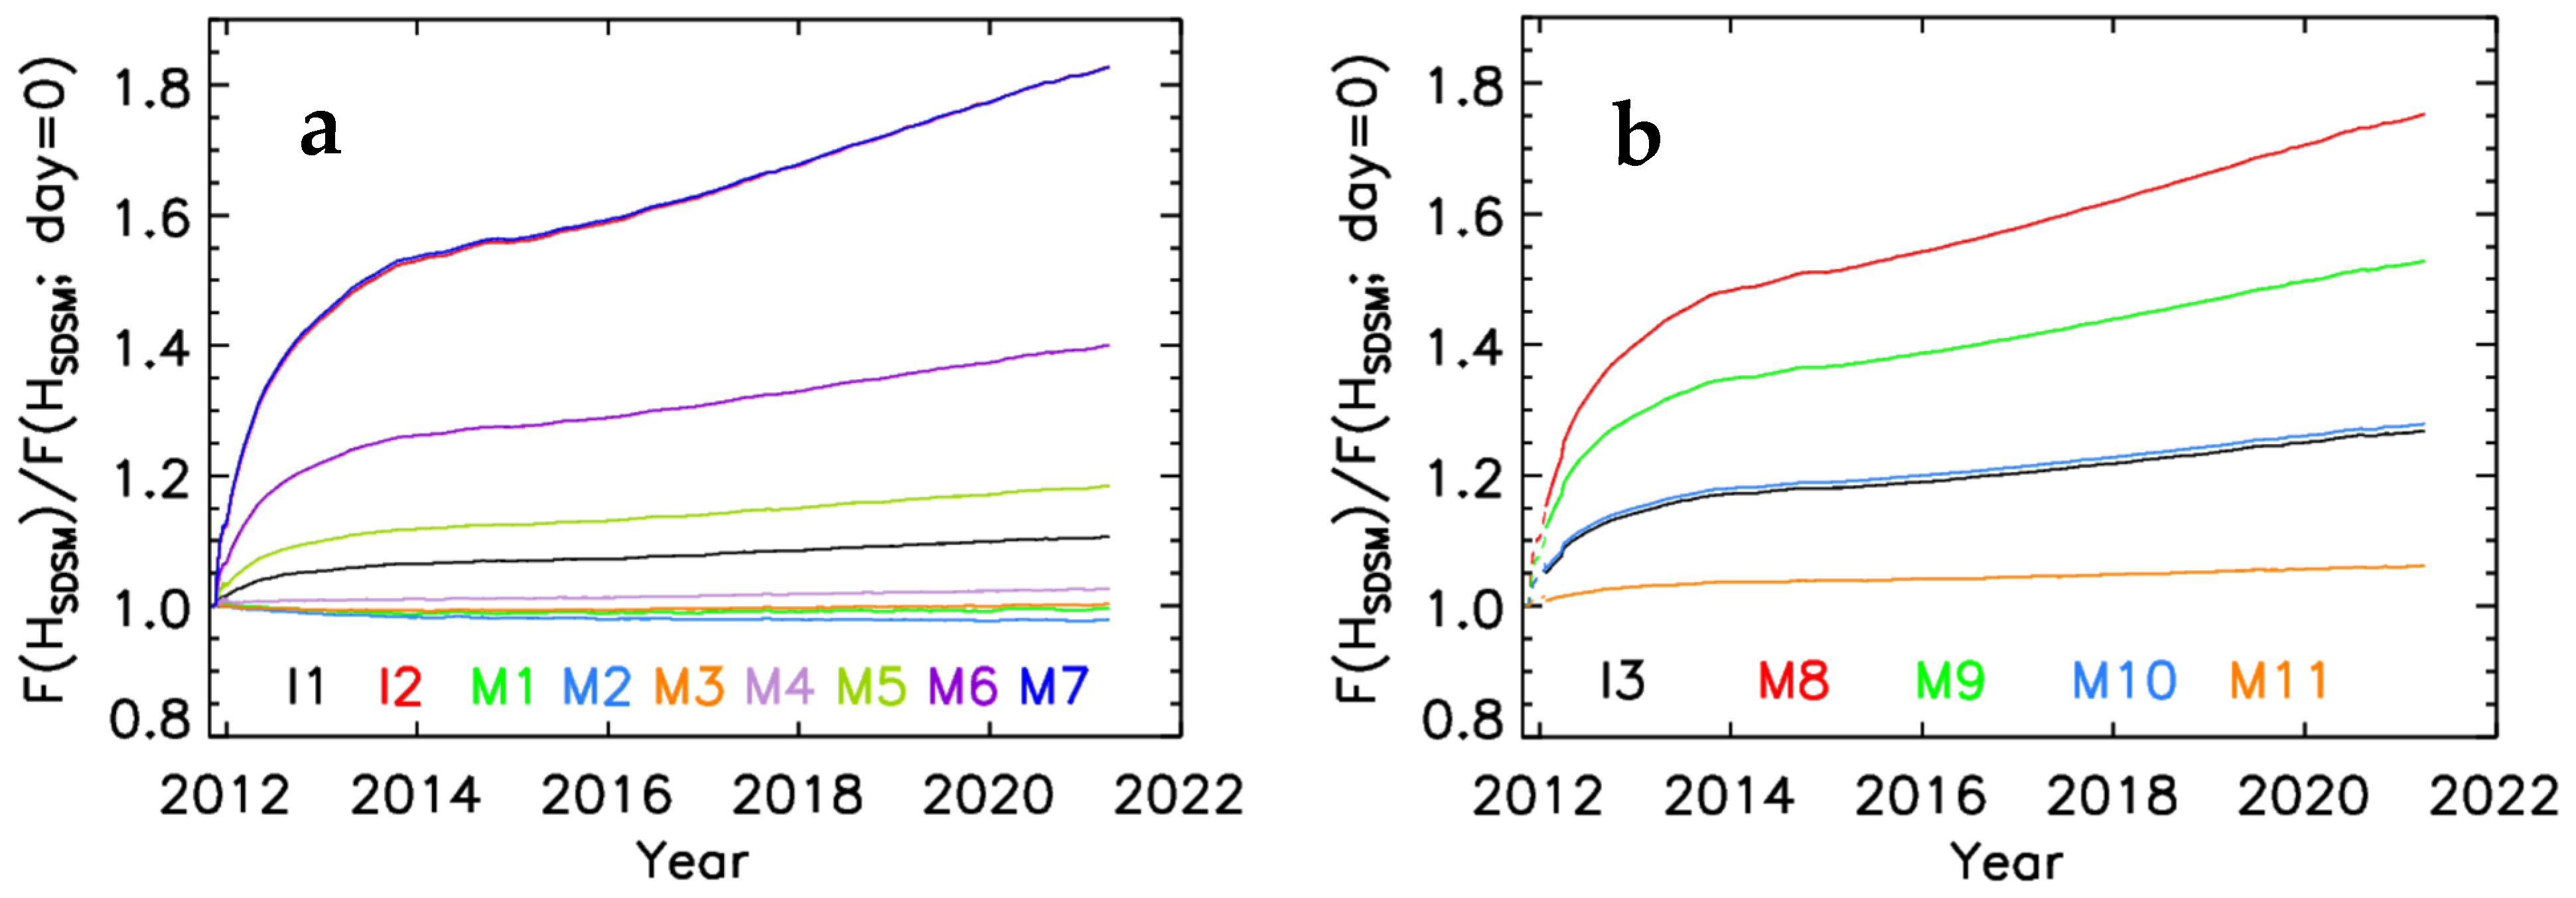
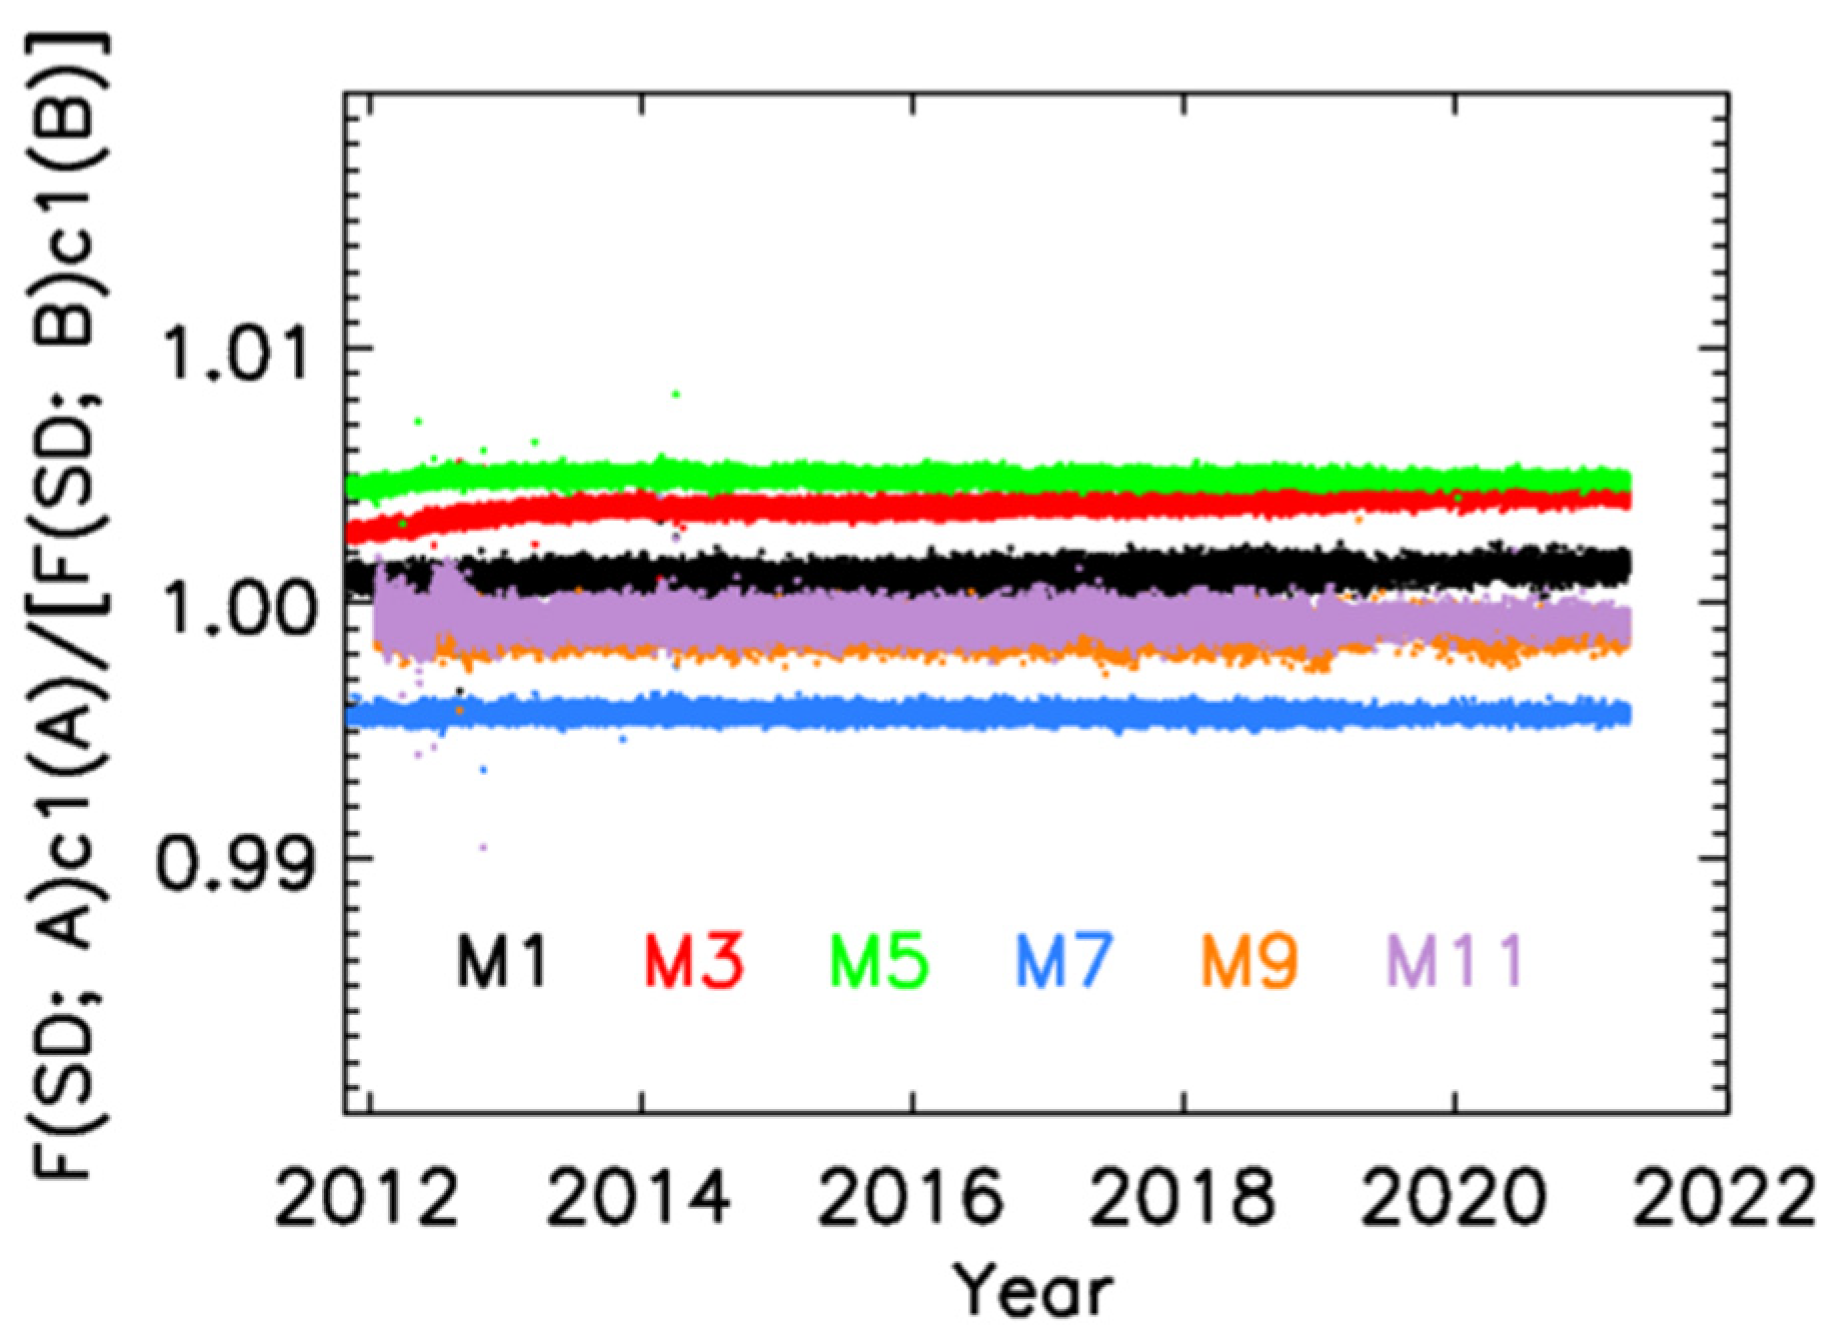
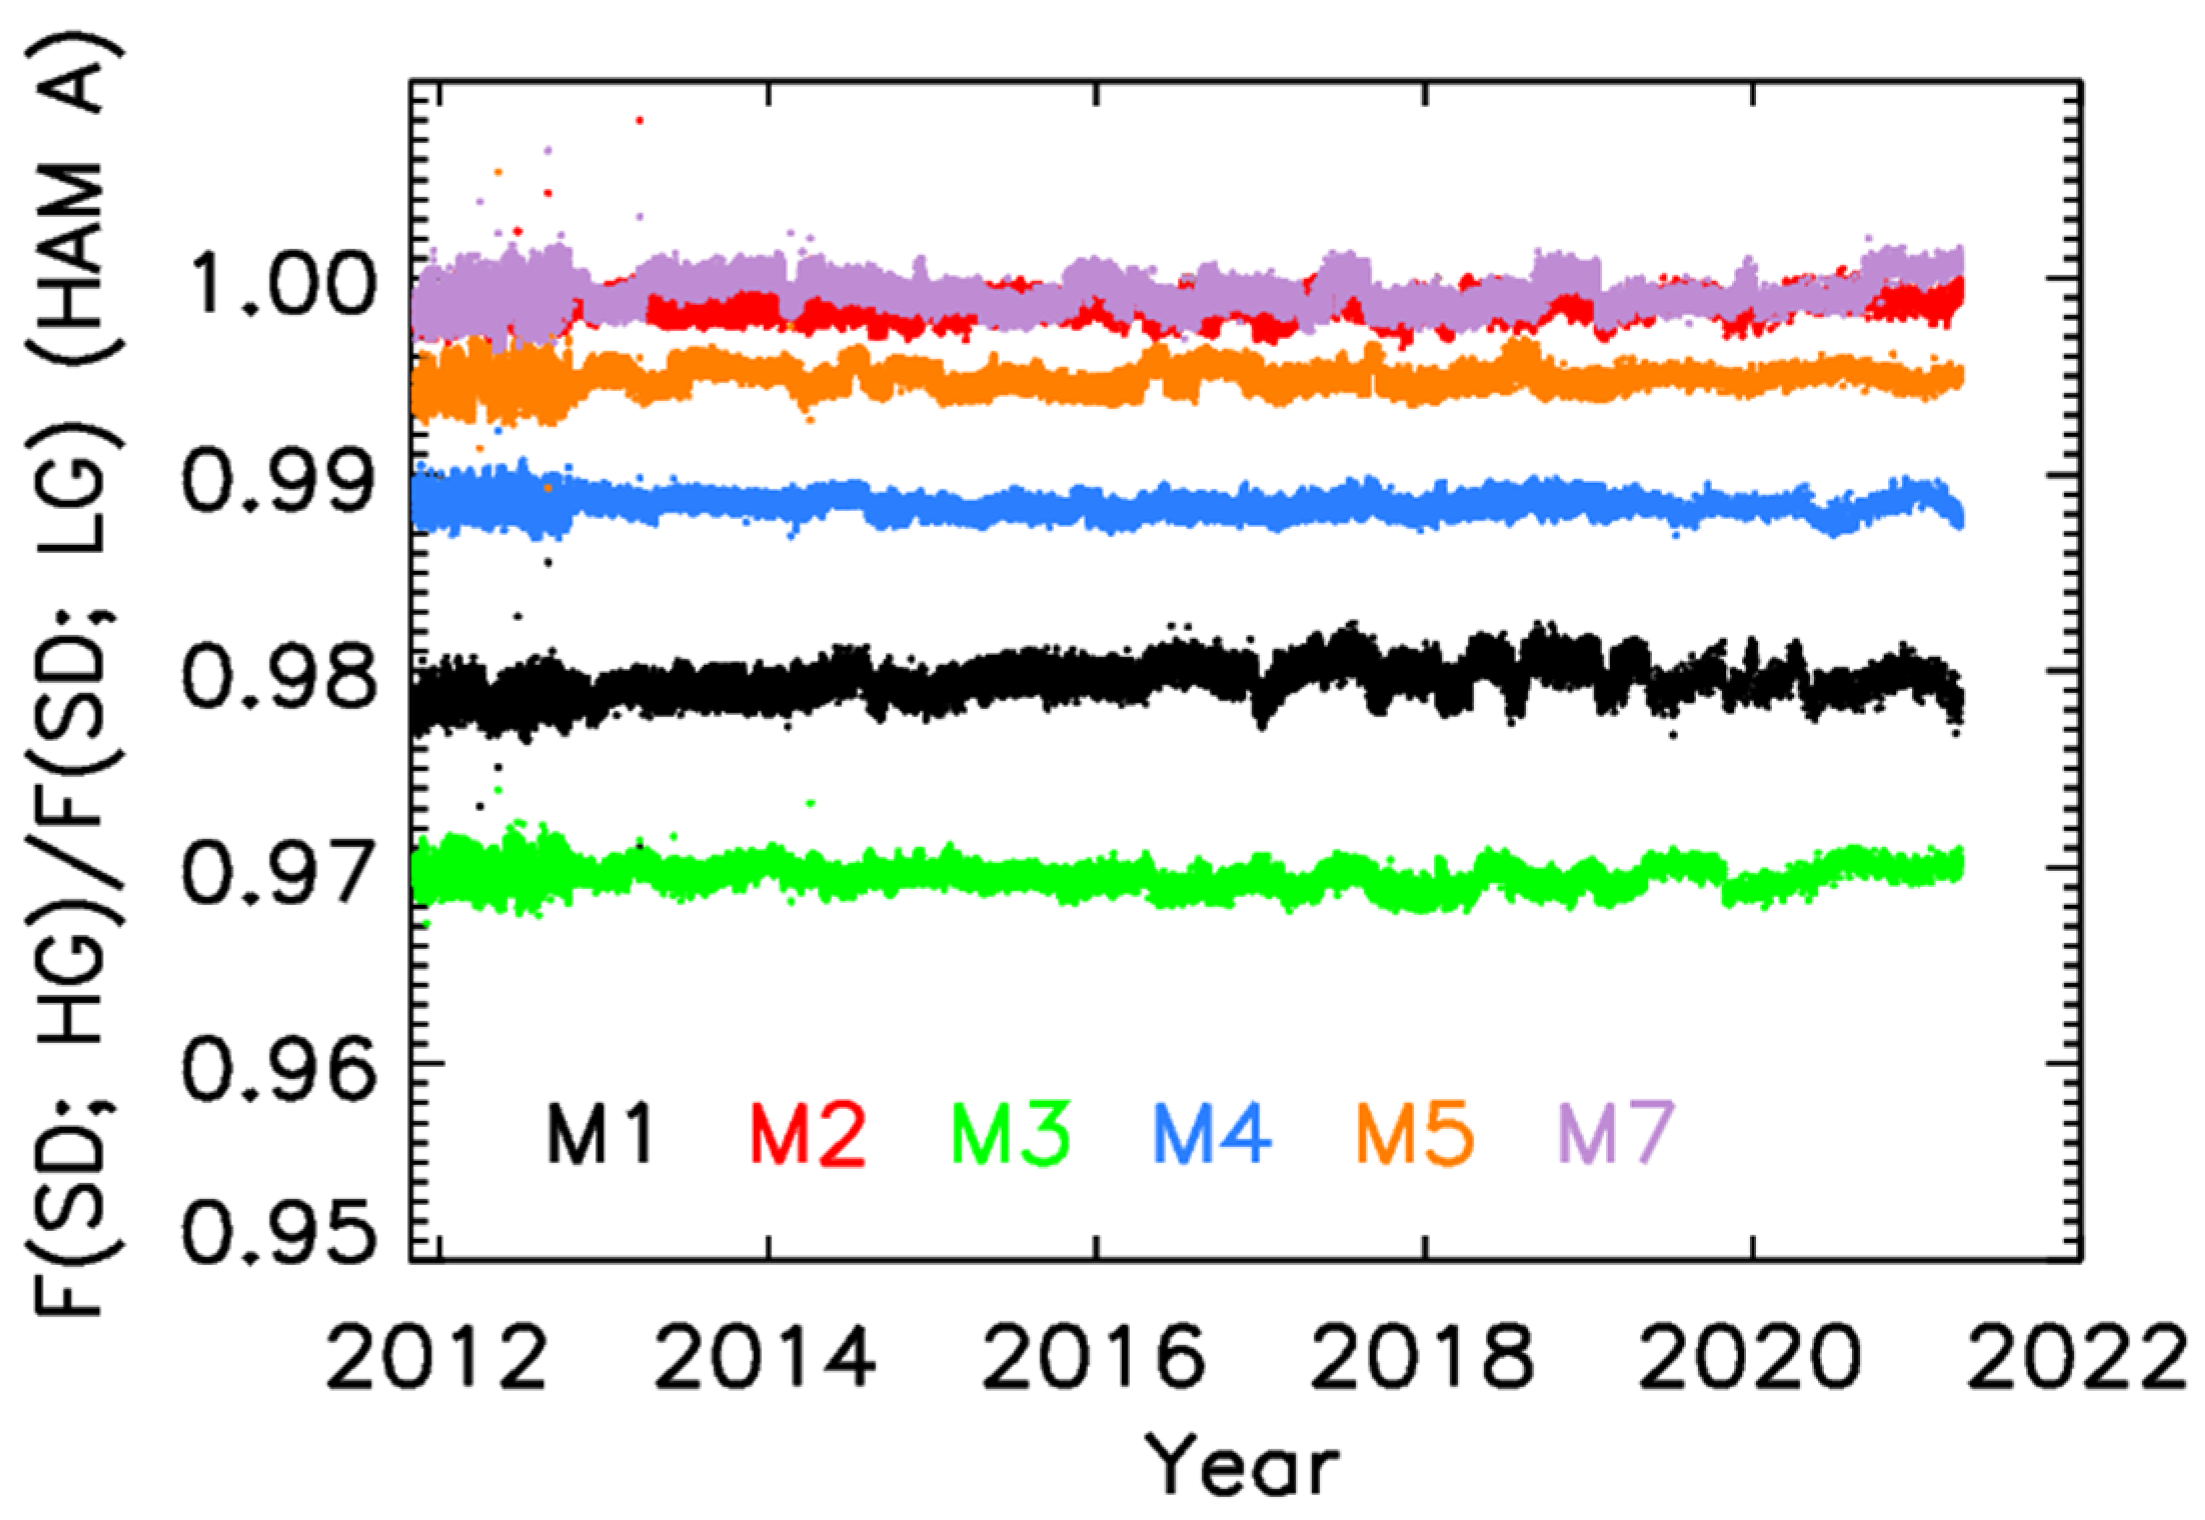
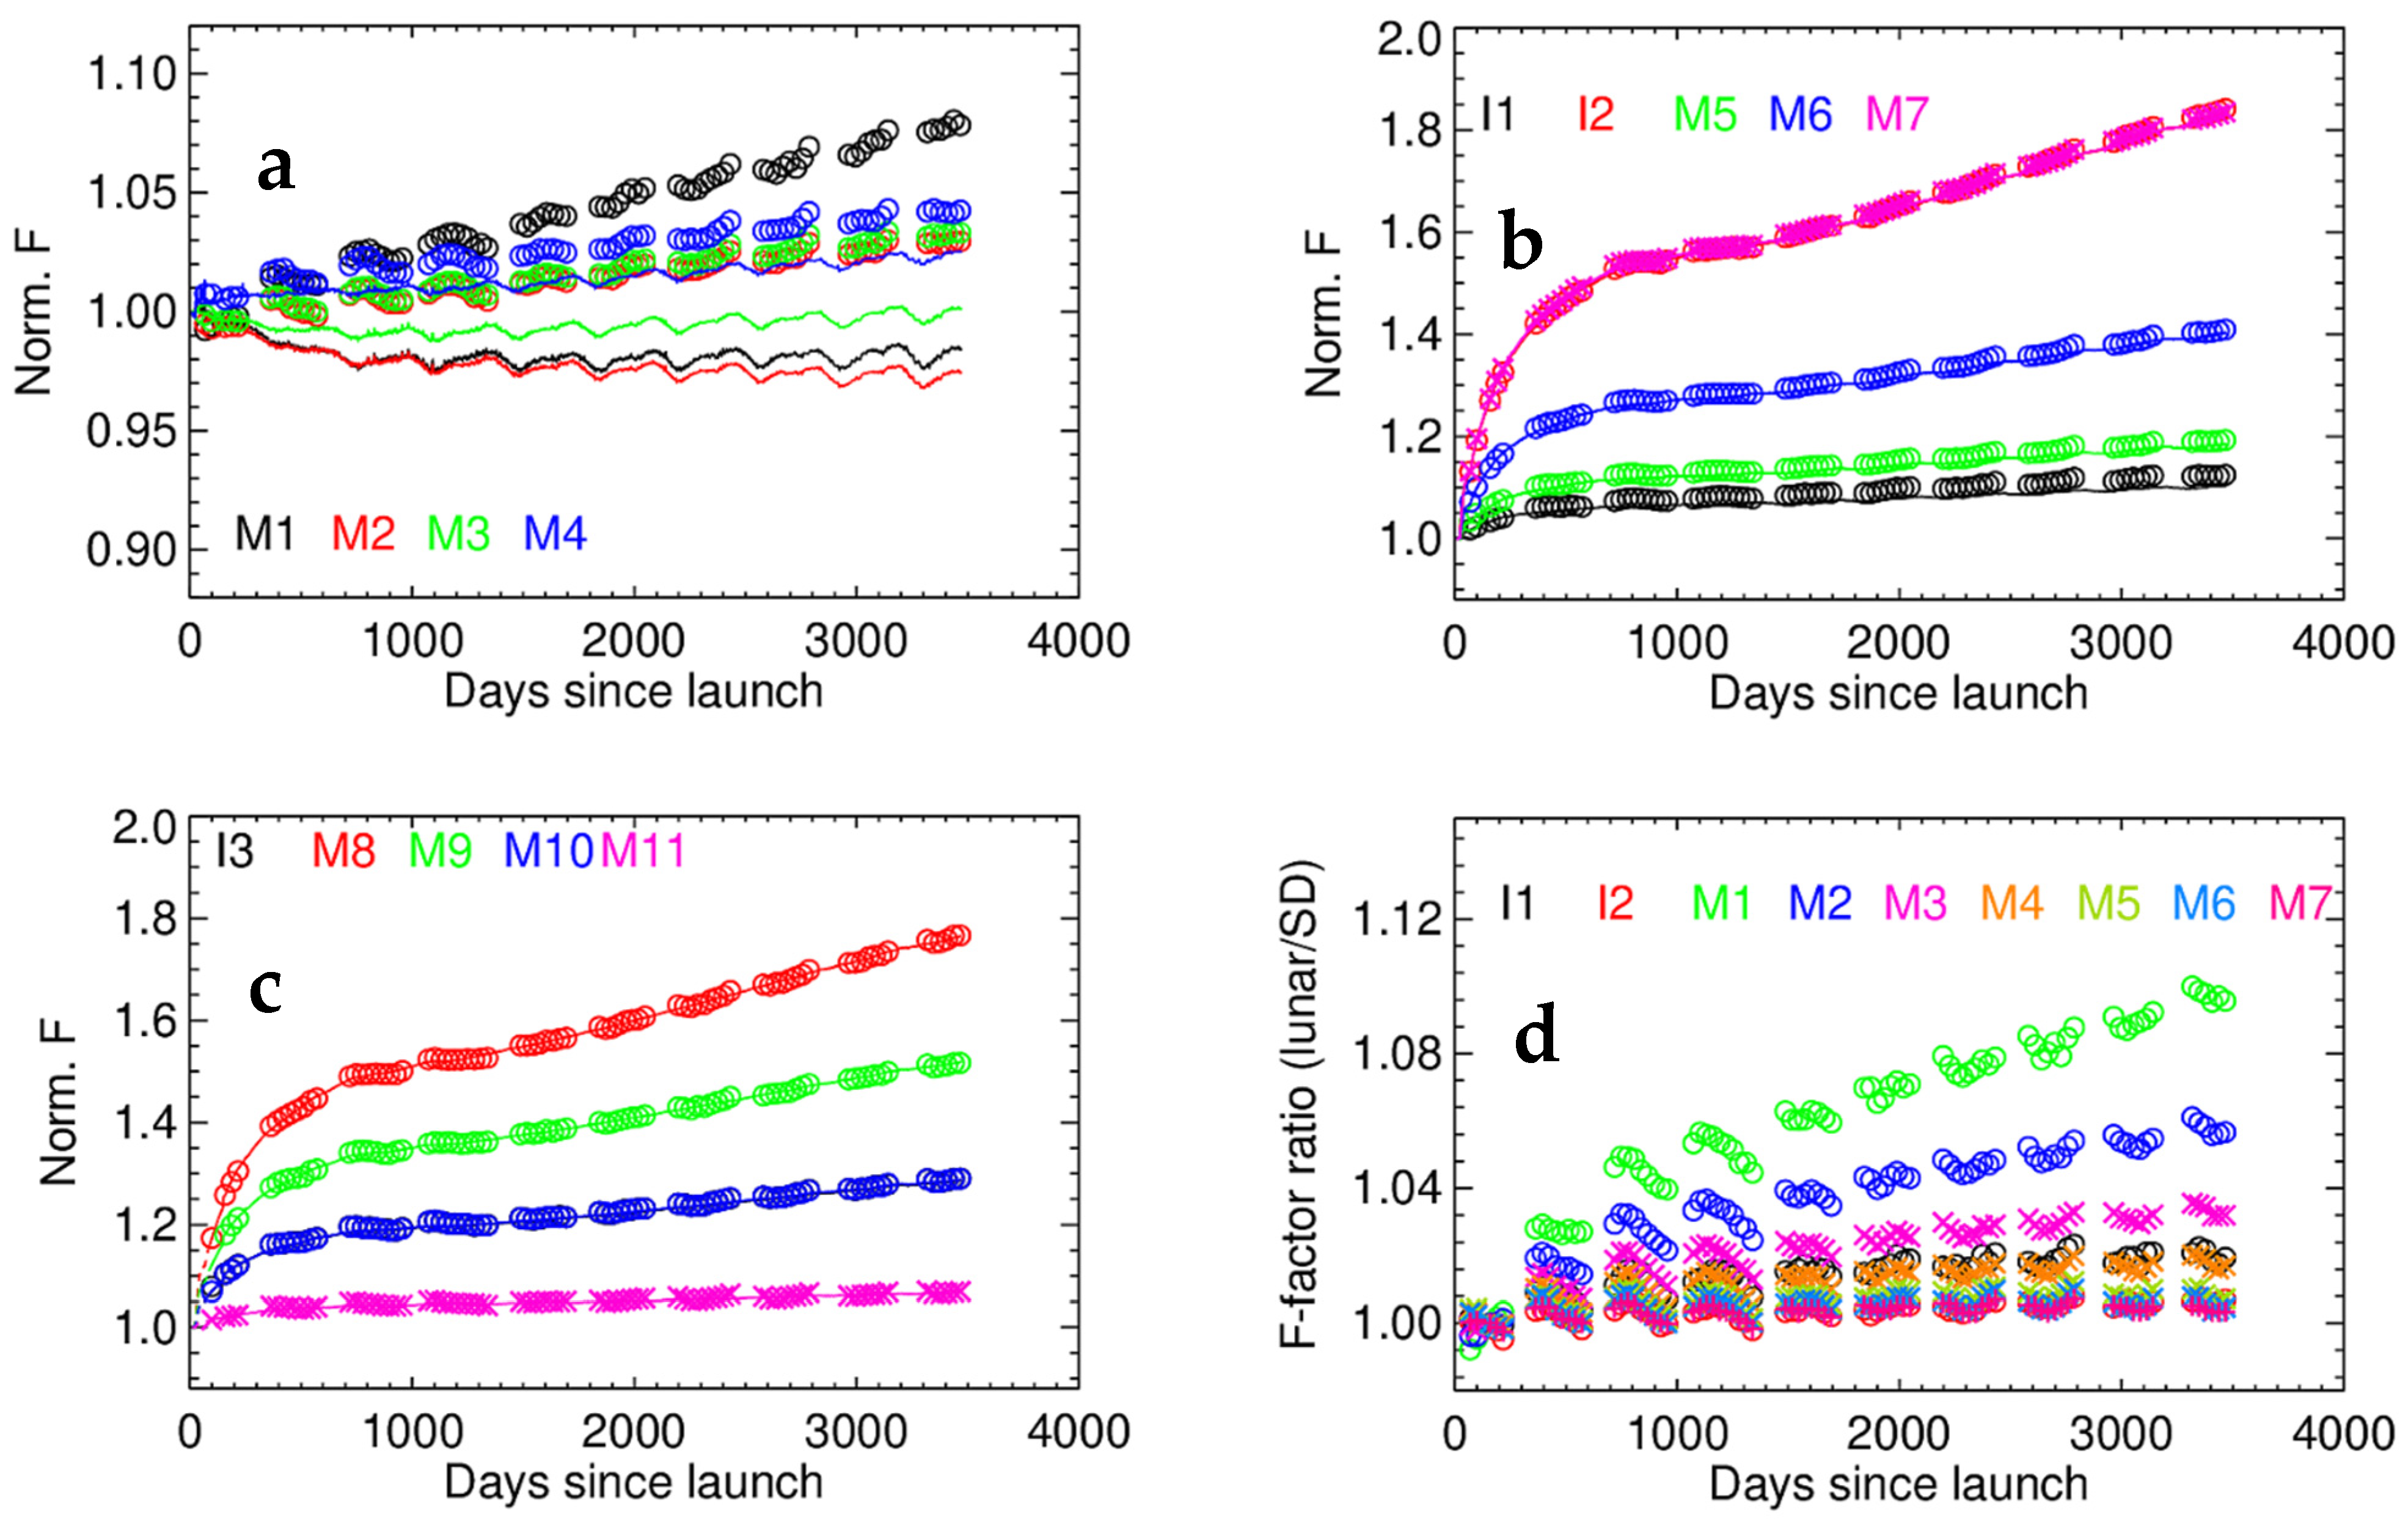
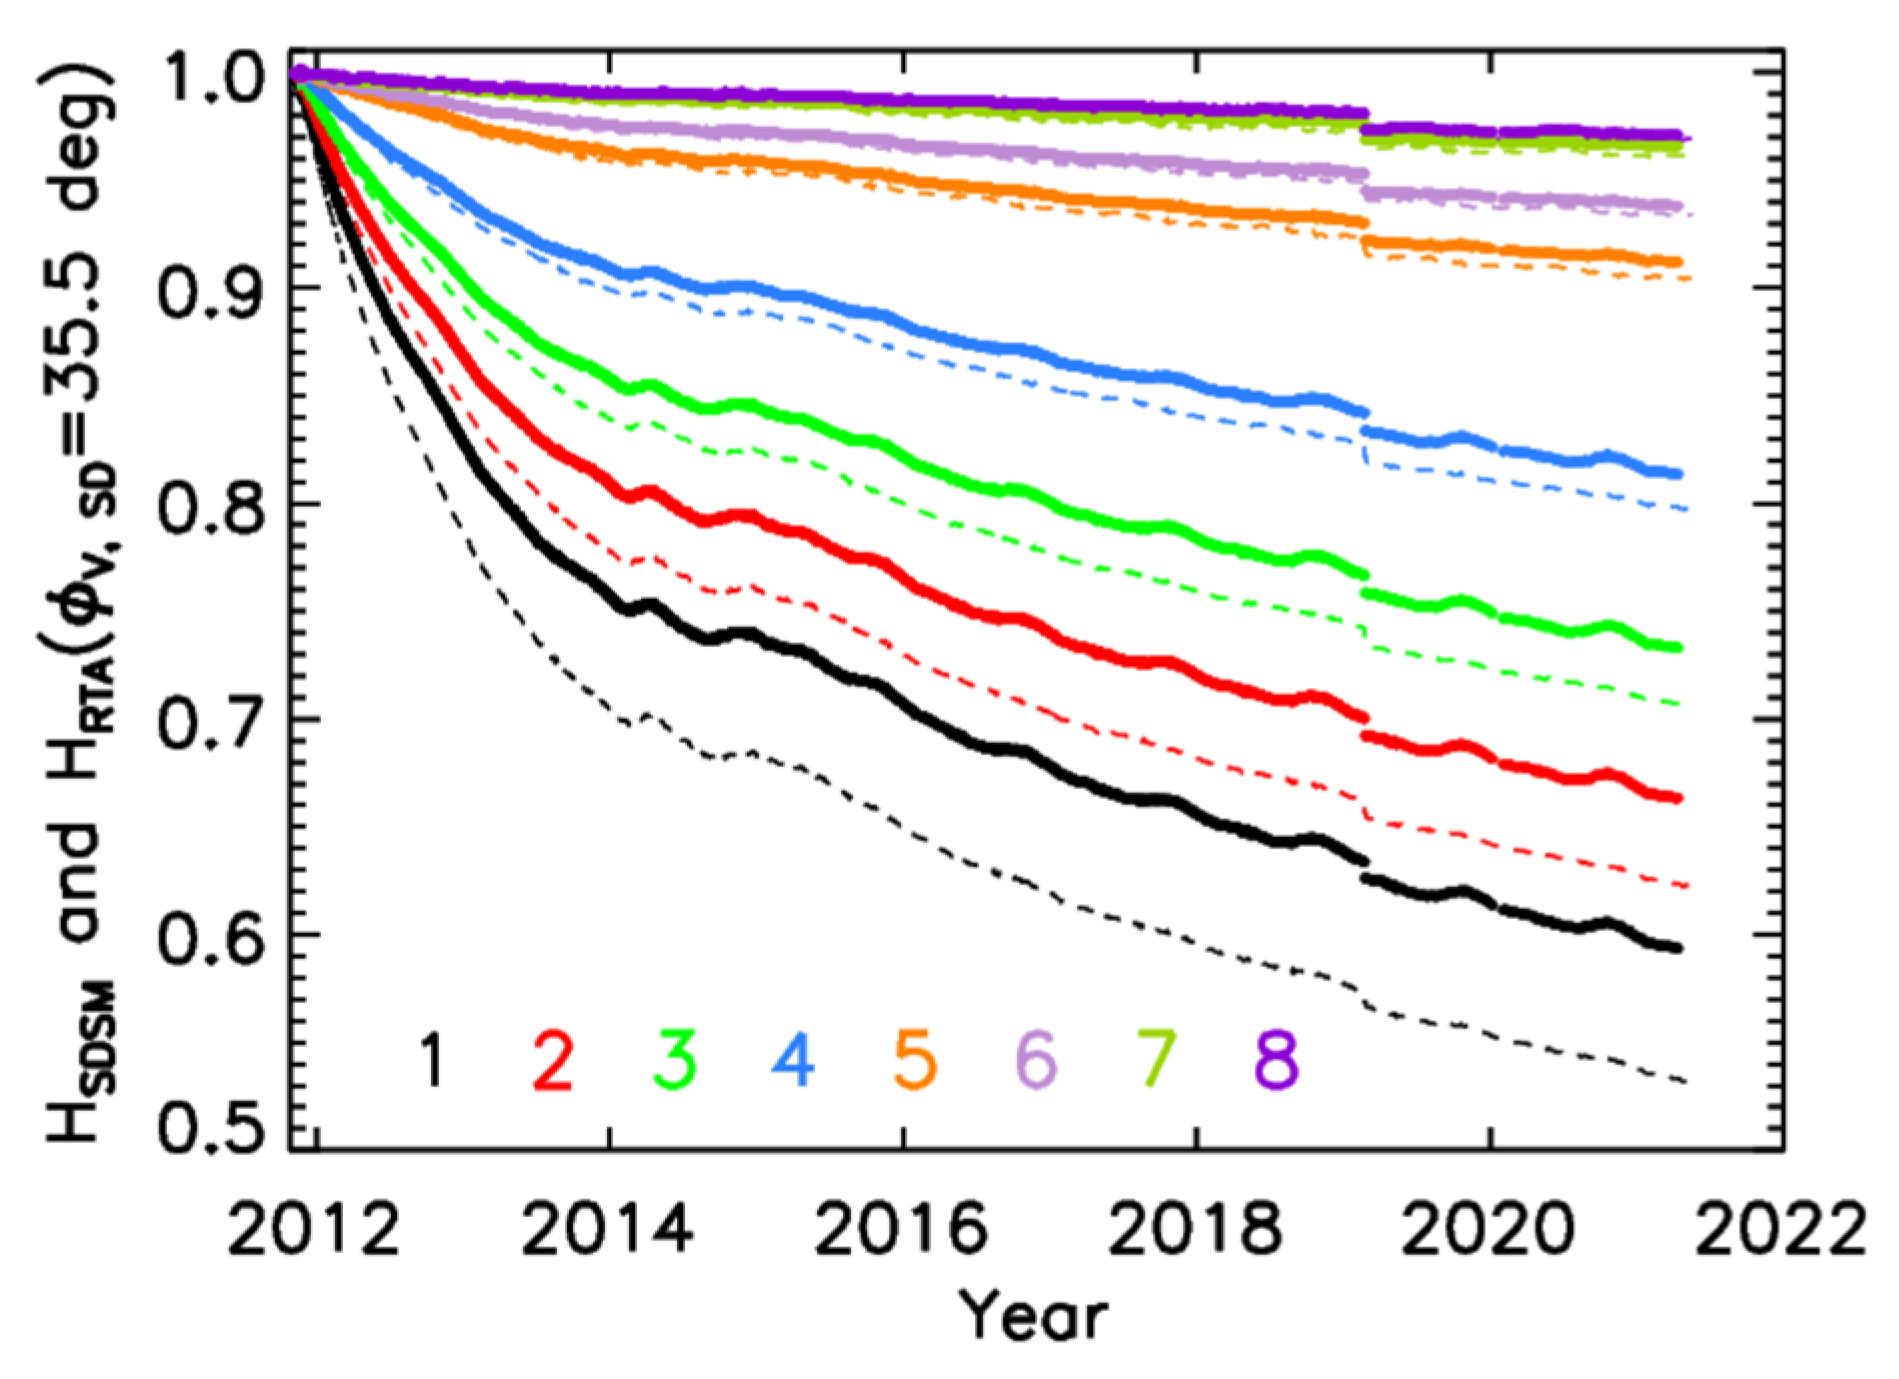
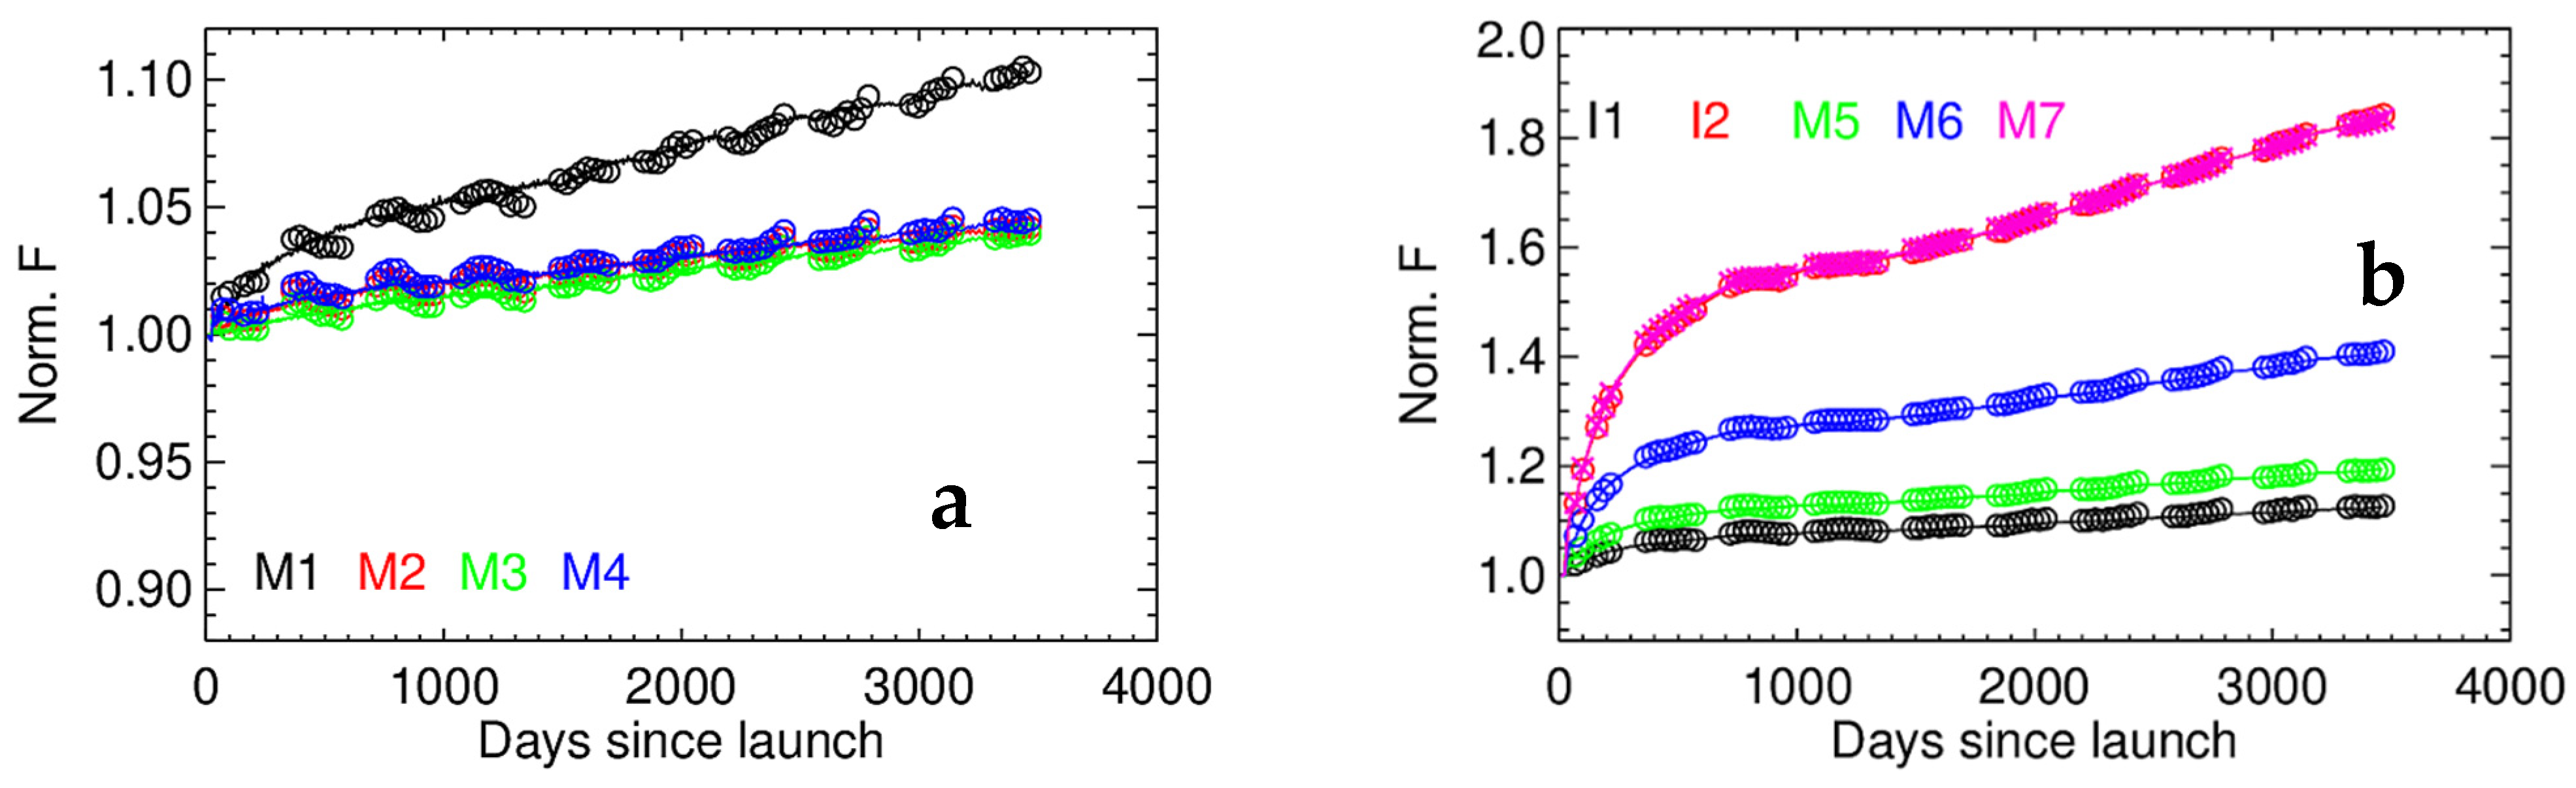
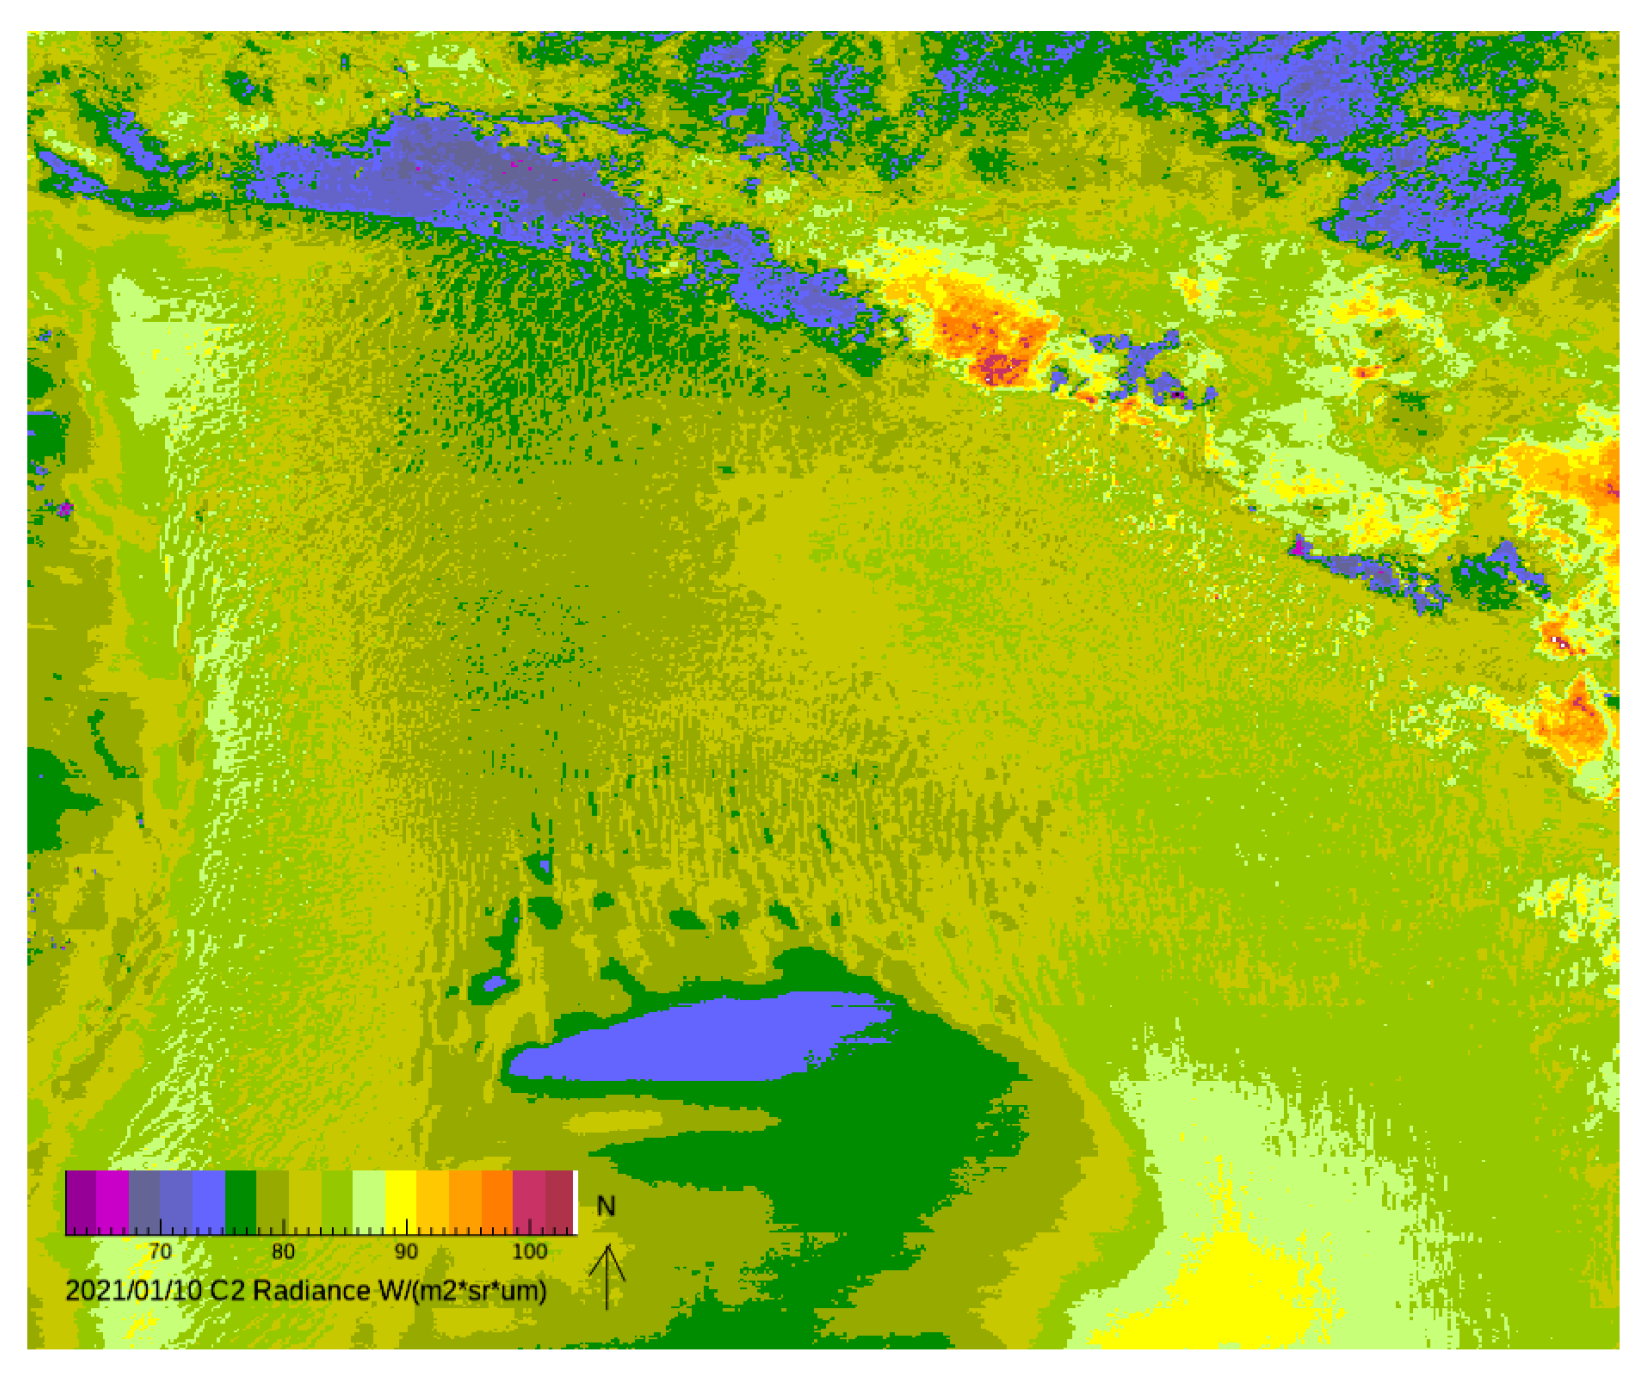
Table 1.
SNPP VIIRS RSBs and SDSM detectors specifications. All SDSM detectors are single-gain and the RSB detectors gain types are denoted in Column 6.
Table 1.
SNPP VIIRS RSBs and SDSM detectors specifications. All SDSM detectors are single-gain and the RSB detectors gain types are denoted in Column 6.
| SDSM | VIIRS RSB | |||||
|---|---|---|---|---|---|---|
| Detector | CW (nm) | Band | CW (nm) | BW (nm) | Gain | SNR Spec. |
| D1 | 412 | M1 | 410 | 20 | DG | 352, 316 |
| D2 | 450 | M2 | 443 | 18 | DG | 380, 409 |
| D3 | 488 | M3 | 486 | 20 | DG | 416, 414 |
| D4 | 555 | M4 | 551 | 20 | DG | 362, 315 |
| N/A | I1 | 640 | 80 | SG | 119 | |
| D5 | 672 | M5 | 671 | 20 | DG | 242, 360 |
| D6 | 746 | M6 | 745 | 15 | SG | 199 |
| D7 | 865 | M7 | 862 | 39 | DG | 215, 340 |
| D7 | 865 | I2 | 862 | 39 | SG | 150 |
| D8 | 935 | |||||
| M8 | 1238 | 20 | SG | 74 | ||
| M9 | 1378 | 15 | SG | 83 | ||
| M10 | 1610 | 60 | SG | 342 | ||
| I3 | 1610 | 60 | SG | 6 | ||
| M11 | 2250 | 50 | SG | 10 | ||
CW: center wavelength; BW: bandwidth; DG: dual-gain; SG: single-gain; SNR spec.: specified signal-to-noise ratio at typical radiance (format is high-gain, low-gain for dual-gain bands).
Table 2.
Acronyms used in this paper.
| Acronym | Full Description | Acronym | Full Description |
|---|---|---|---|
| AOI | AOI Angle of incidence | OBC | On-board calibrators |
| AU | Astronomical Unit | OBPG | Ocean Biology Processing Group |
| BRF | Bidirectional reflectance factor | OOB | Out-of-band |
| C1 | Collection 1 | PEATE | Product Evaluation and Algorithm Test Element |
| C2 | Collection 2 | PICS | Pseudo-invariant calibration sites |
| DCC | Deep convective clouds | ROLO | Robotic Lunar Observatory |
| EDR | Environmental data records | RSB | Reflective solar band |
| EV | Earth view | RSR | Relative spectral response |
| FPA | Focal plane assembly | RTA | Rotating telescope assembly |
| GSFC | Goddard Space Flight Center | RVS | Response-versus-scan-angle |
| HAM | Half-angle-mirror | SD | Solar diffuser |
| I-bands | Imaging bands | SDR | Sensor data records |
| JPSS | Joint Polar Satellite System | SDSM | Solar diffuser stability monitor |
| L1B | Level 1B | SNPP | Suomi national polar-orbiting partnership |
| LUT | Look-up-table | SNR | Signal-to-noise ratio |
| M-bands | Moderate resolution bands | SV | Space view |
| MODIS | Moderate Resolution Imaging Spectroradiometer | SWIR | Shortwave infrared |
| NIST | National Institute of Standards and Technology | TOA | Top-of-atmosphere |
| VIS | Visible | VCST | VIIRS Calibration Support Team |
| NIR | Near infrared | VIIRS | Visible Infrared Imaging Radiometer Suite |
| VNIR | VIS and NIR |
Table 3.
Fitted parameters of the linear function of detector in Equation (10).
| Band | ||||
|---|---|---|---|---|
| I1 | 0.55 | 0.29 | 0.11 | 0.01 |
| I2 | 1.17 | 0.77 | 0.09 | 0.04 |
| M1 | −0.96 | 0.33 | 0.24 | 0.01 |
| M2 | 0.70 | 0.37 | 0.29 | 0.01 |
| M3 | 2.94 | 0.19 | 0.17 | 0.01 |
| M4 | 2.54 | 0.28 | 0.12 | 0.01 |
| M5 | 0.00 | 0.00 | 0.12 | 0.02 |
| M7 | 2.66 | 0.50 | 0.11 | 0.05 |
Publisher’s Note: MDPI stays neutral with regard to jurisdictional claims in published maps and institutional affiliations. |
© 2021 by the authors. Licensee MDPI, Basel, Switzerland. This article is an open access article distributed under the terms and conditions of the Creative Commons Attribution (CC BY) license (https://creativecommons.org/licenses/by/4.0/).
Share and Cite
MDPI and ACS Style
Sun, J.; Xiong, X.; Lei, N.; Li, S.; Twedt, K.; Angal, A. Ten Years of SNPP VIIRS Reflective Solar Bands On-Orbit Calibration and Performance. Remote Sens. 2021, 13, 2944. https://doi.org/10.3390/rs13152944
AMA Style
Sun J, Xiong X, Lei N, Li S, Twedt K, Angal A. Ten Years of SNPP VIIRS Reflective Solar Bands On-Orbit Calibration and Performance. Remote Sensing. 2021; 13(15):2944. https://doi.org/10.3390/rs13152944
Chicago/Turabian StyleSun, Junqiang, Xiaoxiong Xiong, Ning Lei, Sherry Li, Kevin Twedt, and Amit Angal. 2021. "Ten Years of SNPP VIIRS Reflective Solar Bands On-Orbit Calibration and Performance" Remote Sensing 13, no. 15: 2944. https://doi.org/10.3390/rs13152944
Note that from the first issue of 2016, this journal uses article numbers instead of page numbers. See further details here.