
The Process-Mode-Driving Force of Cropland Expansion in Arid Regions of China Based on the Land Use Remote Sensing Monitoring Data

Abstract
:1. Introduction
2. Materials and Methods
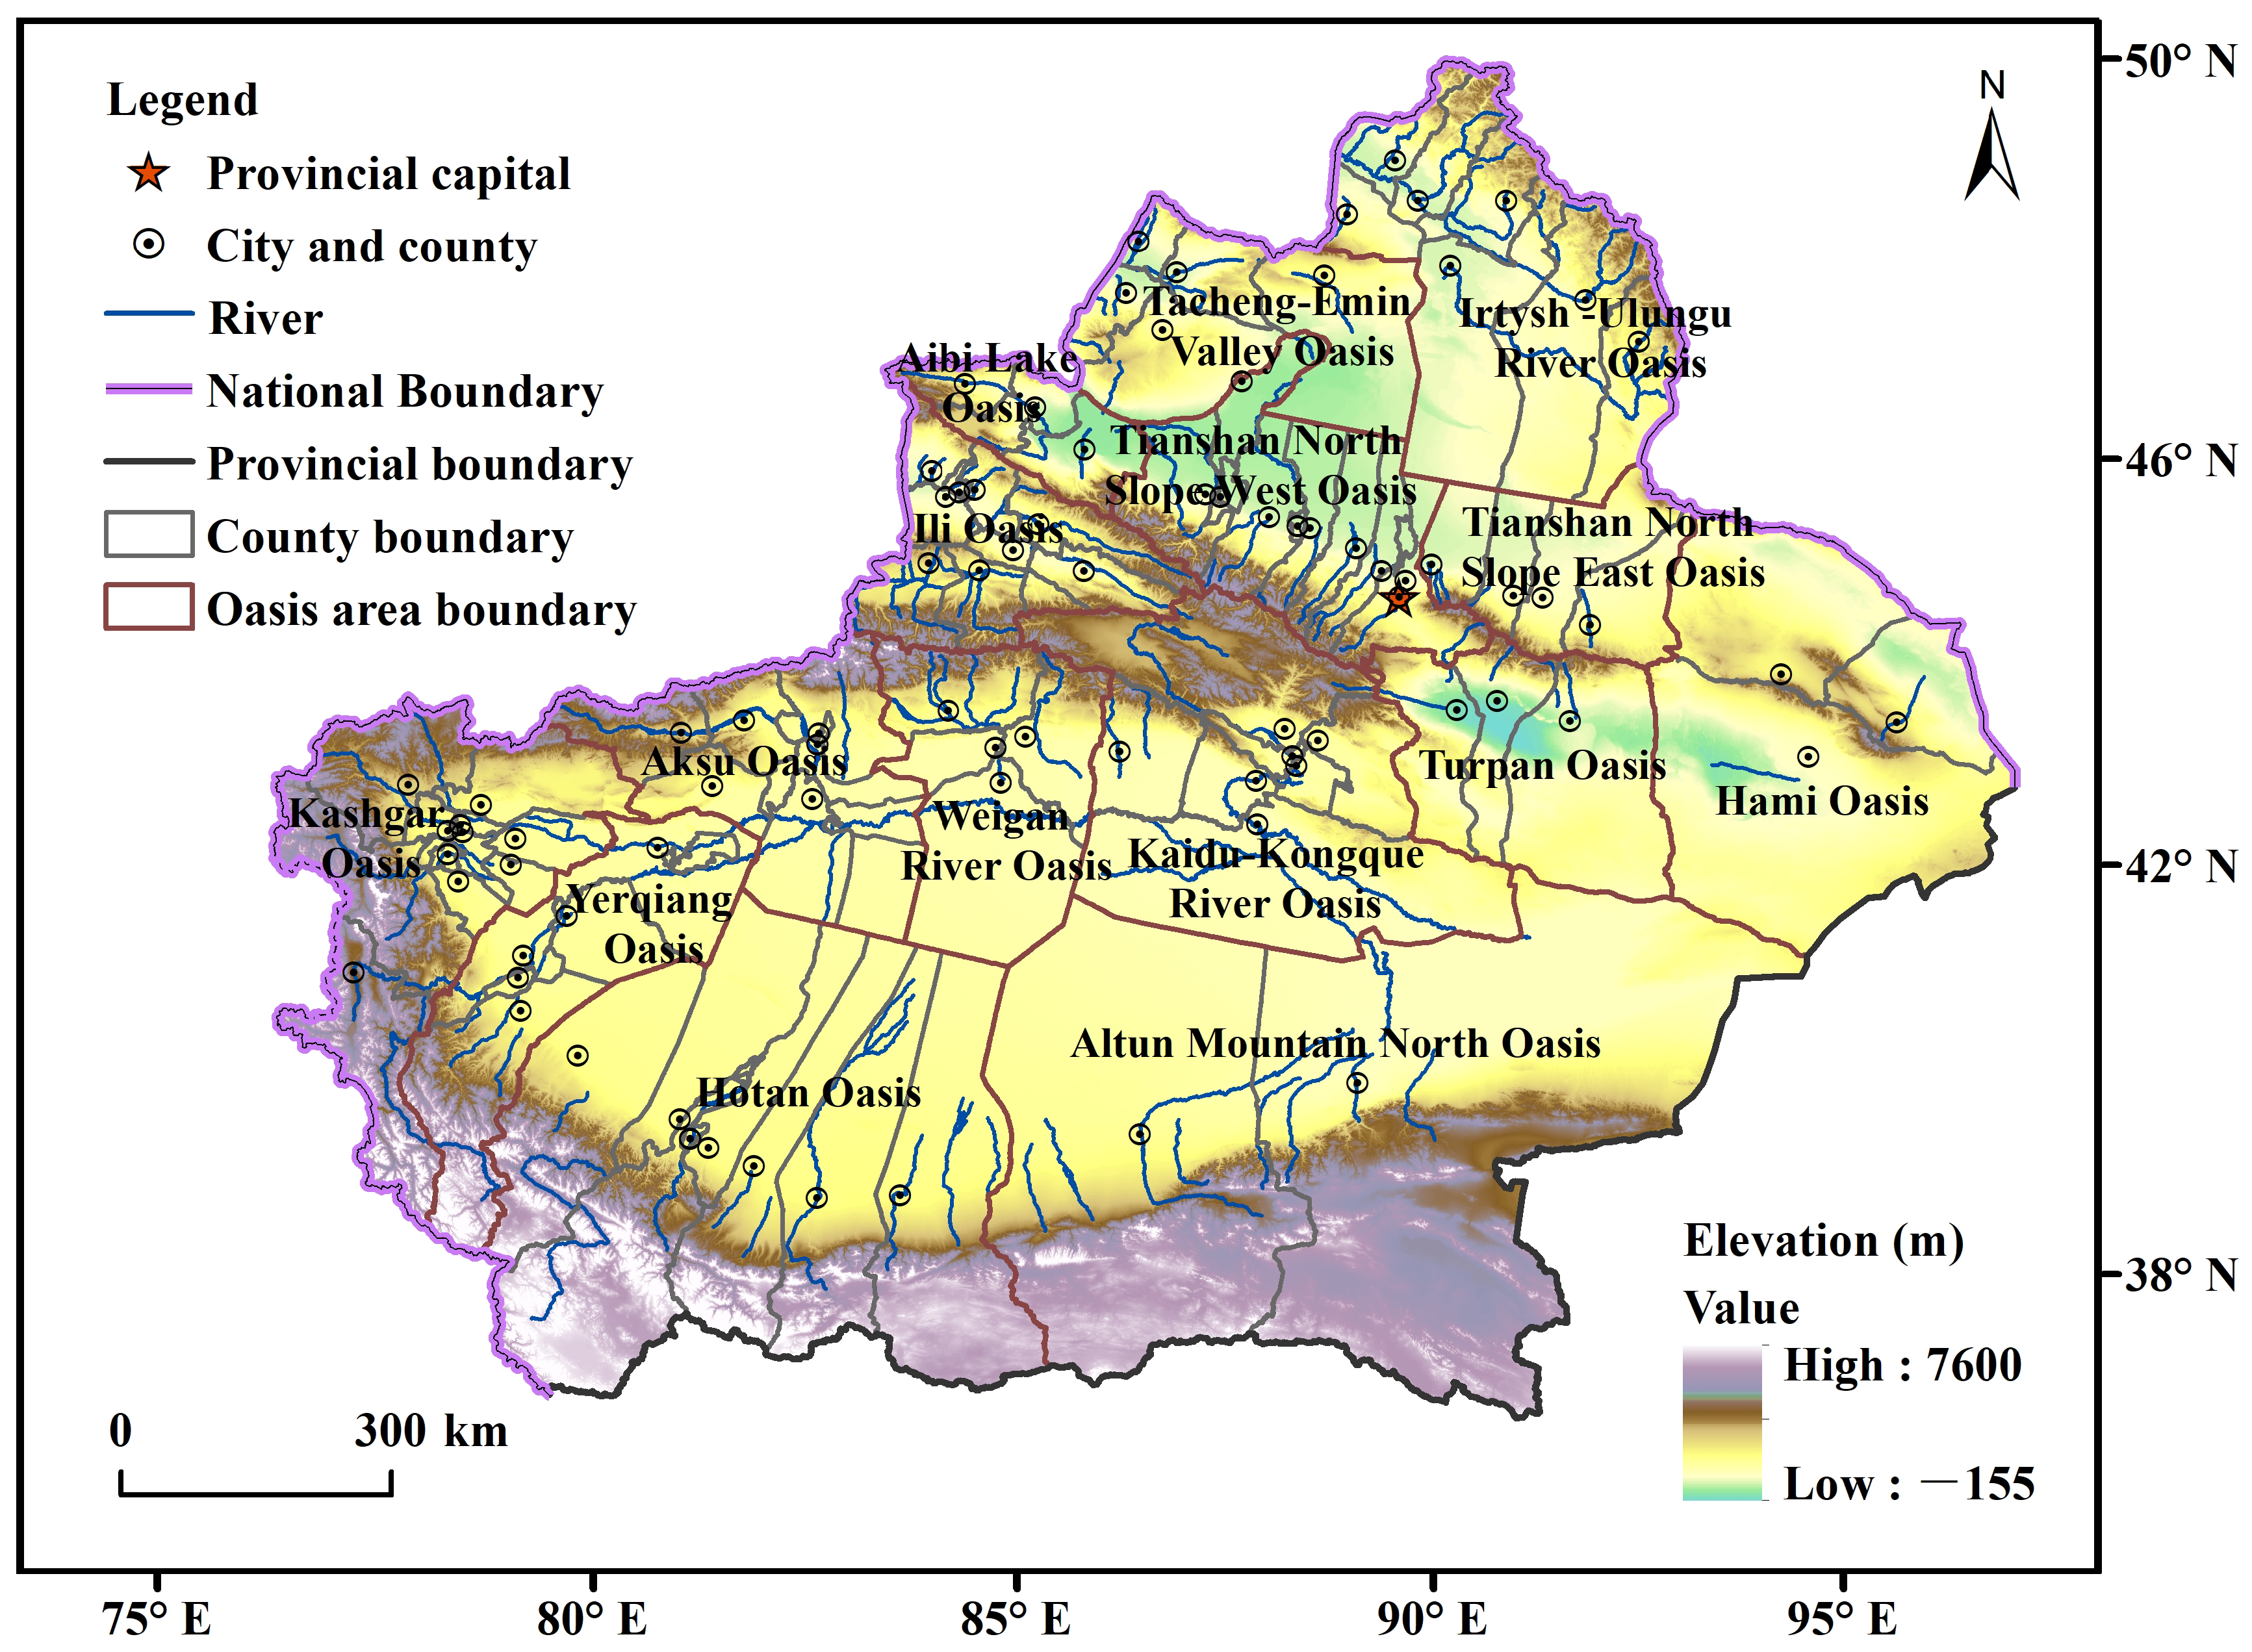
2.1. Study Area
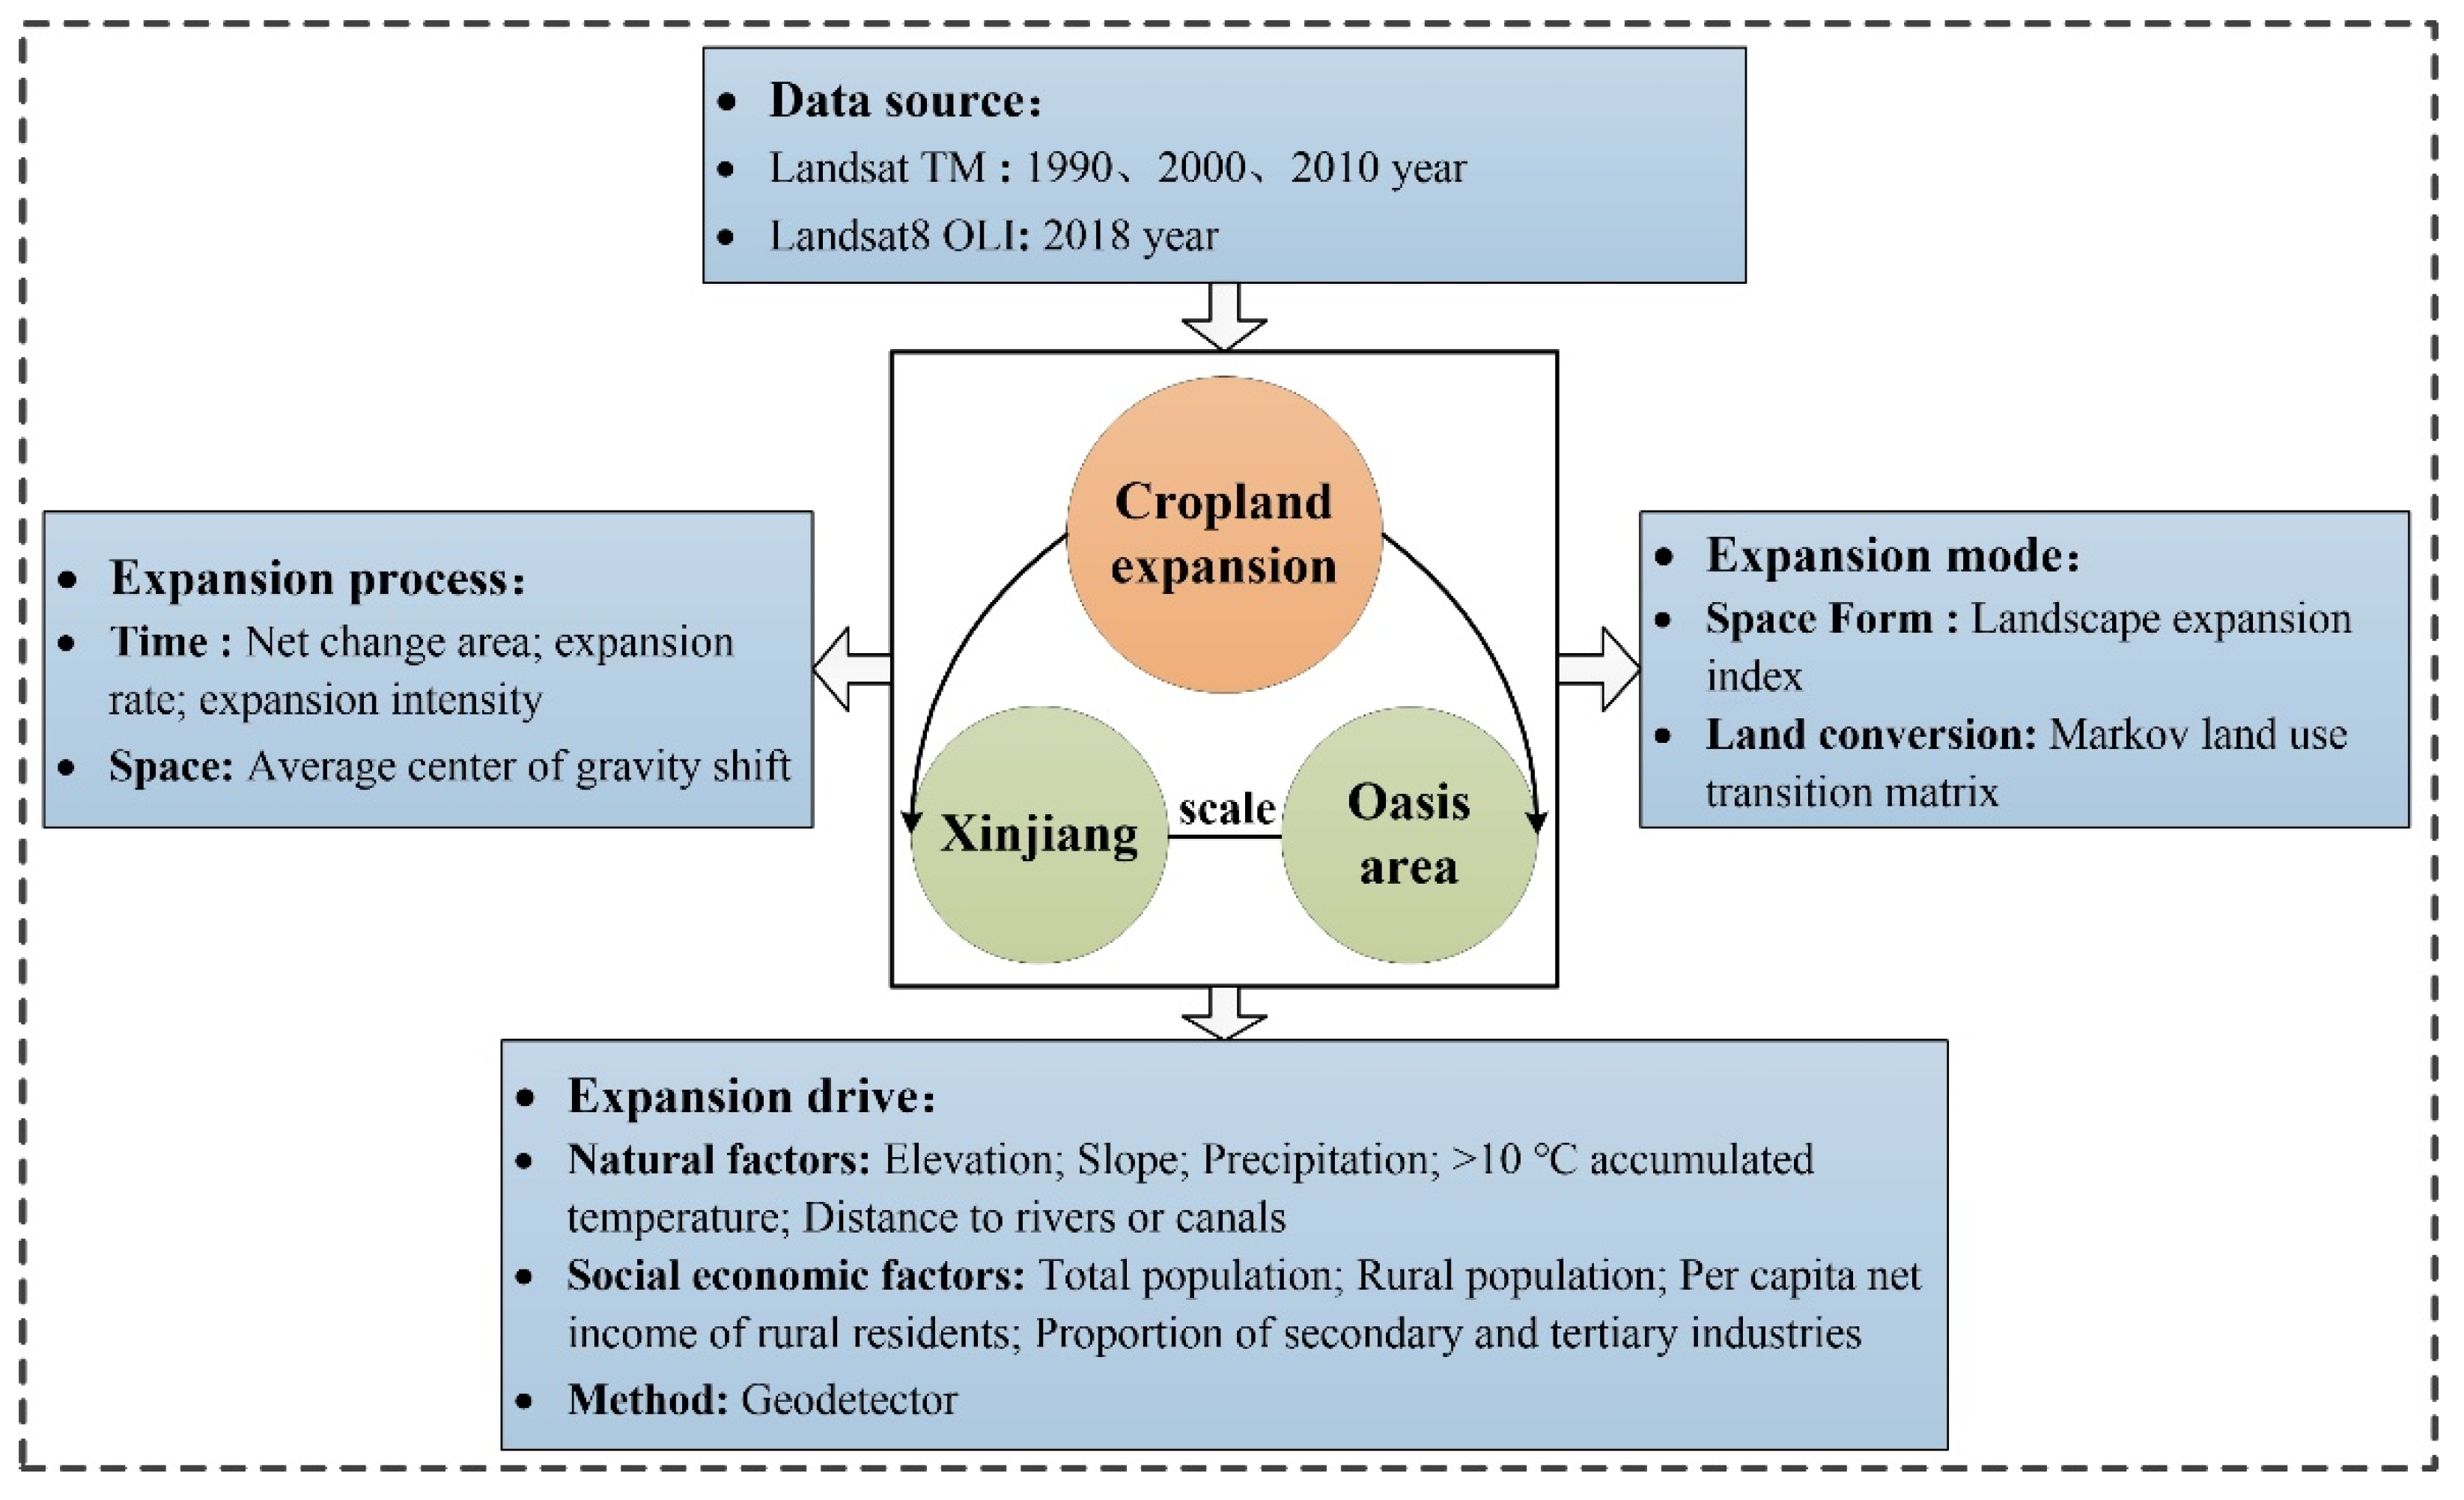
2.2. Methods
2.2.1. Method for Describing the Process of Cropland Expansion
2.2.2. Method for Describing the Mode of Cropland Expansion
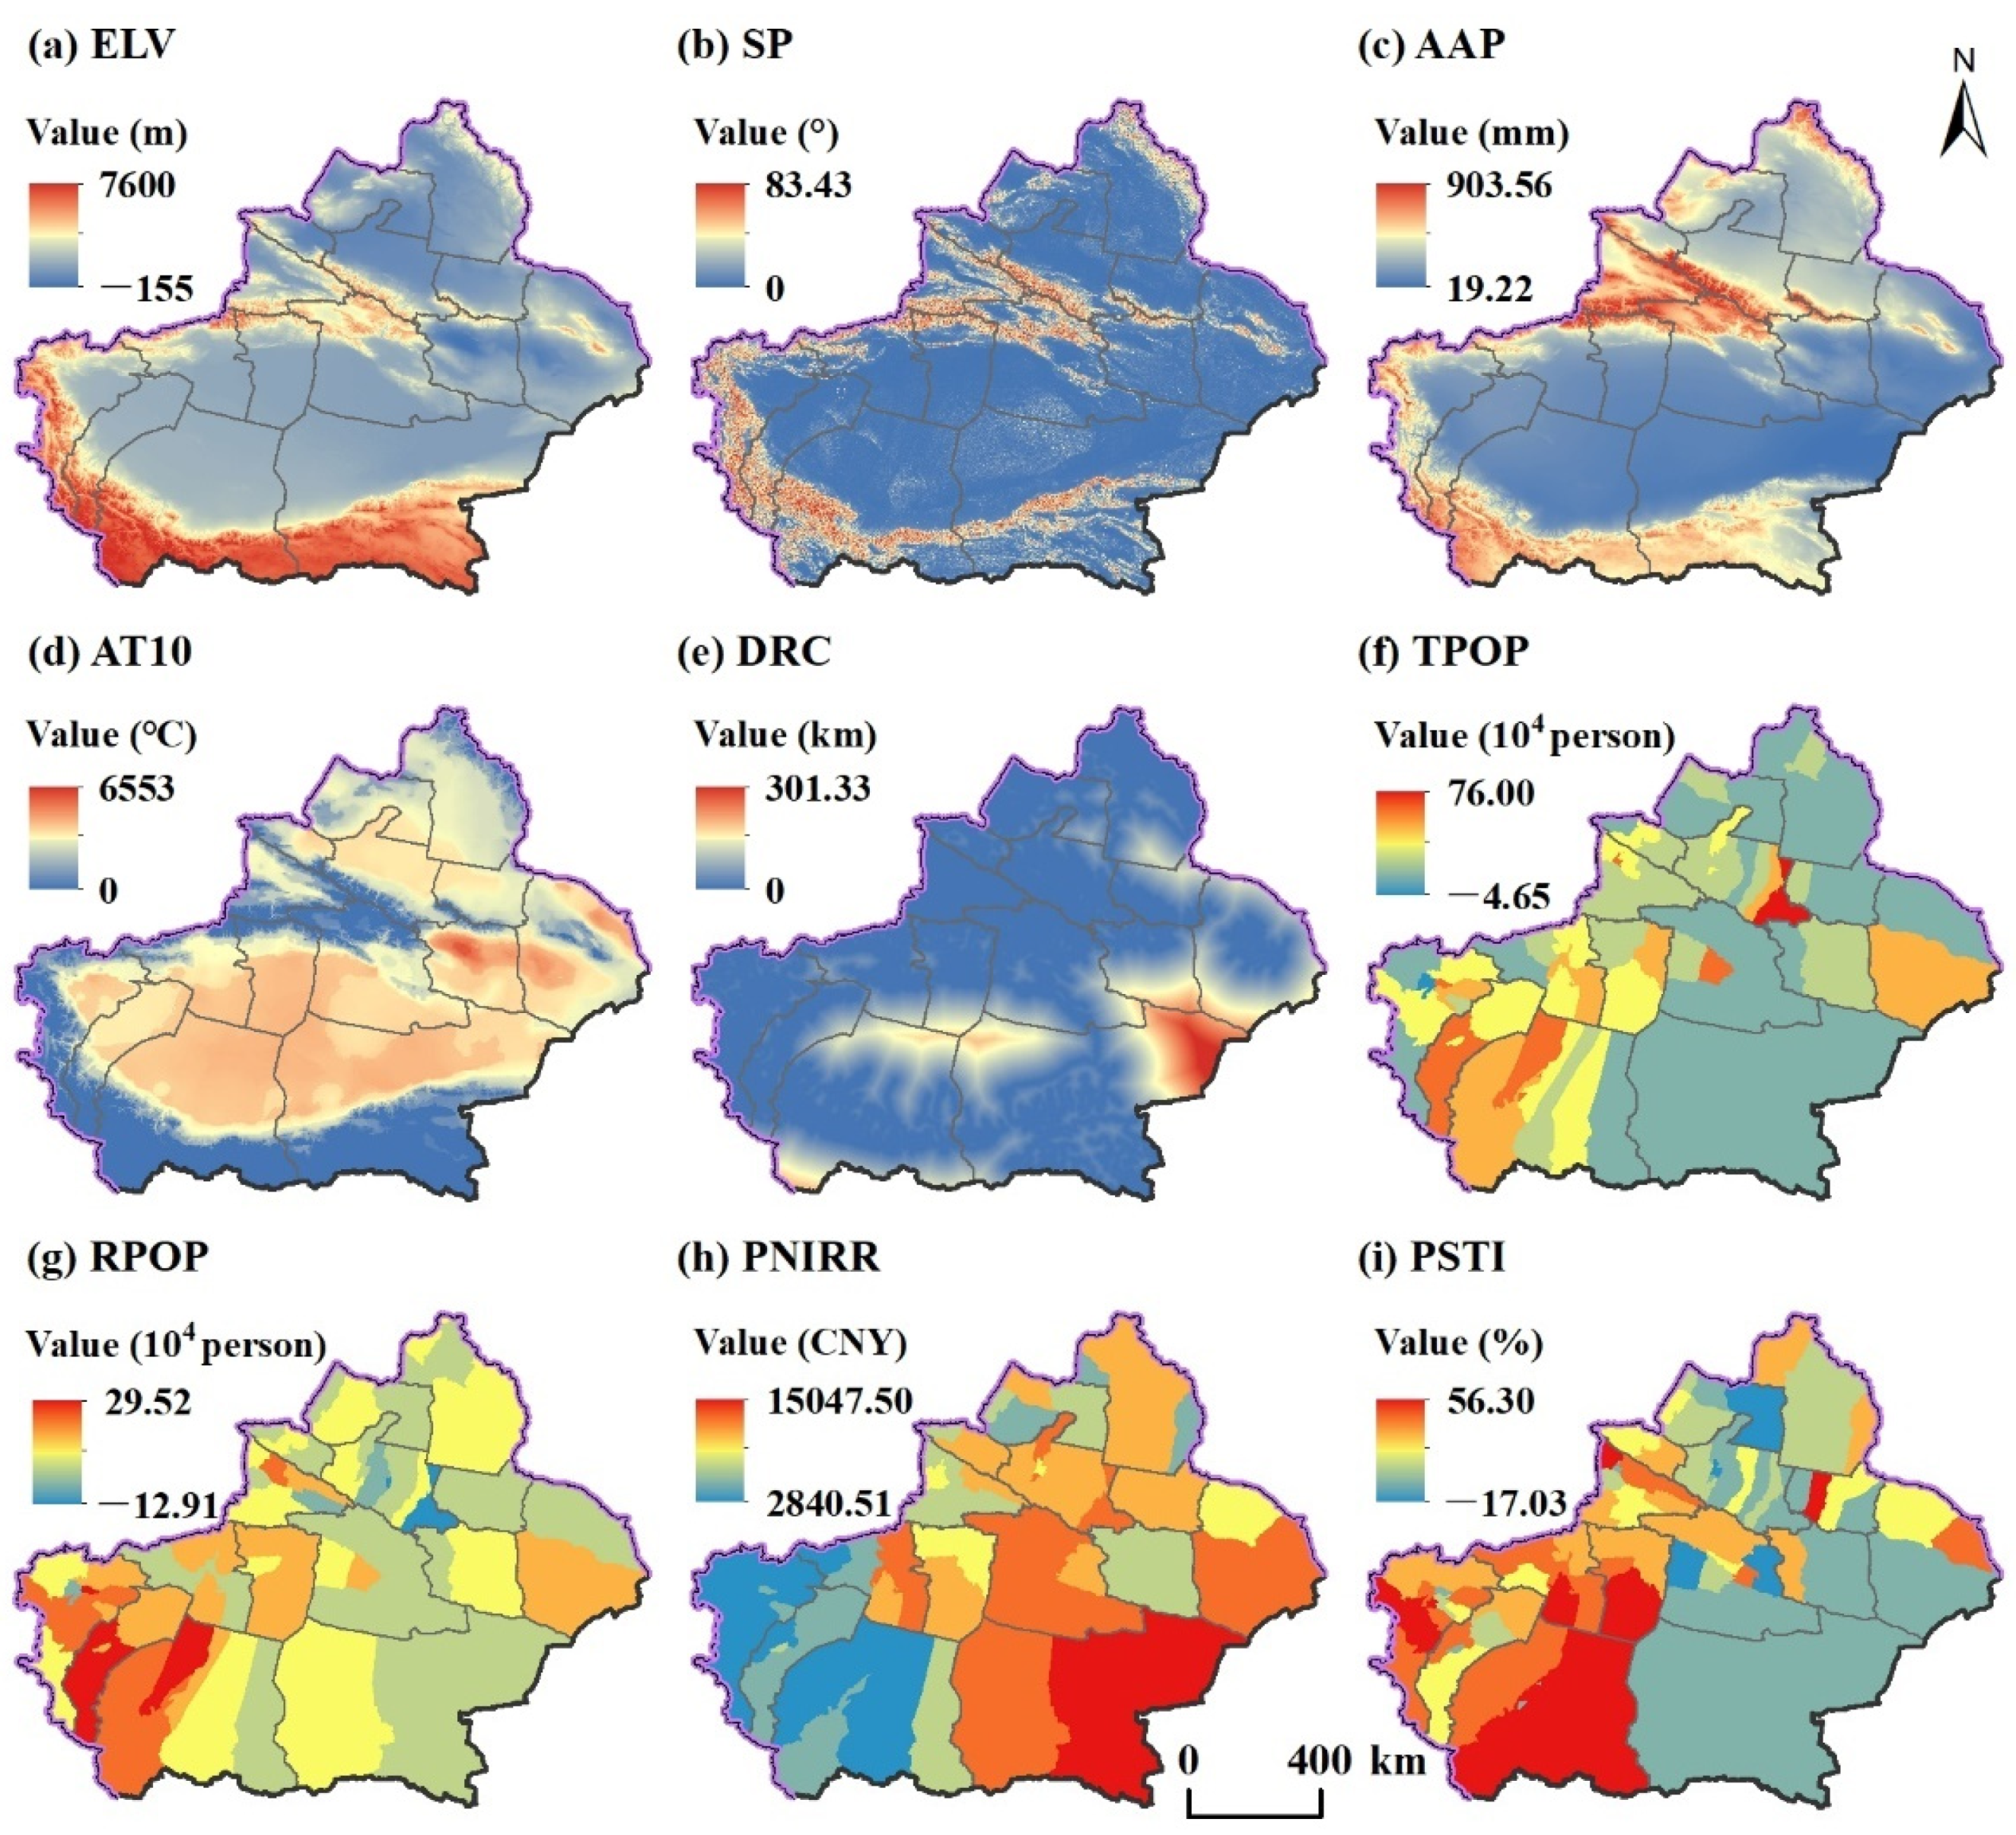
2.2.3. Methods to Analyze the Driving Forces of Cropland Expansion
- Geodetector
- Selection of influencing factors and definition of variables
2.3. Data Sources and Processing
3. Results
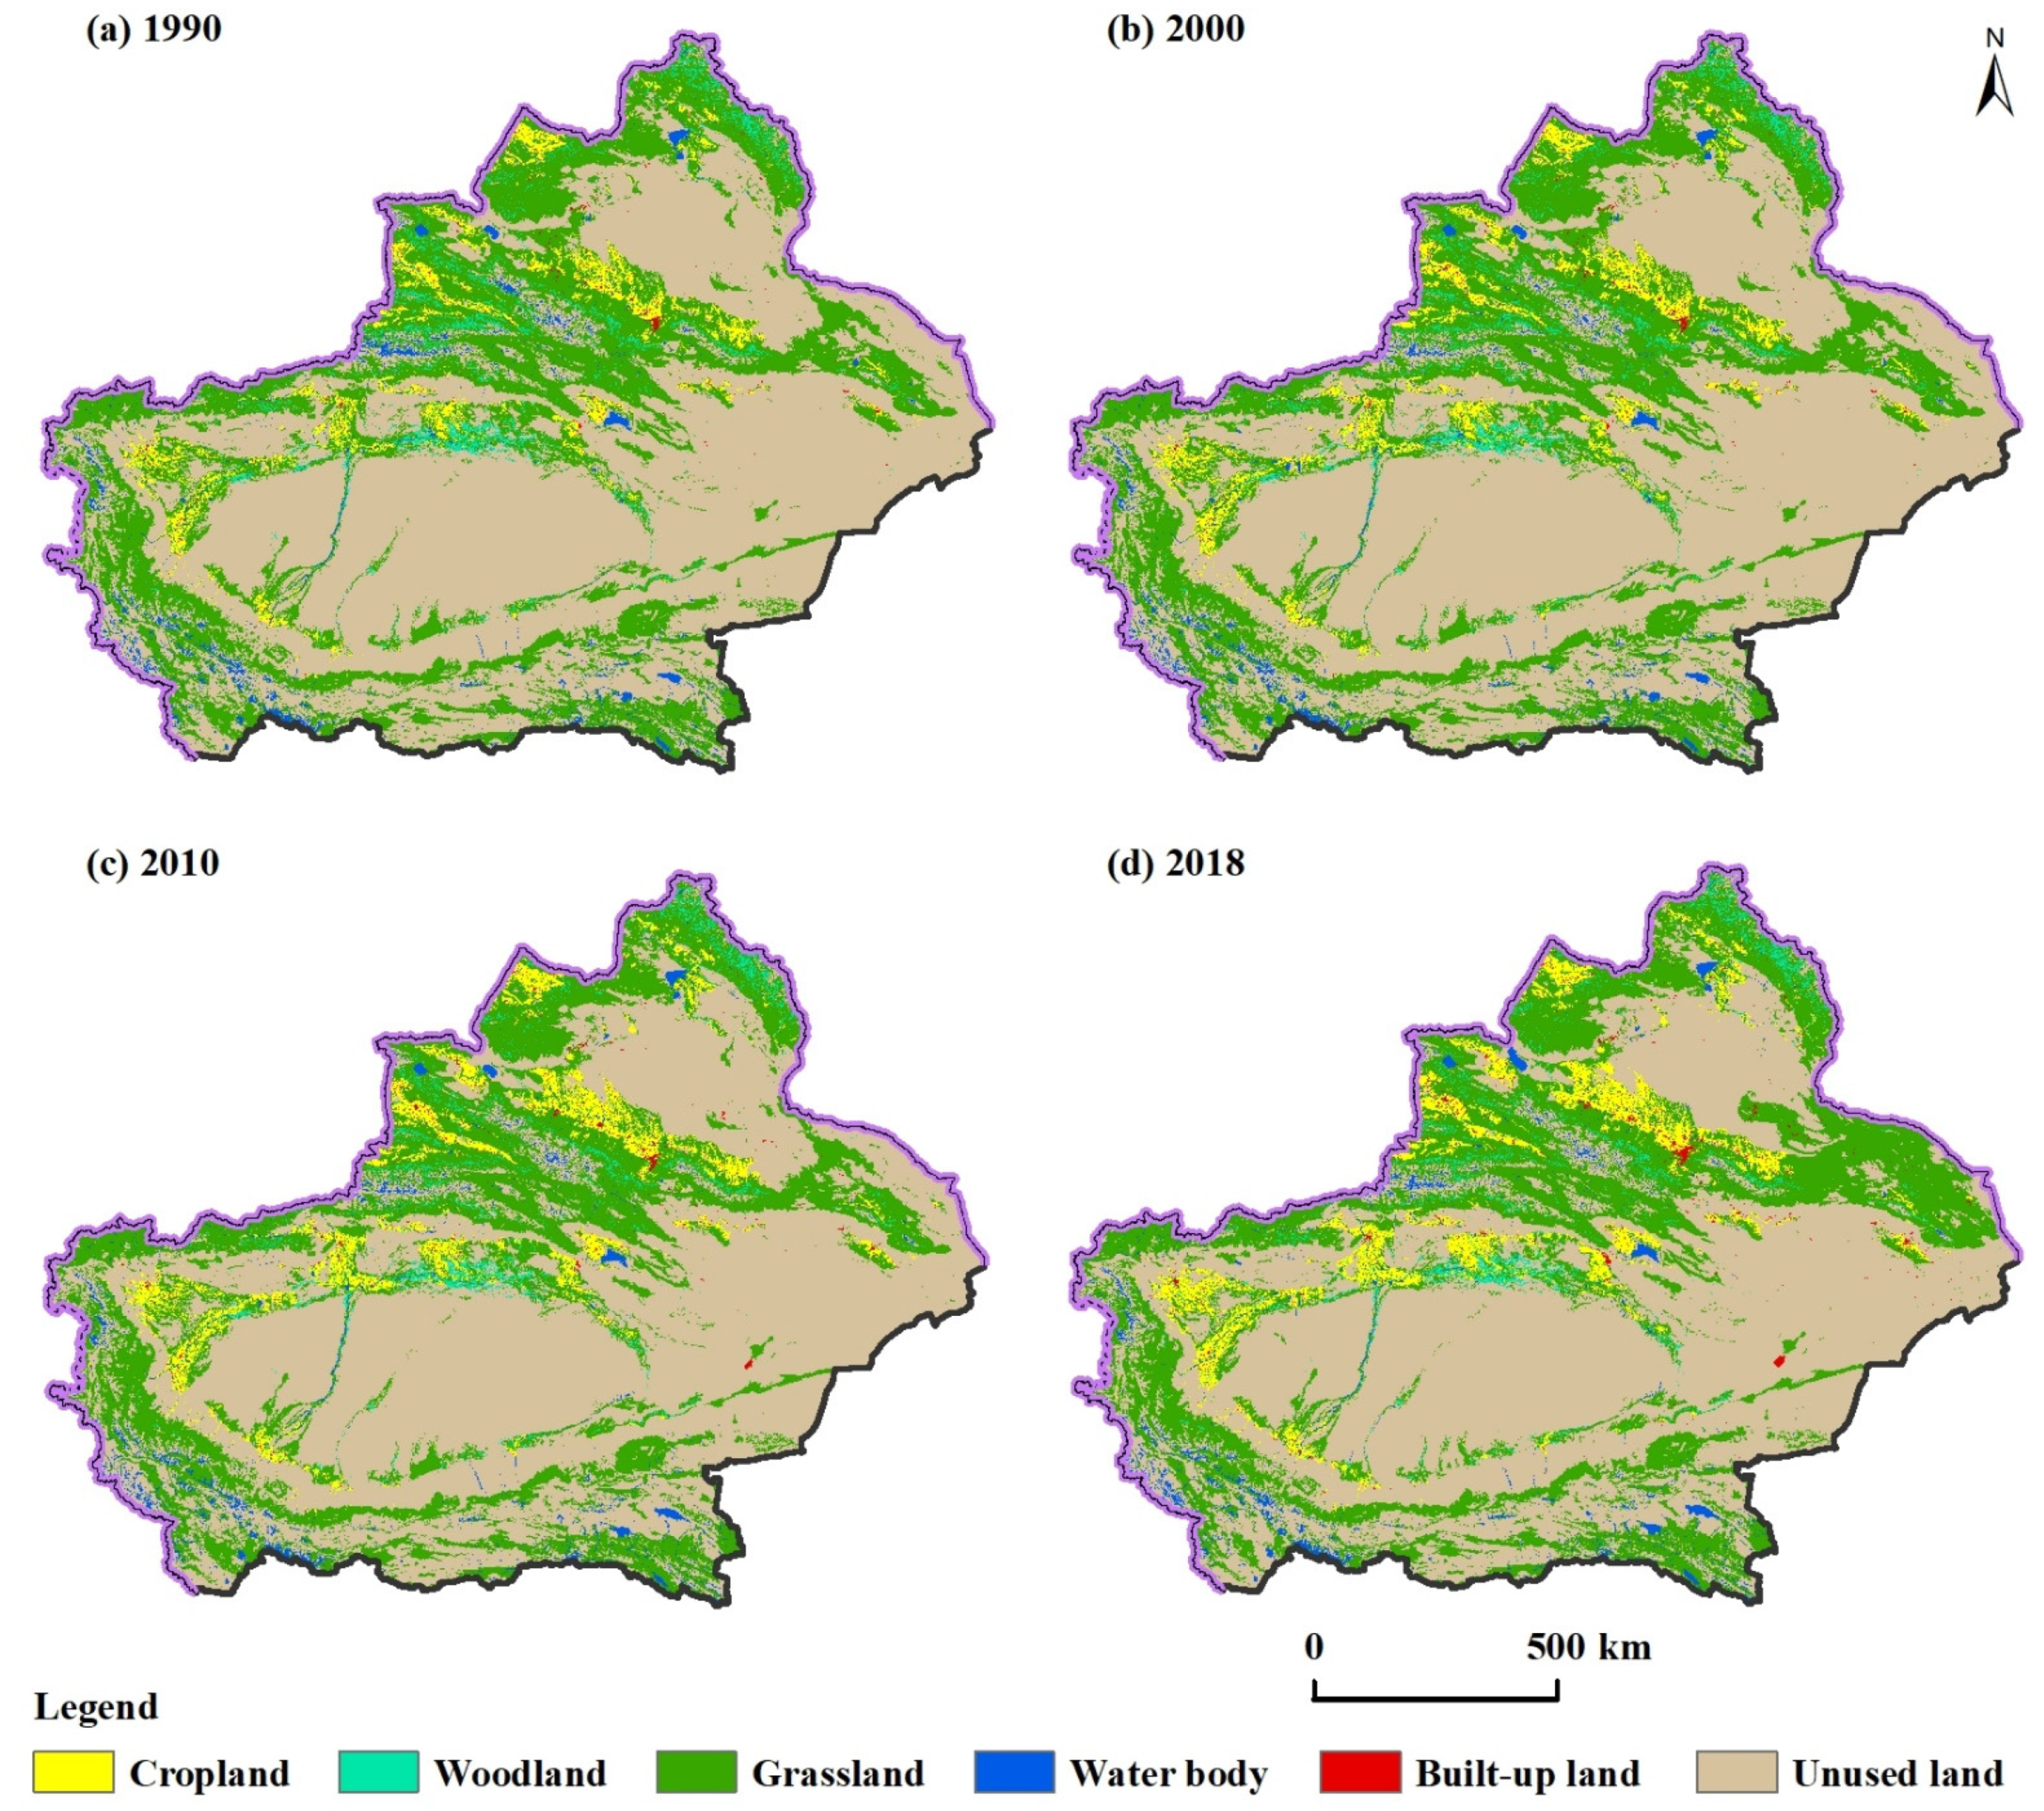
3.1. The Process of Cropland Expansion
3.1.1. Temporal Process
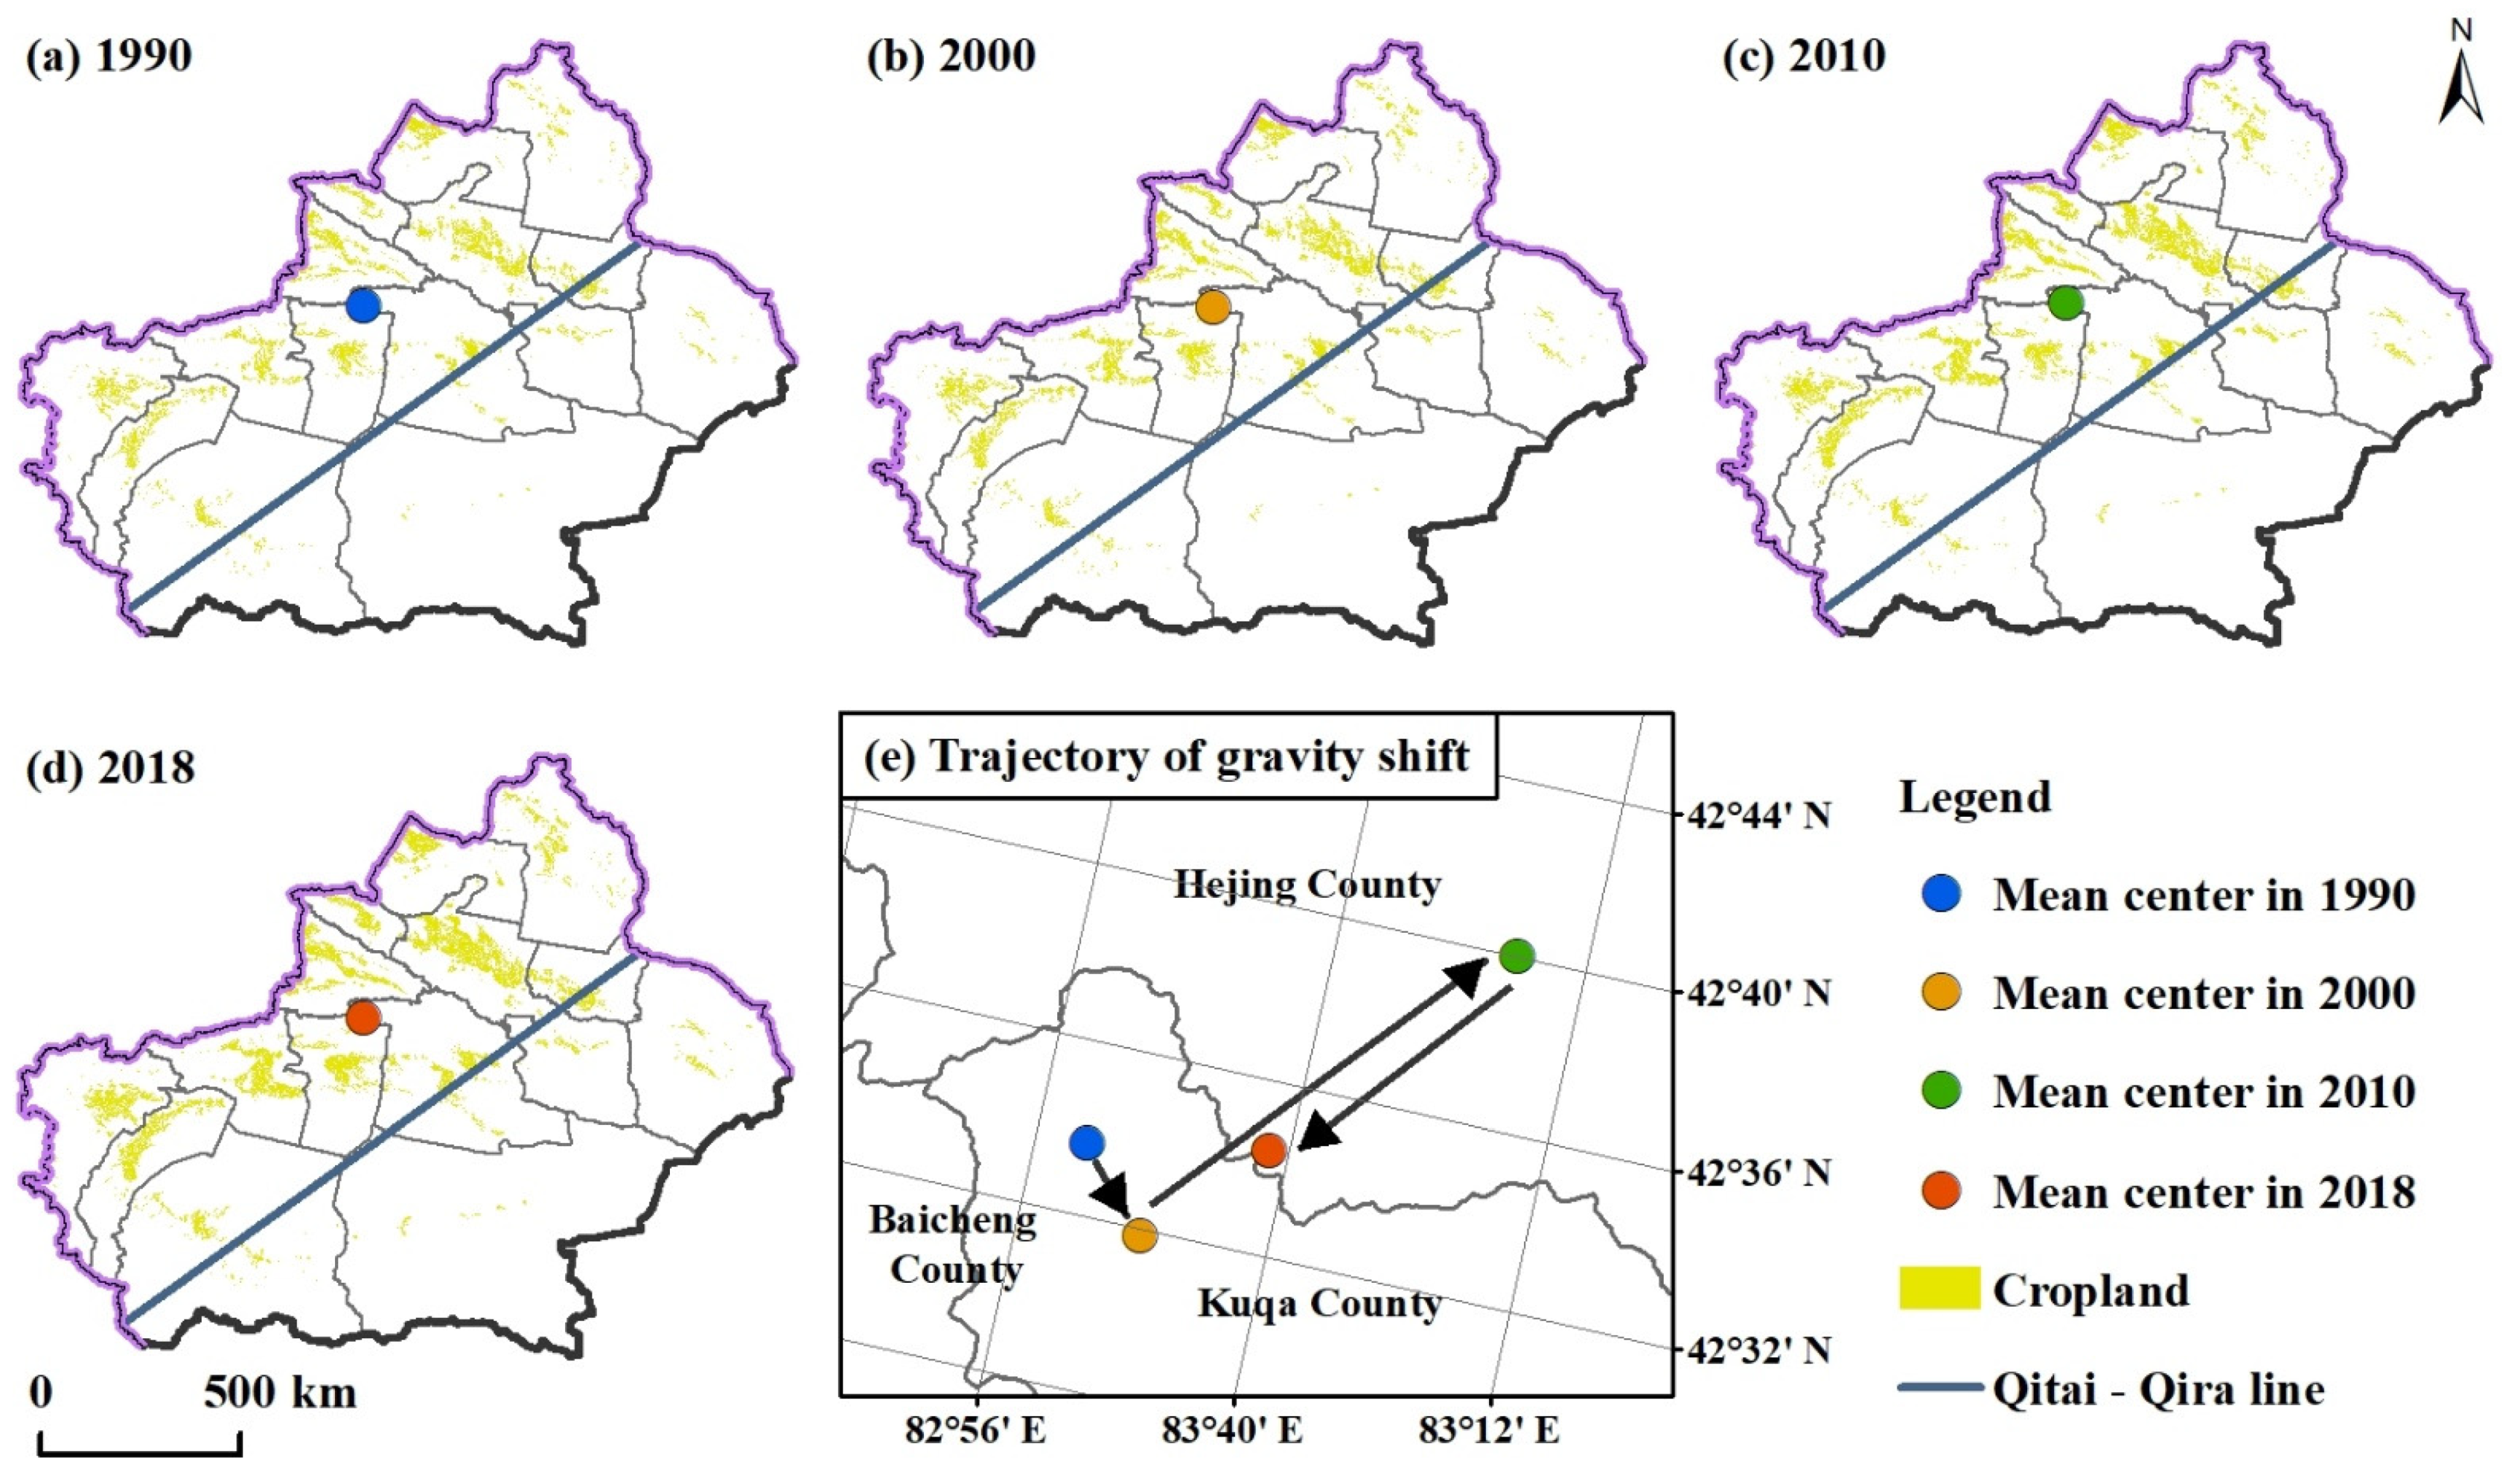
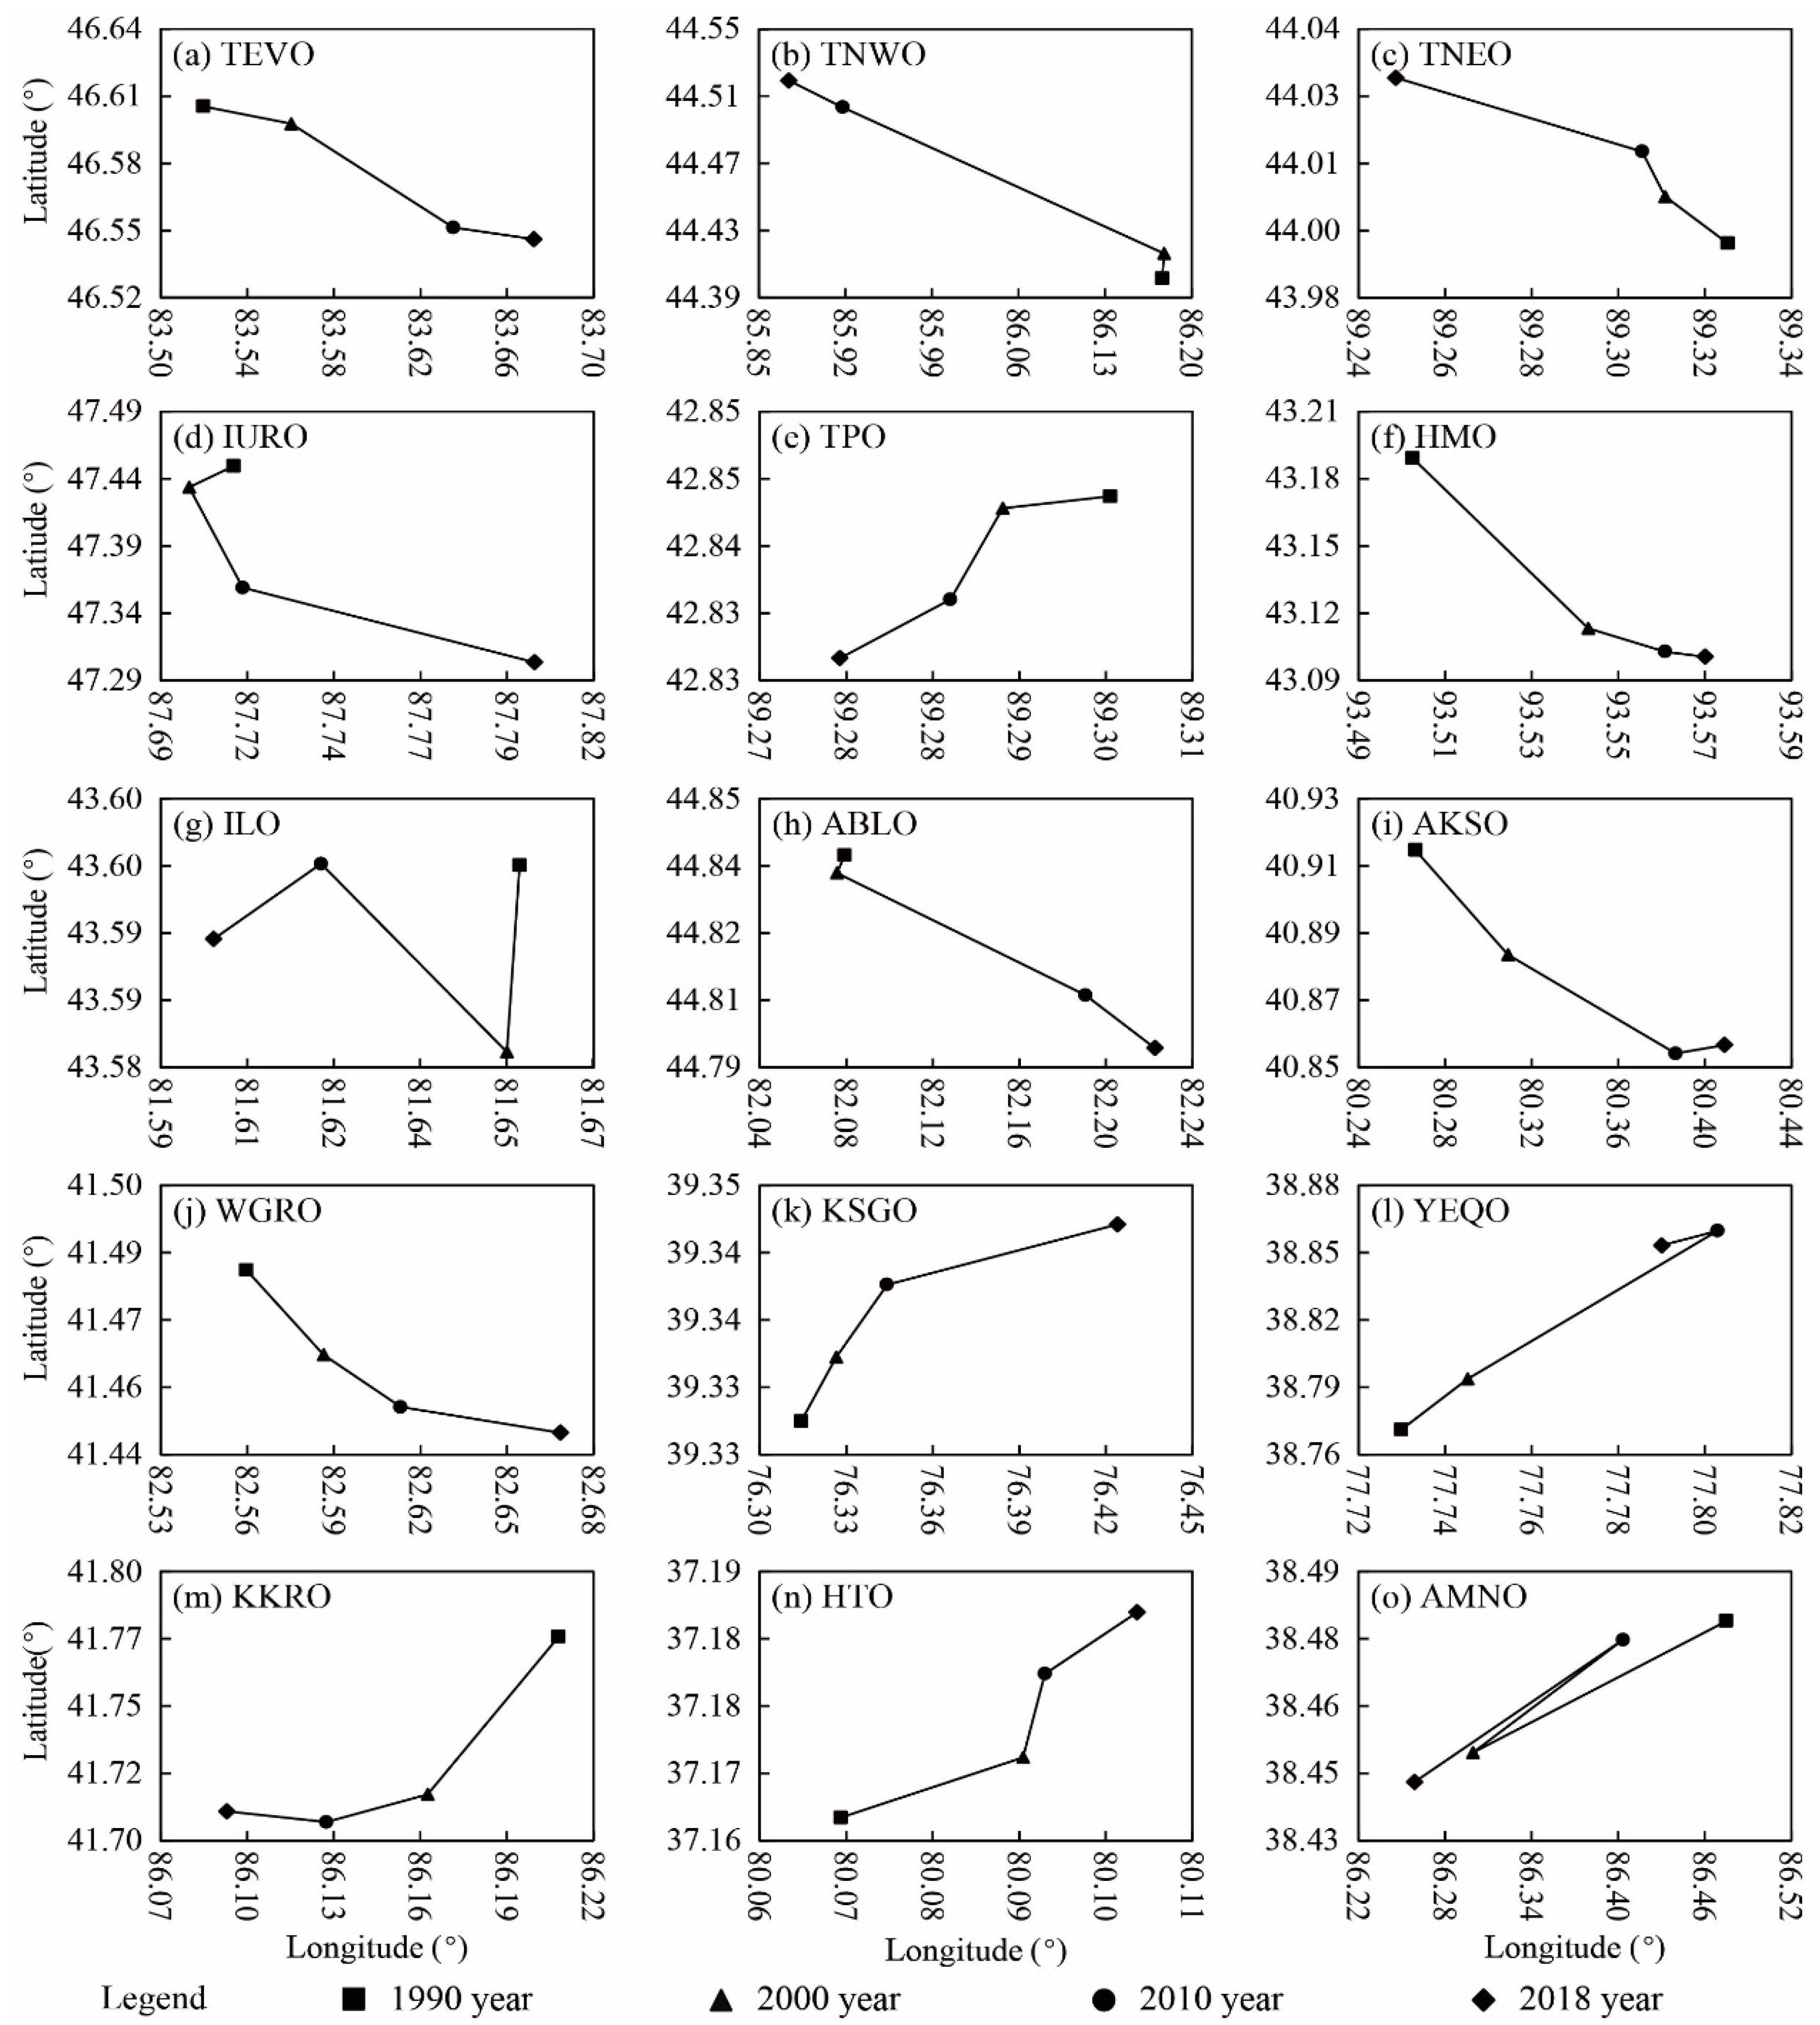
3.1.2. Spatial Process
3.2. Modes of Cropland Expansion
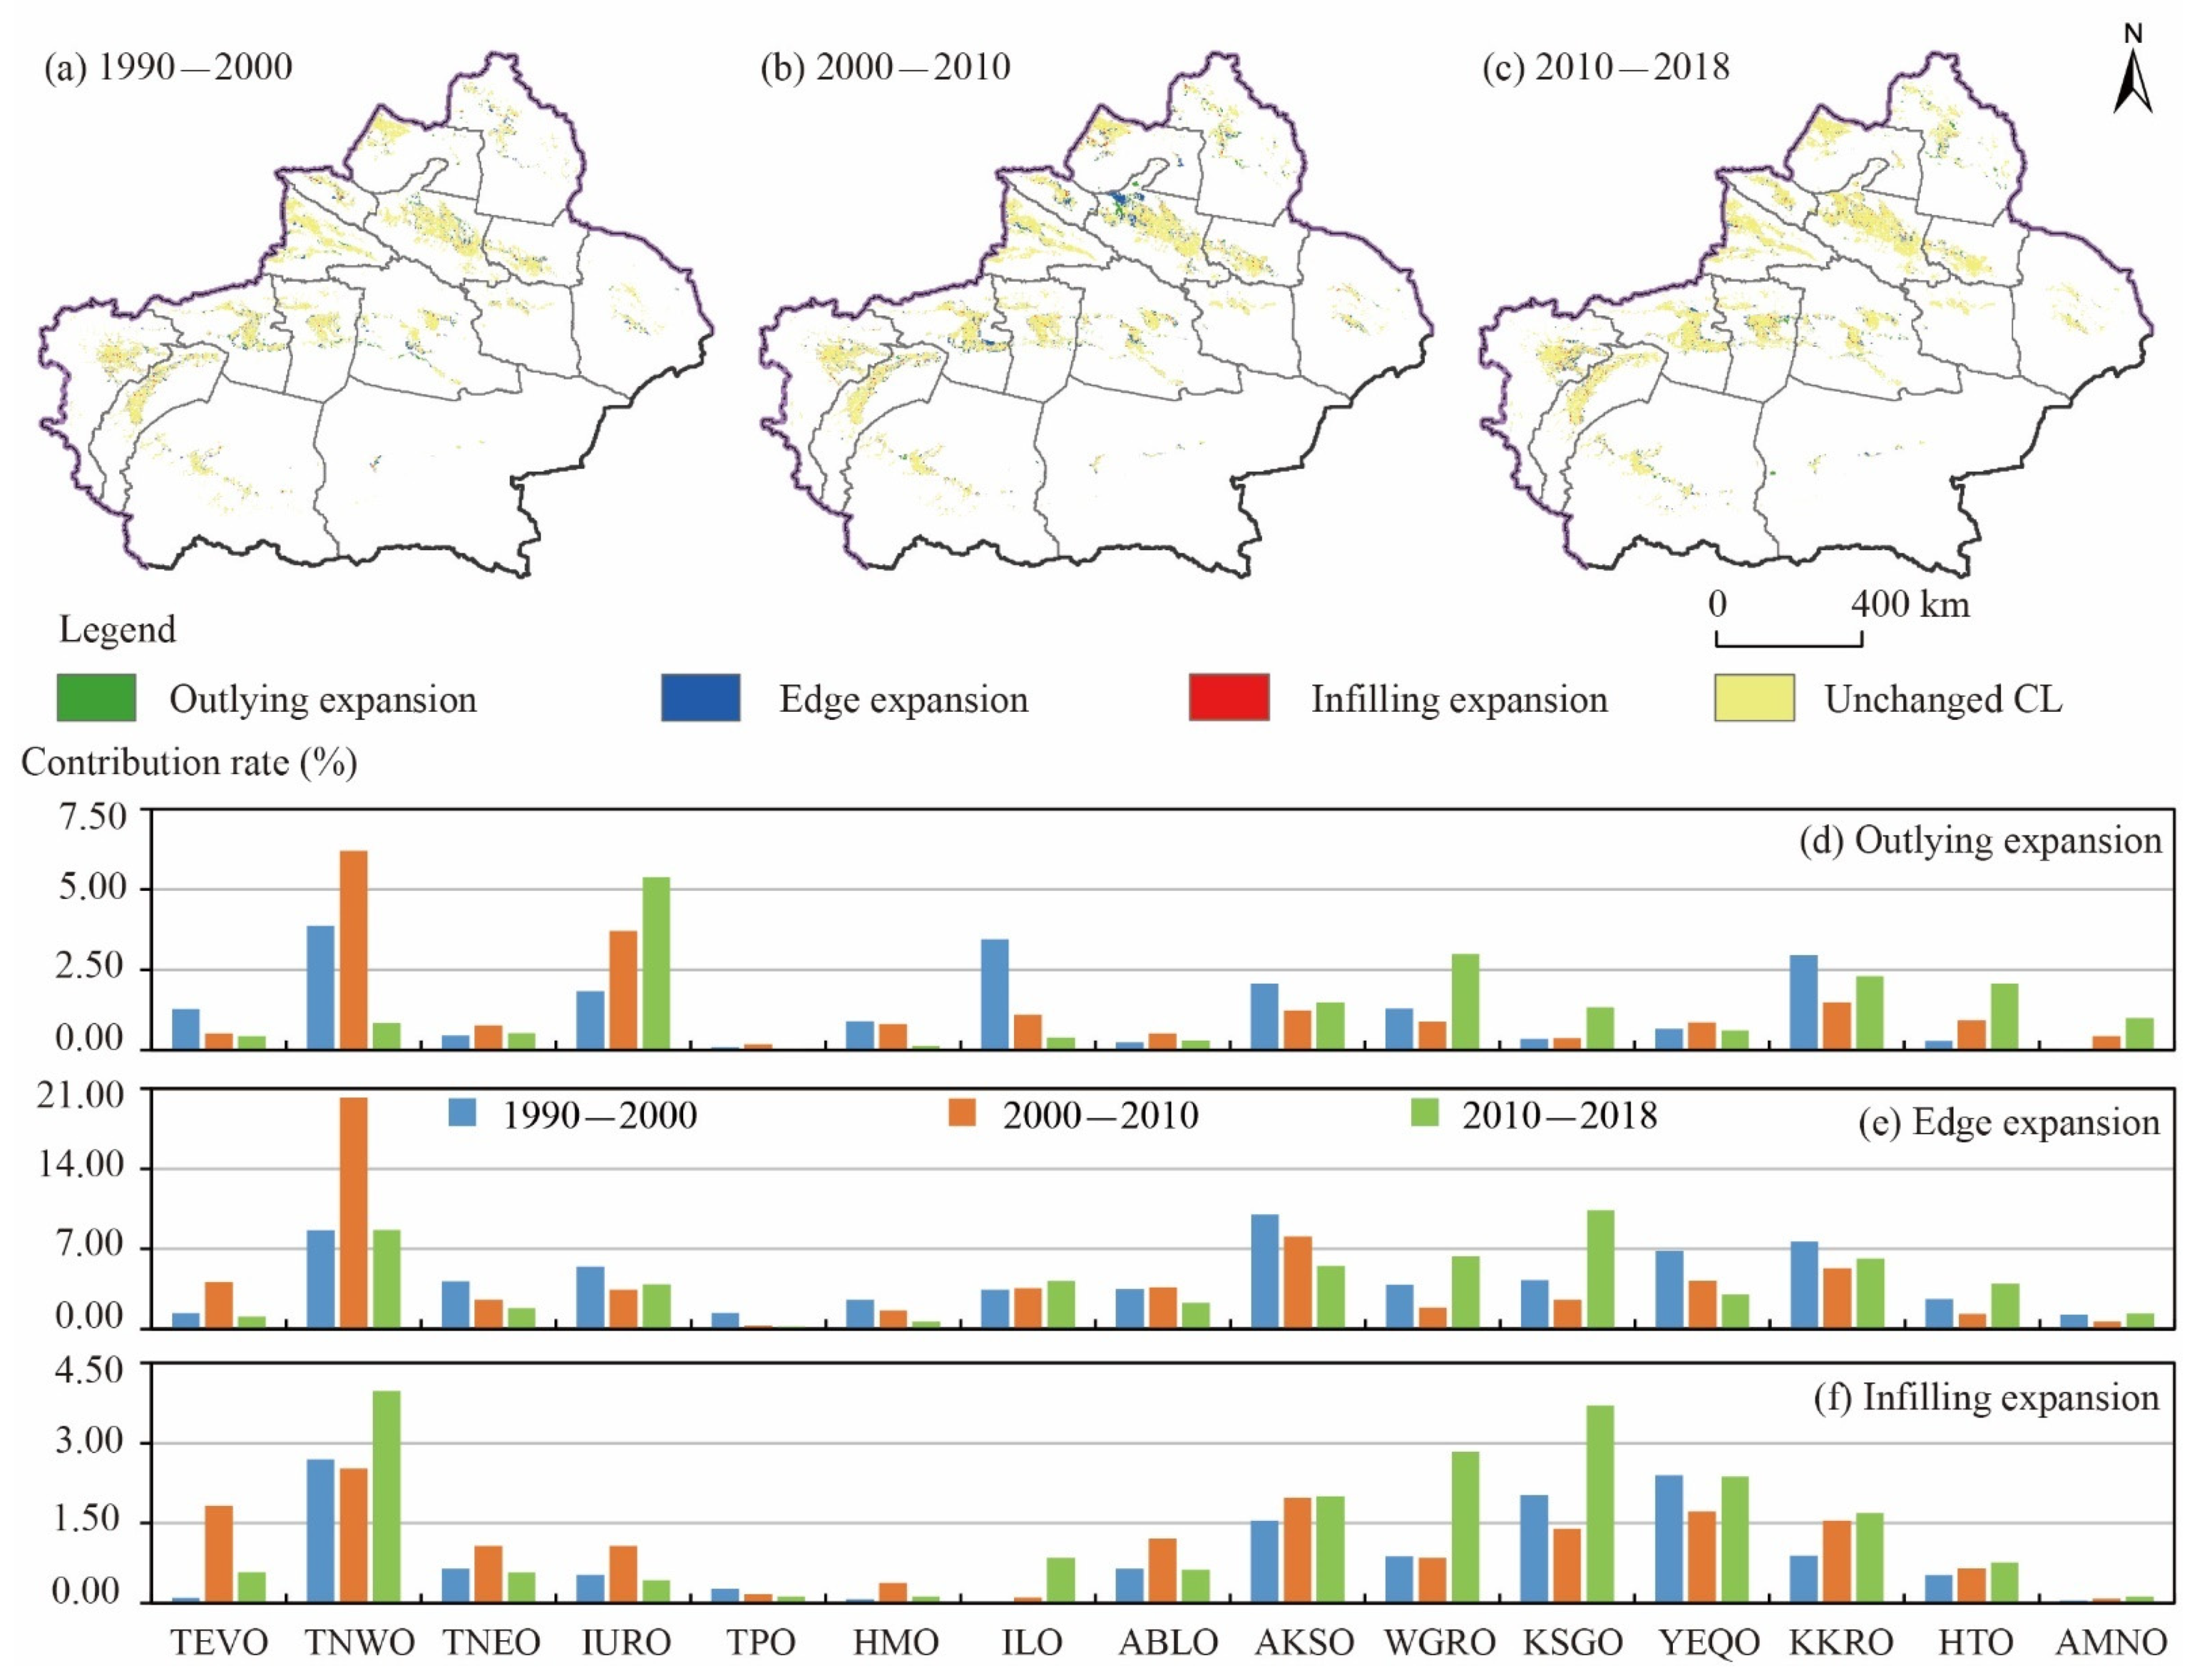
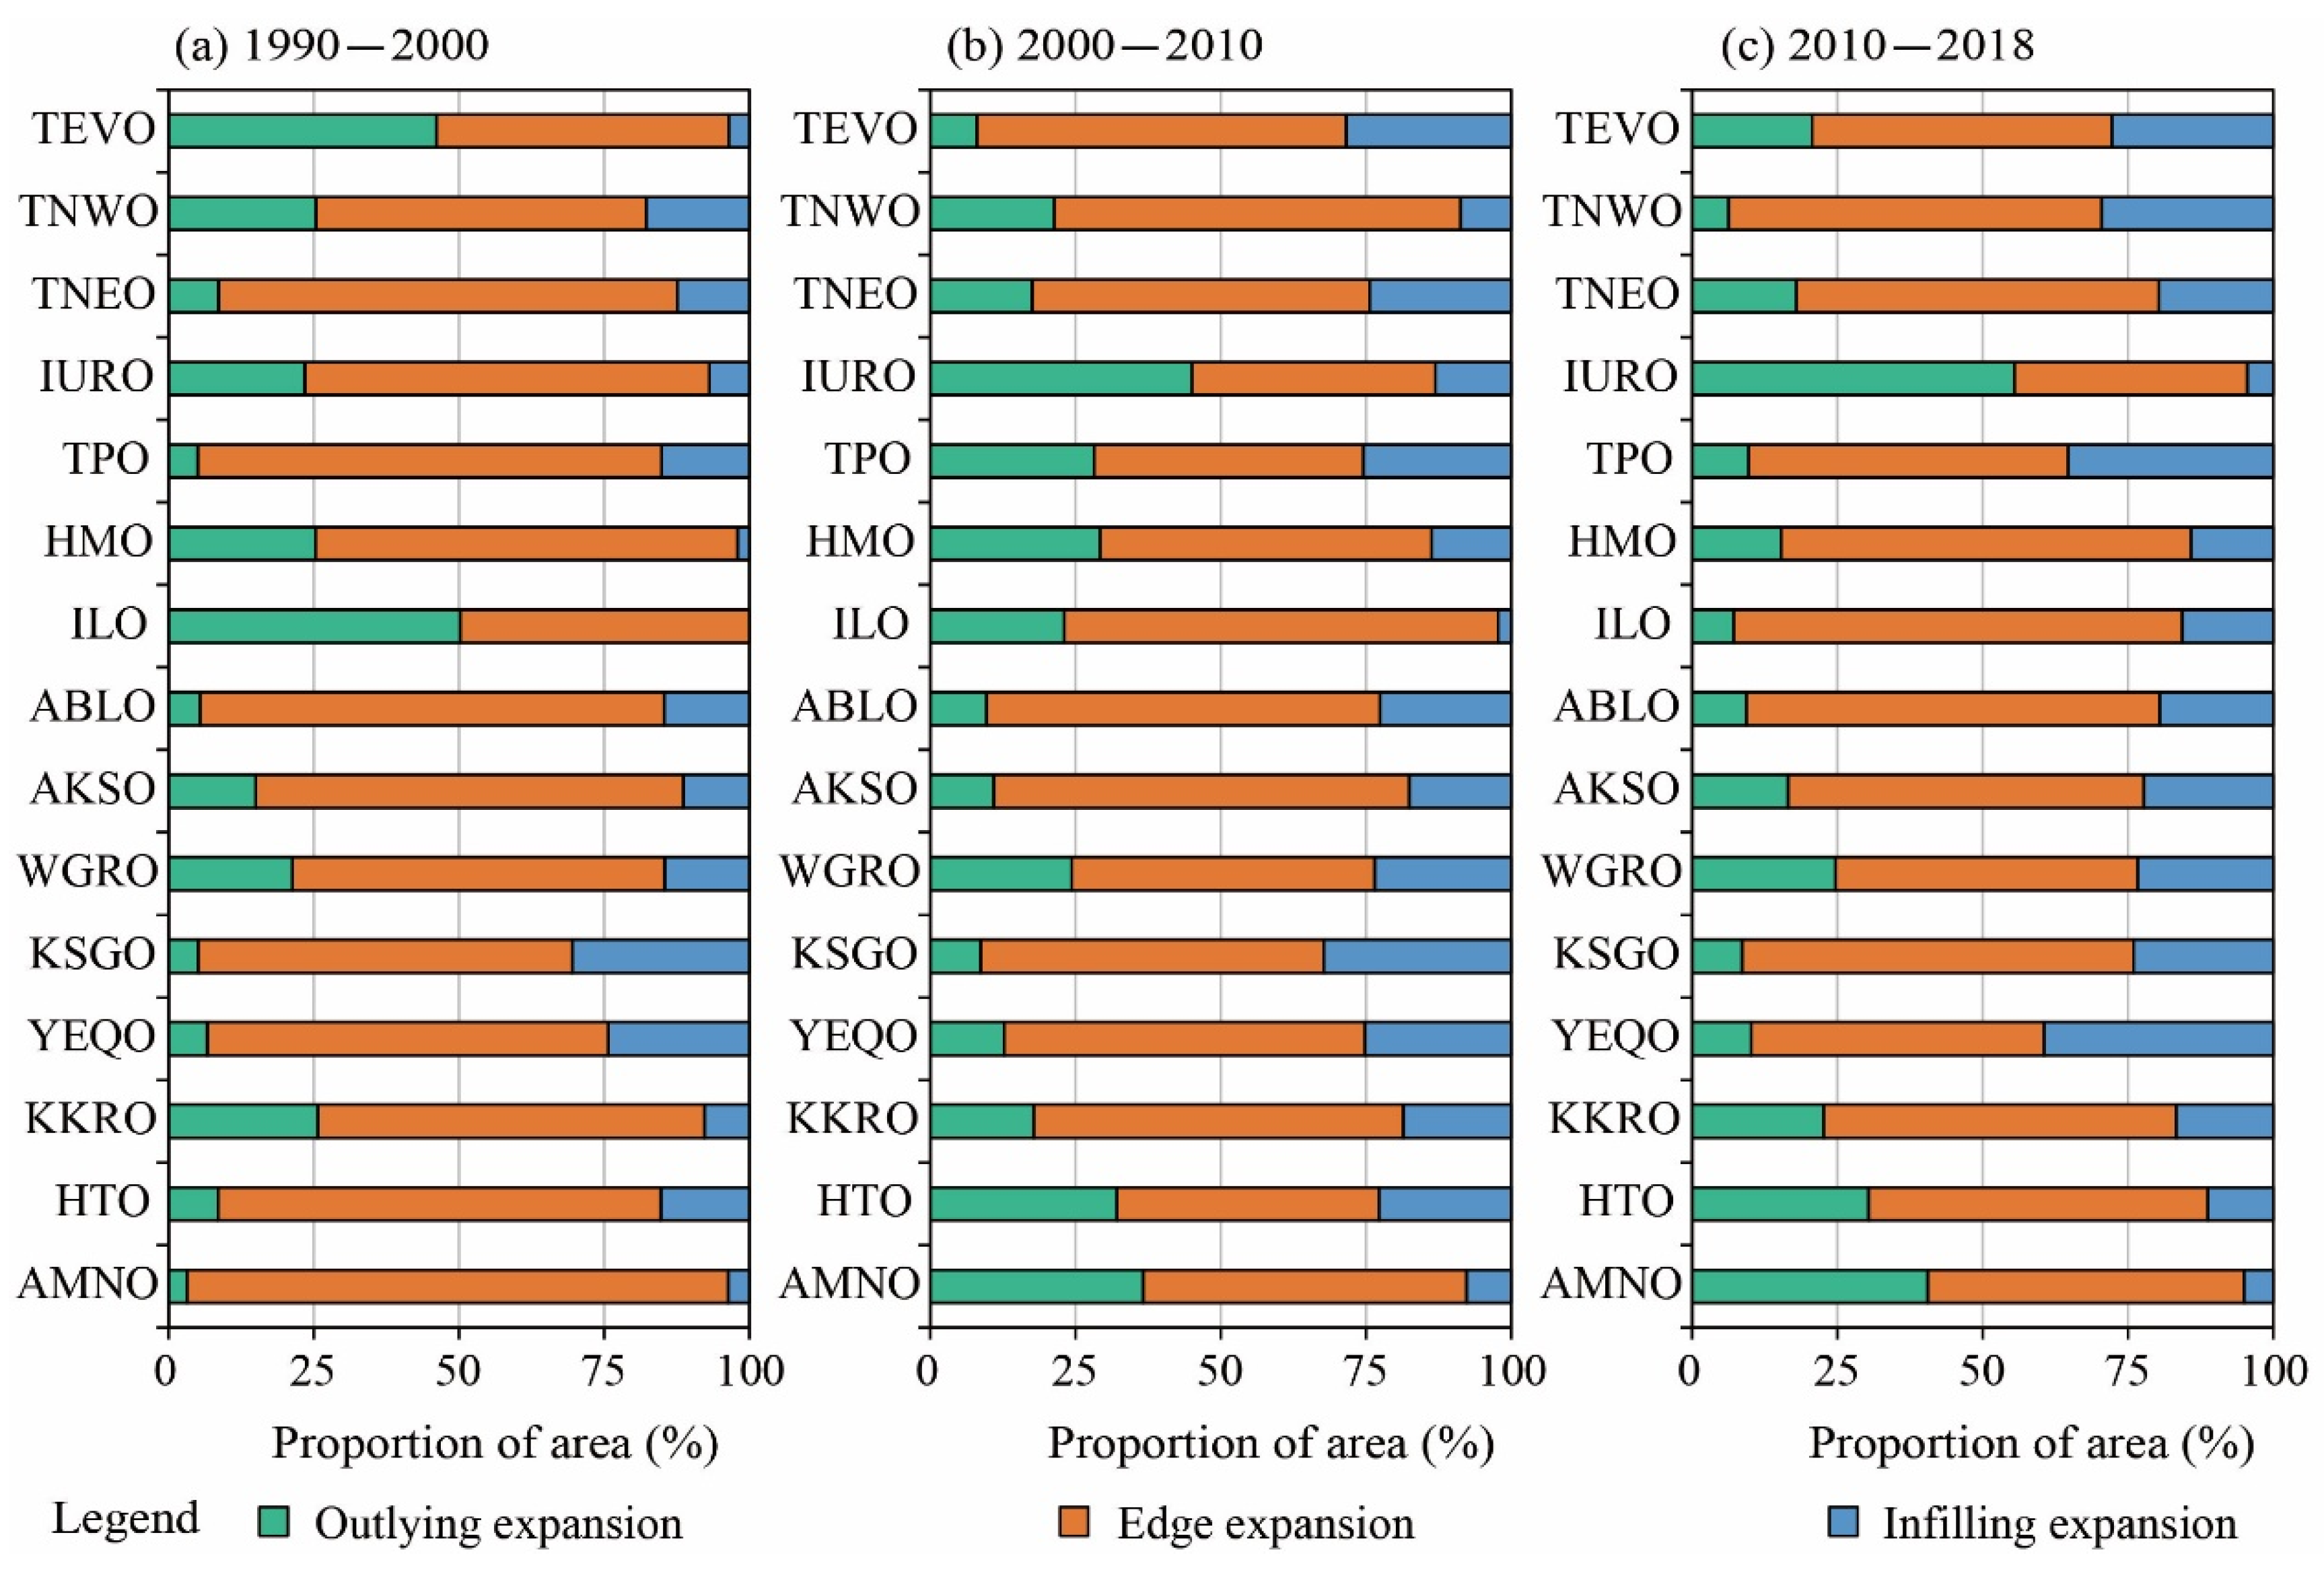
3.2.1. Spatial Patterns
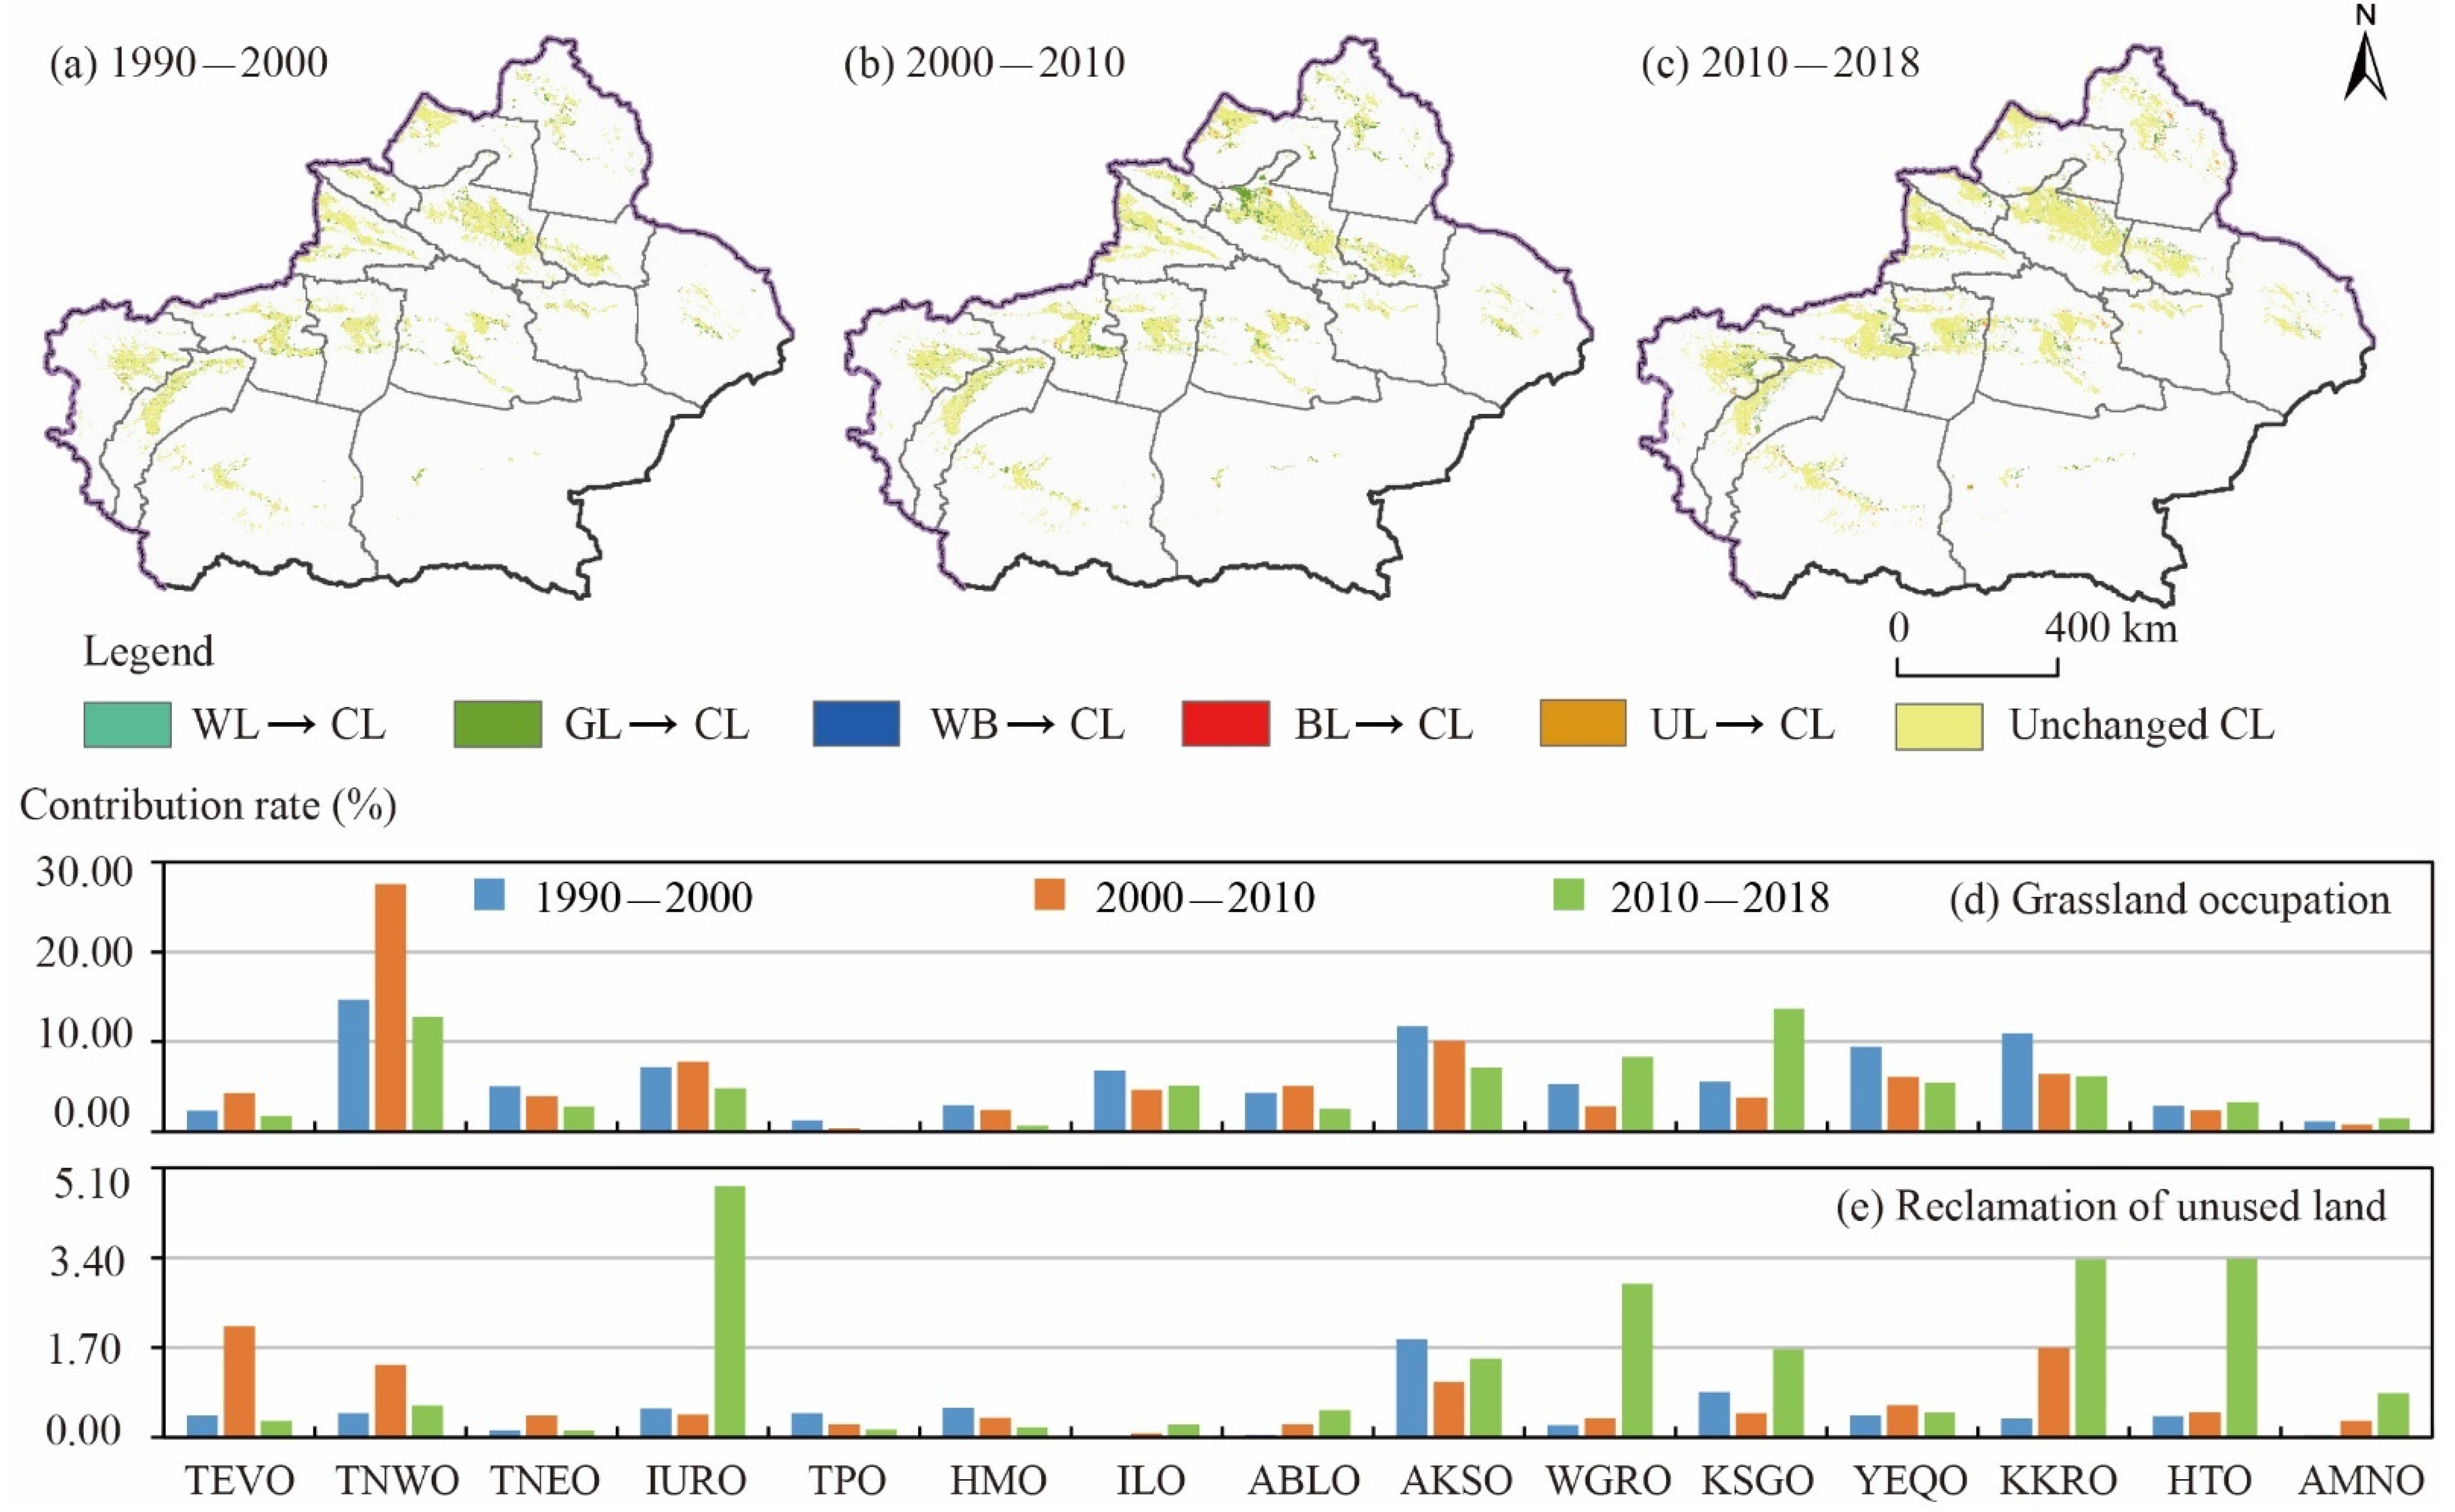
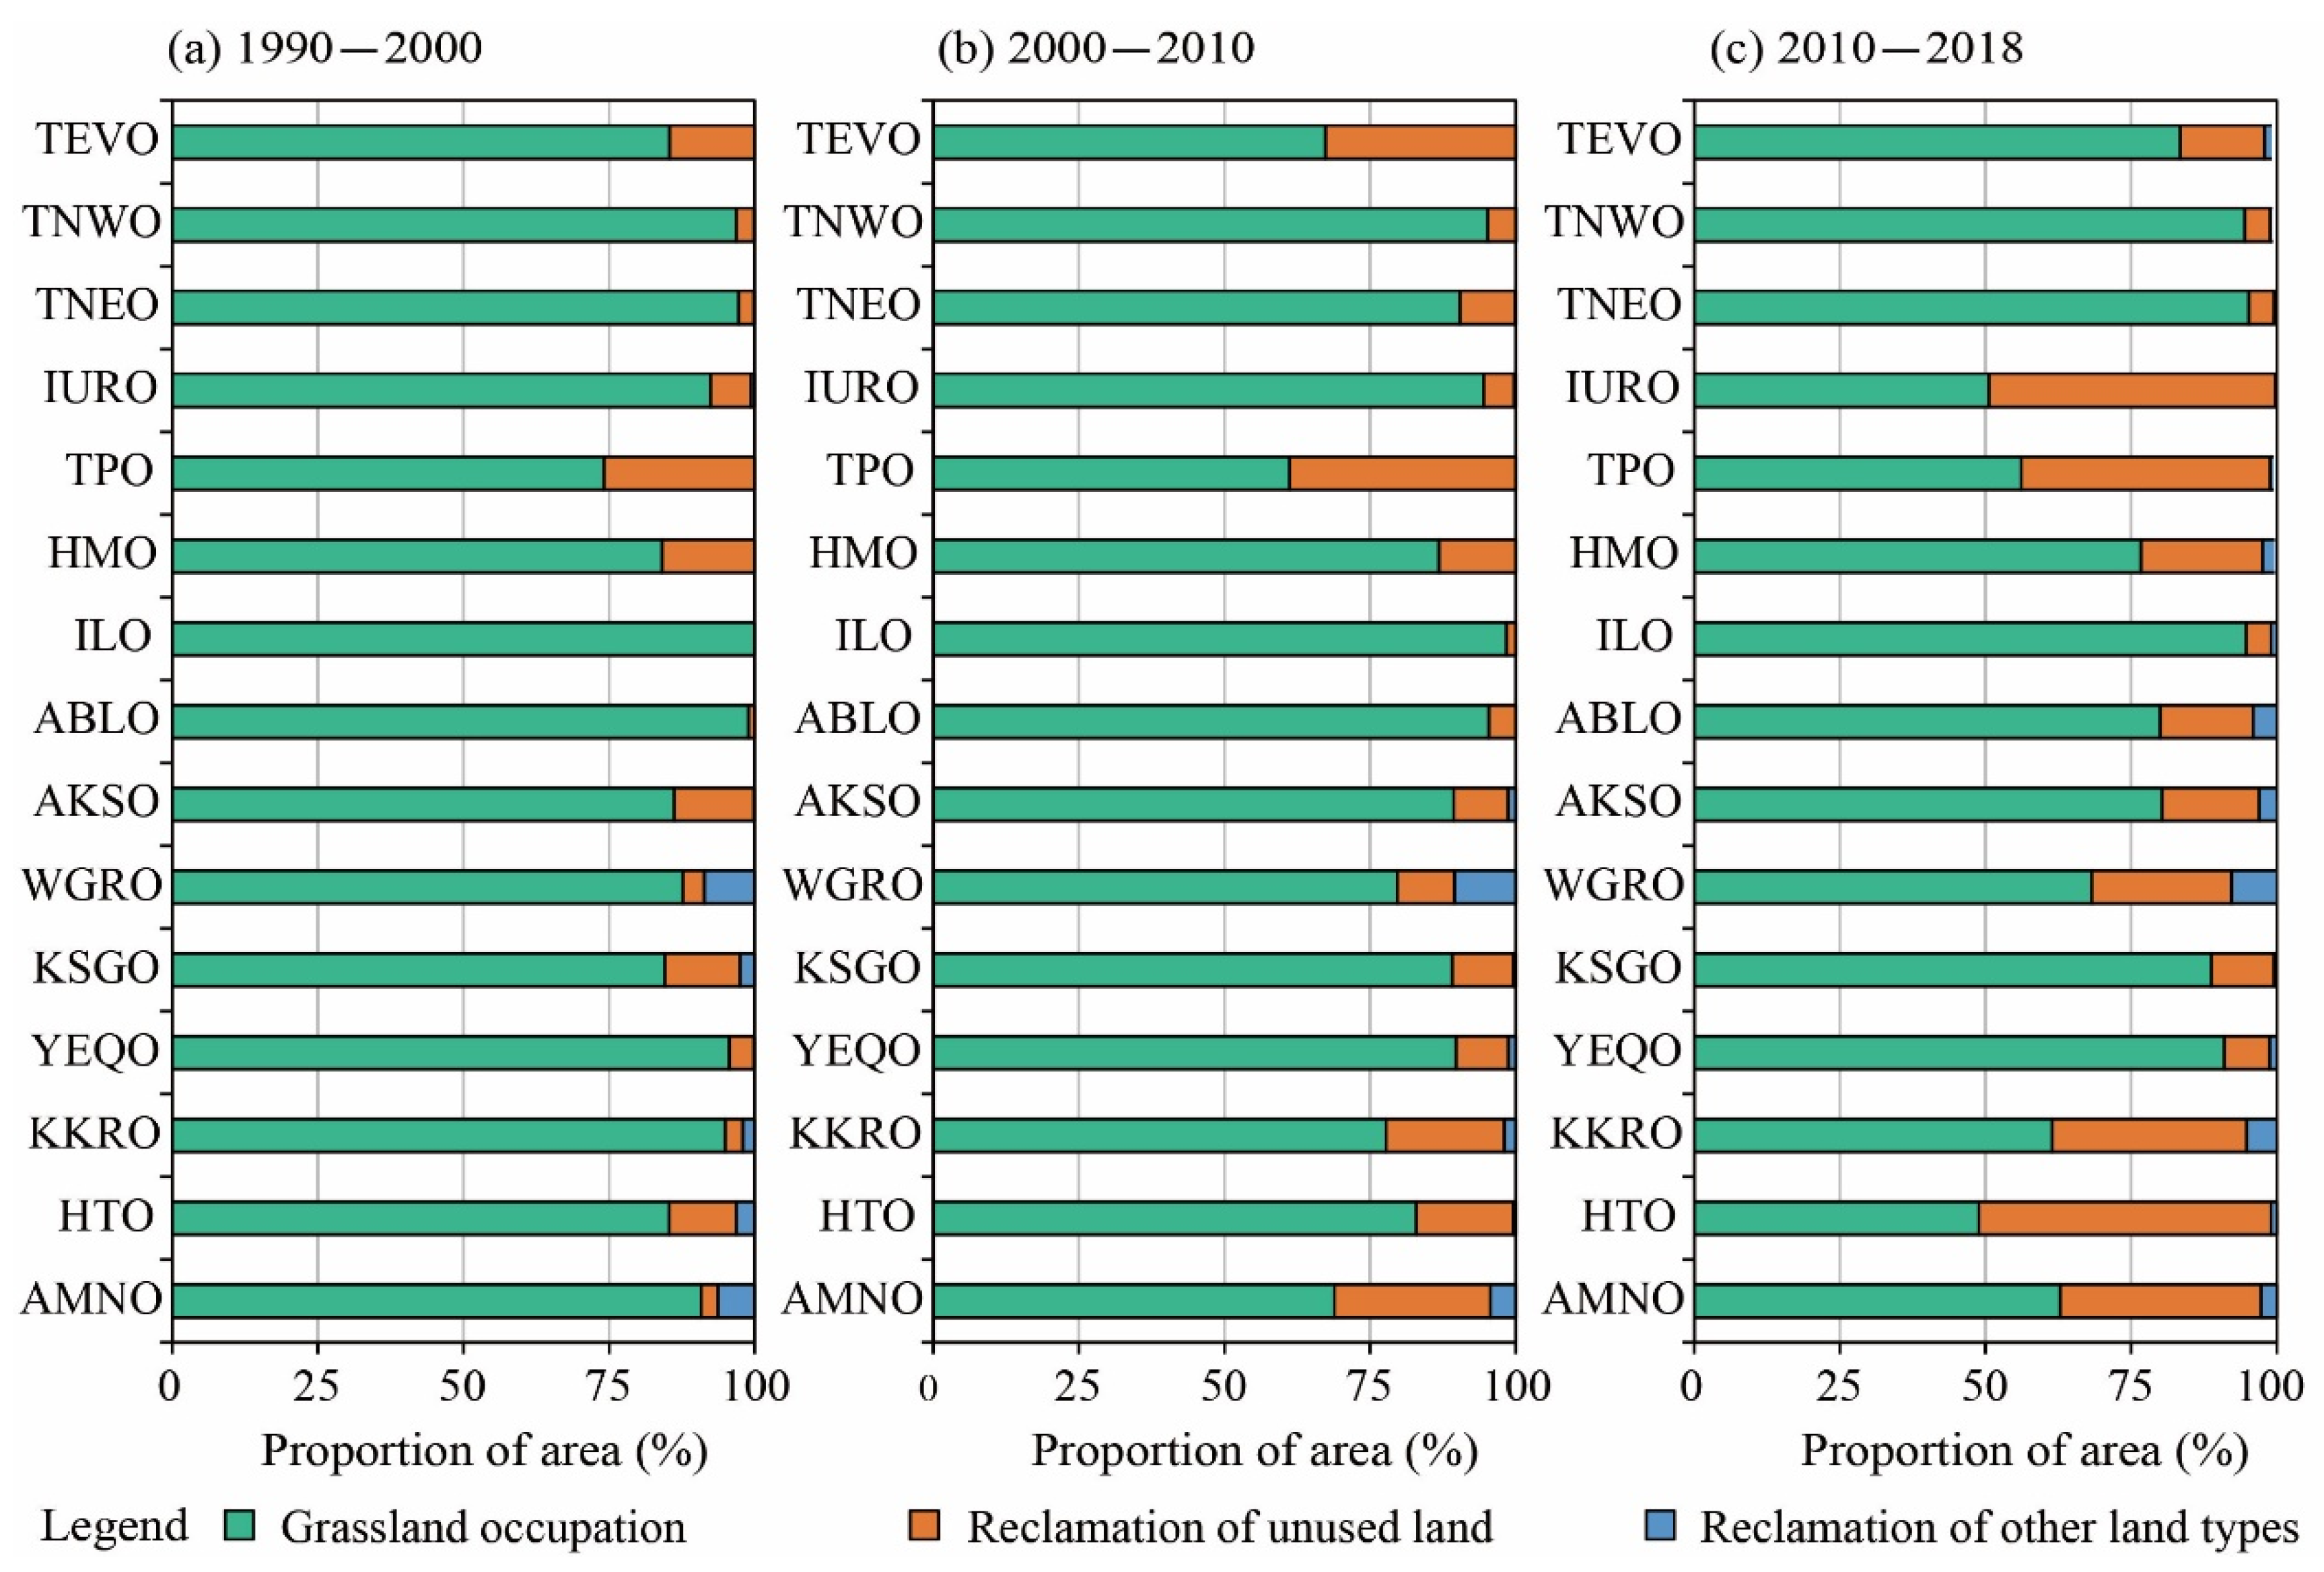
3.2.2. Land Use Conversion Patterns
3.3. Driving Forces of Cropland Expansion
3.3.1. The Scale of Xinjiang
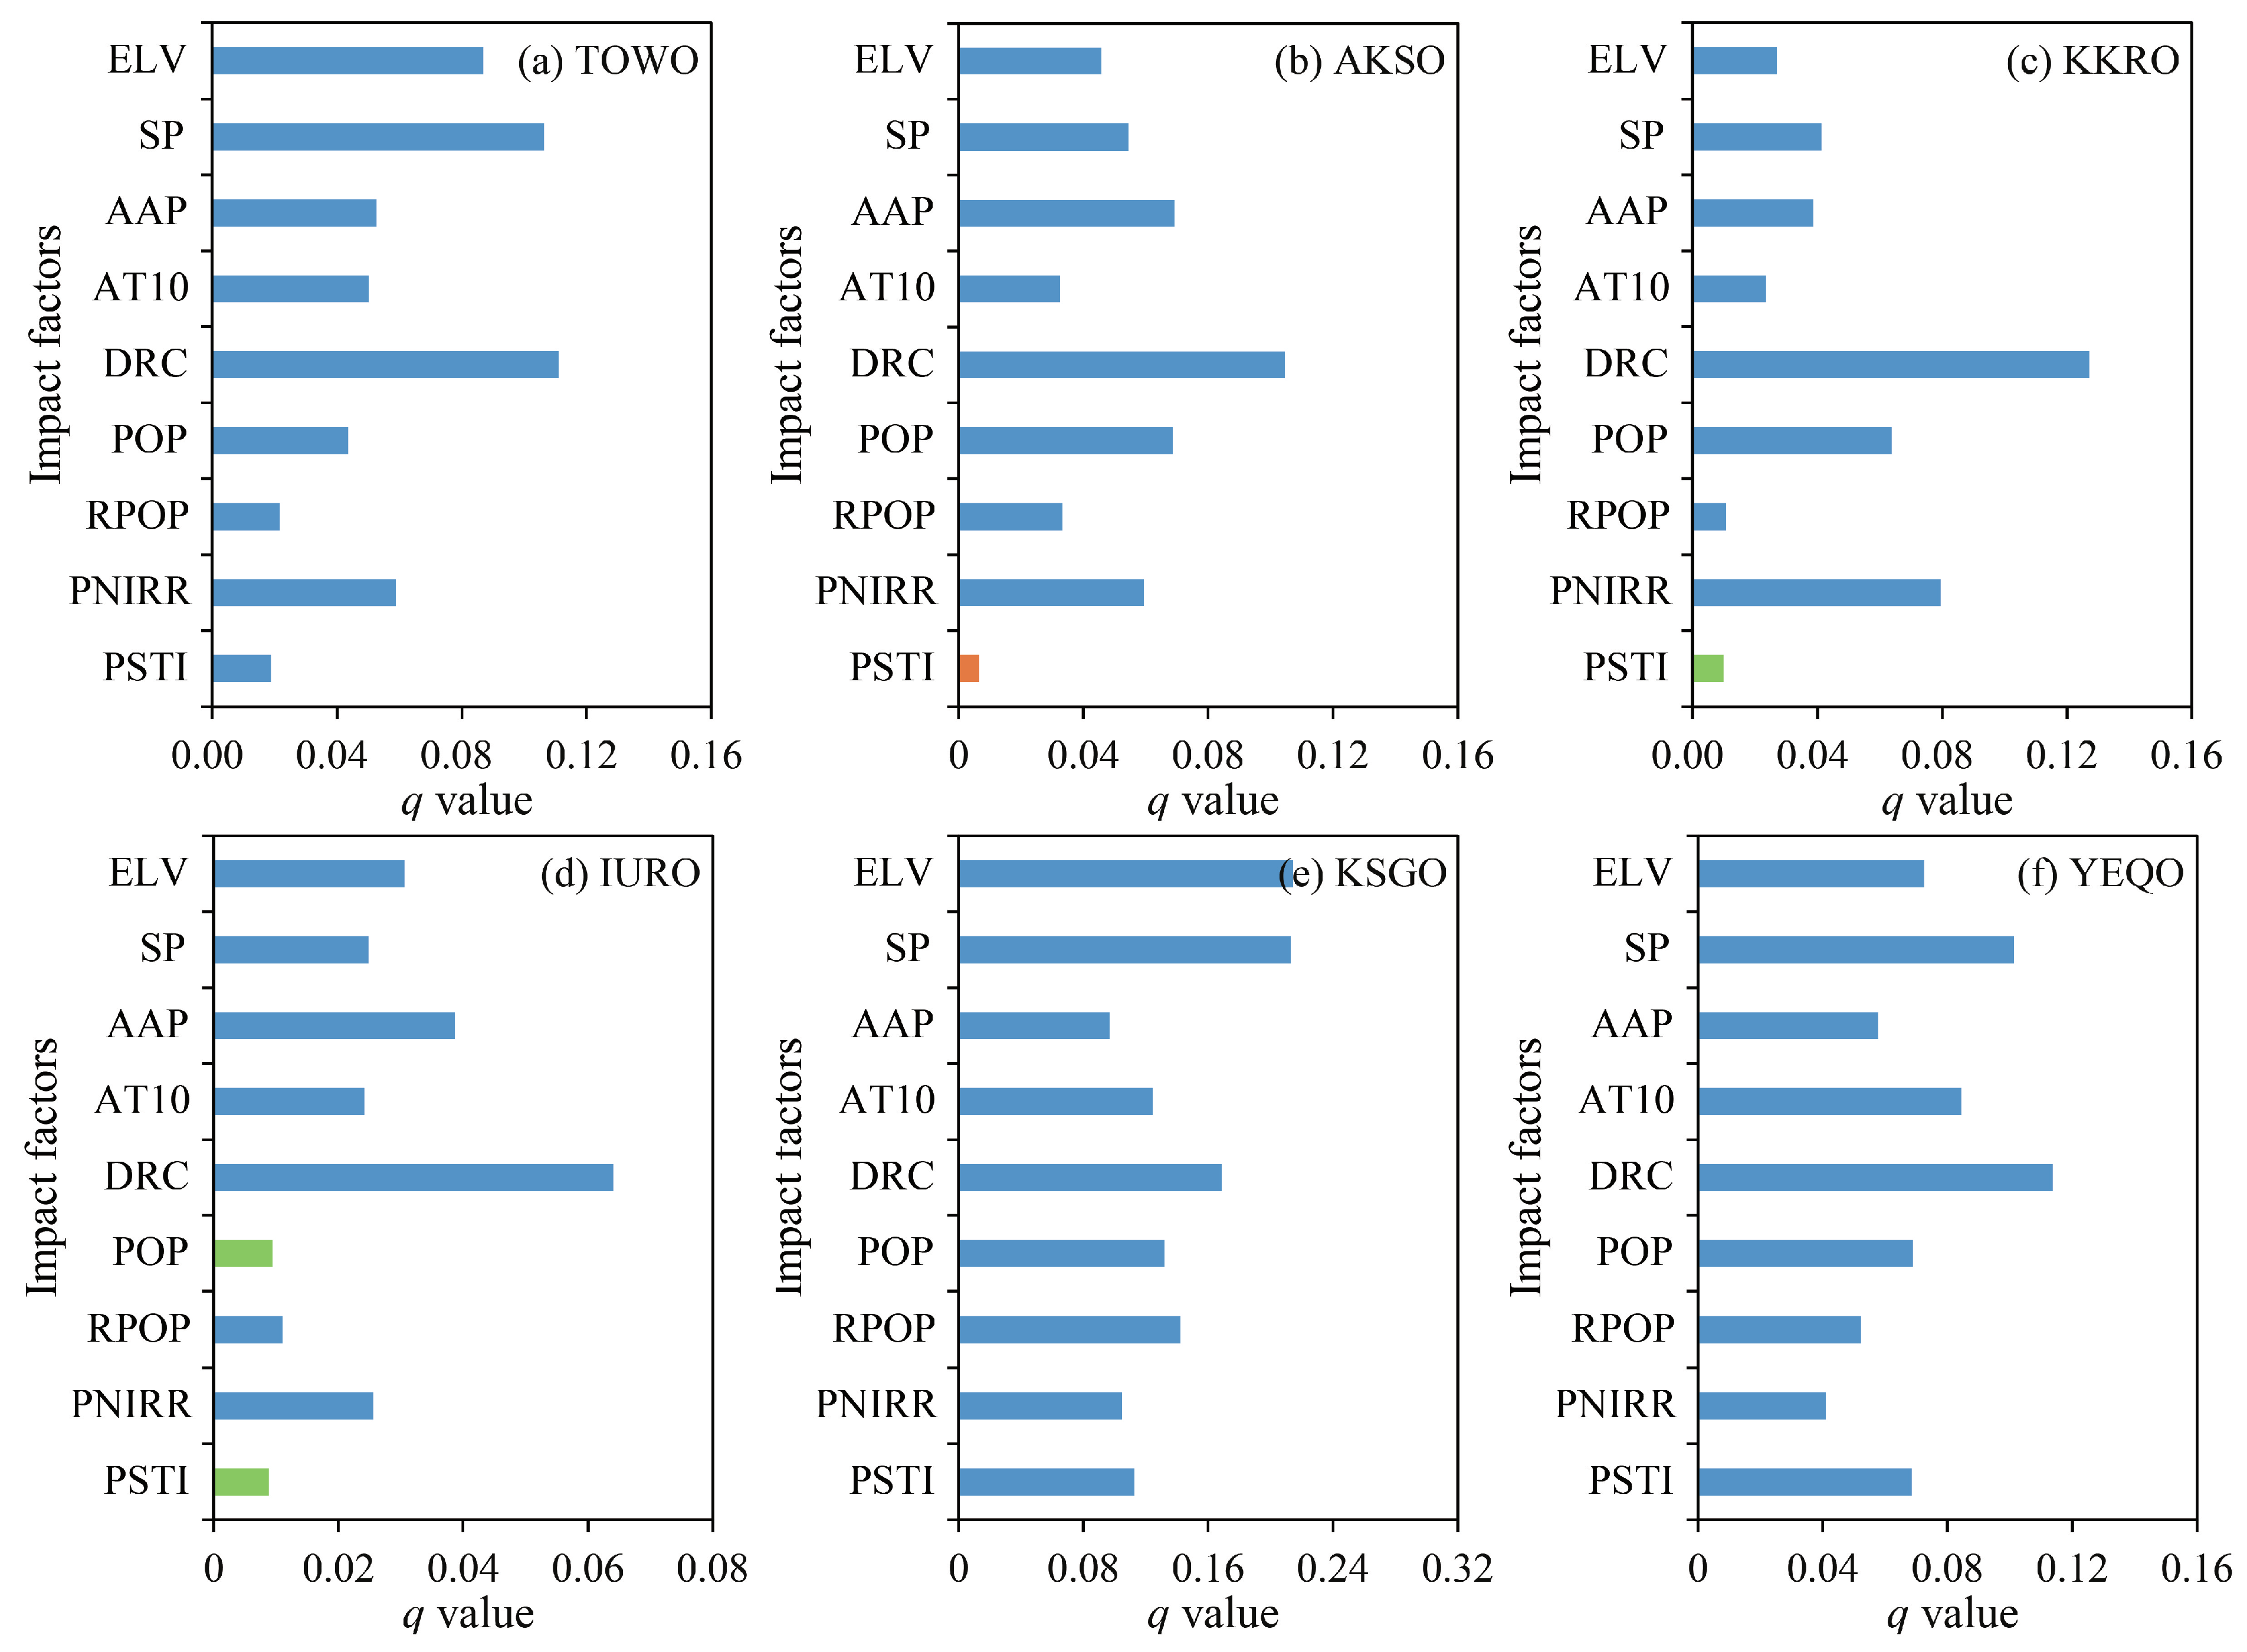
3.3.2. Typical Oasis Areas
4. Discussion
4.1. Comparison of the Research Results of This Article with Results of Other Studies
4.2. The Ecological Risks of Cropland Expansion in Xinjiang and the Enlightenment about Sustainable Management
4.3. Merits, Limitations and Prospects
5. Conclusions
- (1)
- Cropland in Xinjiang continued to expand, from 5802.89 thousand hectares in 1990 to 8938.54 thousand hectares in 2018, at the CLER of 1.93%, and experienced three stages of expansions: steady expansion, rapid expansion, and slow expansion. The shift of CGSDC in Xinjiang showed a characteristic of “slightly shifting toward southeast-leaping forward to northeast-moving back to southwest” in its trajectory. Divided by the “Qitai-Qira” line, the proportion of cropland in the southeast half and northwest half of Xinjiang stayed basically stable at 1:9, showing strong dynamic stability. The expansion of cropland in Xinjiang was dominated by edge expansion in terms of spatial patterns, while outlying expansion and infilling expansion coexisted. In terms of land use conversion, the expansion went through the transformation from a single mode dominated by encroachment on grassland to a dual development mode of encroachment on grassland and reclamation of unused land. The expansion of cropland in Xinjiang was affected by multiple factors. Irrigation conditions played a dominant role. Topography indirectly affected cropland expansion by affecting the suitability of agricultural production and development. Population growth and farmers’ income were important driving forces.
- (2)
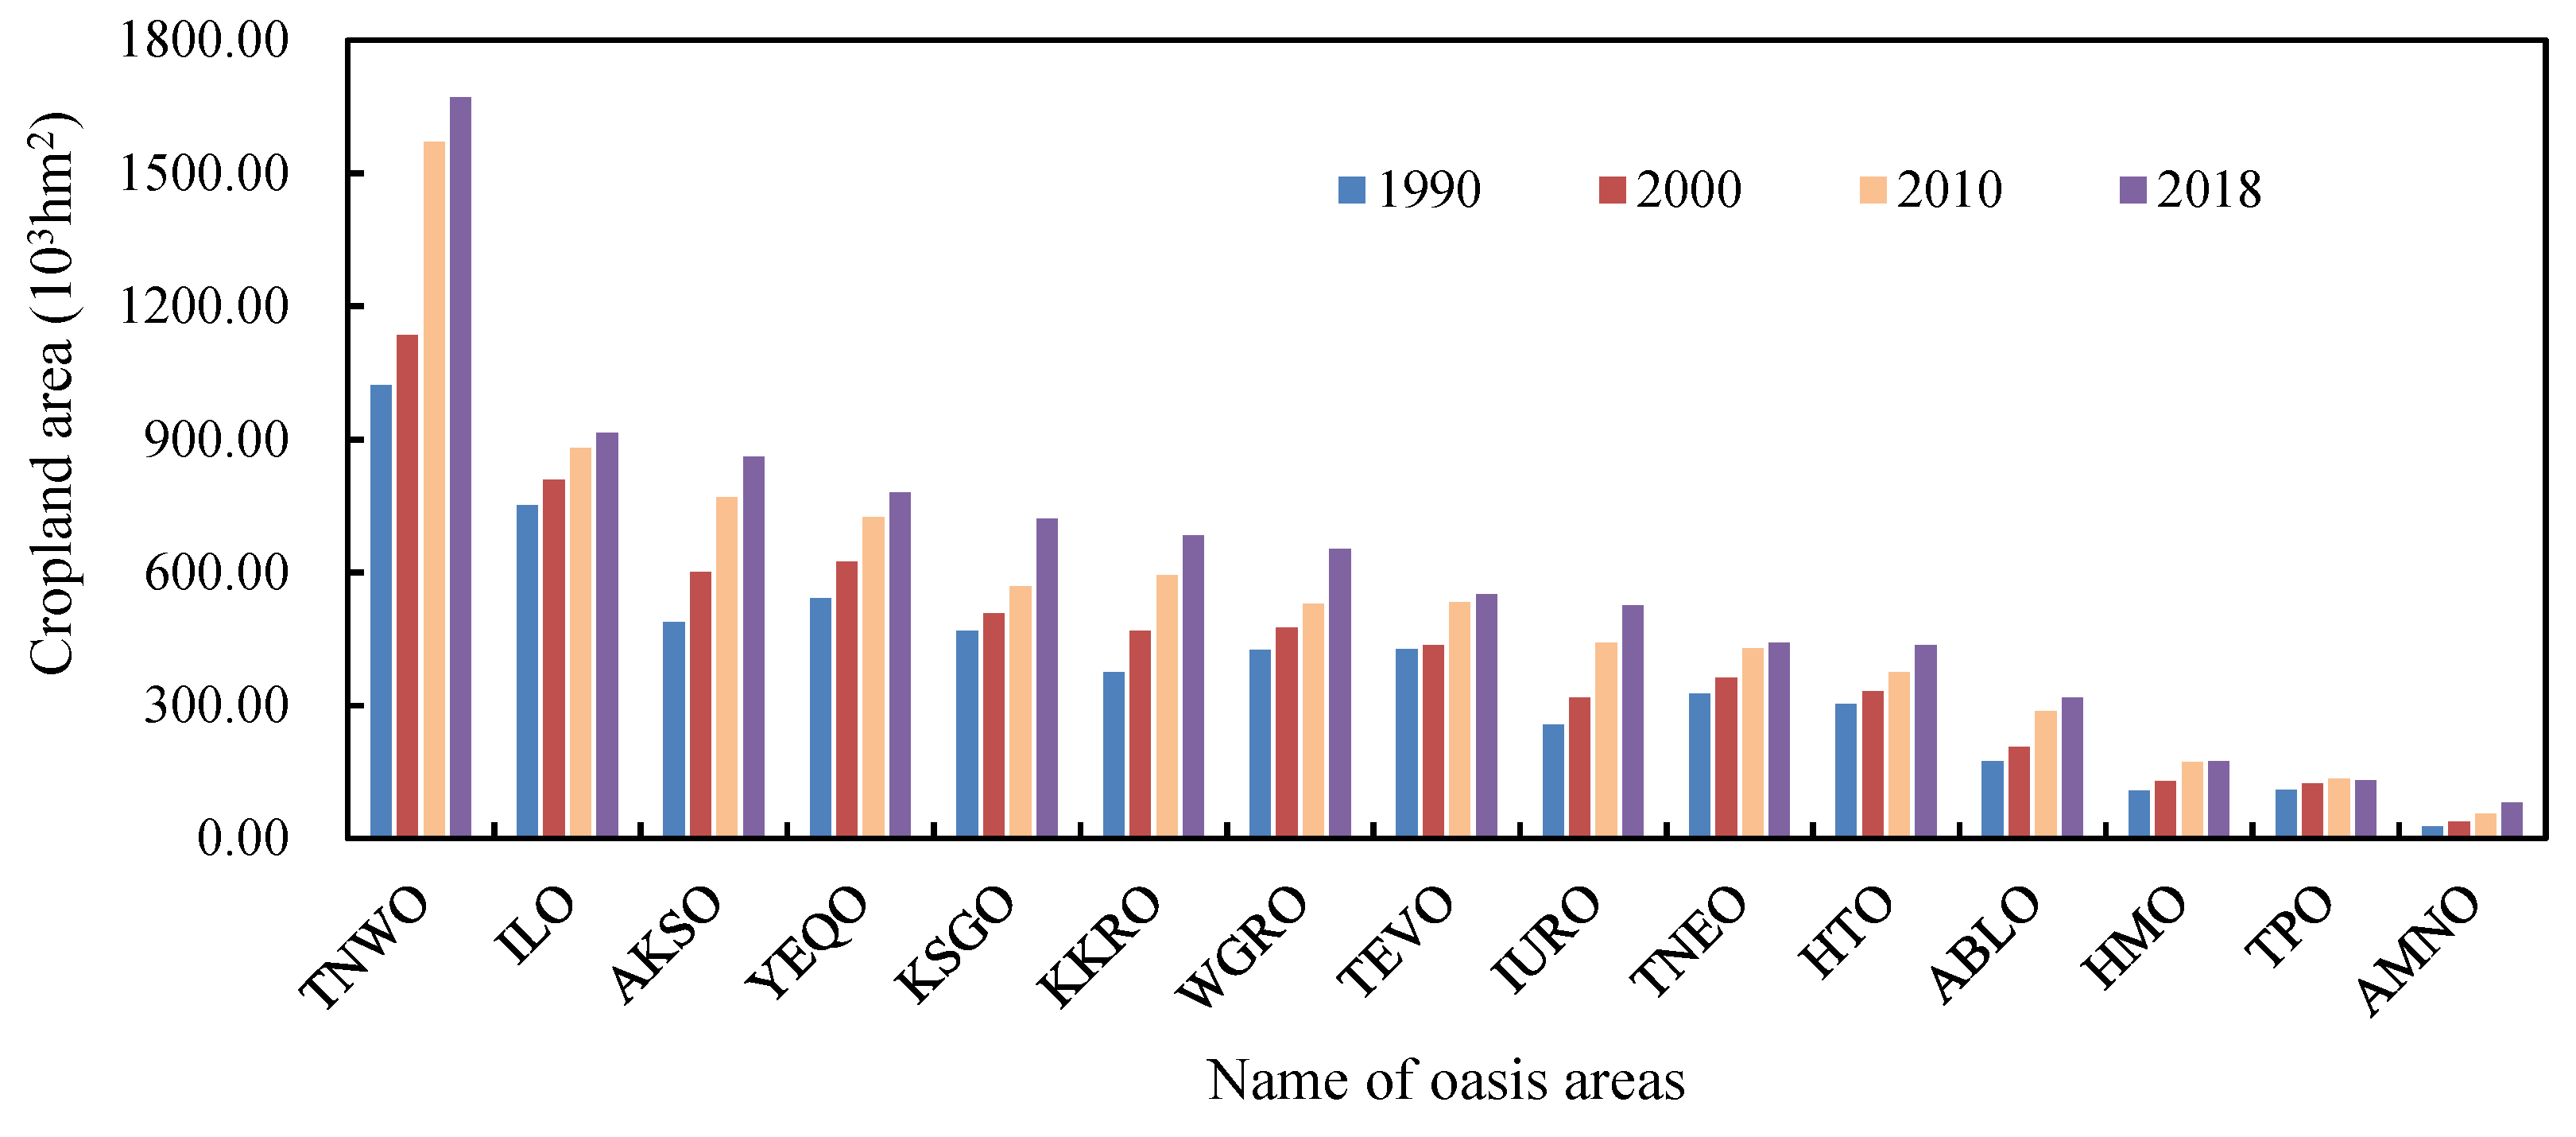
- From the perspective of different oasis areas in Xinjiang, there was obvious spatial heterogeneity in the expansion of cropland. During 1990–2018, cropland expanded with a high intensity in TNWO, AKSO, KKRO, IURO and KSGO, and at a high rate in AMNO, IURO, ABLO, KKRO and AKSO. The trajectory of the shift of the CGSDC in the oasis areas approximately showed C-shaped, linear and circuitous trends of change. The edge expansion mode and grassland occupation mode of TNSO, AKSO, KKRO and KSGO contributed prominently to Xinjiang’s new cropland. Topography was the dominant factor affecting the expansion of cropland in the KSGO, and irrigation conditions exerted the dominant influence in the other five typical oasis areas. In addition, the explanatory power of the population growth was more pronounced in the KSGO, YEQO and AKSO, while the explanatory power of the farmers’ income increase was more obvious in the TNWO, AKSO and KKRO.
- (3)
- The spatial shift of China’s new cropland was not only detrimental to the realization of long-term national goals for food security, but also occupied a large amount of water resources and ecological land in Xinjiang and exacerbated the vulnerability of the ecosystem in arid regions. The key to sustainable management of cropland in Xinjiang in the future lies in maintaining an appropriate scale of cropland in accordance with the principle of “determining land by water” and promoting the coordinated development of cropland, population, water resources and industry.
Author Contributions
Funding
Data Availability Statement
Conflicts of Interest
Abbreviations
| Type | Item | Descriptions |
| Name of oasis district | TEVO | Tacheng-Emin Valley Oasis area |
| TNWO | Tianshan North Slope West Oasis area | |
| TNEO | Tianshan North Slope East Oasis area | |
| IURO | Irtysh-Ulungu River Oasis area | |
| ILO | Ili Oasis area | |
| ABLO | Aibi Lake Oasis area | |
| TPO | Turpan Oasis area | |
| HMO | Hami Oasis area | |
| AKSO | Aksu Oasis area | |
| WGRO | Weigan River Oasis area | |
| KSGO | Kashgar Oasis area | |
| YEQO | Yerqiang Oasis area | |
| KKRO | Kaidu-Kongque River Oasis area | |
| HTO | Hotan Oasis area | |
| AMNO | Altun Mountain North Oasis area | |
| Influencing factors | ELV | Elevation |
| SP | Slope | |
| AAP | Annual average precipitation | |
| AT10 | >10 °C accumulated temperature | |
| DRC | Distance to rivers or canals | |
| TPOP | Total population | |
| RPOP | Rural population | |
| PNIRR | Per capita net income of rural residents | |
| PSTI | Proportion of secondary and tertiary industries | |
| Others | TM | Thematic mapper |
| OLI | Operational land imager | |
| CLNCA | cropland net change area | |
| CLER | cropland expansion rate | |
| CLEI | cropland expansion intensity | |
| CGSDC | the center of gravity of the spatial distribution of cropland | |
| LEI | the landscape expansion index | |
| RESDC | the Resource and Environment Science and Data Center of the Chinese Academy of Sciences |
Appendix A

References
- United Nations, Department of Economic and Social Affairs. Population Division World Population Prospects 2019; Highlights: New York, NY, USA, 2019. [Google Scholar]
- Smith, P. Managing the global land resource. Proc. R. Soc. Lond. B Biol. Sci. 2018, 285, 1–9. [Google Scholar] [CrossRef] [PubMed] [Green Version]
- Foley, J.A.; Ramankutty, N.; Brauman, K.A.; Cassidy, E.S.; Gerber, J.S.; Johnston, M.; Mueller, N.D.; O’Connell, C.; Ray, D.K.; West, P.C.; et al. Solutions for a cultivated planet. Nature 2011, 478, 337–342. [Google Scholar] [CrossRef] [PubMed] [Green Version]
- Godfray, H.C.; Beddington, J.R.; Crute, I.R.; Haddad, L.; Lawrence, D.; Muir, J.F.; Pretty, J.; Robinson, S.; Thomas, S.M.; Toulmin, C. Food security: The challenge of feeding 9 billion people. Science 2010, 327, 812–818. [Google Scholar] [CrossRef] [Green Version]
- Wirsenius, S.; Azar, C.; Berndes, G. How much land is needed for global food production under scenarios of dietary changes and livestock productivity increases in 2030? Agric. Syst. 2010, 103, 621–638. [Google Scholar] [CrossRef]
- Alexander, P.; Rounsevell, M.D.A.; Dislich, C.; Dodson, J.R.; Engström, K.; Moran, D. Drivers for global agricultural land use change: The nexus of diet, population, yield and bioenergy. Glob. Environ. Chang. 2015, 35, 138–147. [Google Scholar] [CrossRef] [Green Version]
- Ramankutty, N.; Mehrabi, Z.; Waha, K.; Jarvis, L.; Kremen, C.; Herrero, M.; Rieseberg, L.H. Trends in Global Agricultural Land Use: Implications for Environmental Health and Food Security. Annu. Rev. Plant. Biol. 2018, 69, 789–815. [Google Scholar] [CrossRef] [Green Version]
- Song, X.P.; Hansen, M.C.; Stehman, S.V.; Potapov, P.V.; Tyukavina, A.; Vermote, E.F.; Townshend, J.R. Global land change from 1982 to 2016. Nature 2018, 560, 639–643. [Google Scholar] [CrossRef]
- Gibbs, H.K.; Ruesch, A.S.; Achard, F.; Clayton, M.K.; Holmgren, P.; Ramankutty, N.; Foley, J.A. Tropical forests were the primary sources of new agricultural land in the 1980s and 1990s. Proc. Natl. Acad. Sci. USA 2010, 107, 16732–16737. [Google Scholar] [CrossRef] [Green Version]
- Zalles, V.; Hansen, M.C.; Potapov, P.V.; Parker, D.; Stehman, S.V.; Pickens, A.H.; Parente, L.L.; Ferreira, L.G.; Song, X.-P.; Hernandez-Serna, A.; et al. Rapid expansion of human impact on natural land in South America since 1985. Sci. Adv. 2021, 7, 1–11. [Google Scholar] [CrossRef]
- Laurance, W.F.; Jeffrey, S.; Cassman, K.G. Agricultural expansion and its impacts on tropical nature. Trends Ecol. Evol. 2014, 29, 107–116. [Google Scholar] [CrossRef]
- Pendrill, F.; Persson, U.M. Combining global land cover datasets to quantify agricultural expansion into forests in Latin America: Limitations and challenges. PLoS ONE 2017, 12, e0181202. [Google Scholar] [CrossRef] [PubMed]
- Jellason, N.P.; Robinson, E.J.Z.; Chapman, A.S.A.; Neina, D.; Devenish, A.J.M.; Po, J.Y.T.; Adolph, B. A Systematic Review of Drivers and Constraints on Agricultural Expansion in Sub-Saharan Africa. Land 2021, 10, 332. [Google Scholar] [CrossRef]
- Desta, H.; Fetene, A. Land-use and land-cover change in Lake Ziway watershed of the Ethiopian Central Rift Valley Region and its environmental impacts. Land Use Policy 2020, 96, 104682. [Google Scholar] [CrossRef]
- Knauer, K.; Gessner, U.; Fensholt, R.; Forkuor, G.; Kuenzer, C. Monitoring Agricultural Expansion in Burkina Faso over 14 Years with 30 m Resolution Time Series: The Role of Population Growth and Implications for the Environment. Remote Sens. 2017, 9, 132. [Google Scholar] [CrossRef] [Green Version]
- Qi, X.; Zhang, Z.; Huang, X. The contradiction of cultivated land protection in the new era and its innovative countermeasures. China Land Sci. 2018, 32, 9–15. [Google Scholar]
- Liu, F.; Zhang, Z.; Zhao, X.; Wang, X.; Zuo, L.; Wen, Q.; Yi, L.; Xu, J.; Hu, S.; Liu, B. Chinese cropland losses due to urban expansion in the past four decades. Sci. Total Environ. 2019, 650, 847–857. [Google Scholar] [CrossRef]
- Long, H.; Ge, D.; Zhang, Y.; Tu, S.; Qu, Y.; Ma, L. Changing man-land interrelations in China’s farming area under urbanization and its implications for food security. J. Environ. Manag. 2018, 209, 440–451. [Google Scholar] [CrossRef]
- Ju, H.; Zhang, Z.; Zhao, X.; Wang, X.; Wu, W.; Yi, L.; Wen, Q.; Liu, F.; Xu, J.; Hu, S.; et al. The changing patterns of cropland conversion to built-up land in China from 1987 to 2010. J. Geogr. Sci. 2018, 28, 1595–1610. [Google Scholar] [CrossRef] [Green Version]
- Hou, H.; Wang, R.; Murayama, Y. Scenario-based modelling for urban sustainability focusing on changes in cropland under rapid urbanization: A case study of Hangzhou from 1990 to 2035. Sci. Total Environ. 2019, 661, 422–431. [Google Scholar] [CrossRef] [PubMed]
- Liu, J.; Kuang, W.; Zhang, Z.; Xu, X.; Qin, Y.; Ning, J.; Zhou, W.; Zhang, S.; Li, R.; Yan, C.; et al. Spatiotemporal characteristics, patterns, and causes of land-use changes in China since the late 1980s. J. Geogr. Sci. 2014, 24, 195–210. [Google Scholar] [CrossRef]
- Gao, X.; Cheng, W.; Wang, N.; Liu, Q.; Ma, T.; Chen, Y.; Zhou, C. Spatio-temporal distribution and transformation of cropland in geomorphologic regions of China during 1990–2015. J. Geogr. Sci. 2019, 29, 180–196. [Google Scholar] [CrossRef] [Green Version]
- Ning, J.; Liu, J.; Kuang, W.; Xu, X.; Zhang, S.; Yan, C.; Li, R.; Wu, S.; Hu, Y.; Du, G.; et al. Spatiotemporal patterns and characteristics of land-use change in China during 2010–2015. J. Geogr. Sci. 2018, 28, 547–562. [Google Scholar] [CrossRef] [Green Version]
- Chen, X. Physical Geography of Arid Areas in China; Science Press: Beijing, China, 2010. [Google Scholar]
- Xue, J.; Gui, D.; Lei, J.; Sun, H.; Zeng, F.; Mao, D.; Jin, Q.; Liu, Y. Oasification: An unable evasive process in fighting against desertification for the sustainable development of arid and semiarid regions of China. Catena 2019, 179, 197–209. [Google Scholar] [CrossRef]
- Bai, J.; Chen, X.; Li, L.; Luo, G.; Yu, Q. Quantifying the contributions of agricultural oasis expansion, management practices and climate change to net primary production and evapotranspiration in croplands in arid northwest China. J. Arid Environ. 2014, 100–101, 31–41. [Google Scholar] [CrossRef]
- Hang, D. Artificial Oasis in Xinjiang; China Environmental Science Press: Beijing, China, 2001. [Google Scholar]
- Joshi, N.; Baumann, M.; Ehammer, A.; Fensholt, R.; Grogan, K.; Hostert, P.; Jepsen, M.; Kuemmerle, T.; Meyfroidt, P.; Mitchard, E.; et al. A Review of the Application of Optical and Radar Remote Sensing Data Fusion to Land Use Mapping and Monitoring. Remote Sens. 2016, 8, 70. [Google Scholar] [CrossRef] [Green Version]
- He, K.; Wu, S.; Yang, Y.; Wang, D.; Zhang, S.; Yin, N. Dynamic changes of land use and oasis in Xinjiang in the last 40 years. Arid Land Geogr. 2018, 41, 1333–1340. [Google Scholar]
- Chen, X.; Chang, C.; Bao, A.; Wu, S.; Luo, G. Spatial pattern and characteristics of land cover change in Xinjiang since past 40 years of the economic reform and opening up. Arid Land Geogr. 2020, 43, 1–11. [Google Scholar]
- Liu, Q.; Yang, Z.; Wang, C.; Han, F. Temporal-Spatial Variations and Influencing Factor of Land Use Change in Xinjiang, Central Asia, from 1995 to 2015. Sustainability 2019, 11, 696. [Google Scholar] [CrossRef] [Green Version]
- Hu, Y.; Hu, Y. Land Cover Changes and Their Driving Mechanisms in Central Asia from 2001 to 2017 Supported by Google Earth Engine. Remote Sens. 2019, 11, 554. [Google Scholar] [CrossRef] [Green Version]
- Muyibul, Z.; Jianxin, X.; Muhtar, P.; Qingdong, S.; Run, Z. Spatiotemporal changes of land use/cover from 1995 to 2015 in an oasis in the middle reaches of the Keriya River, southern Tarim Basin, Northwest China. Catena 2018, 171, 416–425. [Google Scholar] [CrossRef]
- Zhang, F.; Tiyip, T.; Feng, Z.D.; Kung, H.T.; Johnson, V.C.; Ding, J.L.; Tashpolat, N.; Sawut, M.; Gui, D.W. Spatio-Temporal Patterns of Land Use/Cover Changes Over the Past 20 Years in the Middle Reaches of the Tarim River, Xinjiang, China. Land Degrad. Dev. 2015, 26, 284–299. [Google Scholar] [CrossRef]
- Mamat, A.; Halik, Ü.; Rouzi, A. Variations of Ecosystem Service Value in Response to Land-Use Change in the Kashgar Region, Northwest China. Sustainability 2018, 10, 200. [Google Scholar] [CrossRef] [Green Version]
- Xu, Z.; Fan, W.; Wei, H.; Zhang, P.; Ren, J.; Gao, Z.; Ulgiati, S.; Kong, W.; Dong, X. Evaluation and simulation of the impact of land use change on ecosystem services based on a carbon flow model: A case study of the Manas River Basin of Xinjiang, China. Sci. Total Environ. 2019, 652, 117–133. [Google Scholar] [CrossRef] [PubMed]
- Zhang, Z.; Xu, E.; Zhang, H. Complex network and redundancy analysis of spatial–temporal dynamic changes and driving forces behind changes in oases within the Tarim Basin in northwestern China. Catena 2021, 201, 105216. [Google Scholar] [CrossRef]
- Abulizi, A.; Yang, Y.; Mamat, Z.; Luo, J.; Abdulslam, D.; Xu, Z.; Zayiti, A.; Ahat, A.; Halik, W. Land-Use Change and its Effects in Charchan Oasis, Xinjiang, China. Land Degrad. Dev. 2017, 28, 106–115. [Google Scholar] [CrossRef]
- Yang, Y.; Zheng, D.; Zhang, X.; Liu, Y. The spatial coupling of land use changes and its environmental effects on Hotan oasis during 1980–2010. Acta Geogr. Sin. 2013, 68, 813–824. [Google Scholar]
- Wang, D.; Wu, S.; Zhang, S. Expansion of both cultivated and construction land in Xinjiang since the late 1980s. Arid Land Geogr. 2017, 40, 188–196. [Google Scholar]
- Chen, H.; Wu, S.; Feng, X. Study on the changes of cultivated land and the driving factorsin Xinjiang based on RS and GIS. J. Nat. Resour. 2010, 25, 614–624. [Google Scholar]
- Zhang, Q.; Luo, G.; Li, L.; Zhang, M.; Lv, N.; Wang, X. An analysis of oasis evolution based on land use and land cover change: A case study in the Sangong River Basin on the northern slope of the Tianshan Mountains. J. Geogr. Sci. 2016, 27, 223–239. [Google Scholar] [CrossRef] [Green Version]
- Zhang, Y.; Li, C.; Wang, T.; Cai, C.; Bao, Y. County-level patterns of cropland and their relationships with socio-economic factors in northwestern China. Agric. Ecosyst. Environ. 2015, 203, 11–18. [Google Scholar] [CrossRef]
- Chen, H.; Wu, S.; Feng, X. Spatial-temporal analysis on land reclamation and loss patterns in Xinjiang. Resour. Sci. 2010, 32, 1726–1733. [Google Scholar]
- Hu, X.; Nie, Y.; Xu, X.; Jiang, S.; Zhang, Y. Monitoring land-use change in Hetian Tarim Basin, China using satellite remote sensing observation between 1990 and 2016. Prog. Geogr. 2020, 39, 577–590. [Google Scholar] [CrossRef]
- Zuo, L.; Zhang, Z.; Zhao, X.; Wang, X.; Wu, W.; Yi, L.; Liu, F. Multitemporal analysis of cropland transition in a climate-sensitive area: A case study of the arid and semiarid region of northwest China. Reg. Environ. Chang. 2013, 14, 75–89. [Google Scholar] [CrossRef]
- Zhu, H.; Li, Y. An empirical analysis of the causes of farmland expansion in northwest China. Prog. Geogr. 2011, 30, 615–620. [Google Scholar]
- Statistics Bureau of Xinjiang Uygur Autonomous Region (SBXUAR). Xinjiang Statistical Yearbook; Chinese Statistics Press: Beijing, China, 2019.
- Fan, Z.; Aili, X.; Wang, Y.; Chen, Y. Formation, development and evolution of the artificially-irrigated oases in Xinjiang. Arid Zone Res. 2006, 23, 410–418. [Google Scholar]
- Liu, X.; Li, X.; Chen, Y.; Tan, Z.; Li, S.; Ai, B. A new landscape index for quantifying urban expansion using multi-temporal remotely sensed data. Landsc. Ecol. 2010, 25, 671–682. [Google Scholar] [CrossRef]
- Ouyang, X.; Zhu, X. Spatio-temporal characteristics of urban land expansion in Chinese urban agglomerations. Acta Geogr. Sin. 2020, 75, 571–588. [Google Scholar]
- Wang, J.; Xu, C. Geodetector: Principle and prospective. Acta Geogr. Sin. 2017, 72, 116–134. [Google Scholar]
- Wang, J.F.; Li, X.H.; Christakos, G.; Liao, Y.L.; Zhang, T.; Gu, X.; Zheng, X.Y. Geographical Detectors-Based Health Risk Assessment and its Application in the Neural Tube Defects Study of the Heshun Region, China. Int. J. Geogr. Inf. Sci. 2010, 24, 107–127. [Google Scholar] [CrossRef]
- Liu, Y.; Yang, R. The spatial characteristics and formation mechanism of the county urbanization in China. Acta Geogr. Sin. 2012, 67, 1011–1020. [Google Scholar]
- Zhou, Y.; Li, X.; Liu, Y. Land use change and driving factors in rural China during the period 1995–2015. Land Use Policy 2020, 99, 105048. [Google Scholar] [CrossRef]
- Xu, L.; Du, H.; Zhang, X. Driving forces of carbon dioxide emissions in China’s cities: An empirical analysis based on the geodetector method. J. Clean. Prod. 2021, 287, 125169. [Google Scholar] [CrossRef]
- Shi, X.; Wang, W.; Shi, W. Progress on quantitative assessment of the impacts of climate change and human activities on cropland change. J. Geogr. Sci. 2016, 26, 339–354. [Google Scholar] [CrossRef] [Green Version]
- Deng, M. “Three Water Lines” strategy: Its spatial patterns and effects on water resources allocation in northwest China. Acta Geogr. Sin. 2018, 73, 1189–1203. [Google Scholar]
- Ministry of Natural Resources of the People’s Republic of China (MNRC). Technical Guidelines for Evaluation of Resource and Environment Carrying Capacity and Suitability of Territorial Space Development; Bureau of Land and Space Planning: Beijing, China, 2019.
- Wang, Z.; Li, W.; Li, Y.; Qin, C.; Lv, C.; Liu, Y. The “Three Lines One Permit” policy: An integrated environmental regulation in China. Resour. Conserv. Recy. 2020, 163, 105101. [Google Scholar] [CrossRef]
- Zhou, D.; Wang, X.; Shi, M. Human Driving Forces of Oasis Expansion in Northwestern China During the Last Decade—A Case Study of the Heihe River Basin. Land Degrad. Dev. 2016, 28, 412–420. [Google Scholar] [CrossRef]
- Bie, Q.; Xie, Y. The constraints and driving forces of oasis development in arid region: A case study of the Hexi Corridor in northwest China. Sci. Rep. 2020, 10, 17708. [Google Scholar] [CrossRef]
- Wang, Y. Achievements, problems and suggestions of Xinjiang water resources development and utilization. Xinjiang State Farms Econ. 2016, 1, 48–51. [Google Scholar]
- Feng, L.; Tian, X. The change of water resource distribution and its ecological effects caused by the agriculture development in Manasi river valley in modern time. Agric. Hist. China 2006, 1, 119–126. [Google Scholar]
- Cheng, L.; Guo, H.; Lu, Q. Review on the valuation of desert ecosystem service values. J. Desert Res. 2013, 33, 281–287. [Google Scholar]
- Schild, J.E.M.; Vermaat, J.E.; van Bodegom, P.M. Differential effects of valuation method and ecosystem type on the monetary valuation of dryland ecosystem services: A quantitative analysis. J. Arid Environ. 2018, 159, 11–21. [Google Scholar] [CrossRef] [Green Version]
- Li, T.; Cui, L.; Zhu, J.; Chen, S.; Dong, Z.; Cui, X.; Liu, Y.; Wang, Y.; Ning, Y. Multi-function of grassland ecosystem and realization of sustainable development goals. Chin. J. Nat. 2021, 43, 149–156. [Google Scholar]
- Zhang, Z.; Xia, F.; Yang, D.; Huo, J.; Wang, G.; Chen, H. Spatiotemporal characteristics in ecosystem service value and its interaction with human activities in Xinjiang, China. Ecol. Indic. 2020, 110, 105826. [Google Scholar] [CrossRef]
- Li, Y.; Li, X.; Tan, M.; Wang, X.; Xin, L. The impact of cultivated land spatial shift on food crop production in China, 1990–2010. Land Degrad. Dev. 2018, 29, 1652–1659. [Google Scholar] [CrossRef]
- Li, T.; Long, H.; Zhang, Y.; Tu, S.; Ge, D.; Li, Y.; Hu, B. Analysis of the spatial mismatch of grain production and farmland resources in China based on the potential crop rotation system. Land Use Policy 2017, 60, 26–36. [Google Scholar] [CrossRef]
- Tian, J.; Wang, B.; Zhang, C.; Li, W.; Wang, S. Mechanism of regional land use transition in underdeveloped areas of China: A case study of northeast China. Land Use Policy 2020, 94, 104538. [Google Scholar] [CrossRef]


| Data | Data Sources | Year (s) | Resolution |
|---|---|---|---|
| Land use data | http://www.resdc.cn | 1990, 2000, 2010, 2018 | 30 m |
| DEM data | http://www.gscloud.cn | — | 30 m |
| AAP and AT10 data | http://www.resdc.cn | 1990–2015 | 500 m |
| Administrative boundaries data | http://www.webmap.cn/ | 2015 | — |
| Rivers and canals data | http://www.webmap.cn/ | 2015 | — |
| Socio-economic statistics data | Statistical Yearbooks of Xinjiang and its various prefectures | 1990, 2000, 2010, 2018 | — |
| Year | Area of Cropland (103 hm2) | Period | CLNCA (103 hm2) | CLER (%/year) |
|---|---|---|---|---|
| 1990 | 5802.89 | 1990–2000 | 765.31 | 1.32 |
| 2000 | 6568.20 | 2000–2010 | 1495.27 | 2.28 |
| 2010 | 8063.47 | 2010–2018 | 875.07 | 1.36 |
| 2018 | 8938.54 | 1990–2018 | 3135.65 | 1.93 |
| Name of Oasis Areas | 1990–2000 | 2000–2010 | 2010–2018 | 1990–2018 | ||||
|---|---|---|---|---|---|---|---|---|
| CLEI (%) | CLER (%/year) | CLEI (%) | CLER (%/year) | CLEI (%) | CLER (%/year) | CLEI (%) | CLER (%/year) | |
| TEVO | 1.17 | 0.21 | 6.49 | 2.22 | 1.95 | 0.40 | 3.92 | 1.03 |
| TNWO | 14.82 | 1.11 | 29.07 | 3.83 | 11.47 | 0.80 | 20.68 | 2.27 |
| TNEO | 4.78 | 1.12 | 4.42 | 1.82 | 1.49 | 0.38 | 3.69 | 1.27 |
| IURO | 7.91 | 2.36 | 8.30 | 3.91 | 9.56 | 2.37 | 8.55 | 3.73 |
| TPO | 1.86 | 1.29 | 0.62 | 0.74 | 0.33 | −0.27 | 0.66 | 0.67 |
| HMO | 2.94 | 2.10 | 2.83 | 3.26 | 0.18 | 0.12 | 2.12 | 2.21 |
| ILO | 7.67 | 0.78 | 4.81 | 0.89 | 3.87 | 0.48 | 5.24 | 0.78 |
| ABLO | 4.18 | 1.84 | 5.44 | 3.95 | 3.53 | 1.34 | 4.60 | 2.96 |
| AKSO | 14.85 | 2.33 | 11.25 | 2.80 | 10.37 | 1.47 | 11.88 | 2.73 |
| WGRO | 6.53 | 1.17 | 3.61 | 1.13 | 14.01 | 2.89 | 7.23 | 1.90 |
| KSGO | 5.24 | 0.86 | 4.04 | 1.19 | 17.33 | 3.33 | 8.04 | 1.92 |
| YEQO | 10.78 | 1.53 | 6.71 | 1.61 | 6.37 | 0.96 | 7.61 | 1.57 |
| KKRO | 12.08 | 2.46 | 8.41 | 2.69 | 10.33 | 1.90 | 9.84 | 2.94 |
| HTO | 3.70 | 0.94 | 2.84 | 1.28 | 7.06 | 2.06 | 4.23 | 1.56 |
| AMNO | 1.49 | 4.23 | 1.16 | 4.53 | 2.8 | 5.51 | 1.70 | 7.07 |
| Period | Types of Spatial Patterns of Cropland Expansion (%) | ||
|---|---|---|---|
| Outlying Expansion | Edge Expansion | Infilling Expansion | |
| 1990–2000 | 19.74 | 67.00 | 13.26 |
| 2000–2010 | 20.02 | 63.40 | 16.59 |
| 2010–2018 | 19.81 | 59.42 | 20.76 |
| Period | Types of Land Use Conversion Modes for Cropland Expansion (%) | ||||
|---|---|---|---|---|---|
| Woodland (WL) | Grassland (GL) | Water Body (WB) | Built-Up Land (BL) | Unused Land (UL) | |
| 1990–2000 | 1.01 | 92.04 | 0.11 | 0.09 | 6.75 |
| 2000–2010 | 0.48 | 88.91 | 0.40 | 0.00 | 10.20 |
| 2010–2018 | 1.65 | 76.58 | 0.38 | 0.37 | 21.02 |
| Factors | Unit | Classification | Classification Basis | |||
|---|---|---|---|---|---|---|
| I | II | III | IV | |||
| ELV | m | <1000 | [1000, 2000) | [2000, 3000) | ≥3000 | [59] |
| SP | ° | <3 | [3, 8) | [8, 15) | ≥15 | [59] |
| AAP | mm | <100 | [100, 200) | [200, 400) | ≥400 | [59] |
| AT10 | ℃ | <800 | [800, 1600) | [1600, 3400) | ≥3400 | [59] |
| DRC | km | <5 | [5, 10) | [10, 20) | ≥20 | Expert advice 1 |
| TPOP | 104 person | <2.01 | [2.01, 5.11) | [5.11, 10.75) | ≥10.75 | Natural Breaks |
| RPOP | 104 person | <0.41 | [0.41, 1.61) | [1.61, 5.87) | ≥5.87 | Natural Breaks |
| PNIRR | CNY | <4158 | [4158, 5774) | [5774, 6763) | ≥6763 | Natural Breaks |
| PSTI | % | <13.59 | [13.59, 27.70) | [27.70, 38.51) | ≥38.51 | Natural Breaks |
| Impact Factor | Geodetector Results | Impact Factor | Geodetector Results | ||||
|---|---|---|---|---|---|---|---|
| p Value | q Value | Explanatory Ranking | p Value | q Value | Explanatory Ranking | ||
| ELV | 0.000 | 0.0308 | 2 | TPOP | 0.000 | 0.0275 | 4 |
| SP | 0.000 | 0.0299 | 3 | RPOP | 0.000 | 0.0239 | 6 |
| AAP | 0.000 | 0.0180 | 8 | PNIRR | 0.000 | 0.0260 | 5 |
| AT10 | 0.000 | 0.0218 | 7 | PSTI | 0.000 | 0.0139 | 9 |
| DRC | 0.000 | 0.0642 | 1 | — | — | — | — |
Publisher’s Note: MDPI stays neutral with regard to jurisdictional claims in published maps and institutional affiliations. |
© 2021 by the authors. Licensee MDPI, Basel, Switzerland. This article is an open access article distributed under the terms and conditions of the Creative Commons Attribution (CC BY) license (https://creativecommons.org/licenses/by/4.0/).
Share and Cite
Cai, T.; Zhang, X.; Xia, F.; Zhang, Z.; Yin, J.; Wu, S. The Process-Mode-Driving Force of Cropland Expansion in Arid Regions of China Based on the Land Use Remote Sensing Monitoring Data. Remote Sens. 2021, 13, 2949. https://doi.org/10.3390/rs13152949
Cai T, Zhang X, Xia F, Zhang Z, Yin J, Wu S. The Process-Mode-Driving Force of Cropland Expansion in Arid Regions of China Based on the Land Use Remote Sensing Monitoring Data. Remote Sensing. 2021; 13(15):2949. https://doi.org/10.3390/rs13152949
Chicago/Turabian StyleCai, Tianyi, Xinhuan Zhang, Fuqiang Xia, Zhiping Zhang, Jingjing Yin, and Shengqin Wu. 2021. "The Process-Mode-Driving Force of Cropland Expansion in Arid Regions of China Based on the Land Use Remote Sensing Monitoring Data" Remote Sensing 13, no. 15: 2949. https://doi.org/10.3390/rs13152949