
Multiscale Hydrogeomorphometric Analysis for Fluvial Risk Management. Application in the Carrión River, Spain


Geology Department, External Geodynamics Area, Faculty of Sciences, University of Salamanca, Plaza de los Caídos s/n, 37008 Salamanca, Spain
*
Author to whom correspondence should be addressed.
Remote Sens. 2021, 13(15), 2955; https://doi.org/10.3390/rs13152955
Submission received: 28 May 2021
/
Revised: 14 July 2021
/
Accepted: 23 July 2021
/
Published: 27 July 2021
(This article belongs to the Special Issue Environmental Modeling for Hydrogeological and Hydrogeomorphological Geohazards: River and Urban Floods Influenced by Climate Change)
Abstract
:The sustainable management of fluvial systems requires reliable knowledge of the mechanisms that control the basins and their drainages, which in turn must be prioritized for the application of measures for flood-risk reduction. Thus, given the need to develop methodological frameworks capable of integrating remote sensing technologies at different scales, as well as traditional metrics and anthropic variables, in this study, a multiscale method is proposed for the characterization and prioritization of river stretches for fluvial risk management. This methodology involves the study of drivers at the watershed level, and a detailed morphometric and hydrogeomorphological analysis of the main channel for fluvial landscape classification, segmentation, and aggregation into units, considering also anthropic variables. Therefore, it includes the use of LiDAR data and exploration GIS tools, whose results are corroborated through fieldwork, where ephemeral and topographic evidence of fluvial dynamics are collected. The procedure is validated in the Carrión river basin, Palencia, Spain, where a high degree of maturity and geomorphological development are determined. Hence, the main channel can be classified into eight geomorphic units and divided into homogeneous segments, which, according to categorical elements such as urban interventions, are prioritized, obtaining, as a result, six stretches of main interest for river risk management.
1. Introduction
Fluvial systems, recognized as a space for the natural development of water bodies, have been altered anthropically in an accelerated manner during the last century, not only reducing their surface area, but also deteriorating their quality and associated ecosystems and increasing the number of elements exposed to risk [1]. These systems are influenced by factors such as urban occupation, industries, agricultural fields, establishment of storage and flow control structures, and precipitation and temperature regimes already altered by climate change [2]. Therefore, the management of the fluvial areas requires the integration of multiple disciplines that combine physical aspects and biological, socioeconomic, and cultural approaches [3]. Thus, it is necessary to work on highly modified river systems and not only with natural configurations, with the aim of understanding their physical processes and improving their functioning [4]. For this purpose, regulations have been implemented in recent decades, such as the Water Framework Directive in Europe [5], which seeks to improve the surface water status.
The appropriate river basin management requires the development of studies that make it possible to understand their nature, their evolution over time, and the physical mechanisms that affect them, so that future behaviors can be inferred, leading to the development of protection, recovery, and reduction of potential risk measures [6]. This requires sufficiently robust and reliable baseline information related to the structure, function, health, and trajectory of water bodies, considering geomorphological variables, hydrological regimes, hydraulic characteristics, and terrain configurations [7].
Geomorphological studies provide insight into the channel evolution as a basis for interpreting the current stream conditions and its trends, making it an essential factor for the understanding and managing of hydroclimatological hazards [8]. In this sense, such analyses have been strengthening in the last two decades in different basins worldwide [9,10,11,12], developing methodological frameworks based on hydromorphometric analysis at different scales and differentiating sections and channel segments according to typology, geomorphic units, and drivers present [13,14].
The relevance in the analysis of units consists in the establishment of methods that allow objective delimitations of stretches, with relatively homogeneous biophysical characteristics along a river course to understand its behavior [13,15,16,17]. The typologies identification permit us to carry out a categorization and prioritization of stretches, where it would be necessary to develop more detailed studies and implement multipurpose actions for the protection and preservation of fluvial systems [11,12,18,19]. These studies must also include other variables, such as the anthropogenic interventions impact, which is one of the greatest challenges nowadays [19].
In this context, it is necessary to carry out analyses at different geographical levels—for example, at regional scales for drivers’ definition at basin level, and at local scale, focused on the behavior of river course segments. Then, remote sensing techniques appear as a practical tool, whose development has revolutionized the ability to map and analyze the spatial variability of fluvial elements, including the light detection and ranging—LiDAR [20,21]. Multiple studies have been developed in different catchments [7,22,23].
However, given the availability and volume of current information, and the multiple techniques and tools developed, there is a need to establish methodological frameworks that can integrate different sensors, spatial and temporal approaches, as well as traditional metrics and transversal anthropic factors [19,24].
Considering the above, this study proposes a detailed practical methodology for the characterization and multivariate prioritization of reaches along a river course. This work consists of three phases where a series of steps are developed to: (a) study drivers and hydromorphometric characteristics, covering a regional scale at a river basin level; (b) analyze the main channel at a detailed scale, generating the segmentation and aggregation of sections along the river course, based on the study of hydromorphometric variables, fluvial geomorphology, and anthropic interventions, and (c) the final characterization and prioritization of sections of interest for the subsequent development of detailed studies and fluvial risk management measures.
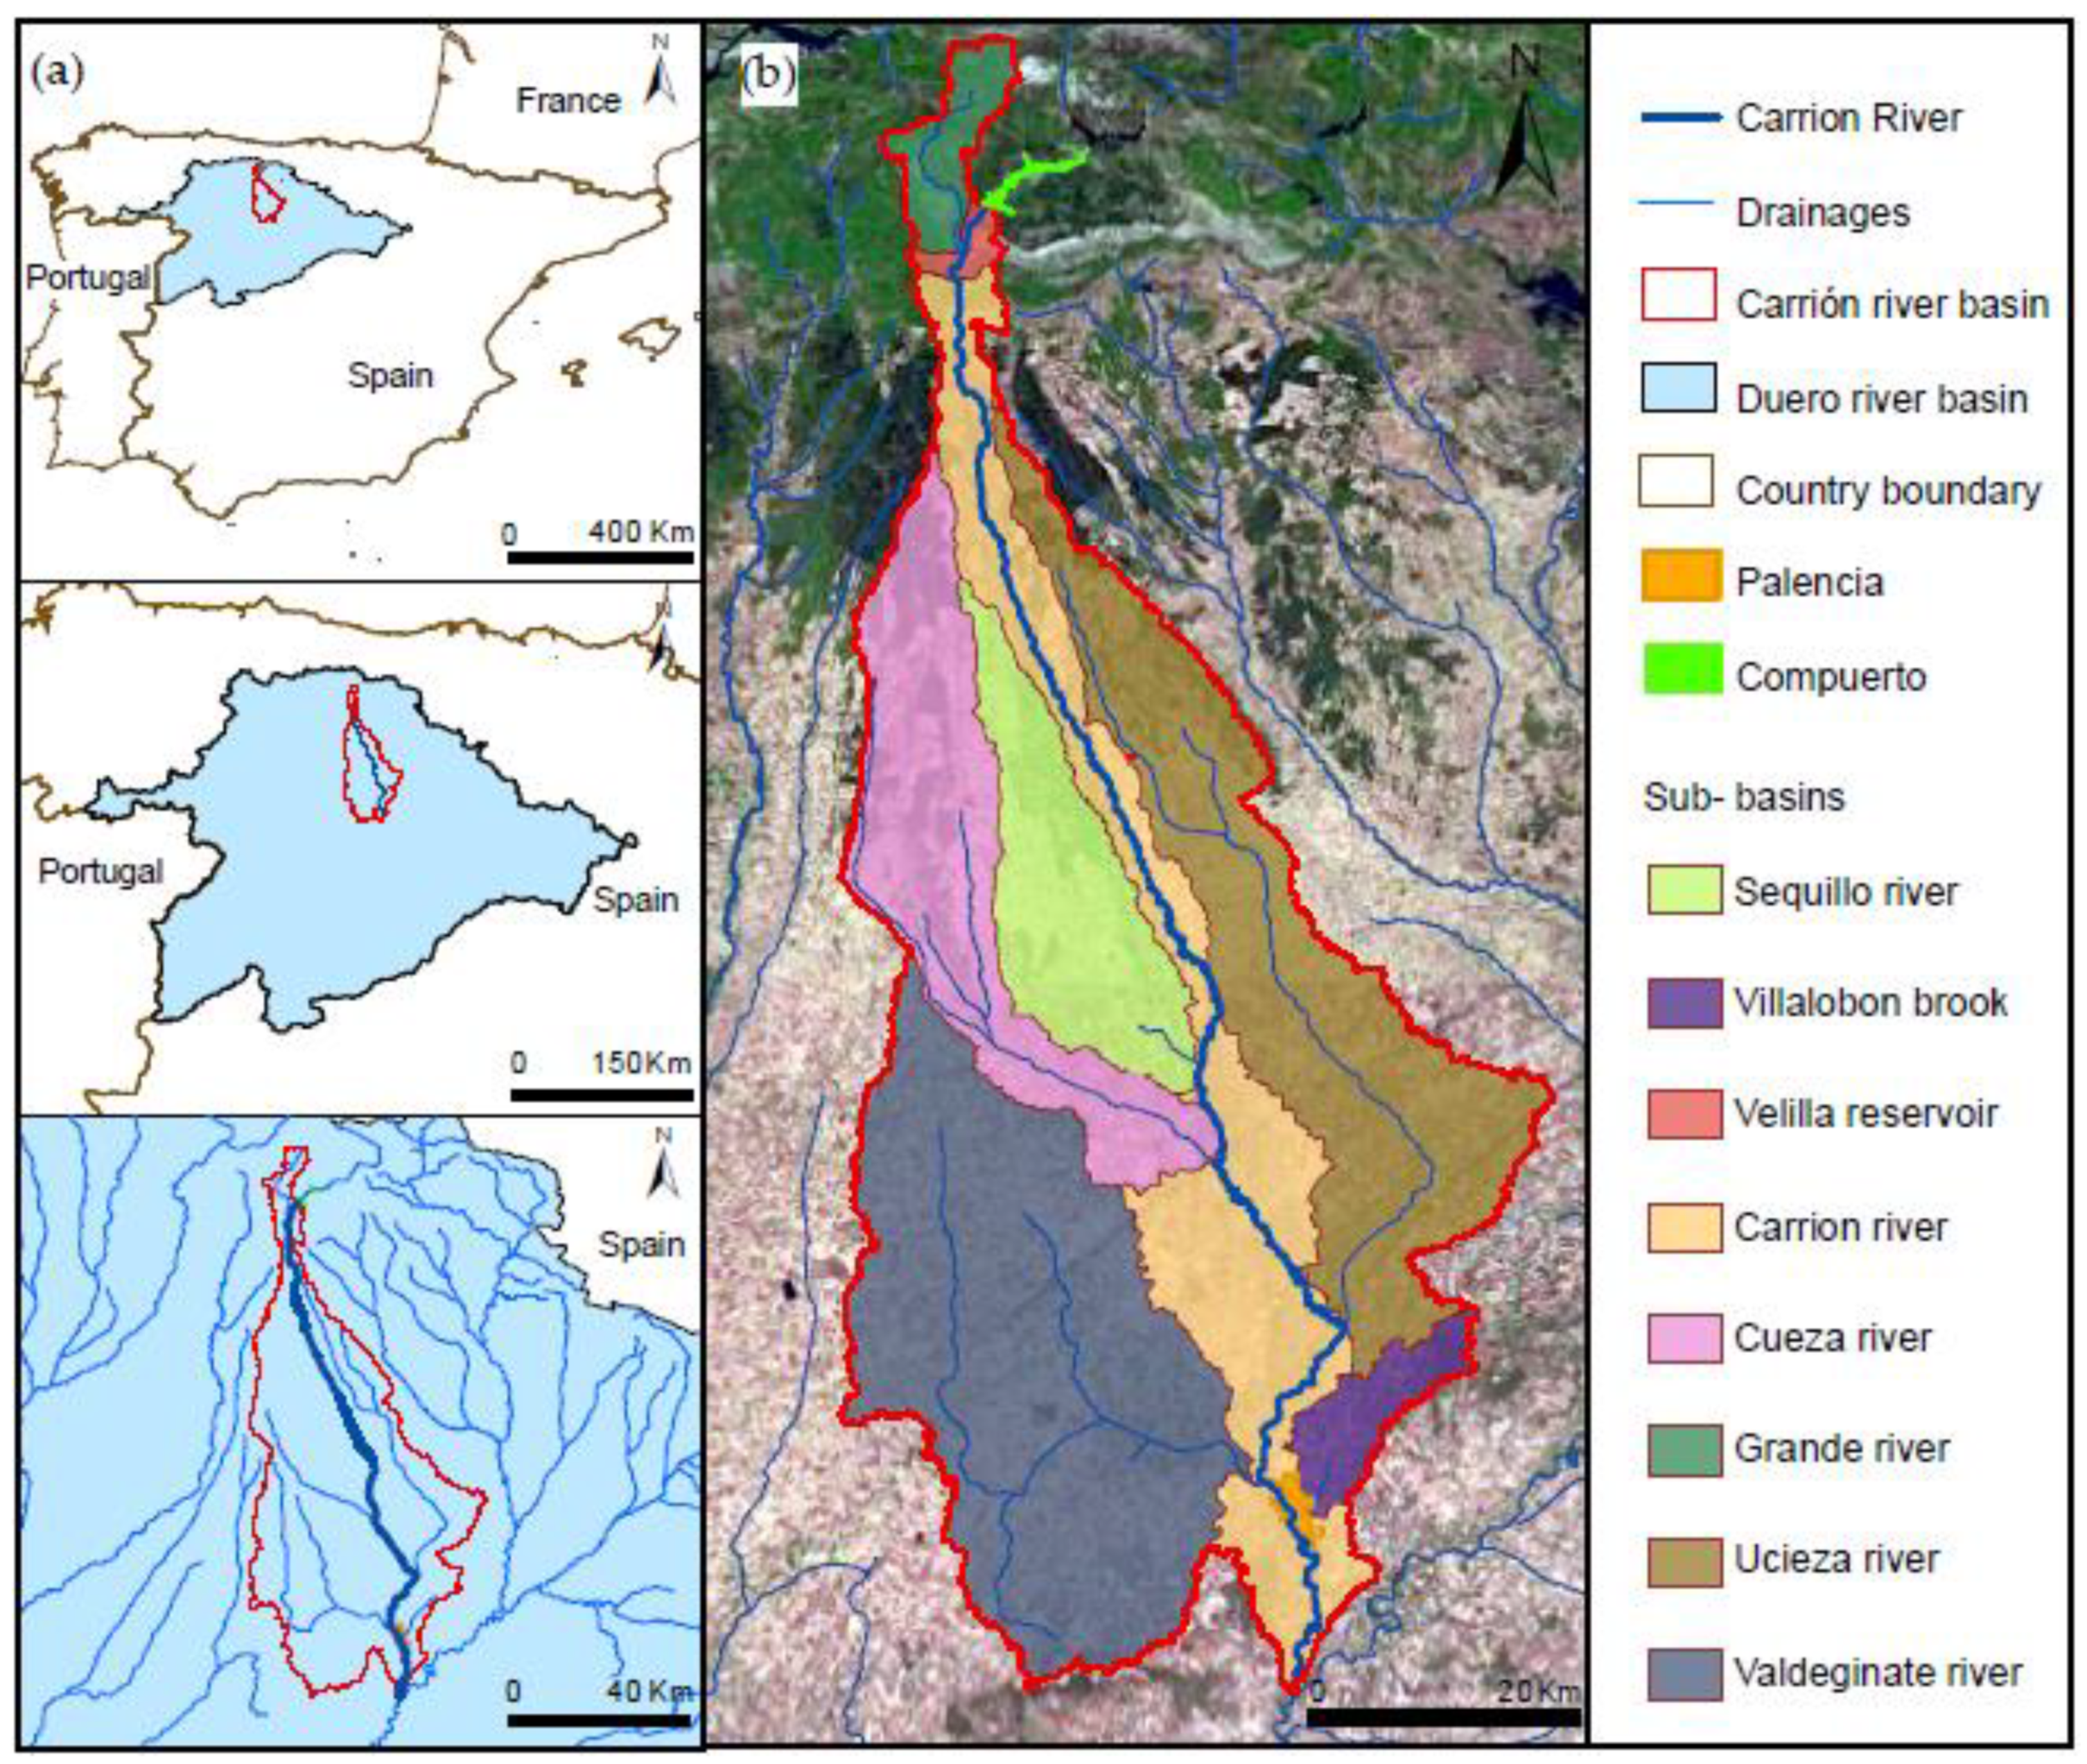
The method developed in this study was validated in the basin and main channel of the Carrión river, a Duero basin tributary, located in the northwest of the Iberian Peninsula (Palencia, Spain) (Figure 1a). This river course is categorized as a highly modified surface water body, due to the anthropic intervention such as rectifications, storage, and flow regulation structures, occupations, and agricultural and urban land uses. This fluvial body, originating in the Fuentes Carrionas massif in the Velilla del Río Carrión municipality, has a 197 km channel length until it flows into the Pisuerga River, with a drainage area of 3368 km2 approximately.
According to the hydrographic zoning, the Carrión river is part of zone A-subzone 5 of the Duero basin, which includes a total of 31 surface water bodies [25]. The study analyzed a river stretch, from the Compuerto reservoir to its mouth, with a total length of 180.7 km, and its tributary basin with a surface of 3000 km2 (Figure 1b).
2. Methods
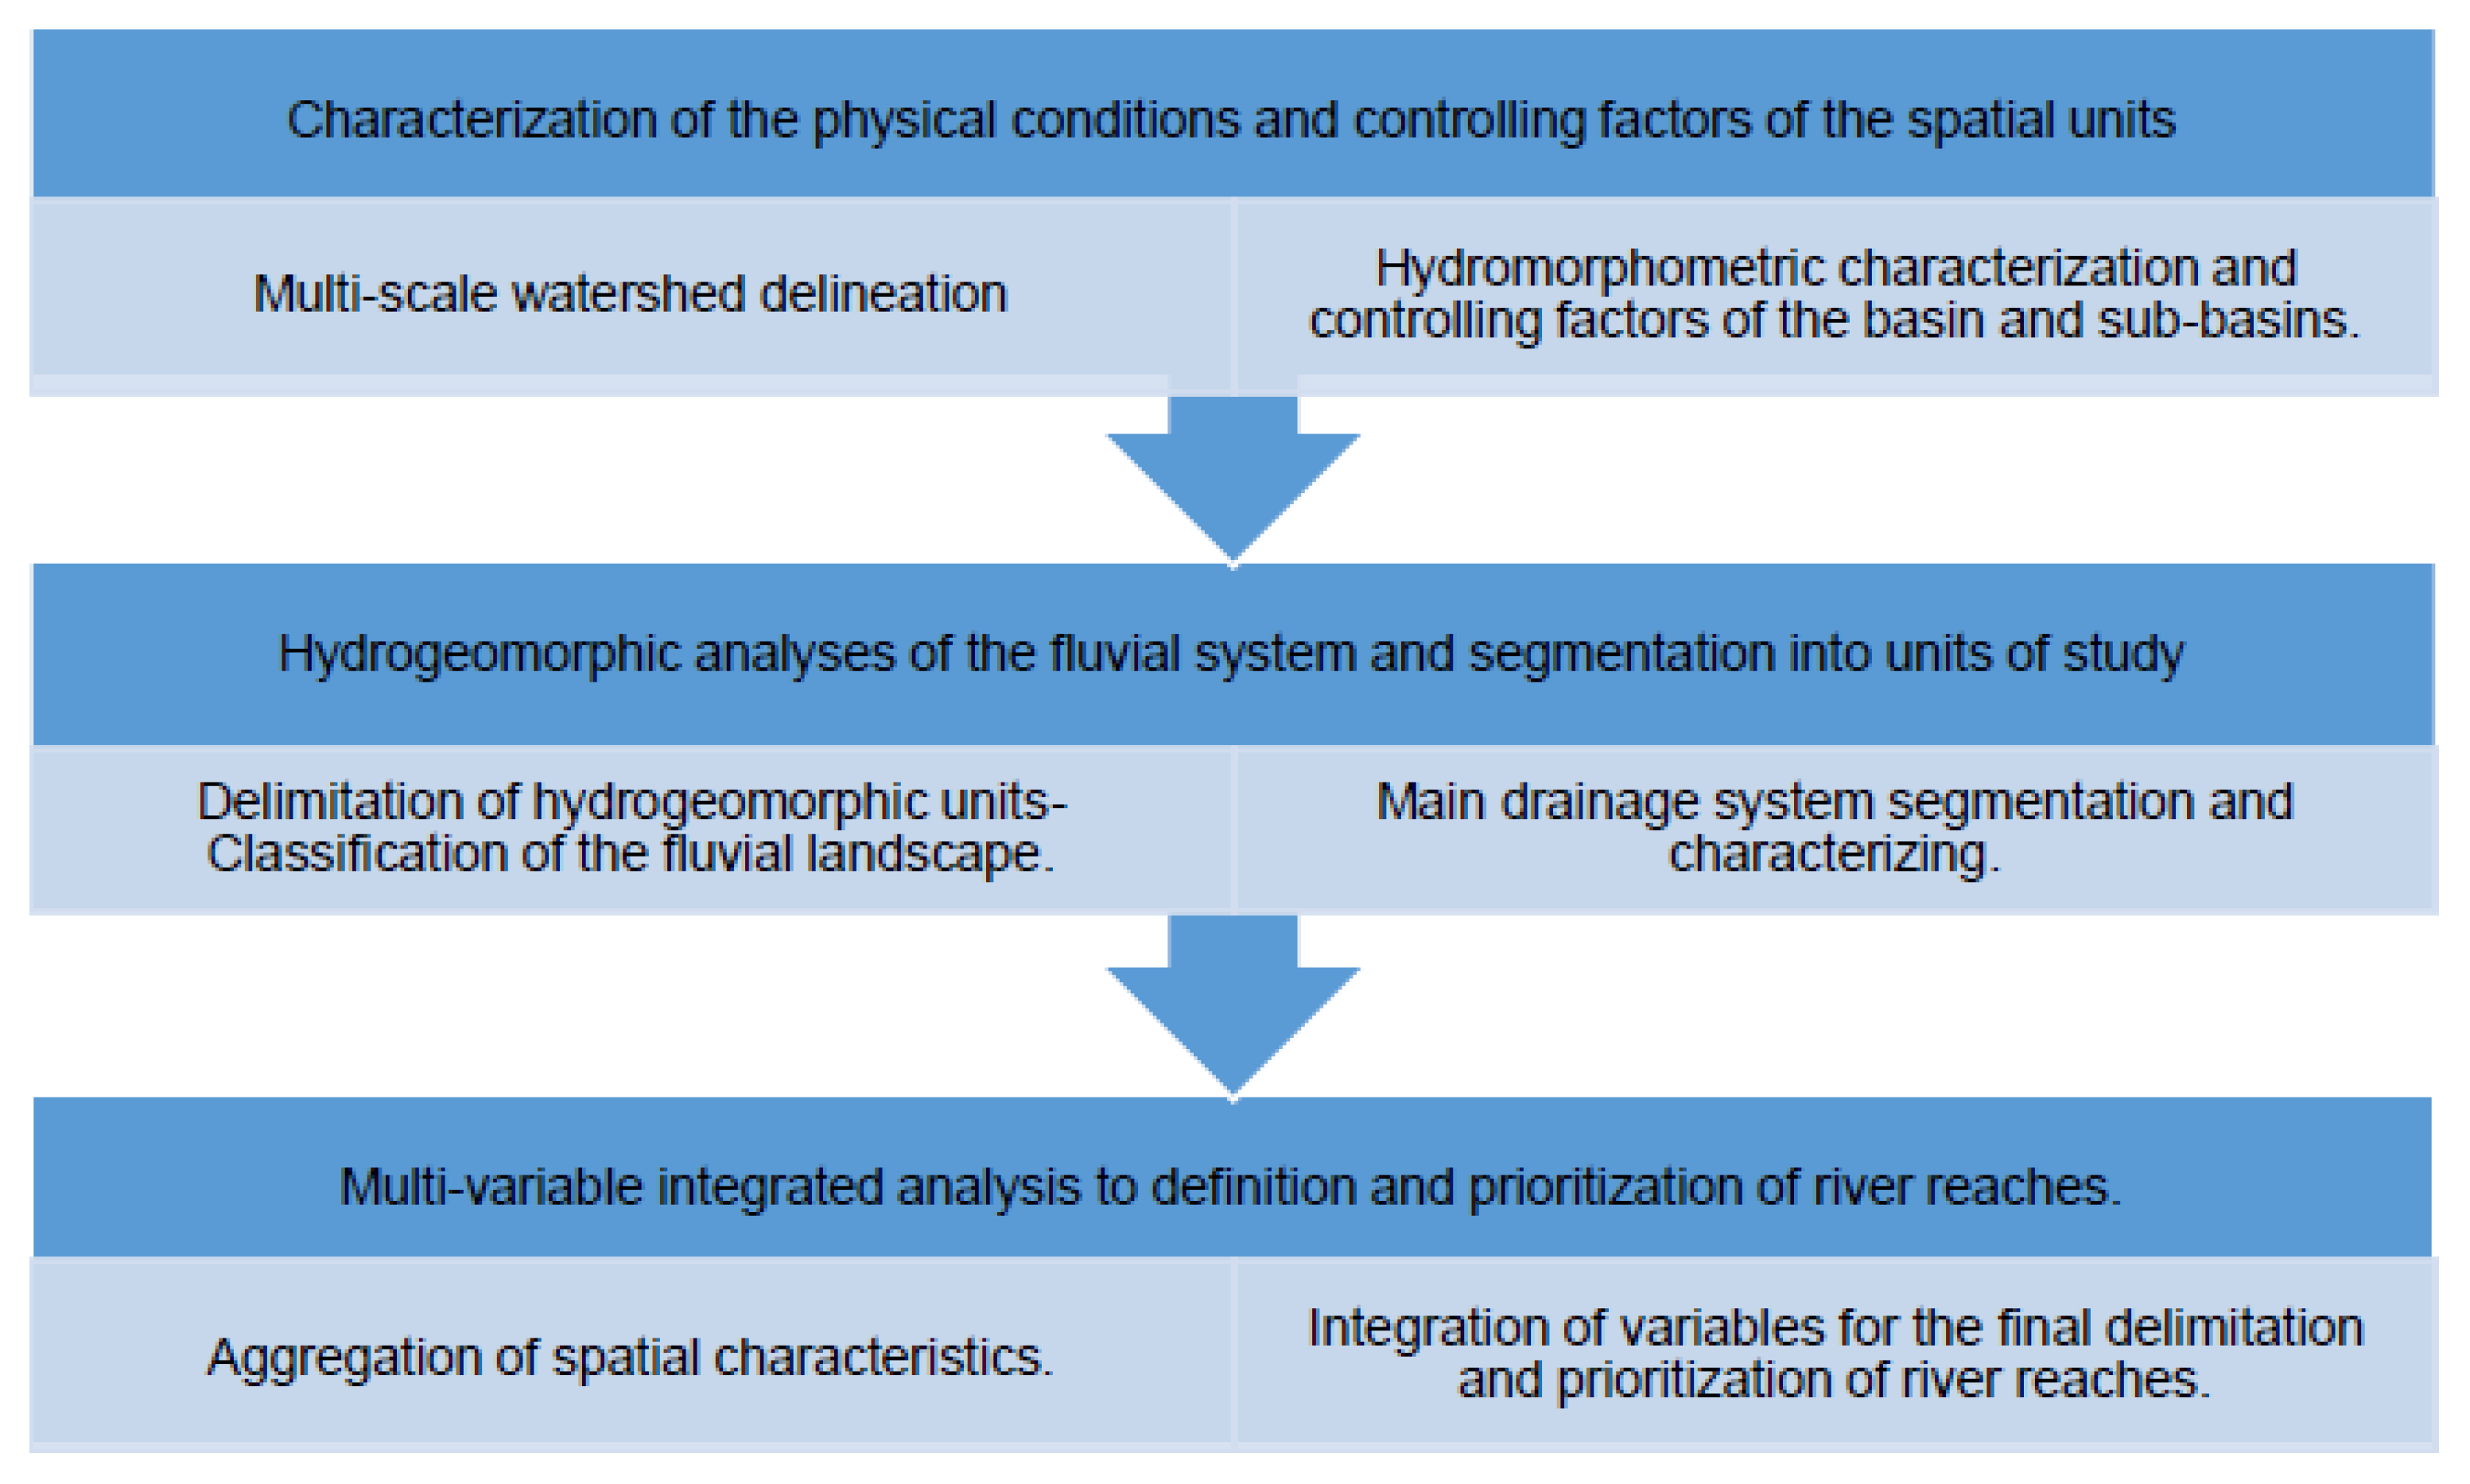
As a preliminary stage, the study included the collection and processing of the most up to date information of the area of interest, from official sources such as the National Geographic Institute (IGN), the Geological and Mining Institute of Spain (IGME), the Duero Hydrographic Confederation (CHD), and the Spatial Data Infrastructure of the Junta de Castilla y León (JCyL). The data were compiled into a cartographic database, including surface water bodies, geological maps, quaternary surface datasheets, channel maps, orthophotos, historic flight photos, remote data, and basic topography. As shown in Figure 2, the study contemplated three macro phases, composed of two general processes. The procedure involved the use of remote sensing techniques, starting from the use of high-resolution LiDAR data, as well as the combined application of different GIS tool packages on the ArcGIS 10.8 platform, on which the step-by-step execution is further described. These practical tools converged with the fieldwork, which made it possible to define the quality of the adjustment of the theoretical work in contrast with the evidence collected in the field [26].
2.1. Characterization of the Physical Conditions and Controlling Factors of the Spatial Units
The study of the physical characteristics and drivers of the basin included the determination of morphometric parameters; for this purpose, the first step was the definition of analysis areas and then the determination of hydromorphometric indexes.
2.1.1. Multiscale Watershed Delineation
The multiscale delineation includes the definition of representative sub-basins of the watershed studied, based on the water body subdivisions established by the management authorities—in this case, for the Carrión river, the one developed by the CHD [25], which considers 24 sub-watersheds.
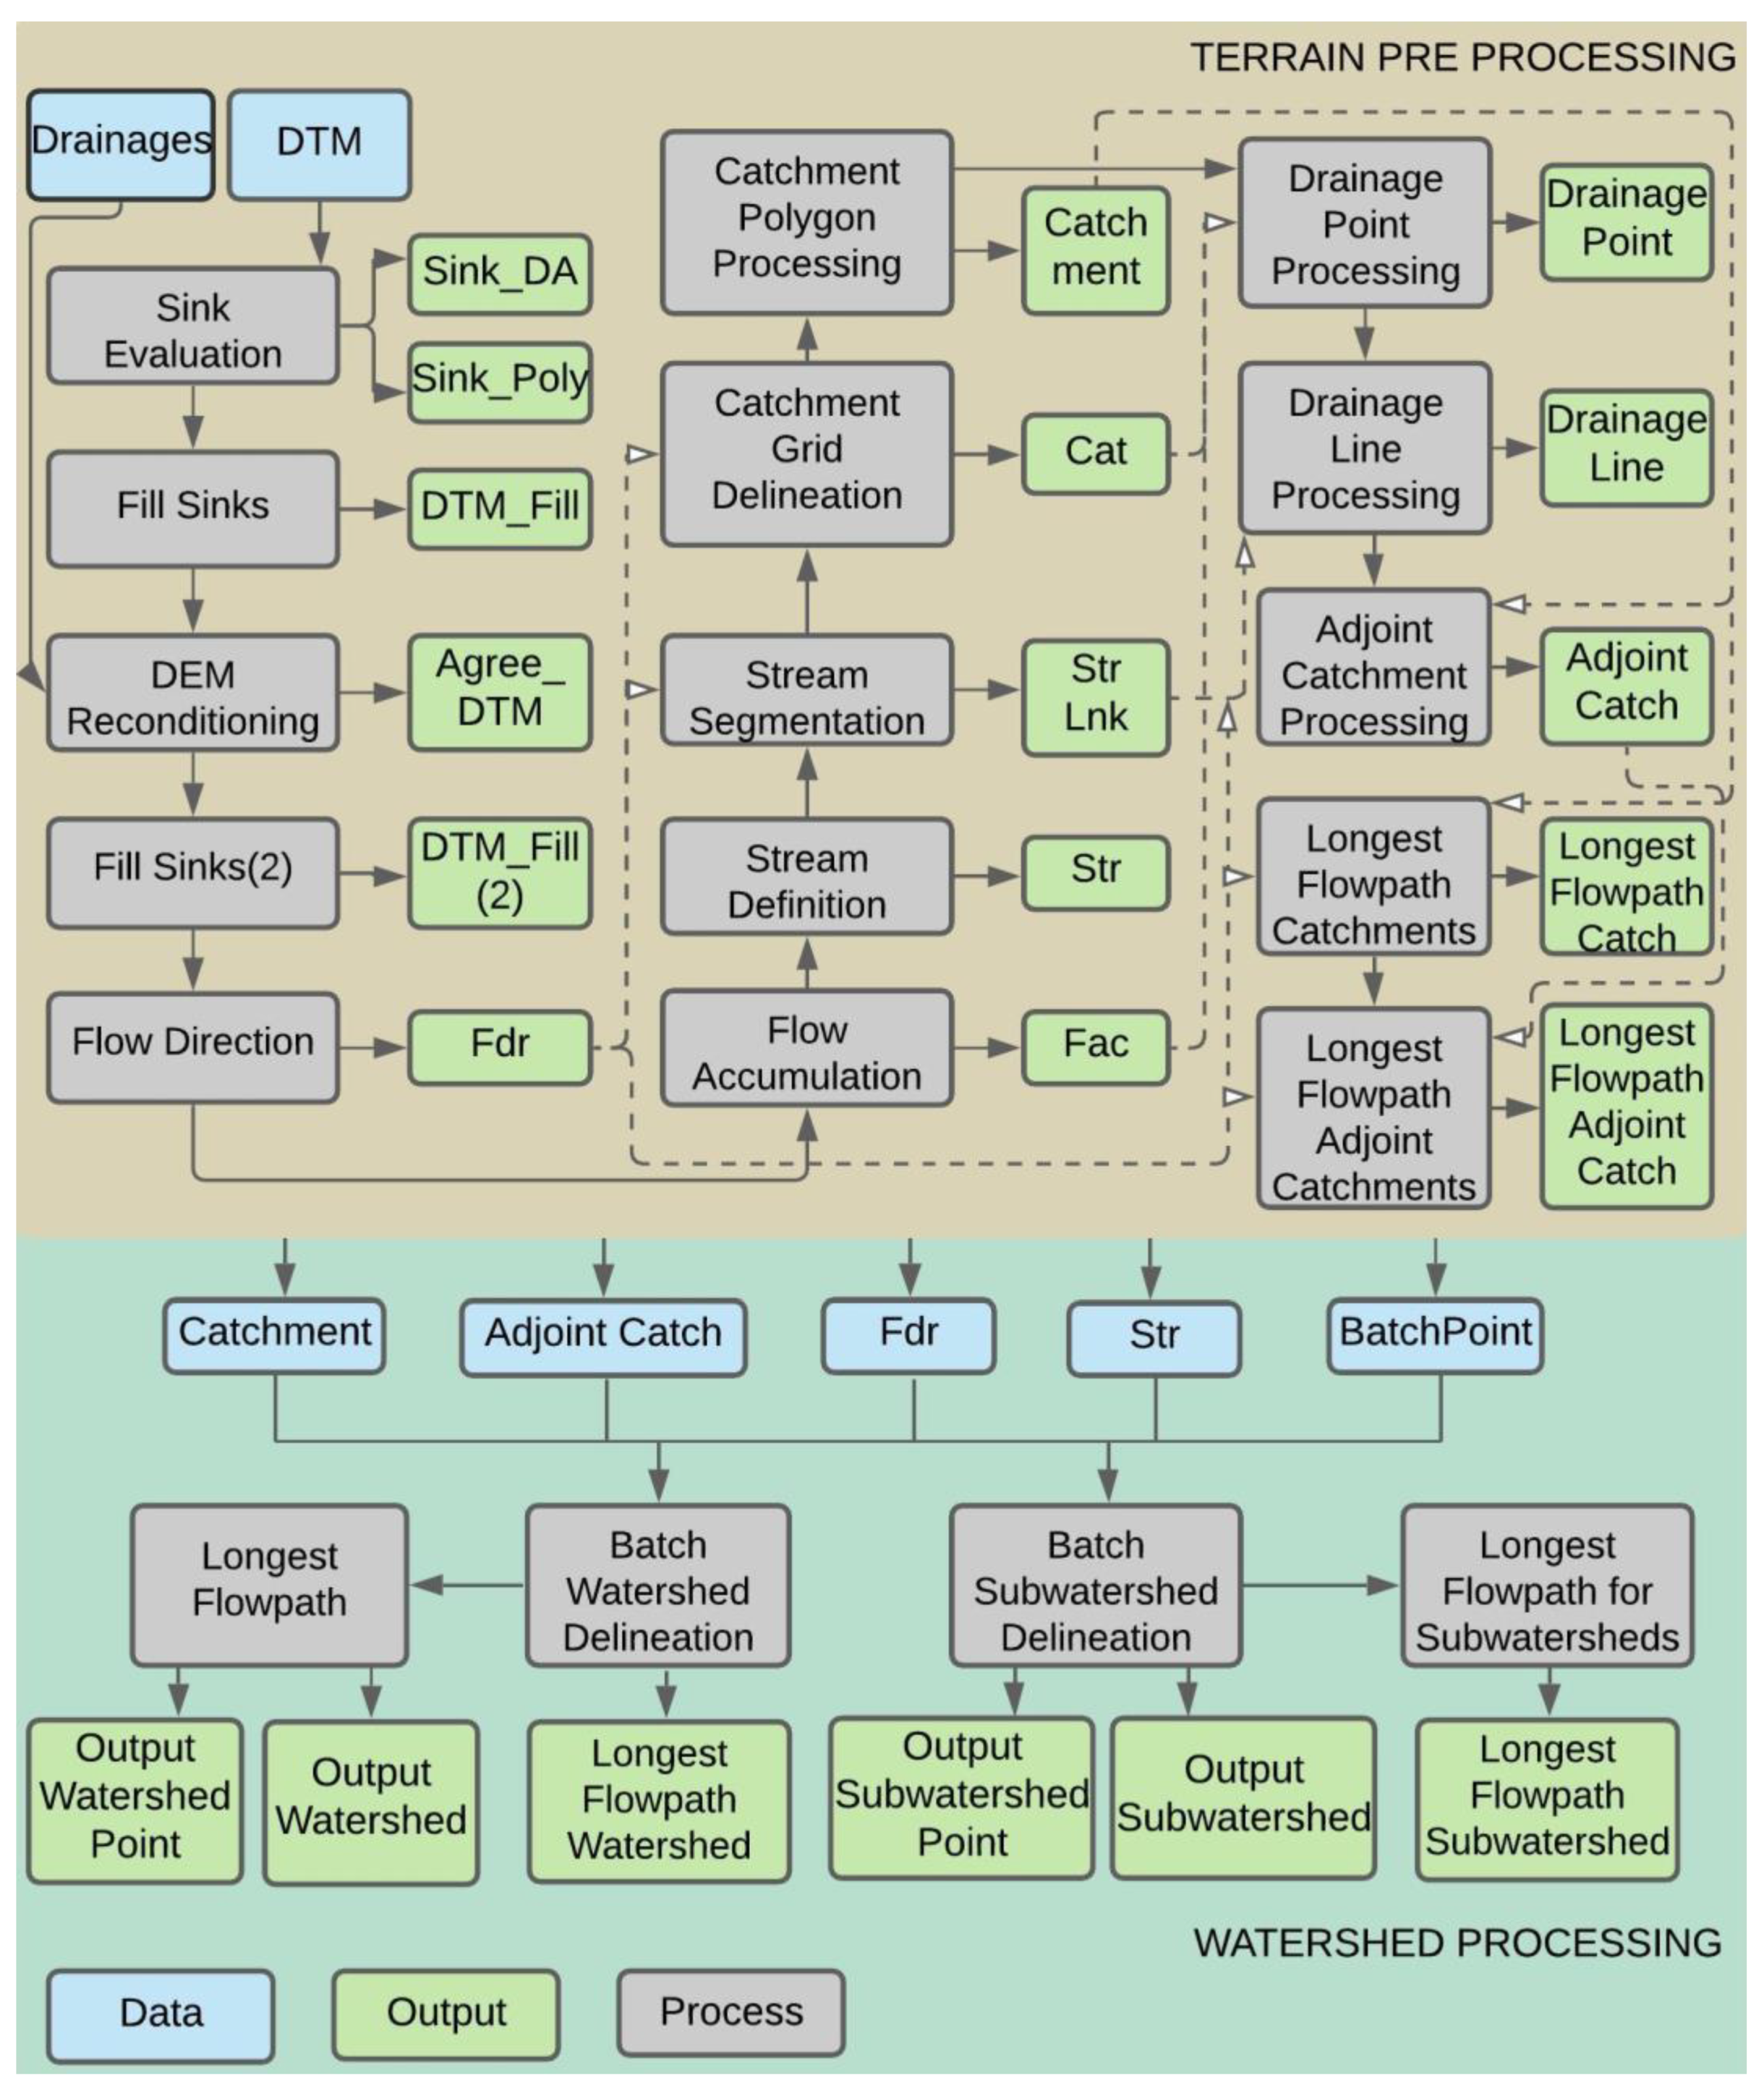
Over this delimited area, a 5 m resolution DTM was generated from LIDAR data, keeping only the ground height values. Subsequently, the ArcHydro toolset in ArcGIS 10.8 was applied, so once the data were processed under the Terrain Preprocessing tool, the delimitation of the basin and sub-basins was carried out using the Watershed Processing sequence (Figure 3). With this input, and selecting the main tributary drainages, the affluent areas were grouped, maintaining surfaces above a threshold according to the scale of analysis. Thus, considering that the segment of interest comprises the Carrion River stretch from the Compuerto reservoir to its mouth at the Pisuerga river, subareas of no less than 70 km2 were defined in a total of 3000 km2 approximately (Figure 1b).
2.1.2. Hydromorphometric Characterization and Controlling Factors of the Basin and Sub-Basins
The morphometric analysis of each delimited sub-basin involved the characterization of the drainage network, relief, basin geometry, and the drainage texture, using ArcGIS toolbox packages, as shown in Table 1.
In addition, the elevation profiles of the longest flow-paths per sub-watershed were generated and analyzed. In order to compare the profiles, normalized profile curves were drawn using the R-Profiler add-in; thus, values of concavity index (CI) (Equation (1)), distance (Equation (2)), and height ratios (Equation (3)) were calculated [40]. Similarly, inflection points were identified according to the slope cuts (Knickzones) [40,41], which were analyzed according to the previously generated geomorphological cartography, lithology, presence of geological structures, influence of hydraulic structures, anthropic fills, and different evidence collected in the field.
where Ha = difference in altitude between the middle profile and a straight line joining the two ends of the profile and Hh = difference in height between the channel head and the outlet.
where Lp = stream distance from the river mouth at the point of measurement and Lo = stream distance from the river mouth at the drainage divide.
where Hp = stream altitude at the point of measurement and Ho = stream altitude from the river mouth at the headwaters.
IC = 2Ha/Hh
Distance ratio =Lp/Lo
Height ratio = Hp/Ho
2.2. Hydrogeomorphic Analyses of the Fluvial System and Segmentation into Units of Study
Once the analysis at the sub-basin level was completed, the main channel was characterized, defining units with geomorphic criteria on which different attributes were calculated, as detailed in the following sections.
2.2.1. Delimitation of Hydrogeomorphic Units—Classification of the Fluvial Landscape
The delimitation of the main channel and hydrogeomorphic elements was made, obtaining floodplain-phase and channel-phase geomorphic patches [12].
Over the floodplain, geomorphic units were classified into four types: unvegetated or sparsely vegetated point bars, alluvial plains, oxbows, and river terraces.
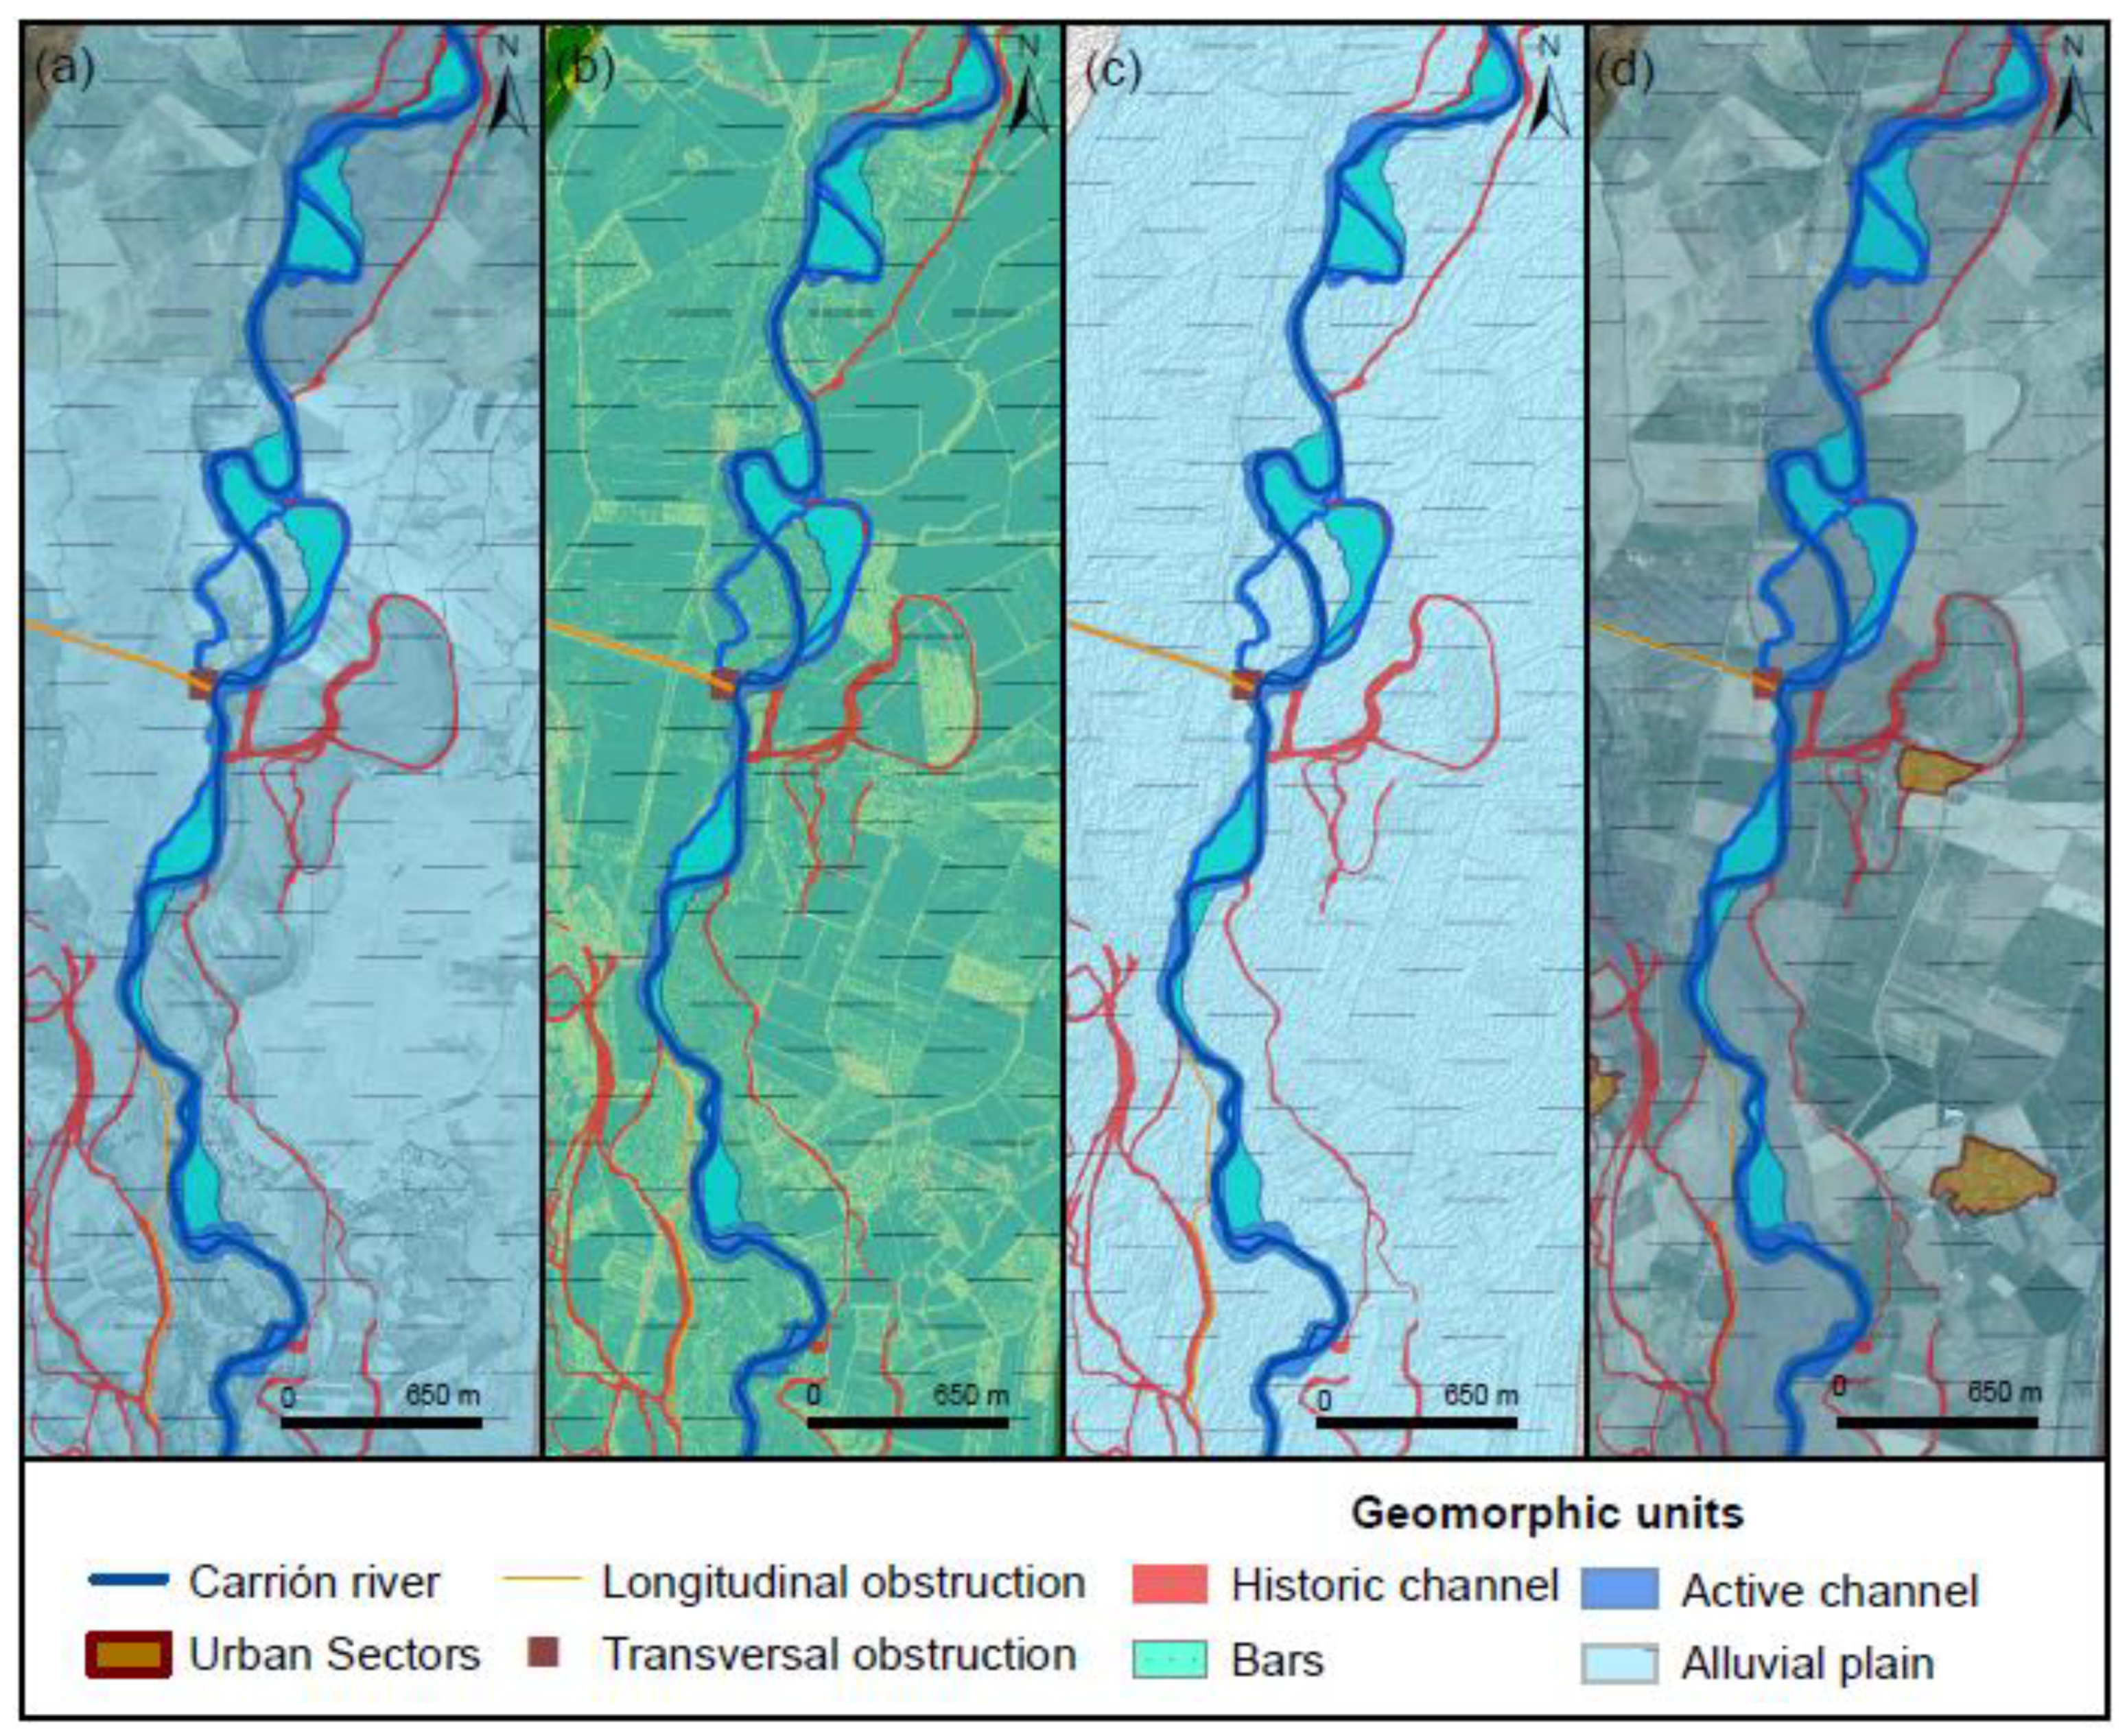
The geomorphic elements identified in the channel were classified into the low channel, high channel, mid-channel bars (having no or sparse vegetation), and islands (mid-channel islands having dense vegetation). Once the units were defined, the so-called active channel was delimited, comprising the high channel and the alluvial bars (Figure 4) [14].
The delimitation of the geomorphic units was carried out using a 1 m resolution DTM generated from the LiDAR data, as well as derived raster (slope maps, hillshades, and curvatures), orthophotographs (from PNOA 2017), historical aerial photo analysis (from the American flight of series B), and ephemeral and topographic evidence data collected in the field, which allowed us to define the specific fluvial dynamics and to delimit with a high level of detail the geomorphic units generated by the passage of water over the terrain, as can be seen in Figure 4. For further methodology details, refer to Lombana and Martinez [26].
2.2.2. Main Drainage System Segmentation and Characterization
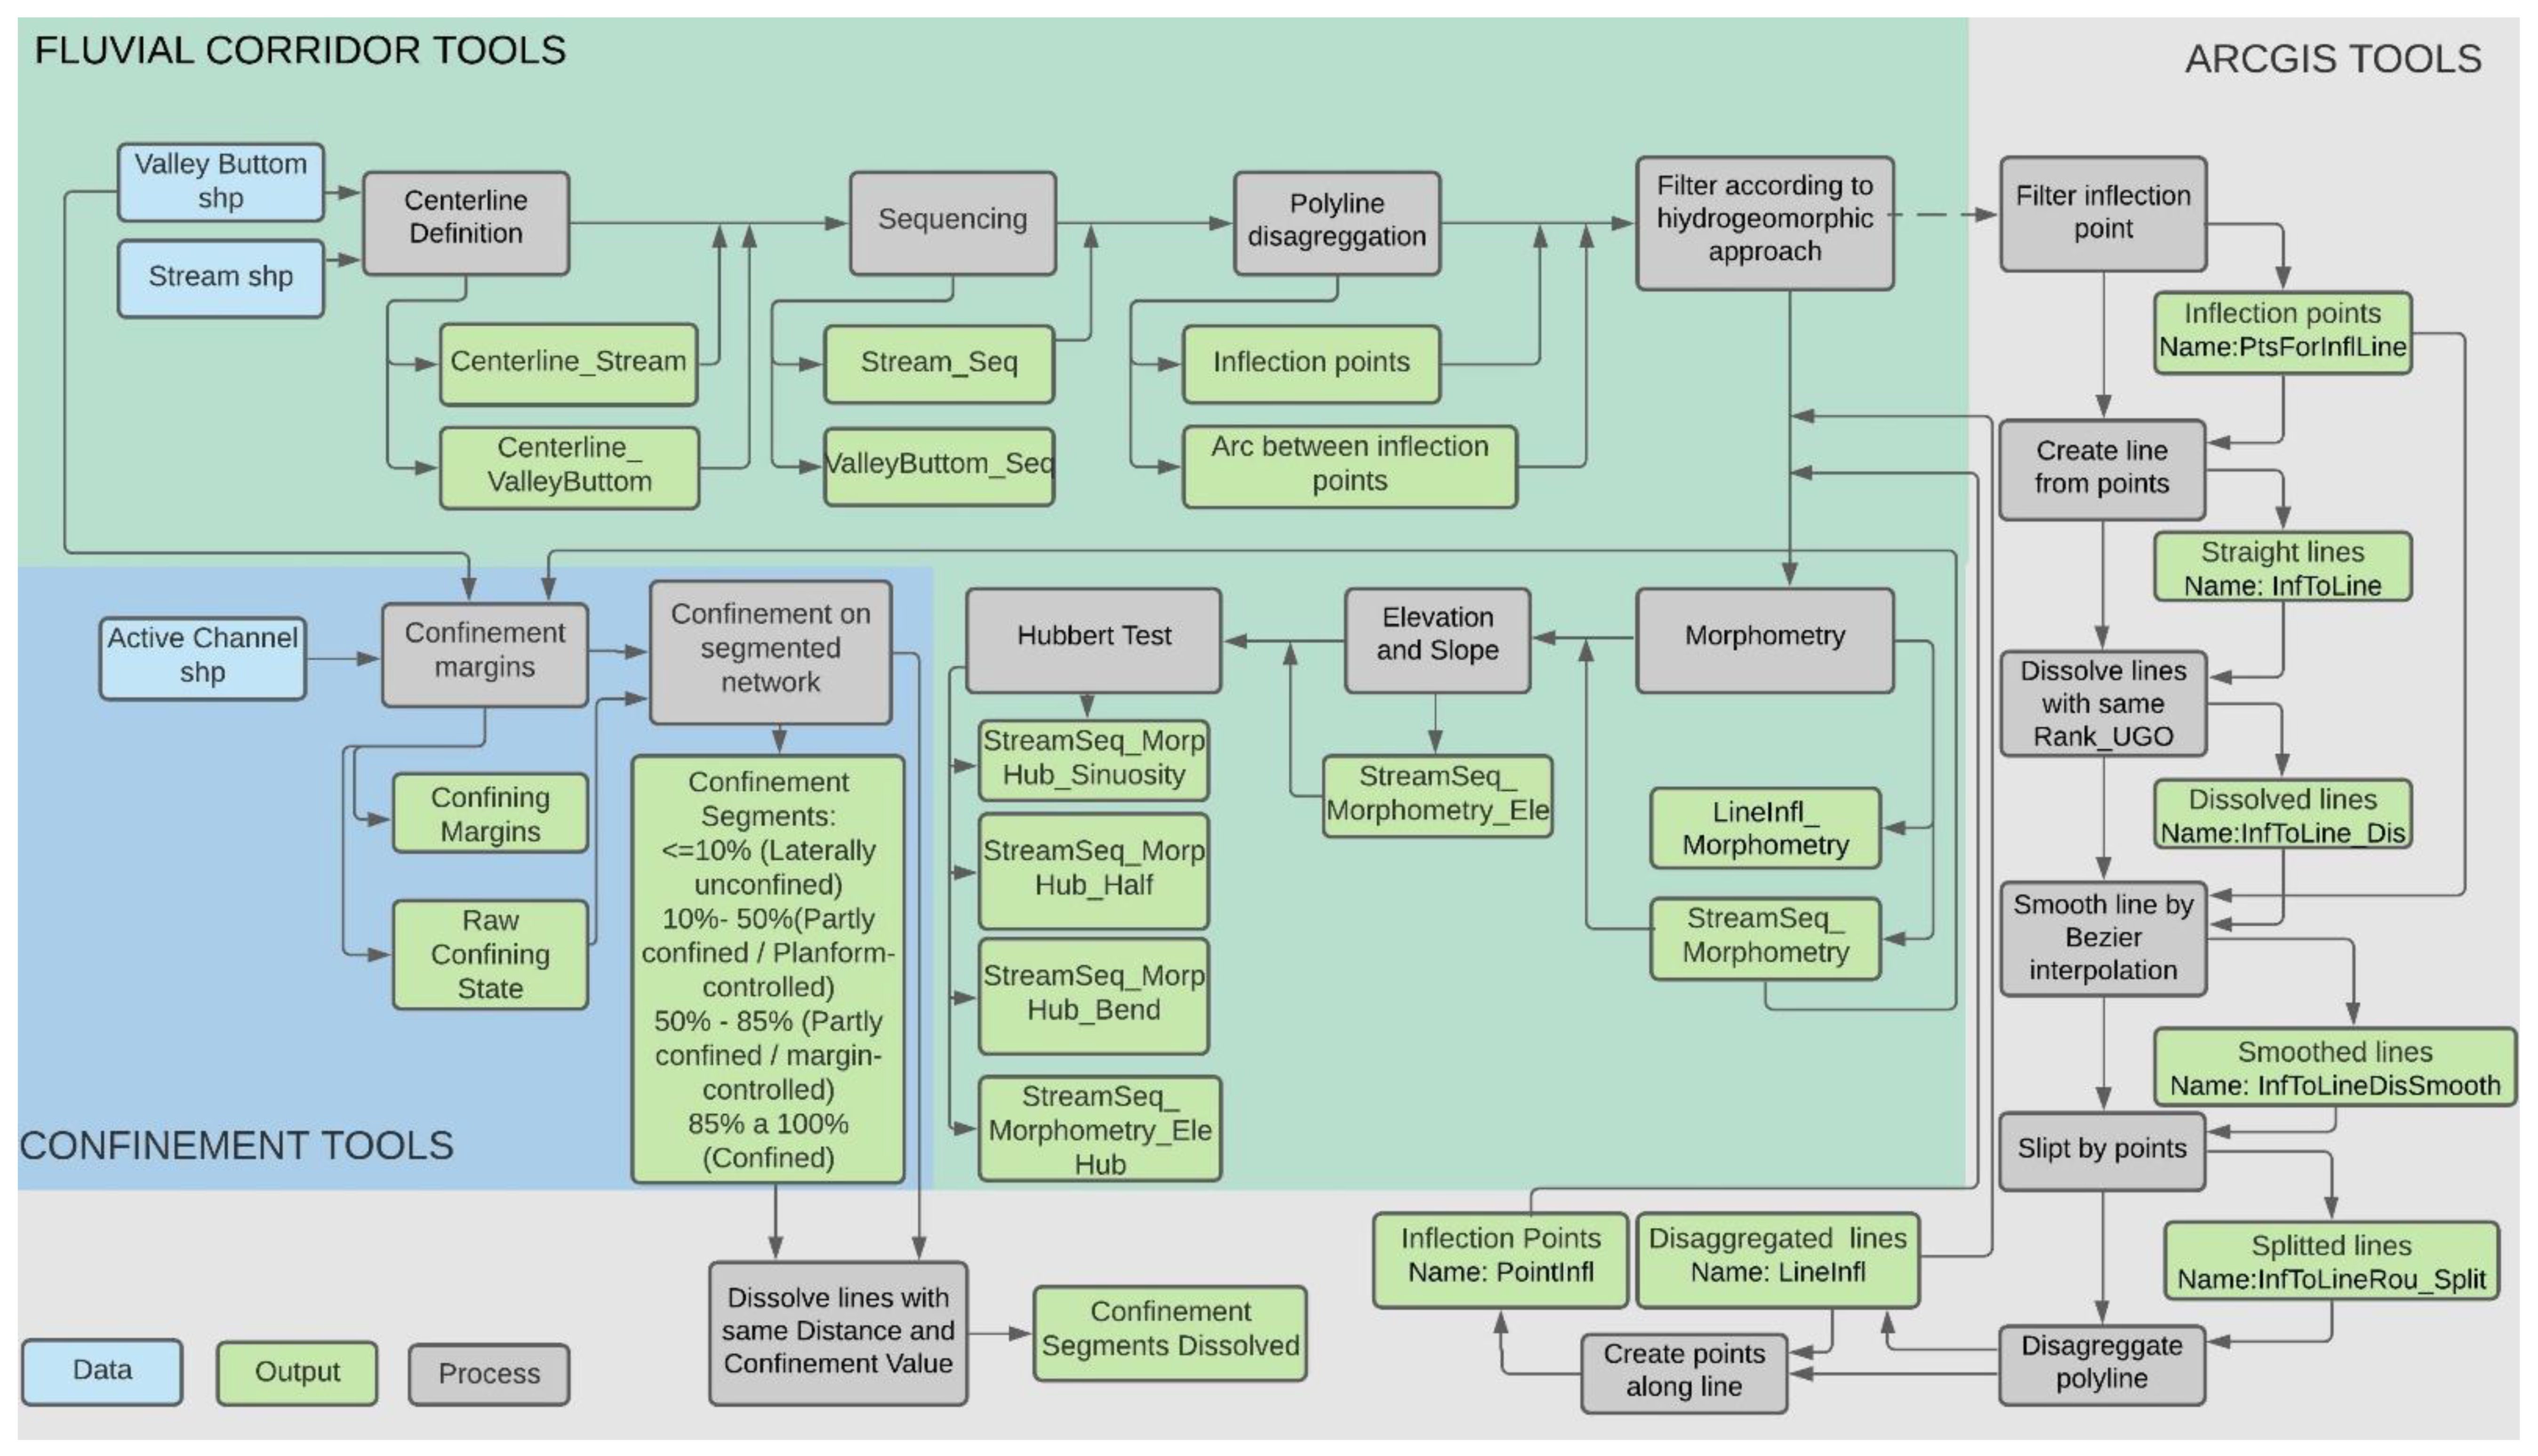
In order to aggregate the relatively homogeneous spatial characteristics, a structured set of segments of the fluvial axis and the alluvial plain were defined. Then, statistical analyses were performed using the Fluvial Corridor tool package [17]. Although the tool allows the definition of inflection points in the route of the channel main axis, in the present study, a modification of the method was carried out based on the filtering of inflection points of principal interest and the definition of arcs for the metric analysis of sinuosity, half-amplitude, and bend-length changes, as shown in Figure 5. Additionally, using the Confinement tool package, the confinement analysis was performed for the main channel of the Carrión river, as an indicator of river lateral mobility potential [13]. The classification of the values obtained was performed according to the categories presented in O’Brien et al. [43].
2.3. Multivariable Integrated Analysis to Definition and Prioritization of River Reaches
Once metrics of sinuosity, half-amplitude, bend-length, and slope were determined, sets of segments with similar values were identified based on statistical tests, for which the Hubert test was applied. The test is based on the concept of standard deviation, assigning a confidence level of 95% that ensures a strong significance [44]. Subsequently, the intersect of the variables was performed, jointly analyzing the confinement values, the geomorphic units, the presence of hydraulic structures (transverse and longitudinal obstructions) (Figure 4), urban centers, and afferent drainages (surface water bodies).
3. Results
The results of indexes and parameters calculated are shown in detail in Supplementary Material.
3.1. Characterization of the Physical Conditions and Controlling Factors of the Spatial Units
3.1.1. Drainage Network of the Carrión River
The Carrión river basin has a total length of drainages of 4300 km, classified as seventh-order, finding the maximum value in the Valdeginate river, being sixth-order, which corresponds with the maximum stream number (Nu) of 475 calculated for first-order drainages.
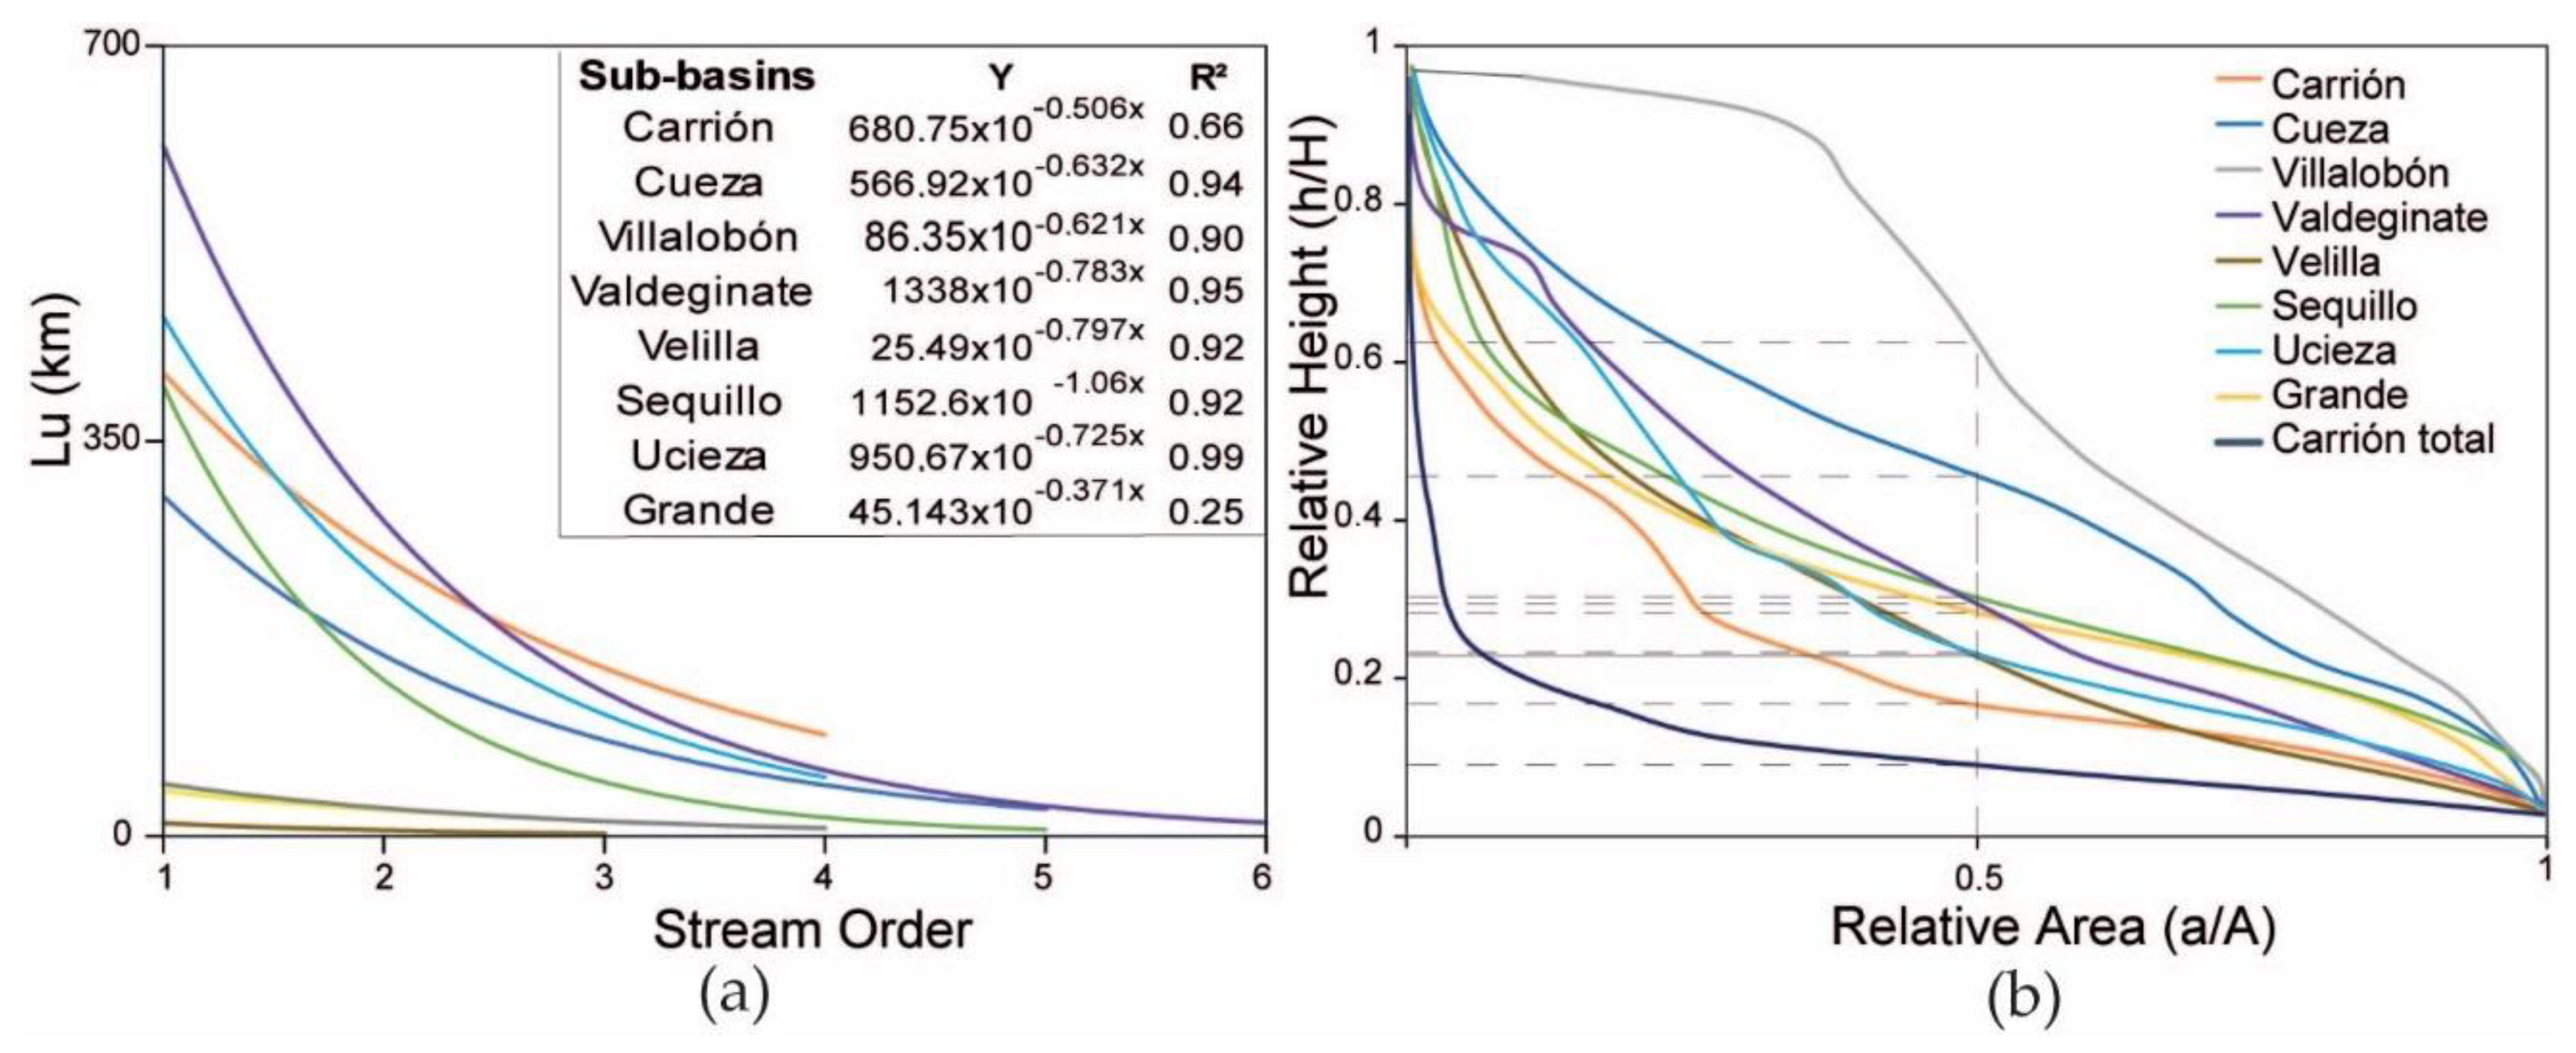
In general, as the stream order increases, its length decreases [45], showing an exponential trend according to the correlation coefficients determined (Figure 6a). On the other hand, the stream length ratio (Lur) varies in the range of 0.2 to 2.1 throughout the study area, accounting for the degree of geomorphological development of each sub-basin [46], which conserve values around 0.6, being differentially higher only than that of the Grande river located in the upper basin of the studied area.
The mean bifurcation ratio (Rbm) moves between values of 1.6 and 2.4, where lower values reveal basins that present less structural changes, whose drainage patterns have not been distorted by geological or structural drivers [13,46]. On the contrary, a larger bifurcation ratio indicates structural influences, as occur in the sub-basins of analysis, where the bifurcation ratio (Rb) varies from one order to another by an average of 50%.
The Rho coefficient (p) is a parameter that is related to the drainage density and physiographic development of a basin, allowing storage capacity evaluation [46]. For the case of the study, the coefficient maintains values close to 0.4.
3.1.2. Basin Geometry Analysis of the Carrión River
With respect to the shape factors (Kf) obtained, the sub-basins with lower values are less susceptible to flooding (as is the case of the Carrión river sub-basin with a factor of 0.05) than those with higher values (e.g., the Valdeginate river).
On the other hand, the elongation ratio (Re) presents values between 0.26 and 0.82, with a value for the total basin of 0.51, representative of elongated watersheds [31].
One of the highest values was recorded for the Valdeginate river, which implies greater vulnerability to sudden floods in comparison to the other sub-basins [31], considering furthermore that it does not have regulation systems.
The shape factor ratio (Sf) allows analysis of the drainage irregularity [18]. For the study, the greatest irregularity was calculated in the Carrión river sub-basin, with a maximum of 38.17. The minimum value corresponds to the Velilla reservoir, the smallest sub-basin, which is influenced by the hydraulic structure mentioned.
The circularity ratio (Rc) represents the similarity of the basin shape with a circular geometry, where low values indicate relatively elongated watersheds controlled mainly by geological structures; basins with little structural influence present ratios close to 1 [13]. In the case of the study area, the lowest Rc value was obtained for the Carrión river sub-basin (0.03) and the highest for the Grande river (0.2), so it can be indicated that all the analysis units are elongated with mainly geological control, as can be seen by the values of the compactness coefficient (Kc) far from the unit and the circularity ration (Rcn).
3.1.3. Relief Characterization
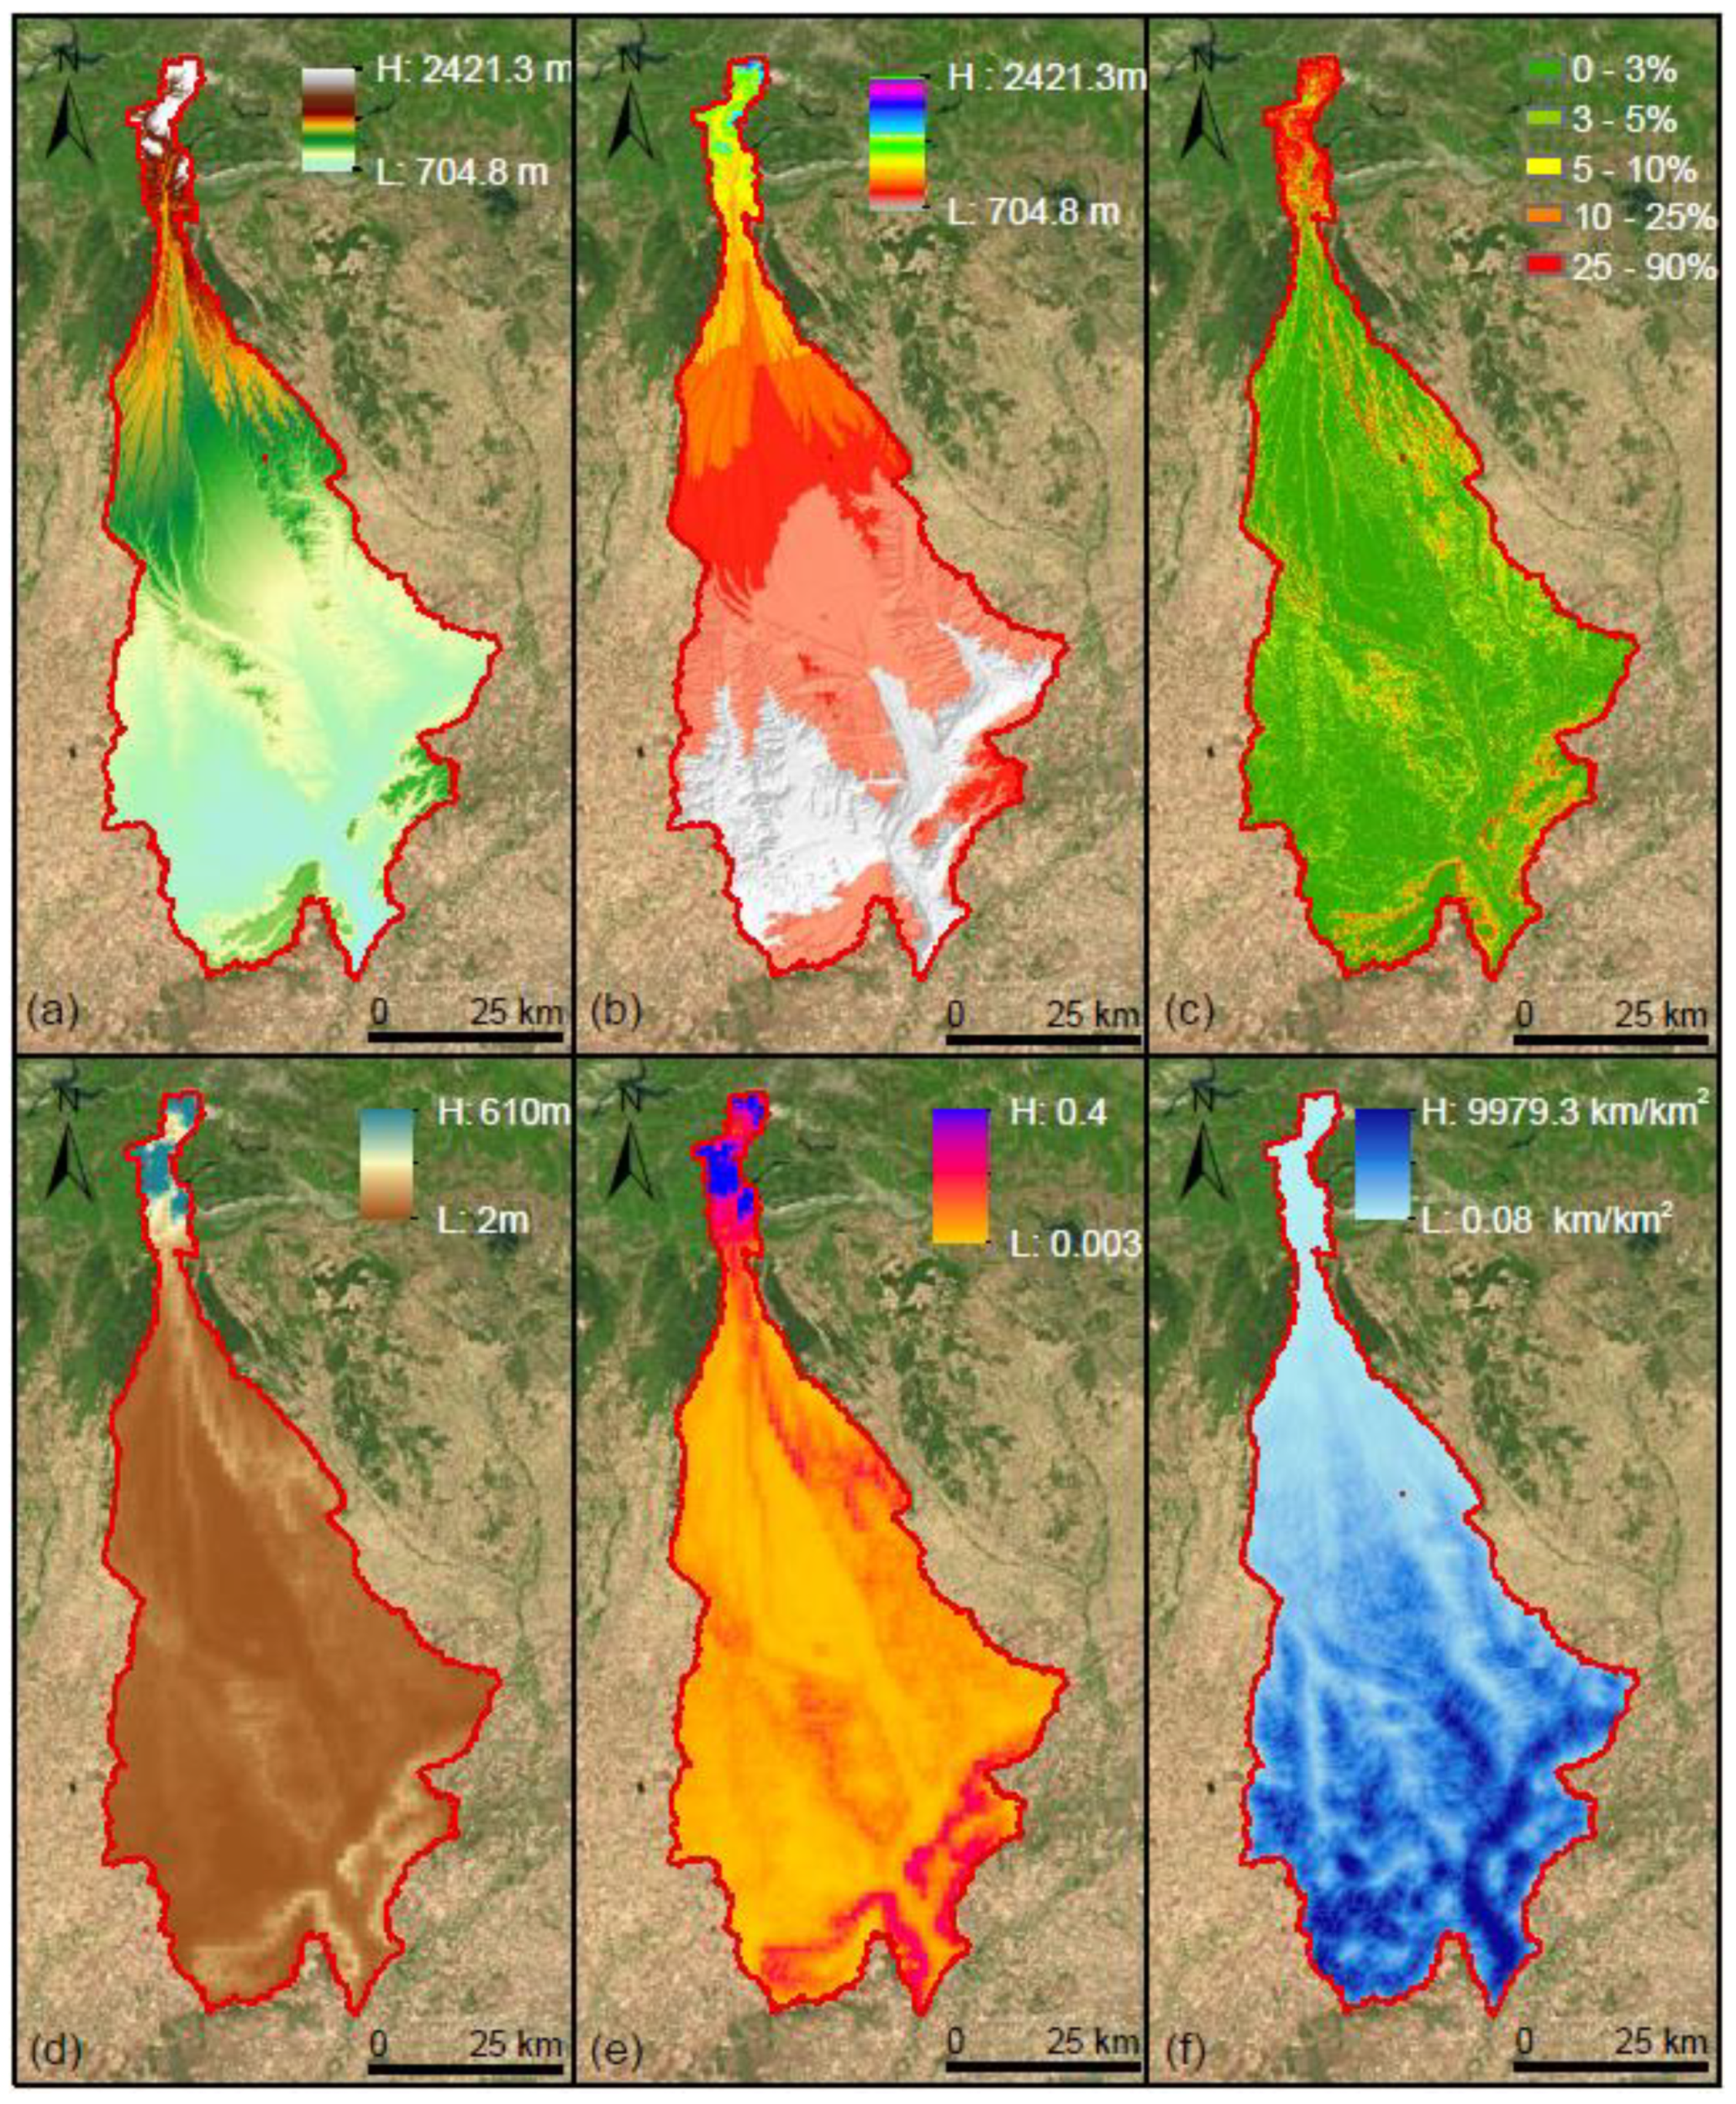
Total basin relief (H) defines the difference between the elevation of the mouth and the highest point of the basin (Figure 7a,b); on the other hand, the relief ratio (Rhl) provides a measure of the average drop in elevation per unit of axial length [13]. For the Carrión river, the ratios maintain values between 0.009 and 0.004, except for the sub-basins in the upper basin, corresponding to the Grande river and Velilla reservoir. In general, an average slope of 0.014 is calculated for the watershed, meaning that it has low relief (Figure 7c), which can also be concluded from the relative relief (Rr), which represents the variation in altitude in a unit area with respect to its local base level (Figure 7d) and the low relative relief ratio values obtained (Rhp) within 0.16 and 0.18, except for the upper basin, which corresponds to mountainous areas, which present Rhp greater than 2.
In relation to the ruggedness number (Rn) and Melton ruggedness number (MRn), it can be indicated that the low values calculated suggest that the sub-watersheds are less prone to erosion phenomena and have a structural configuration intrinsically associated with relief and drainage density [46].
The hypsometric curves vary according to the tectonic and geological configuration of each analysis surface [13]. At the sub-basin level, the upper hypsometric line in Figure 6b typifies a drainage area that has a significant portion of its surface in areas of relatively high relief, being the case of the Villalobón stream, where more than 50% of the area has a relative height of 0.62, presenting deep and narrow valleys in its configuration. On the other hand, the lower curves reflect terrains of low relative height where the sub-basins have a significant surface proportion in smoothed foothills and valley bottom plains; the case of the Ucieza river is representative, where 50% of the area is located at relative heights lower than 0.23—that is, elevations less than 836 m above sea level. However, it is important to indicate that, in general, the curve obtained for the basin is characteristic of highly developed drainage areas, which have steep peaks (as is the case of the Grande river, where 50% of the area exceeds 1409 m.a.s.l.) and extensive valleys (as is observed in the Carrión river sub-basin, where 50% of the area is located at relative heights of 0.6, i.e., less than 876 m.a.s.l.). This is also represented in the HI values obtained for the catchment, which represent the state of development and erosion; high values of the hypsometric integral indicate young stages of maturation or less eroded areas, while lower values reflect areas with greater denudation and more advanced stages of maturation (old stages) [48]. In the case of the Carrión river, the sub-basins are mostly categorized as old stages, i.e., stabilized states characterized by the presence of abandoned meanders and highly sinuous paths (case of the Carrión river sub-basin), and as mature stages or with equilibrium conditions (Villalobón and Cueza river sub-basins).
The dissection index (Di) is a factor that indicates the degree of vertical erosion present in the analysis catchment and suggests the stage of geomorphological development in a physiographic region; values close to 0 indicate an absence of vertical erosion and values close to 1 indicate high slopes with high erosion rates [45]. In this sense, the average value obtained in the sub-basin was 0.08, with the maximum value of 0.2 obtained in the upper basin and the lowest value of 0.01 present in the middle basin, so it can be indicated that the highest vertical erosion rates are found in the Grande river (Figure 7e).
3.1.4. Drainage Texture Analysis
Information about terrain dissection degree can be provided by the drainage density (Dd), which has a significant influence on the transfer of liquid and solid flow through the drainage area [13]. This parameter is directly influenced by vegetation cover and land use. Dd values are in the range of 1.02–1.96, with an average of 1.4, indicating moderately drained areas whose density is largely conditioned by flat reliefs and moderately permeable soils [45]. The lowest density occurs in the upper watershed, where more resistant lithologies and greater slopes are identified (Figure 7f).
With respect to the stream frequency (Fs), values around 1.1 were obtained, indicating moderate permeabilities along the basin [18]. On the other hand, the drainage intensity (Di) shows an average value of 0.82, being the maximum of 1.1, indicating a low Di; in this way, it can be indicated that the Fs and Dd have little influence on the terrain as the surface has been modeled by denudation agents. In this sense, runoff waters can remain for a long time in the area, making the basin susceptible to flooding, erosion, and mass removal phenomena [18,46].
The length of overland flow (Lo) refers to the distance that a raindrop can travel before being channeled into a defined drainage or channel. For the specific case, Lo values are around 0.37, with a maximum of 0.49 and a minimum of 0.25; low values are indicative of maturity states in the watershed [18,45,46].
3.1.5. Analysis of Longitudinal Longest Flow-Paths
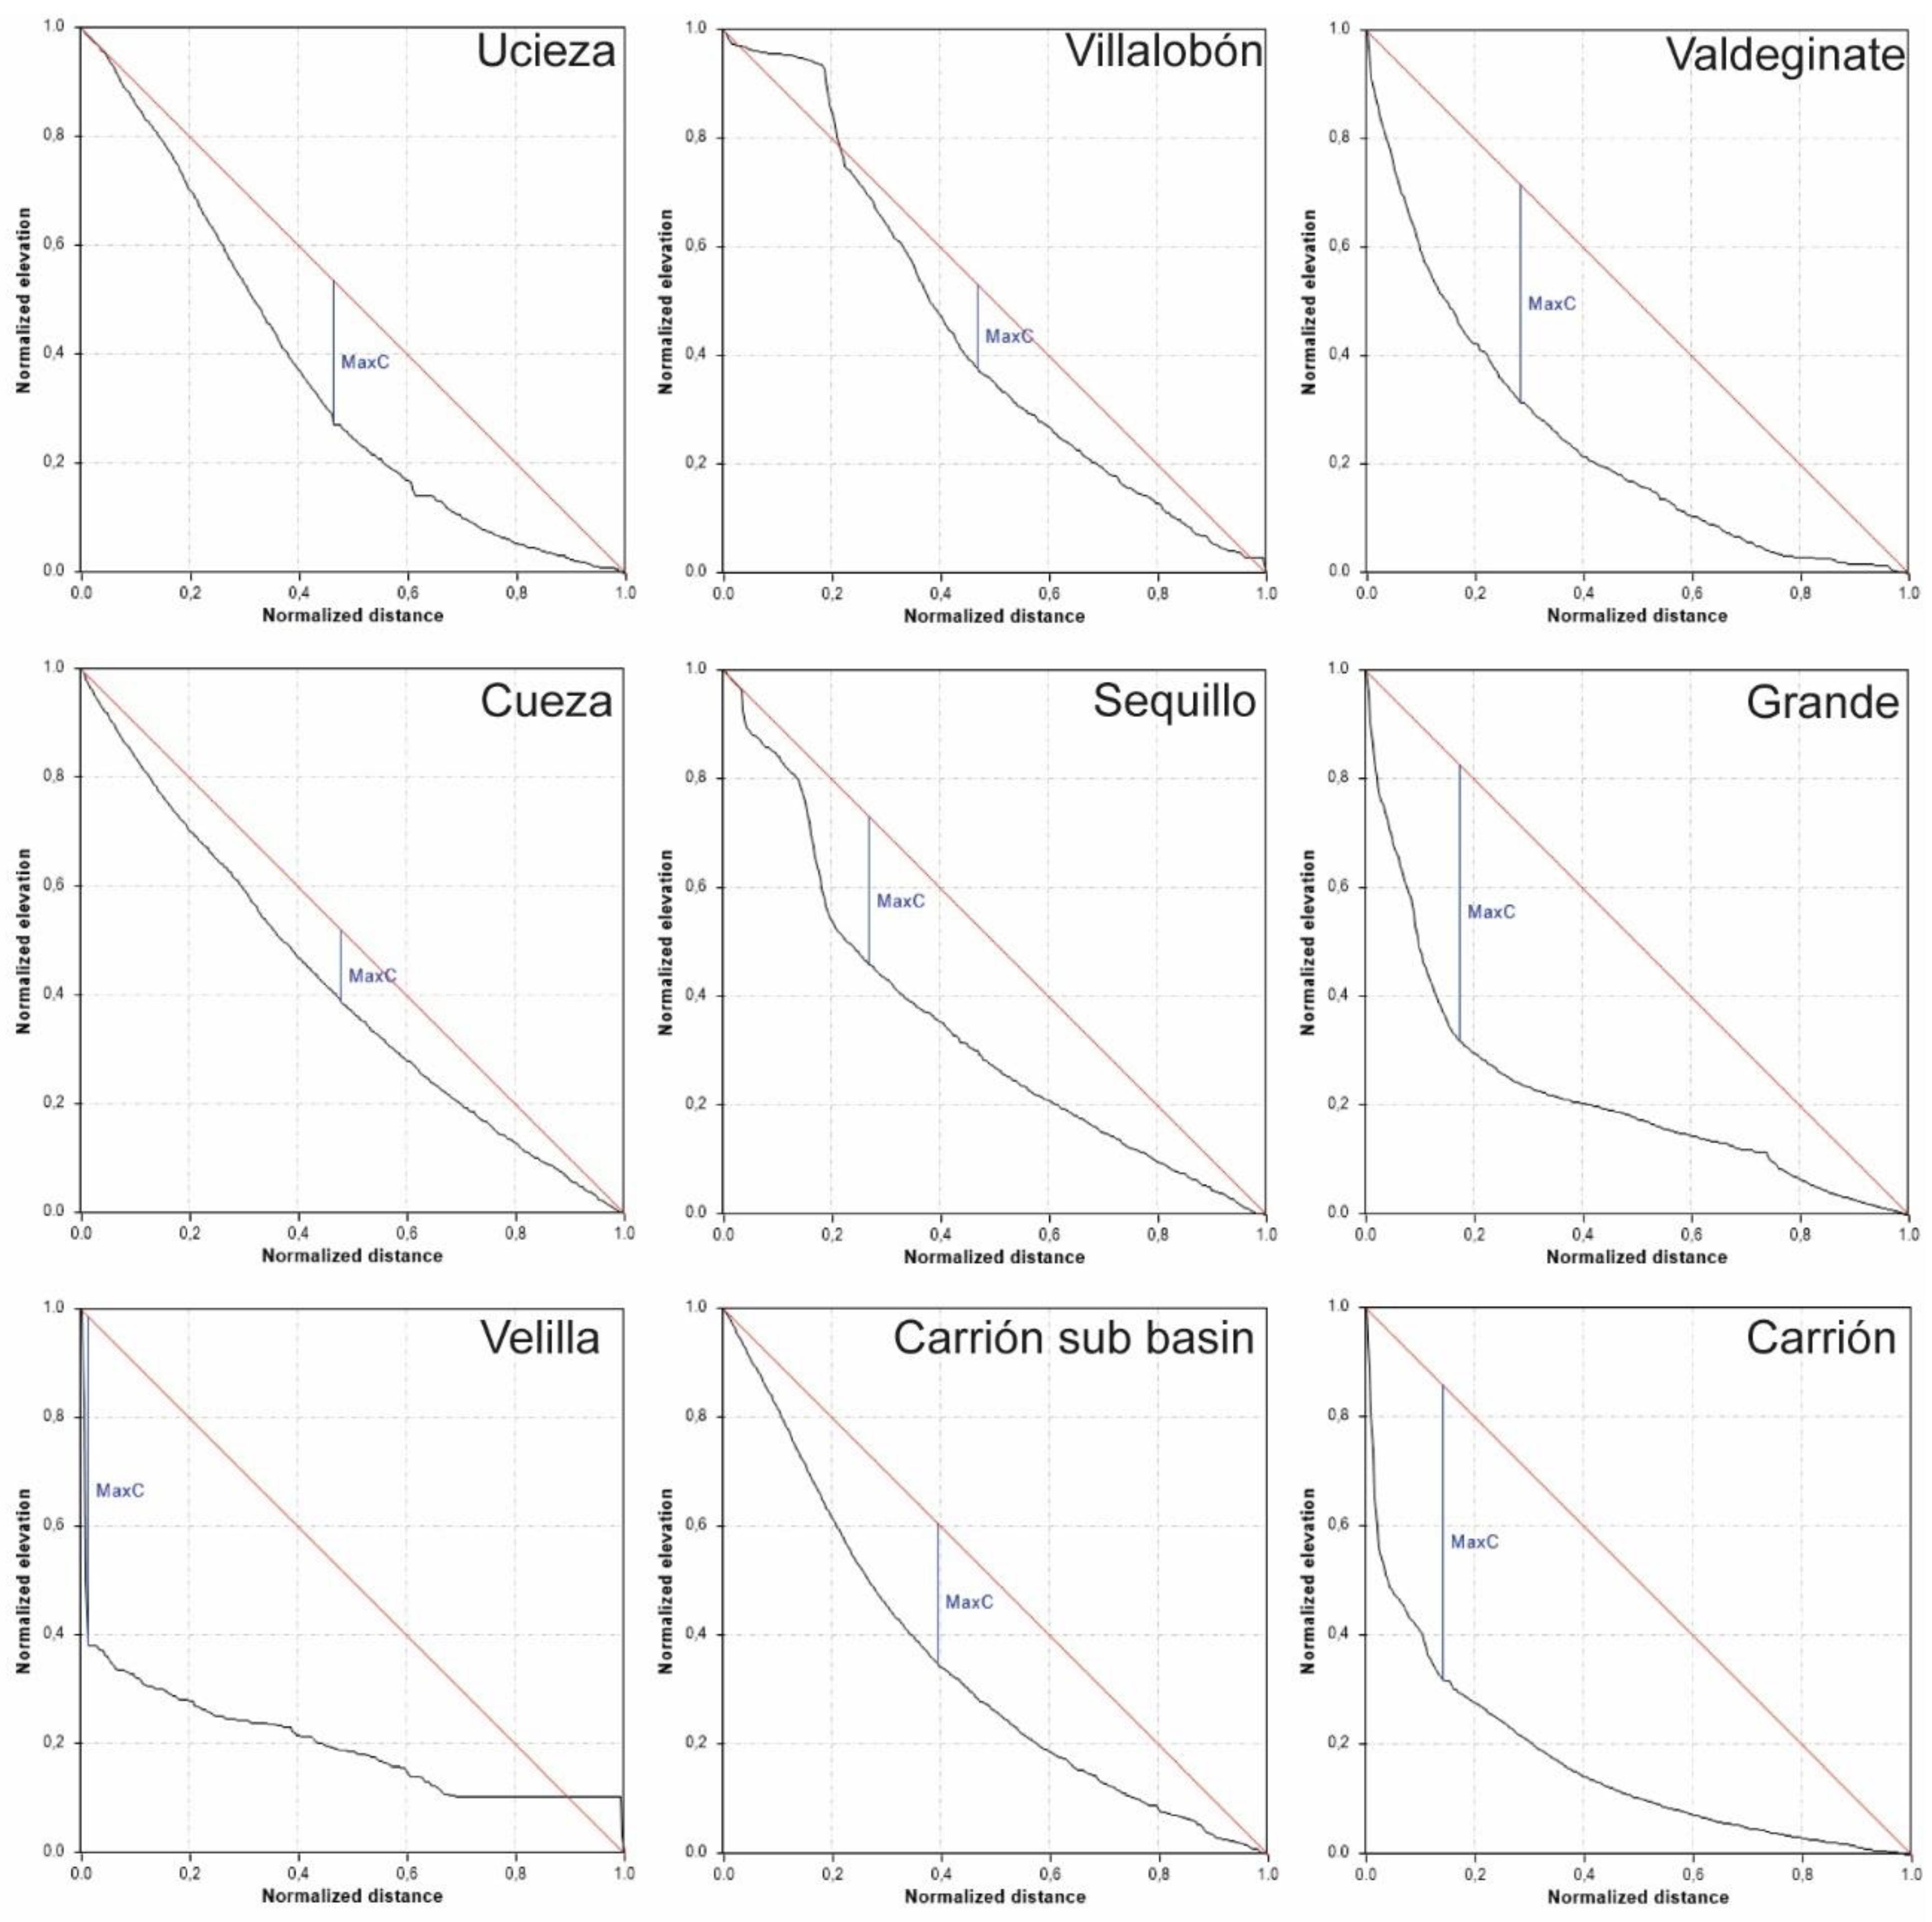
The sub-basins analyzed present longitudinal profiles with concavity values between 0.11 and 0.67 (Figure 8); thus, in sub-watersheds with values close to 0, the profile tends to conform to a straight line, as is the case of the Villalobón stream and the Cueza river, which present concavity values of 0.11 and 0.17, respectively. On the other hand, although low concavity is identified in the Cueza river, the average slope of the flow-path does not vary substantially along the course, remaining around 0.004.
At the same time, the profiles with the greatest concavity are found in the Grande, the Valdeginate, and the Carrión river sub-watersheds, with values of 0.5626, 0.5282, and 0.3167, respectively. This is a typical configuration of rivers that present more advanced maturation stages, being considered old streams, which agrees with the results obtained from the hypsometric curves previously analyzed [40,41].
Regarding the knickpoints, profiles such as those of the Sequillo river show marked inflection points that are directly related to the geomorphology; in the specific case, the changes in slope are due to the passage through the different levels of alluvial terraces of the Carrión river. In the case of the Villalobón stream, it is important to highlight the section of connected profile that occurs at distances from 0 to 4700 m, which is due to the slope cut between the structural surface of Páramo limestones and the incised transverse valley dissected by the same stream. Similarly, in this profile, the last knickpoint occurs near the Palencia center, located on alluvial terraces of the Carrión river.
On the other hand, knickzones can also be associated with the presence of anthropic elements such as ponds and reservoirs, dams, roads, and diversion channels. In the case of the Grande river, the main slope break is located in the area where the Besandino reservoir is located, at an elevation of 1242 m.a.s.l. For the Carrión river sub-watershed, due to the presence of transversal roads and hydraulic infrastructure, slope changes are identified.
3.2. Hydrogeomorphic Analysis and Fluvial System Segmentation
3.2.1. Hydrogeomorphic Units and Landscape Classification
The Carrión river has a variable configuration along the study section, characterized by a rectilinear main channel at its upper basin, whose course becomes more sinuous as it moves southward, with varied typologies, whether rectilinear with the formation of marginal bars, low sinuosity braided, or meandering with point bars. The river moves laterally on the alluvial plain in a west–east direction and vice versa, leaving networks of active and abandoned channels. This river movement has triggered the basal undercutting of the contacted hillsides, causing rotational landslides, which give way to the river course’s continuous migration.
At the upper basin, the fluvial course presents a narrow alluvial plain, which widens towards the middle and lower basin, presenting an extensive network of secondary drains that feed the main channel, until reaching a wide floodplain at the mouth in the Pisuerga River.
Among the formations of fluvial origin, the system of inset and stepped terraces developed mainly towards the right bank of the Carrión river stands out, whose extension, height, and number of levels increase as one descends towards the south.
3.2.2. Segmentation and Characterization of the Fluvial System
Segments were defined to study the metric changes in sinuosity, half-amplitude, and bend-length along the main channel. In this sense, the sections defined with this criterion retain average lengths of 520 m, in some cases reaching values close to 1000 m in the flatter areas, where the arcs near the mouth must be analyzed.
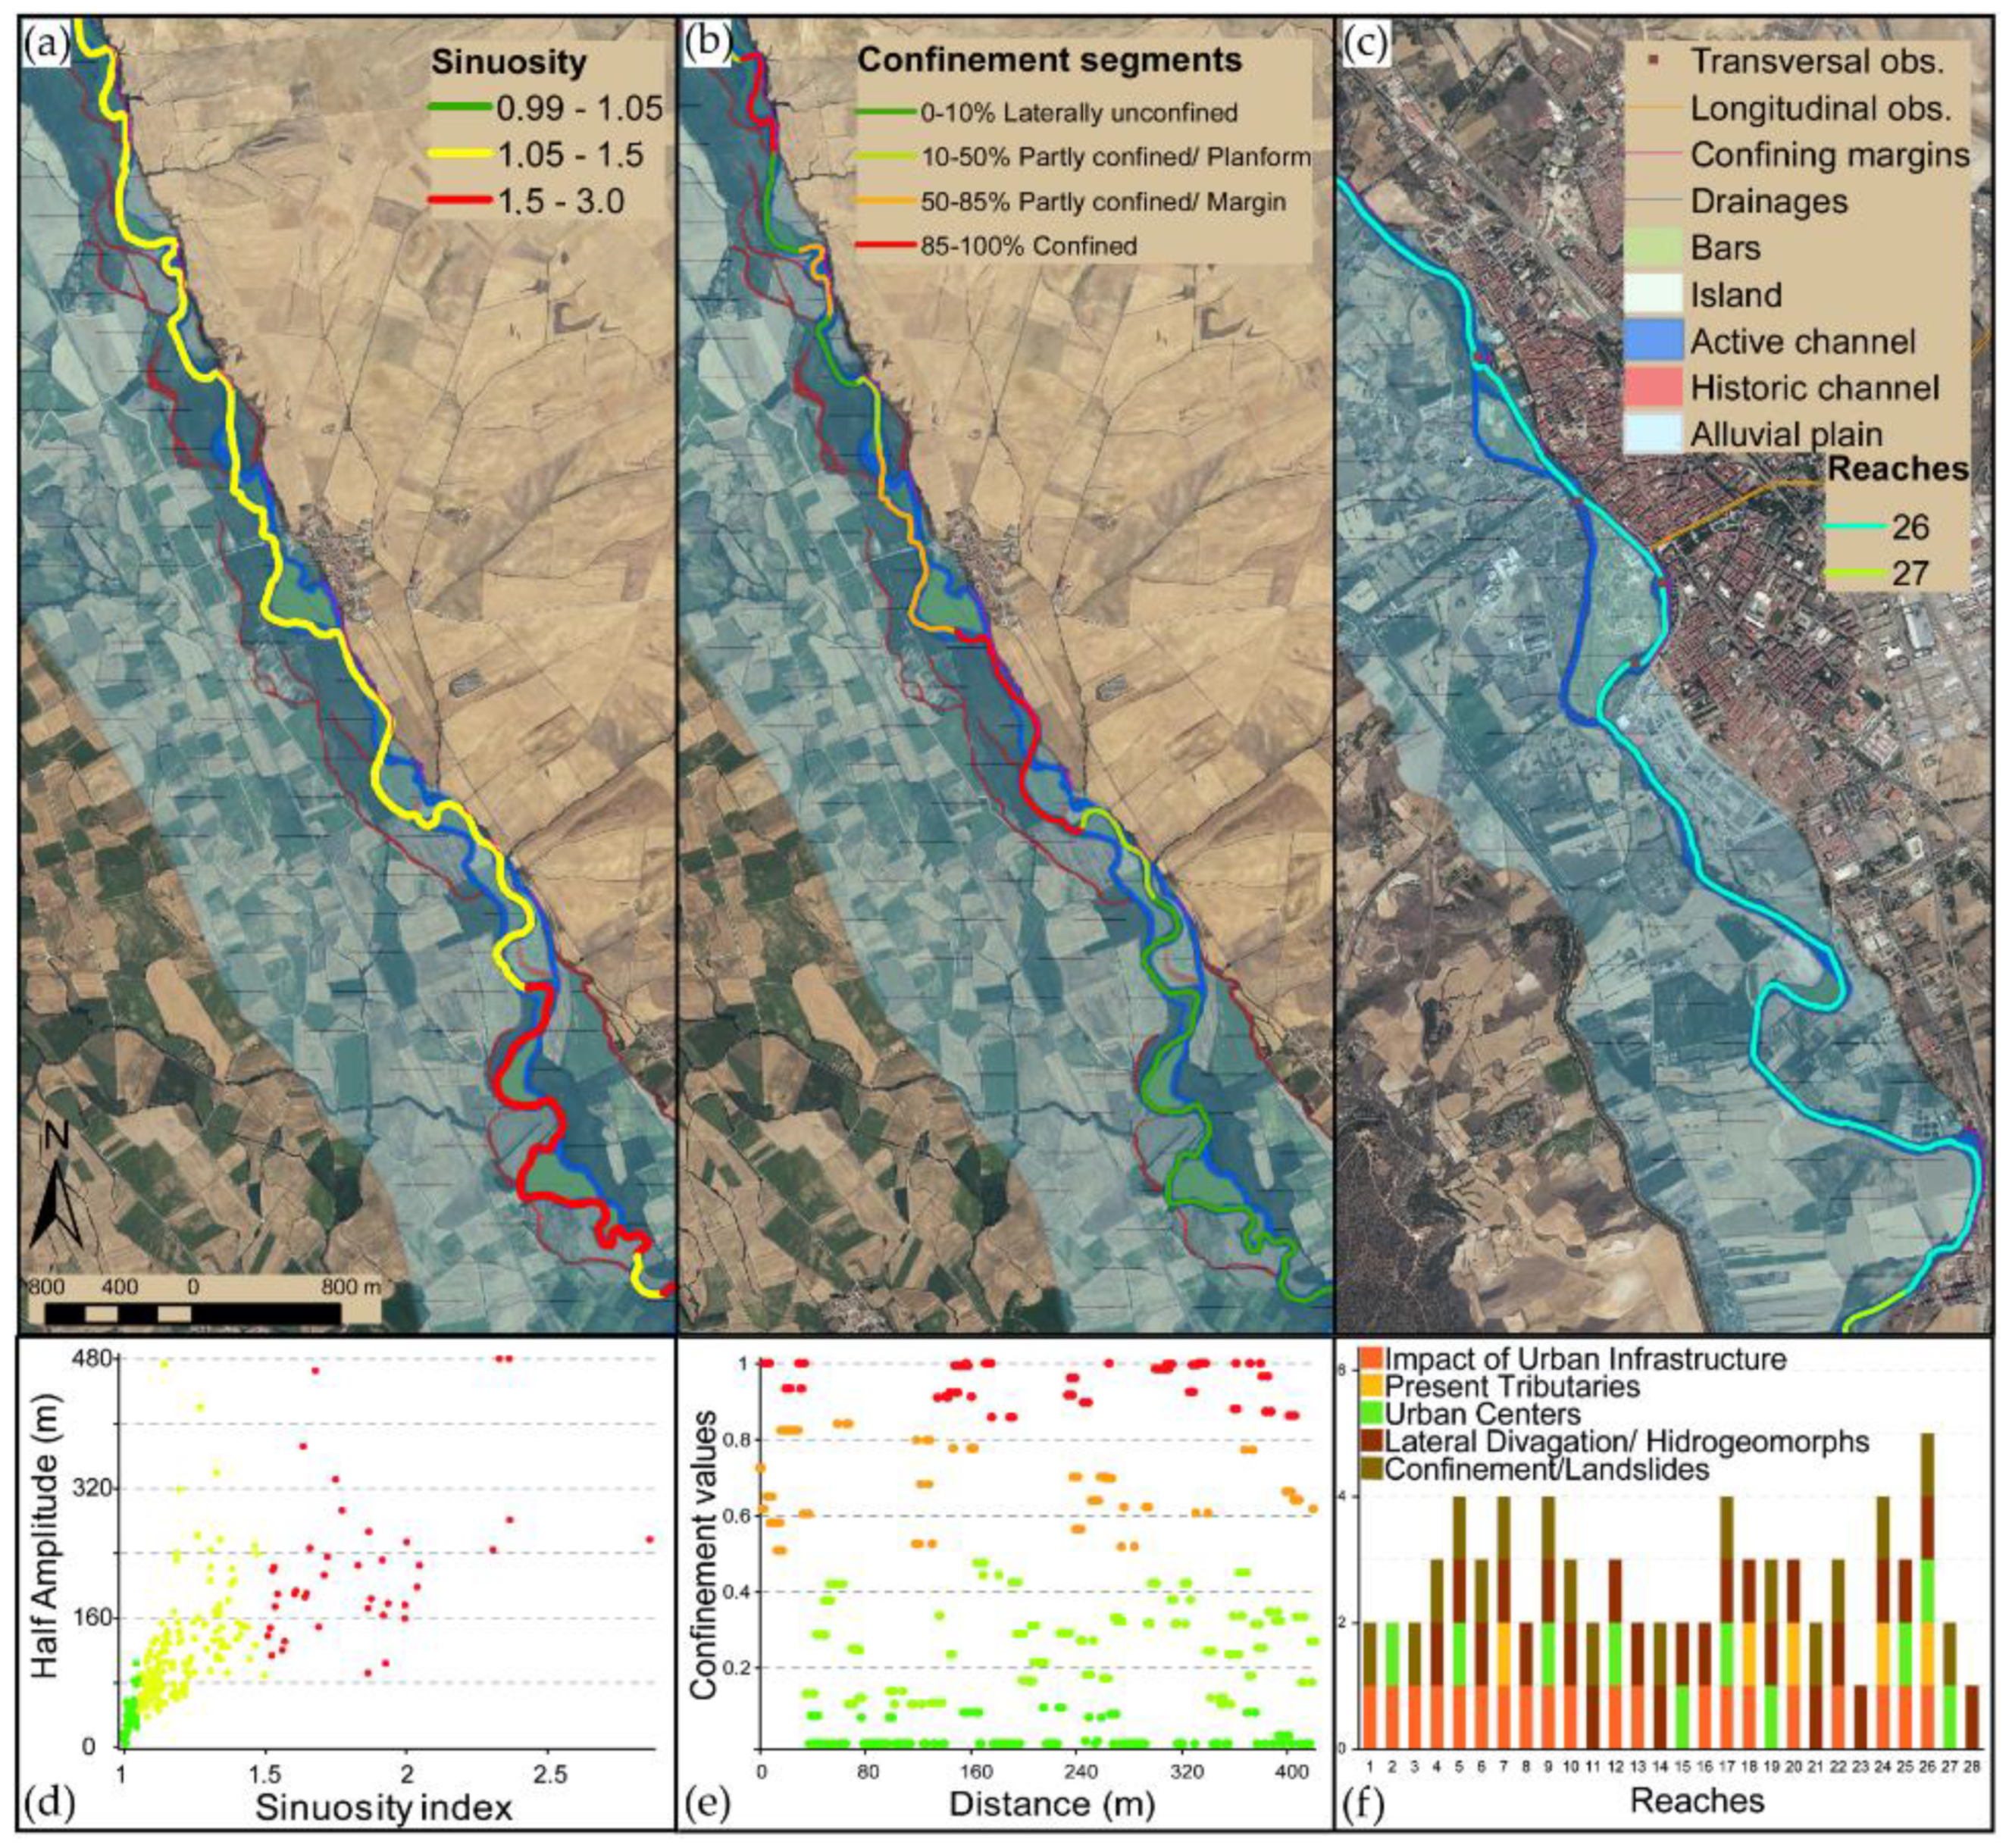
Regarding sinuosity, 63% of the sections studied are classified as sinuous, 17% as meandering, and 20% as straight (Figure 9a). The straight sections are located mainly in the upper basin near the Velilla reservoir. On the other hand, the sinuous segments are in the middle and lower basin, increasing as the river’s course progresses; likewise, the meandering sections are located after 42 km, increasing in frequency in the middle–lower basin. Concerning half-amplitude, as expected, as the sinuosity increases with the average amplitude of the arcs (Figure 9d).
When the confinement analysis was performed (Figure 9b), it was determined that approximately 55% of the study section is not laterally confined, so that 84 km of the river’s length presents a greater probability of migration; on the other hand, 30% of the sections studied are partially confined, either by channel margin control (10%) or by alluvial plain margin control (20%); approximately 15% of the sections were considered to be confined on some of their margins (Figure 9e).
After applying the Hubert test, seven homogeneous sections were identified considering sinuosity, five according to bend-length, and four for curvature radius and slope.
3.3. Multivariable Integrated Analysis to Definition and Prioritization of River Reaches
The homogeneous segments by variable were intersected to obtain 15 reaches, which, once analyzed according to the values of confinement, fluvial landscape classification, and anthropic intervention, resulted in a total of 28 sections of interest (Figure 9c), which could be characterized according to the presence or absence of the following categorical elements (Figure 9f):
- Impacts generated by anthropic infrastructure on the water body: refers to the location of transverse (e.g., weir) and longitudinal (e.g., levees) hydraulic infrastructure, road crossings, and diversion canals such as the Canal de Castilla.
- Existence of urban centers: considers the exposure of urban centers on the banks of the Carrión river.
- Presence of tributaries: implies the existence of tributaries categorized as a body of water.
- Lateral migration and presence of hydrogeomorphic elements (bars and secondary channels): considers those sections that show marked lateral migration and the presence of bar points, mid-channel bars, and secondary channels.
- Marked confinement and the possible presence of slope landslides: includes those sections that are confined on some of their margins by hillsides, which may present landslides due to the destabilization generated by the main channel.
As is shown in Figure 9c, the categorical elements converge in Section 26, which is the segment located near the Palencia capital, the largest urban conglomeration in the basin (Figure 9f). In this zone, there is partial confinement to the left bank, where the urban area is located; likewise, there are alternate or secondary channels that border two islands (including Dos Aguas Island), on which urban, sports, and leisure infrastructure is developed. In addition, the Valdeginate river and the Villalobón stream flow in the segment, which is also influenced by the southern sector of the Canal de Castilla, factors that condition the hydrological regime and geomorphology of the sector.
The following sections are also highlighted:
- Section 5: It passes near the urban core of Villalba del Guardo (which presents longitudinal obstructions implemented for bank stabilization).
- Section 9: Shows left lateral confinement and slope destabilization due to fluvial action, marked by rotational landslides, crossing near the Celadilla del Río municipality, where bank protection structures have been implemented.
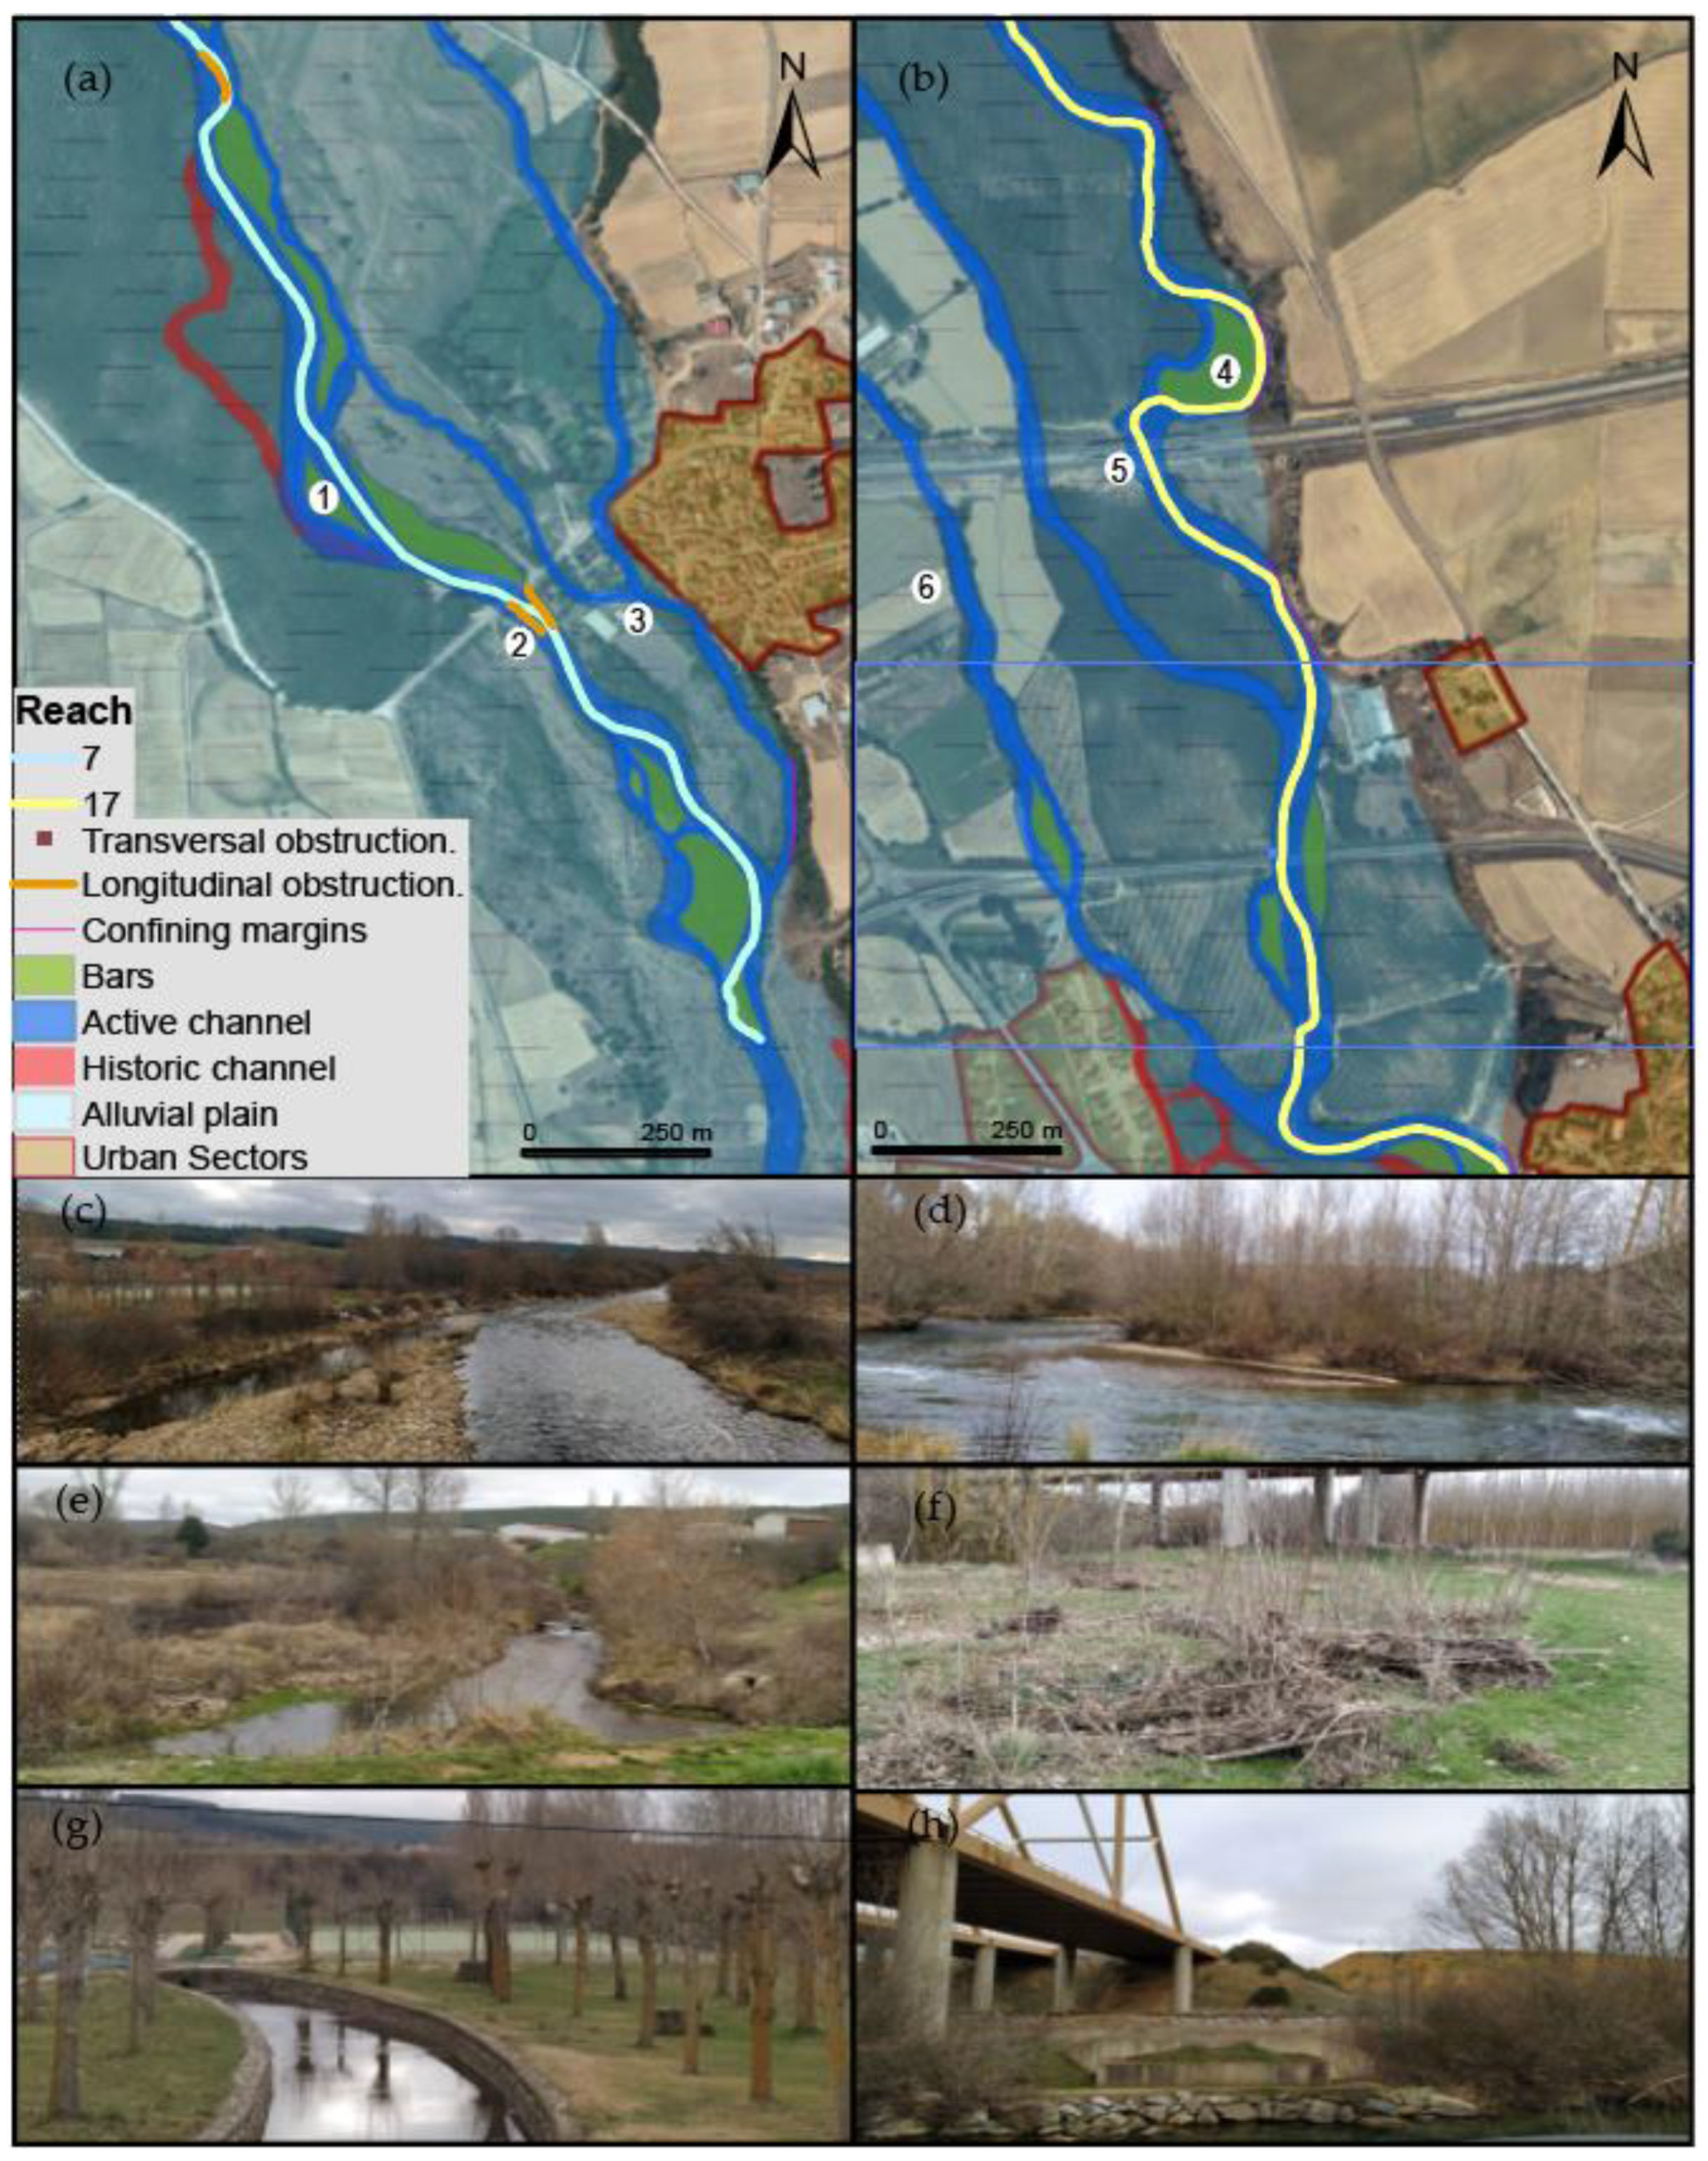
- Section 17 (Figure 10b): The sector of the Carrión river as it passes through the municipality of Carrión de Los Condes, it presents a high lateral migration, with the formation of point bars (Figure 10d) and multiple secondary channels that left ephemeral evidence (Figure 10f). This reach presents an impact on its fluvial course due to the influence of the A-231 highway (Figure 10h).
- Section 24: This section is of interest due to the river direction change at a 90° angle produced by changes in the geology (encounter with Páramo structural surfaces), where the Ucieza river also flows, near the town of Husillos.
4. Discussion
The methodology applied in this study permitted us to analyze at a regional scale the drivers that control the dynamics of water bodies in a basin with an advanced stage of maturation, through the study of hydromorphometric variables [13,18,45]. These previous results were transferred to a river reach level at a highly detailed scale, where it was possible to define hydrogeomorphological units for the classification of the fluvial landscape and its segmentation based on metrics [15,16].
Thus, the integration of different scales of study of hydromorphometric and geomorphological variables in a basin, involving traditional metrics and anthropogenic interventions impact, made it possible to establish and prioritize zones in a highly modified water body, where further multipurpose studies should be carried out, including fluvial risk analyses, and sustainable management measures must be applied. These works may include, for example, studies of flood hazard, exposure, vulnerability, and risk; multitemporal analyses for the evaluation of fluvial dynamics; studies of the impact generated by and on the establishment of urban centers and structural measures along the channel, and, in general, those where it is necessary to consider historical, morphometric, hydrological, hydraulic, and geomorphological approaches, for the appropriate fluvial management.
The methodological framework could integrate, at a multiscale level, different remote sensing techniques and GIS exploration tools, whose outputs and results are in any case verified by expert criteria and supported by fieldwork. Therefore, in our study, the high-resolution DTM generated from LIDAR data generated a high level of detail and accuracy of the terrain configuration. It allowed the identification of changes in topography and the delineation of geomorphic units at scales of 1:5000 or even 1:1000 in prioritized areas, obtaining detailed fluvial landscape classification maps, supported by historical aerial photographs, current orthophotos, and evidence taken in the field. Moreover, the delimitation of sub-basins was more accurate than the drainage division obtained from the 25 m DTM used by the CHD [25].
Due to the advanced state of anthropogenic alteration of the river system, further studies should assess the impact of other variables such as agricultural land use at multitemporal sceneries. On the other hand, considering that the Carrión river is regulated by the Camporredondo and Compuerto reservoirs in its upper basin, by the Velilla del Guardo reservoir near the Grande River, and by the Fuentearriba and Cueza 1 and 2 reservoirs on the river of the same name, for further research, the analysis of flood tendency by parameters of area, shape, and drainage system must be performed considering the regulating effect of the hydraulic infrastructure. In this way, regarding the hillside destabilization generated by streams and identified in the basin, subsequent analyses must carry out mass removal process assessment, particularly in segments that present lateral confinement.
5. Conclusions
The methodological framework developed in this study made it possible to analyze the hydromorphometric and geomorphological variables of a basin at regional and detailed scales, integrating transversal anthropic factors in a highly modified river system.
Thus, the method made it possible to establish and prioritize zones in the basin where further multipurpose studies should be carried out and where fluvial management measures should be applied.
In this regard, the process involved, in a practical way, the use of remote sensing techniques and GIS exploration tools, whose outputs and results were supported by evidence taken in the field.
Although the study included the confluence of multiple hydrogeomorphometric and land configuration criteria, subsequent studies must evaluate specific interventions generated by agricultural activities at a multitemporal level.
For further research, it is important to include in the methodology the mass removal process assessment, especially in segments that present lateral confinement, due to the hillside destabilization generated by streams.
Supplementary Materials
Results of indexes and morphometric parameters calculated (available at https://www.mdpi.com/article/10.3390/rs13152955/s1).
Author Contributions
Conceptualization, L.L. and A.M.-G.; methodology L.L. and A.M.-G.; software, L.L.; validation, L.L. and A.M.-G.; formal analysis, L.L.; investigation, L.L. and A.M.-G.; resources, L.L. and A.M.-G.; data curation, L.L. and A.M.-G.; writing—original draft preparation, L.L.; writing—review and editing, L.L.; visualization, L.L.; supervision, L.L. and A.M.-G.; project administration, A.M.-G.; funding acquisition, A.M.-G. All authors have read and agreed to the published version of the manuscript.
Funding
This research was co funded by the Education Department of the Regional Government of Castile and León and the European Social Fund—European Commission.
Institutional Review Board Statement
Not applicable.
Informed Consent Statement
Not applicable.
Acknowledgments
This work has been developed within the framework of the project Elaboration of Geomorphological and Historical Cartography of Different Natural Channels in Castile and Leon Regional Government, with the support of the Duero Hydrographic Confederation and EPTISA (LP8C-LR8C),and the GEAPAGE research group (Environmental Geomorphology and Geological Heritage) of the University of Salamanca.
Conflicts of Interest
The authors declare no conflict of interest.
References
- Grill, G.; Lehner, B.; Thieme, M.; Geenen, B.; Tickner, D.; Antonelli, F.; Babu, S.; Borrelli, P.; Cheng, L.; Crochetiere, H.; et al. Mapping the world’s free-flowing rivers. Nature 2019, 569, 215–221. [Google Scholar] [CrossRef] [PubMed]
- Alfieri, L.; Burek, P.; Feyen, L.; Forzieri, G. Global warming increases the frequency of river floods in Europe. Hydrol. Earth Syst. Sci. 2015, 19, 2247–2260. [Google Scholar] [CrossRef] [Green Version]
- Piégay, H.; Cottet, M.; Lamouroux, N. Innovative approaches in river management and restoration. River Res. Appl. 2020, 6, 875–879. [Google Scholar] [CrossRef]
- Thorel, M.; Piégay, H.; Barthelemy, C.; Räpple, B.; Gruel, C.-R.; Marmonier, P.; Winiarski, T.; Bedell, J.-P.; Arnaud, F.; Roux, G.; et al. Socio-environmental implications of process-based restoration strategies in large rivers: Should we remove novel ecosystems along the Rhône (France). Reg. Environ. Chang. 2018, 18, 2019–2031. [Google Scholar] [CrossRef]
- European Parliament and of the Council of the European Union. Directive 2000/60/EC of the European Parliament and of the Council of 23 October 2000 Establishing a Framework for Community Action in the Field of Water Policy; Official Journal L 327; 2000; pp. 0001–0073. Available online: https://eur-lex.europa.eu/legal-content/EN/ALL/?uri=celex%3A32000L0060 (accessed on 20 November 2020).
- Sofia, G.; Nikolopoulos, E.I. Floods and rivers: A circular causality perspective. Sci. Rep. 2020, 10, 1–17. [Google Scholar] [CrossRef] [Green Version]
- Fryirs, K.; Hancock, F.; Healey, M.; Mould, S.; Dobbs, L.; Riches, M.; Raine, A.; Brierley, G. Things we can do now that we could not do before: Developing and using a cross-scalar, state-wide database to support geomorphologically-informed river management. PLoS ONE 2021, 16, e0244719. [Google Scholar] [CrossRef] [PubMed]
- Nikolova, V.; Zlateva, P.; Dimitrov, I. Geological—Geomorphological Features of River Catchments in Flood Susceptibility Assessment (on the Example of Middle Struma Valley, Bulgaria). IFIP Adv. Inf. Commun. Technol. 2019, 550, 76–96. [Google Scholar] [CrossRef]
- Criado, M.; Martínez-Graña, A.; San Román, J.; Santos-Francés, F. Flood Risk Evaluation in Urban Spaces: The Study Case of Tormes River (Salamanca, Spain). Int. J. Environ. Res. Public Health 2018, 16, 5. [Google Scholar] [CrossRef] [Green Version]
- Magliulo, P.; Valente, N. GIS-Based Geomorphological Map of the Calore River Floodplain Near Benevento (Southern Italy) Overflooded by the 15th October 2015 Event. Water 2020, 12, 148. [Google Scholar] [CrossRef] [Green Version]
- Rinaldi, M.; Surian, N.; Comiti, F.; Bussettini, M. A methodological framework for hydromorphological assessment, analysis and monitoring (IDRAIM) aimed at promoting integrated river management. Geomorphology 2015, 251, 122–136. [Google Scholar] [CrossRef]
- Xue, X.H.; Chang, S.; Yuan, L.Y.; Sun, Y. Measuring reach-scale geomorphic heterogeneity by using landscape indices: Implications for river management. Arab. J. Geosci. 2018, 11, 1–12. [Google Scholar] [CrossRef]
- Fryirs, K.A.; Brierley, G.J. Geomorphic Analysis of River Systems: An Approach to Reading the Landscape; John Wiley & Sons, Ltd.: Chichester, UK, 2012. [Google Scholar]
- Nardini, A.; Yépez, S.; Bejarano, M.D. A computer aided approach for river styles—inspired characterization of large basins: A structured procedure and support tools. Geosciences 2020, 10, 231. [Google Scholar] [CrossRef]
- Nardini, A.; Yepez, S.; Zuniga, L.; Gualtieri, C.; Bejarano, M.D. A computer aided approach for river styles-inspired characterization of large basins: The Magdalena river (Colombia). Water 2020, 12, 1147. [Google Scholar] [CrossRef] [Green Version]
- Nardini, A.; Brierley, G. Automatic river planform identification by a logical-heuristic algorithm. Geomorphology 2021, 375, 107558. [Google Scholar] [CrossRef]
- Roux, C.; Alber, A.; Bertrand, M.; Vaudor, L.; Piégay, H. ‘FluvialCorridor’: A new ArcGIS toolbox package for multiscale riverscape exploration. Geomorphology 2014, 242, 29–37. [Google Scholar] [CrossRef]
- Choudhari, P.P.; Nigam, G.K.; Singh, S.K.; Thakur, S. Morphometric based prioritization of watershed for groundwater potential of Mula river basin, Maharashtra, India. Geol. Ecol. Landsc. 2018, 2, 256–267. [Google Scholar] [CrossRef] [Green Version]
- Piégay, H.; Arnaud, F.; Belletti, B.; Bertrand, M.; Bizzi, S.; Carbonneau, P.; Dufour, S.; Liébault, F.; Ruiz-Villanueva, V.; Slater, L. Remotely sensed rivers in the Anthropocene: State of the art and prospects. Earth Surf. Process Landf. 2020, 45, 157–188. [Google Scholar] [CrossRef]
- Cassiani, G.; Bellizia, E.; Fontana, A.; Boaga, J.; Alpaos, A.D.; Ghinassi, M. Geophysical and Sedimentological Investigations Integrate Remote-Sensing Data to Depict Geometry of Fluvial Sedimentary Bodies: An Example from Holocene Point-Bar Deposits of the Venetian Plain (Italy). Remote Sens. 2020, 12, 2568. [Google Scholar] [CrossRef]
- Gilvear, D.J.; Hunter, P.; Stewardson, M. Remote sensing: Mapping natural and managed river corridors from the micro to the network scale. In River Science; John Wiley & Sons, Ltd.: Chichester, UK, 2016; pp. 171–196. [Google Scholar]
- Brierley, G.; Fryirs, K.; Marçal, M.; Lima, R. The use of the river styles framework as a tool to ‘work with nature’ in managing rivers in Brazil: Examples from the Macaé catchment. Rev. Bras. Geomorfol. 2019, 20, 751–771. [Google Scholar] [CrossRef] [Green Version]
- Demarchi, L.; van de Bund, W.; Pistocchi, A. Object-Based Ensemble Learning for Pan-European Riverscape Units Mapping Based on Copernicus VHR and EU-DEM Data Fusion. Remote Sens. 2020, 12, 1222. [Google Scholar] [CrossRef] [Green Version]
- García, J.H.; Ollero, A.; Ibisate, A.; Fuller, I.C.; Death, R.G.; Piégay, H. Promoting fluvial geomorphology to ‘live with rivers’ in the Anthropocene Era. Geomorphology 2021, 380, 107649. [Google Scholar] [CrossRef]
- CHD-Confederación Hidrográfica del Duero. Plan Hidrológico de la Parte Española de la Demarcación Hidrográfica del Duero. 2015–2021; CHD: Valladolid, Spain, 2015; Available online: https://www.chduero.es/documents/20126/89007/PHD15-000_00_Memoria-v03_08.pdf (accessed on 20 November 2020).
- Lombana, L.; Martínez-Graña, A. Hydrogeomorphological analysis for hydraulic public domain definition: Case study in Carrión River (Palencia, Spain). Environ. Earth Sci. 2021, 80, 193. [Google Scholar] [CrossRef]
- Strahler, A.N. Quantitative analysis of watershed geomorphology. Eos Trans. Am. Geophys. Union 1957, 38, 913–920. [Google Scholar] [CrossRef] [Green Version]
- Horton, R. Erosional development of streams and their drainage basins; hydrophysical approach to quantitative morphology. Bull. Geol. Soc. Am. 1945, 56, 275–370. [Google Scholar] [CrossRef] [Green Version]
- Strahler, A.N. Quantitative geomorphology of drainage basins and channel networks. In Handbook of Applied Hydrology; McGraw Hill: New York, NY, USA, 1964; pp. 439–476. [Google Scholar]
- Leopold, L.B.; Wolman, M.G.; Miller, J.P. Fluvial Processes in Geomorphology; Dover Publications, Inc.: New York, NY, USA, 1964; p. 522. [Google Scholar]
- Schumm, S. Evolution of drainage systems and slopes in badlands at Perth Amboy, New Jersey. Bull. Geol. Soc. Am. 1956, 56, 597–646. [Google Scholar] [CrossRef]
- Horton, R. Drainage-basin characteristics. Eos Trans. Am. Geophys. Union 1932, 13, 350–361. [Google Scholar] [CrossRef]
- Miller, V. A Quantitative Geomorphic Study of Drainage Basin Characteristics in the Clinch Mountain Area, Virginia and Tennessee; Department of Geology, Columbia University: New York, NY, USA, 1953. [Google Scholar]
- Gravelius. H. Flusskunde. Goschen Verlagshan dlung Berlin. In Morphometry of Drainage Basins; Elsevier Science and Technology: Oxford, UK, 1914. [Google Scholar]
- Faniran, A. The Index of Drainage Intensity—A Provisional New Drainage Factor. Aust. J. Sci. 1968, 31, 328–330. [Google Scholar]
- Strahler, A.N. Hypsometric (Area-Altitude) Analysis of Erosional Topography. Eos Trans. Am. Geophys. Union 1952, 63, 1117–1142. [Google Scholar] [CrossRef]
- Melton, M. An Analysis of the Relations among Elements of Climate, Surface Properties and Geomorphology; Department of Geology, Columbia University: New York, NY, USA, 1957. [Google Scholar]
- Patton, P.C.; Baker, V.R. Morphometry and floods in small drainage basins subject to diverse hydrogeomorphic controls. Water Resour. Res. 1976, 12, 941–952. [Google Scholar] [CrossRef] [Green Version]
- Singh, S.; Dubey, A. Geoenvironmental Planning of Watersheds in India; Chugh: Allahabad, Indian, 1994; p. 211. [Google Scholar]
- Larue, J.P. Longitudinal profiles and knickzones: The example of the rivers of the Cher basin in the northern French Massif Central. Proc. Geol. Assoc. 2011, 122, 125–142. [Google Scholar] [CrossRef]
- González, J.M.; Comino, J.R.; Murillo, J.F.; Sinoga, J.D. Analisys of longitudinal river profiles for the detection of geomorphological anomalies. Application to a sector of the northern coast of Alborán Sea (Spain). An. Geogr. Univ. Complut. 2018, 38, 161–194. [Google Scholar] [CrossRef] [Green Version]
- Matos, A.; Dilts, T. Hypsometric Integral Toolbox for ArcGIS. 2019. Available online: https://www.arcgis.com/home/item.html?id=23a2dd9d127f41c195628457187d4a54 (accessed on 20 November 2020).
- O’Brien, G.; Wheaton, J.M.; Fryirs, K.; Macfarlane, W.W.; Brierley, G.; Whitehead, K.; Gilbert, J.; Volk, C. Mapping valley bottom confinement at the network scale. Earth Surf. Process. Landf. 2019, 44, 1828–1845. [Google Scholar] [CrossRef] [Green Version]
- Hubert, P. The segmentation procedure as a tool for discrete modeling of hydrometeorological regimes. Stoch. Environ. Res. Risk Assess. 2000, 14, 297–304. [Google Scholar] [CrossRef]
- Rai, P.K.; Chandel, R.S.; Mishra, V.N.; Singh, P. Hydrological inferences through morphometric analysis of lower Kosi river basin of India for water resource management based on remote sensing data. Appl. Water Sci. 2018, 8, 15. [Google Scholar] [CrossRef] [Green Version]
- Rai, P.K.; Chaubey, P.K.; Mohan, K.; Singh, P. Geoinformatics for assessing the inferences of quantitative drainage morphometry of the Narmada Basin in India. Appl. Geomat. 2017, 9, 167–189. [Google Scholar] [CrossRef]
- Mishra, K.; Sinha, R. Flood risk assessment in the Kosi megafan using multi-criteria decision analysis: A hydro-geomorphic approach. Geomorphology 2020, 350, 106861. [Google Scholar] [CrossRef]
- Ahmed, F.; Rao, S. Hypsometric analysis of the Tuirini drainage basin: A Geographic Information System approach. Int. J. Geomat. Geosci. 2016, 6, 1685–1695. [Google Scholar]
Figure 1.
Study area. (a) General localization of the analyzed river basin. (b) Carrion watershed and sub-basins delimited.
Figure 1.
Study area. (a) General localization of the analyzed river basin. (b) Carrion watershed and sub-basins delimited.

Figure 2.
Methodology developed in the study.

Figure 3.
Model developed in ArcHydro.

Figure 4.
Hydrogeomorphic delimitation over different raster and photos. (a) Historical aerial photo. (b) Slope raster. (c) Filtered shaded relief. (d) Orthophoto PNOA 2017.
Figure 4.
Hydrogeomorphic delimitation over different raster and photos. (a) Historical aerial photo. (b) Slope raster. (c) Filtered shaded relief. (d) Orthophoto PNOA 2017.

Figure 5.
Methodology to define morphometry and reaches.

Figure 6.
(a) Stream length (Lu) vs. stream order. Data show exponential tendencies. (b) Hypsometric curves by sub-basin.
Figure 6.
(a) Stream length (Lu) vs. stream order. Data show exponential tendencies. (b) Hypsometric curves by sub-basin.

Figure 7.
Raster obtained in drainage and relief characterization. (a) DTM; (b) DTM reclassified in 20 classes; (c) Slopes; (d) Relative relief; (e) Dissection index; (f) Drainage density.
Figure 7.
Raster obtained in drainage and relief characterization. (a) DTM; (b) DTM reclassified in 20 classes; (c) Slopes; (d) Relative relief; (e) Dissection index; (f) Drainage density.

Figure 8.
Normalized Longitudinal Profiles.

Figure 9.
Segments and characterization of fluvial system. (a). Sinuosity indexes calculated; (b) Confinement segments defined; (c) Reaches; (d) Half-amplitude and correlation with sinuosity index; (e) Confinement values’ variation; (f) Characterization of reaches.
Figure 9.
Segments and characterization of fluvial system. (a). Sinuosity indexes calculated; (b) Confinement segments defined; (c) Reaches; (d) Half-amplitude and correlation with sinuosity index; (e) Confinement values’ variation; (f) Characterization of reaches.

Figure 10.
Some prioritized reaches and hydrogeomorphological evidence taken in the field. (a) Reach 7; (b) Reach 17; (c) Central bar located in the point 1 of reach 7; (d) Point bar seen in point 4 of reach 17; (e) Secondary channel in point 3 of reach 7; (f) Floating deposits located in reach 17 point 6; (g) Longitudinal obstruction built in point 2 of reach 7; (h) A-231 road and lateral obstruction located in reach 17 point 5.


Table 1.
Morphometric parameters.
| Morphometric Parameters | Formula | Reference | |
|---|---|---|---|
| Drainage Network | Stream order (N) | River order assigned by Strahler with a threshold of 0.5 km2 | [27] |
| Stream number (Nu) | N1, N2, N3 … Nn | [28] | |
| Stream length (Lu) by order (km) | L1, L2,L3 … Ln | [29] | |
| Mean stream length (Lum) (km) | Lum = Lu/Nu | ||
| Stream length ratio (Lur) | Lur = Lu/(Lu-1) | ||
| Mean stream length (Lumr) (km) | Lumr = Mean (Lur) | ||
| Bifurcation ratio (Rb) | Rb = Nu/Nu+1 | ||
| Mean bifurcation ratio (Rbm) | Rbm = Mean (Rb) | ||
| Mid-channel length of the widest channel (Lcmax) (m) | Lcmax1, Lcmax2 … Lcmaxn | [30] | |
| Length of the reach (Lr) (m) | Lr1, Lr2 … Lrn | ||
| Sinuosity of longest flow path (S) | S = Lcmax/Lr | ||
| Slope longest flow path (m/m) | Previously defined in the model. | ||
| Rho coefficient (p) | p = Lur/Rb | [28] | |
| Basin Geometry | Basin perimeter (P) (km) | Parameters previously obtained from the DTM | [31] |
| Basin length (Lb) (km) | |||
| Basin area (A) (km2) | |||
| Form factor ratio (Kf) (km) | Kf = A/Lb2 | [32] | |
| Elongation ratio (Re) | Re = (1.129A0.5)/L | [31] | |
| Shape factor ratio (Sf) | Sf = Lb2/A | [28] | |
| Circularity ratio (Rc) | Rc = 12.57 × (A/P2) | [33] | |
| Circularity ration (Rcn) | Rcn = A/P | [29] | |
| Relative perimeter (Pr) | Pr = A/P | [31] | |
| Gravelius index or compactness coefficient | Kc = 0.28 P/(√A) | [34] | |
| Drainage Texture Analysis | Drainage density (Dd) (km/km2) | Dd = Lu/A The line density was defined using the Line Density tool | [32] |
| Stream frequency (Fs) | Fs = Nu/A | ||
| Drainage intensity (Di) | Di = Fs/Dd | [35] | |
| Length of overland flow (Lo) | Lo = 1/2Dd | [28] | |
| Relief Characterization | Maximum basin height (Z) (m) | Parameters previously obtained from the DTM | - |
| Minimum basin height (z) (m) | |||
| Total basin relief (H) (m) | H = Z-z | [36] | |
| Relief ratio (Rhl) | Rhl = H/Lb | [31] | |
| Relative relief ratio (Rhp) | Rhp = H × 100/P | [37] | |
| Ruggedness number (Rn) | Rn = Dd × (H/1000) | [38] | |
| Melton ruggedness number (MRn) | MRn = H/A^0.5 | [37] | |
| Relative relief (Rr) | 1 km2—net was used. Zonal statistics were defined as well as IDW interpolation. | [31] | |
| Dissection index (Dis) | Dis = Rr/Absolute Relief | [39] | |
Publisher’s Note: MDPI stays neutral with regard to jurisdictional claims in published maps and institutional affiliations. |
© 2021 by the authors. Licensee MDPI, Basel, Switzerland. This article is an open access article distributed under the terms and conditions of the Creative Commons Attribution (CC BY) license (https://creativecommons.org/licenses/by/4.0/).
Share and Cite
MDPI and ACS Style
Lombana, L.; Martínez-Graña, A. Multiscale Hydrogeomorphometric Analysis for Fluvial Risk Management. Application in the Carrión River, Spain. Remote Sens. 2021, 13, 2955. https://doi.org/10.3390/rs13152955
AMA Style
Lombana L, Martínez-Graña A. Multiscale Hydrogeomorphometric Analysis for Fluvial Risk Management. Application in the Carrión River, Spain. Remote Sensing. 2021; 13(15):2955. https://doi.org/10.3390/rs13152955
Chicago/Turabian StyleLombana, Lorena, and Antonio Martínez-Graña. 2021. "Multiscale Hydrogeomorphometric Analysis for Fluvial Risk Management. Application in the Carrión River, Spain" Remote Sensing 13, no. 15: 2955. https://doi.org/10.3390/rs13152955
Note that from the first issue of 2016, this journal uses article numbers instead of page numbers. See further details here.