1. Introduction
A huge diversity of modern people’s needs and aims is reflected in the field of map-making. Cartographers create a huge range of maps targeted to masses of people, but there is also a need to design maps narrowly focused on specific user groups. People with severe visual impairment representing an important group of users use tactile maps providing at least a simple scheme of how the world around is structured. Tactile maps also play an important role in the educational process at schools [
1]. The most important of the education of people with visual impairment is the proper perception of the spatial characteristics enabling them to learn independent movement [
2]. Nevertheless, it is not commercially attractive to design special maps for this target user group.
Tactile maps differ from other maps in several aspects. First, these maps need to be greatly simplified so that the map complexity is at a low level and map symbols are easily interpretable by touch [
3]. This requires a high level of generalization applied to source data to avoid a complexity present in many current maps [
4]. Furthermore, tactile maps intended for independent movement are usually of a large scale. This brings the need for mapping very detailed guidance elements (such as obstacles on sidewalks, pedestrian crossings etc.), which are usually not present in most geodata sources. Unlike with a 2D map, when creating a tactile map, it is necessary to think about height levels and sufficient differences between them so that they are decodable by user’s fingers. Therefore, some tactile maps are designed directly in the form of a 3D model while others are drawn in 2D, with a relief surface manufactured later during the production process [
5].
Due to difficulties related to the creation of tactile maps, both the design process and the manufacturing process for each map are time-intensive for cartographers. Especially in the case of 3D printing, several printing parameters need to be set, and the actual fabrication may take several more hours. Those factors result in high costs of tactile maps, both financial and time-wise. Even more expenses come with multimedia tactile maps. Kohn [
6] describes how electronics, multimedia content, and implementation of both hardware and software into the tactile map body can easily double the costs.
TouchIt3D technology linking 3D-printed multi-material tactile maps with a mobile device was developed in order to make tactile maps attractive, affordable and useful. This solution, described in detail in
Section 3, together with a semi-automated workflow were applied to provide affordable maps which can help people with visual impairment explore the world around them. With the use of modern technologies and the benefit of significantly lower costs, new interactive tactile maps were designed and examined in user testing.
Related Works. As described by Jesensky [
7], real-world objects are represented by tactile map symbols in tactile maps. Those relief forms of point, line and area symbols may include parameters such as vertical dimension, roughness, and 3D texture [
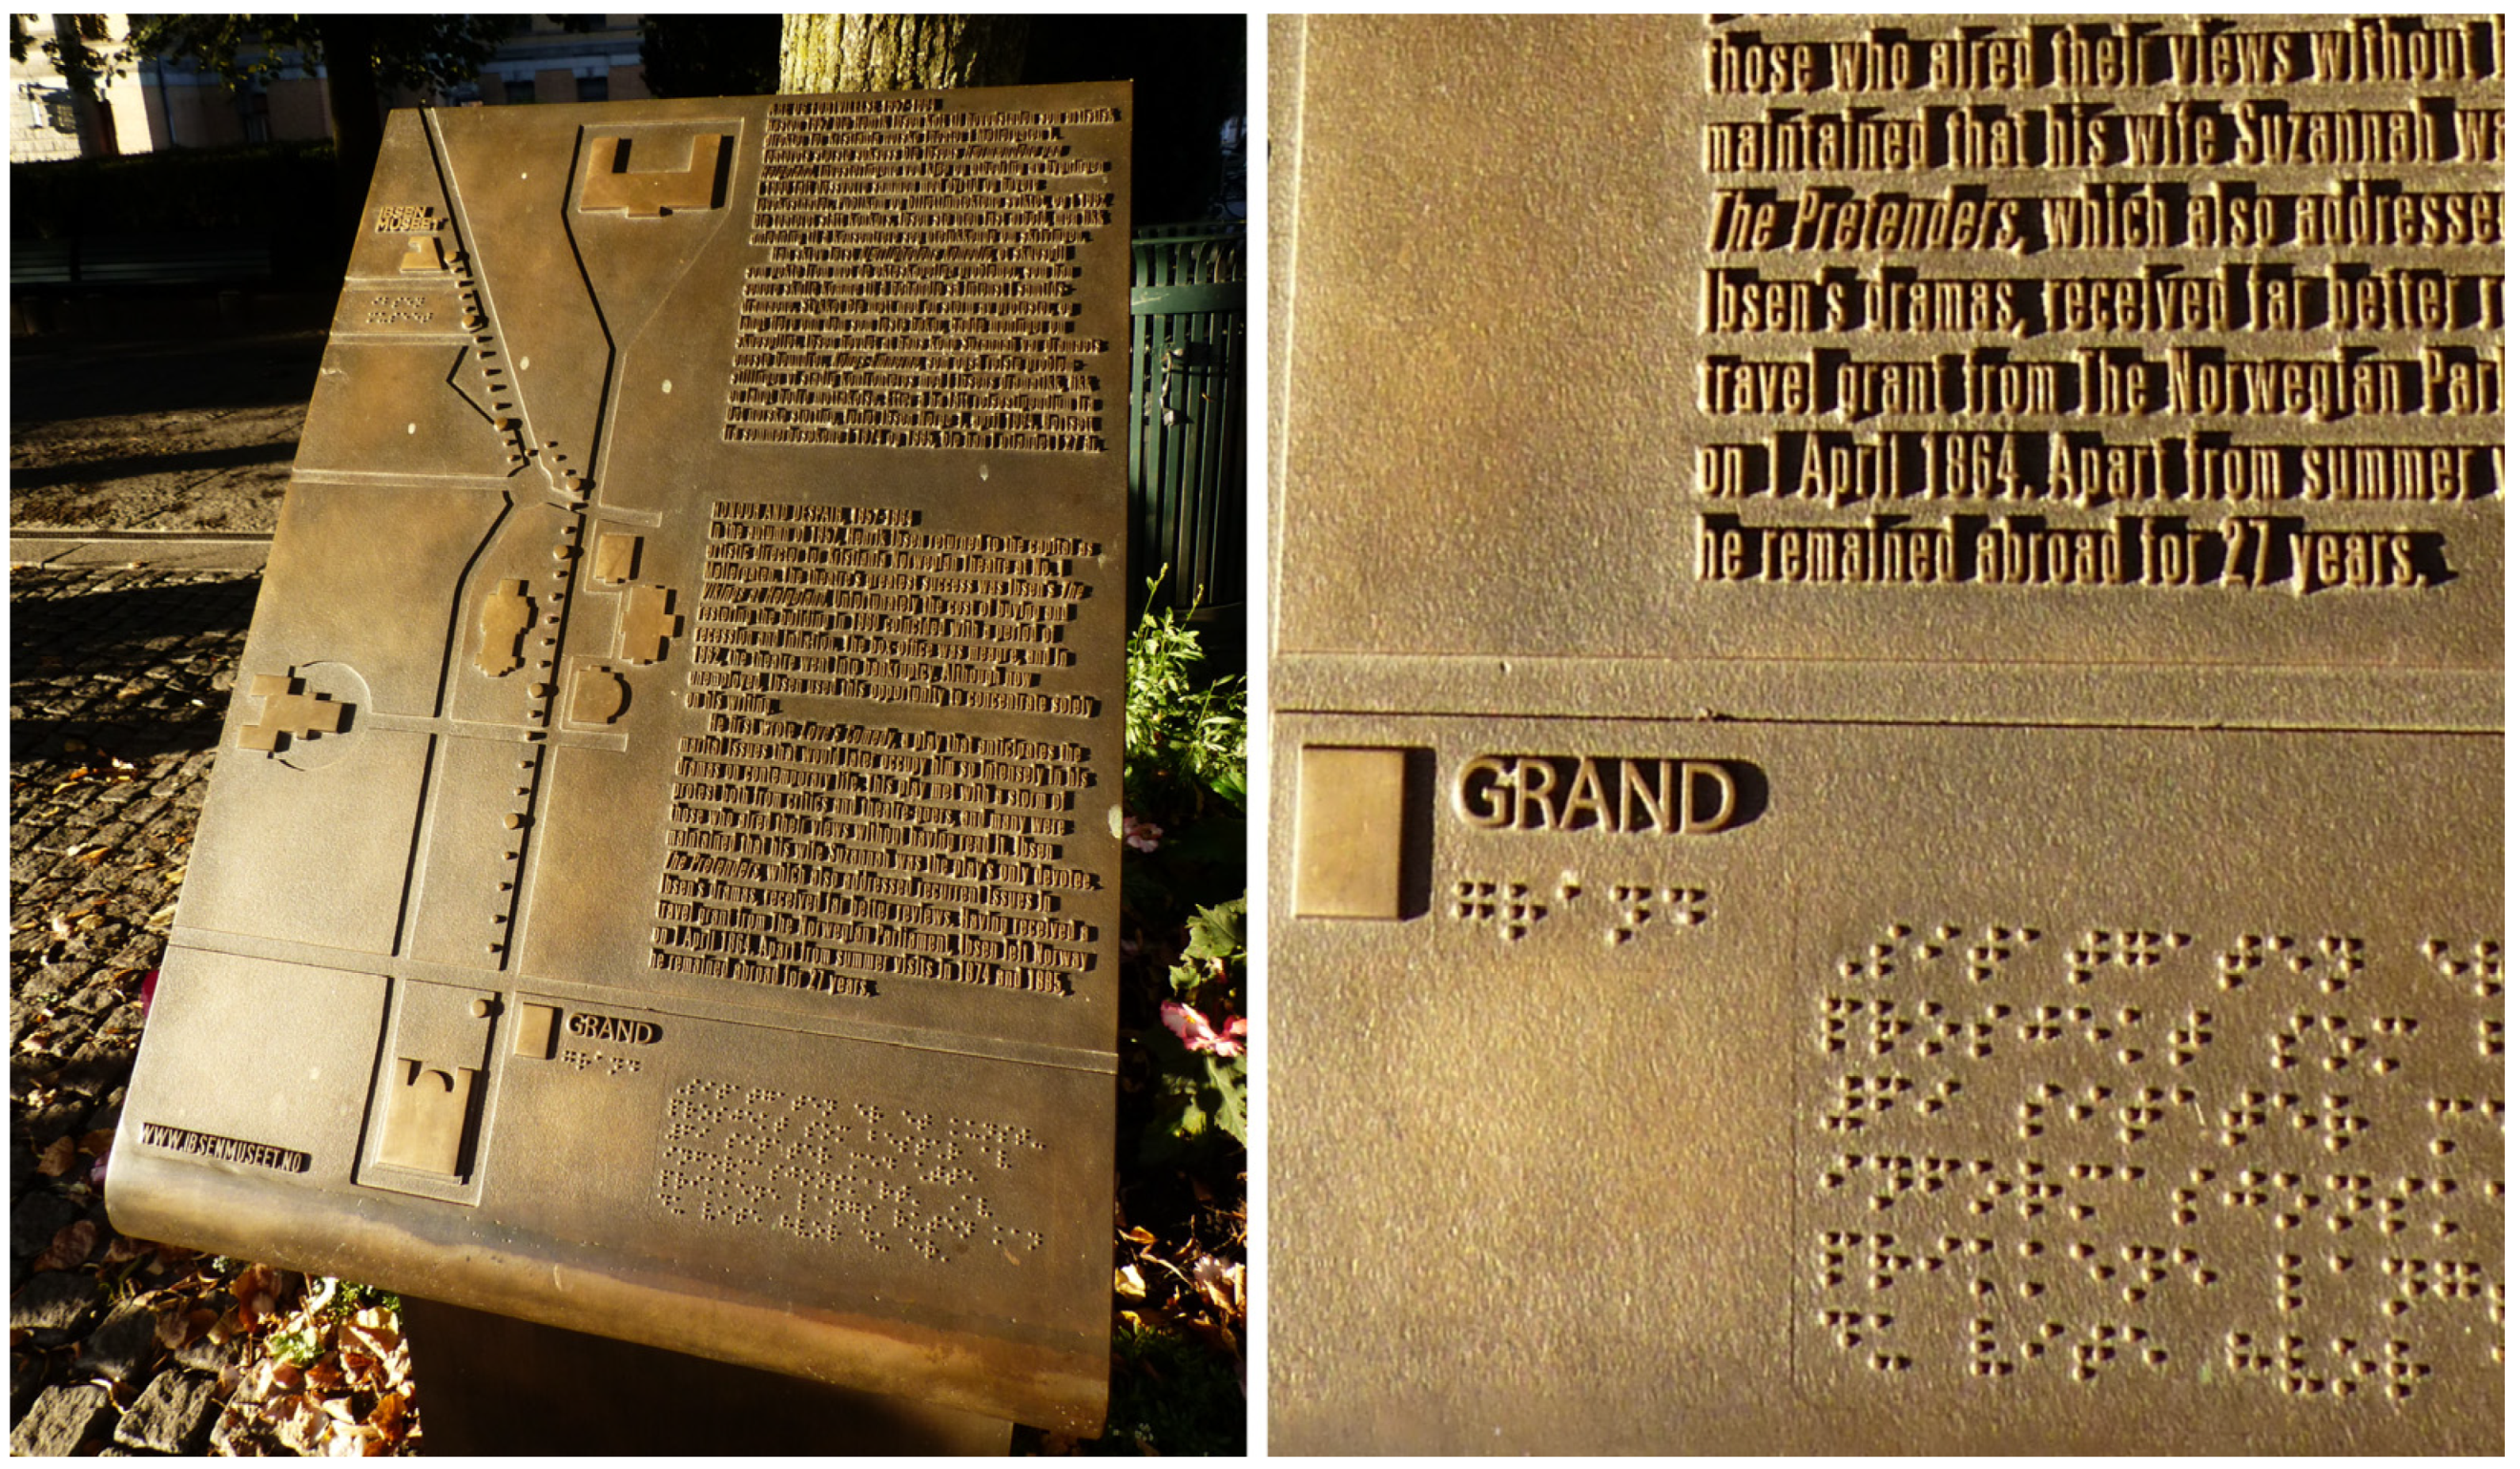
3]. Simple tactile maps commonly occur in public locations and buildings in developed countries. Additionally, places with dense pedestrian traffic and concentration of people with visual impairment are often more likely to be equipped with audio systems and tactile maps. These schemes of a limited area may illustrate crossroads, landmarks, or the floorplan of a building. They are either created for people with a visual impairment only or combining both visual and tactile elements (
Figure 1).
Captions and descriptions are typically expressed in Braille [
8]. This well-known system, unfortunately, has several limitations related to tactile maps. Newman et al. [
9] describe the common size of each letter of 4 × 6 mm, but the standard size varies between countries as well as for different uses [
10]. In all cases, Braille symbols need to be larger than non-relief fonts, and so the captions are abbreviated very often. Awareness of the existence of Braille is relatively good, but Braille literacy, even among those with severe visual impairment, is not unequivocal [
11]. Still, a large number of visually impaired people do not use Braille and rely on modern technologies, e.g., Text To Speech (TTS) in mobile devices, providing simpler ways of obtaining information.
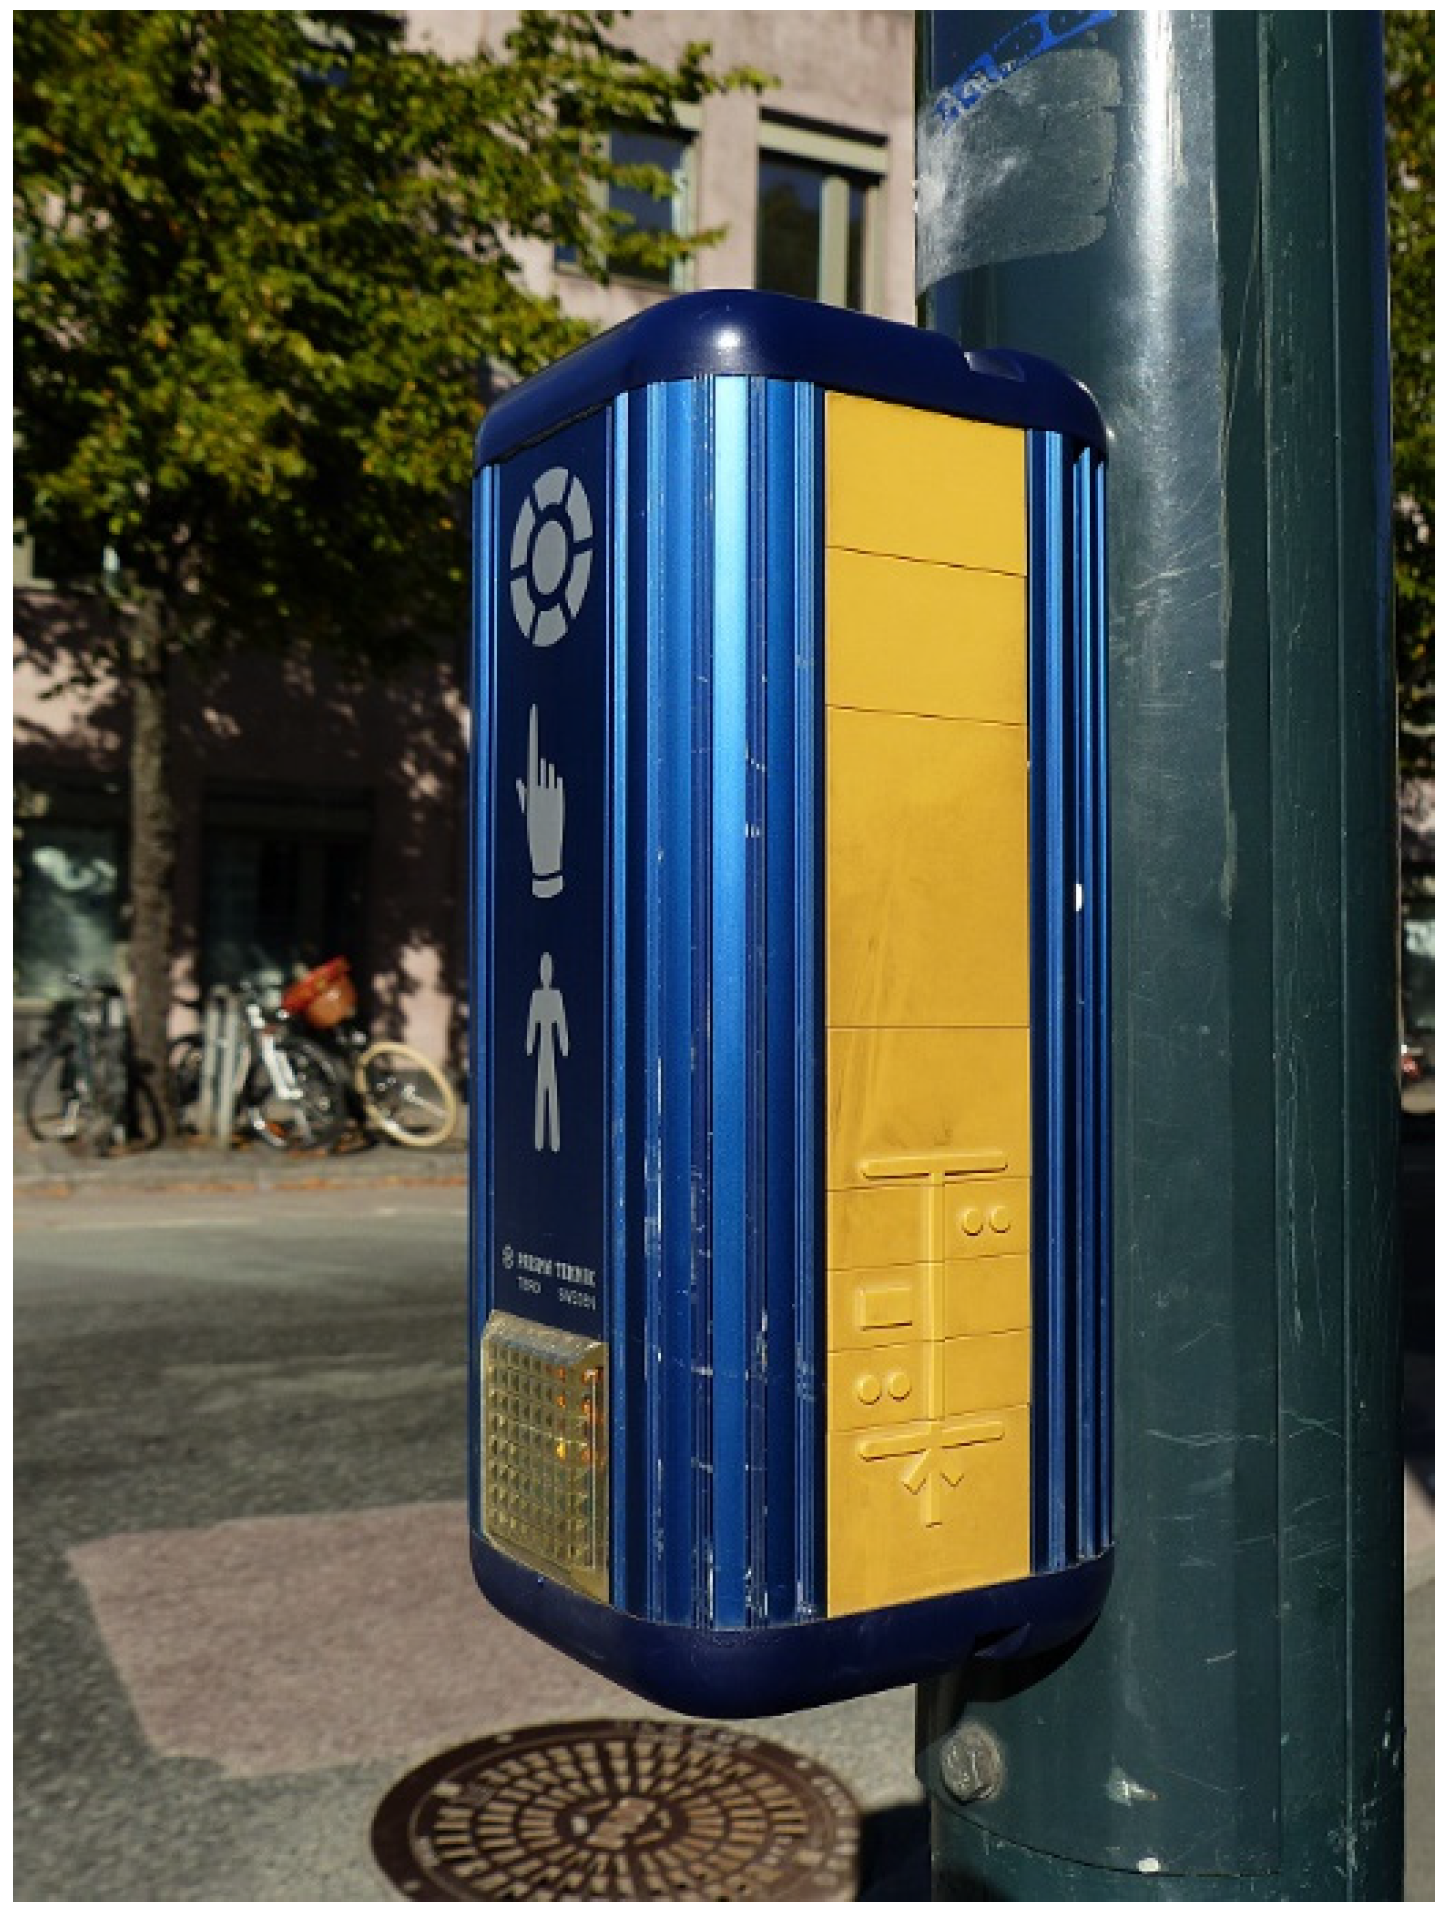
Consequently, methods other than Braille are often used for the transmission of information. The most common example is acoustic signaling at pedestrian crossings and special audio beacons activated remotely when a person with visual impairment enters the area. In some cases, the devices at the pedestrian crossings are supplemented by a simple tactile map.
Figure 2 illustrates one of the pedestrian push-button systems developed by the Swedish company Prisma Teknik present in various models across a number of European cities [
12].
There are two basic methods of tactile map creation—either manual or machine-made. One of the oldest and simplest ways of communicating spatial information to people with serious visual impairment is the technique of palm-drawing. This technique is often used by teachers and relatives of the visually impaired, giving at least a temporary stimulus with information indicating spatial distribution. Similarly, hand-made tactile map aids made of various materials are common [
13]. Quick-drying dense color gels are another possibility that is widely available in stores.
Advanced methods can be performed using machine techniques, e.g., Braille printers, which are usable for simple tactile maps. Cardboard embossing is also used especially to produce tactile postcards and greeting cards. The height of the raised layer can reach up to several centimeters. The more durable alternative, using the same principle, is forming plastic or metal plates. The production of a mold realized using a laser former is the most expensive part of the entire production process. Thermal printing is a commonly used technology due to its effectiveness and accessibility for creating a relief surface. The dark-colored parts of a microcapsule paper in a fuser swell up and acquire volume to create a positive relief while the rest remains at the original height [
14]. During the last decade, 3D printing has become another promising technology for creating terrain visualizations and advanced tactile maps, e.g., [
15,
16].
Arditi et al. [
17] describe the advantages of interactive tactile maps in orientation while moving through interior spaces. This study was an early attempt to design interactive tactile maps linked with a mobile device using thermal printing. In the case study, authors halved the number of failures in finding the correct route with the help of multimedia tactile maps, compared to interviewing passers-by instead.
In recent years, numerous studies have focused on the automatization of tactile map creation. Wabinski et al. [
15] reviewed the possibilities of automated preparation of tactile maps and concluded that the most difficult part was the generalization of source data. Automated processing of image maps into the form of 3D relief using the Scalable Vector Graphics (SVG) format was addressed by Wang et al. [
18]. Public geodatabases such as OpenStreetMap (OSM) are often used to automate map creation, even in the case of tactile maps [
19]. Götzelmann [
20] also presents an application of 3D printing and a partially automated approach for creating tactile maps from an OSM database. The author describes a workflow using simple 3D printers to enhance the autonomy of individuals with visual impairment. Possible customizations of tactile maps are later followed by Taylor et al. [
21].
The use of a 3D-printed case with an interface made of conductive parts aimed to operate a mobile device is presented by Zhang et al. [
22]. Even though the presented system does not aim to represent tangible map symbols that are not developing spatial awareness, it enables mobile accessibility across multiple existing mobile applications. A similar innovative attempt was performed by Bornschein et al. [
23], developing a tool to access 3D graphic software by people with severe visual impairment. The creation of tactile maps using 3D printing was also researched by Rener [
24]. The study focused the use of automatically generated tactile maps for mobility using location-based services. Taylor et al. [
25] performed another promising research with automatically generated tactile maps. The study presents a platform where the maps can be manufactured even by the people with visual impairment themselves. Some of the maps also use the conductive parts to be linkable with a capacitive touchscreen. Unfortunately, all the presented maps are limited to use only positive relief structures (extruded up from the base plane). Additionally, the idea of multi-material tactile maps being created by blind people themselves seems to be possible just partially, which is also supported by previous experiences.
Gual-Orti et al. [
26] focused their attention more on the evaluation of tactile-map symbols. Following the User-Centred Design approach, potential users with various visual impairments performed the experiment to express differences in map symbol shapes of 3D-printed tactile maps. A study on automation of data processing for non-interactive tactile maps made by thermal fusers was introduced by Stampach et al. [
27]. This study also stressed the importance of map symbol dimensions to fulfill the target users’ needs. The technology applied for map creation, however, unlike 3D printing, uses only 2D input data with no need of 3D modelling. Similar efforts with this technology were presented by Touya et al. [
28]. Among academic sources, there are also several websites providing a tool to prepare simple tactile maps of any region of the World either for 3D printing (
touch-mapper.org) or for printing on a microcapsule paper (
hapticke.mapy.cz/?lang=en). Unfortunately, both the online sources have a very limited functionality and possibilities to change visualization properties. Due to these limitations, it was not possible to apply them in our study.
The process of 3D printing is also being used to create real 3D models of terrain and other continuous surfaces. With accessible web applications, e.g., TouchTerrain (
touchterrain.geol.iastate.edu), The Terrainator (
terrainator.com), Terrain2STL (
jthatch.com/Terrain2STL), downloading terrain model becomes easy even for amateurs. When 3D printed, these models may help people in geospatial orientation and understanding the landscape structure [
29], not only to people with severe visual impairment.
2. Materials and Methods
2.1. TouchIt3D Technology
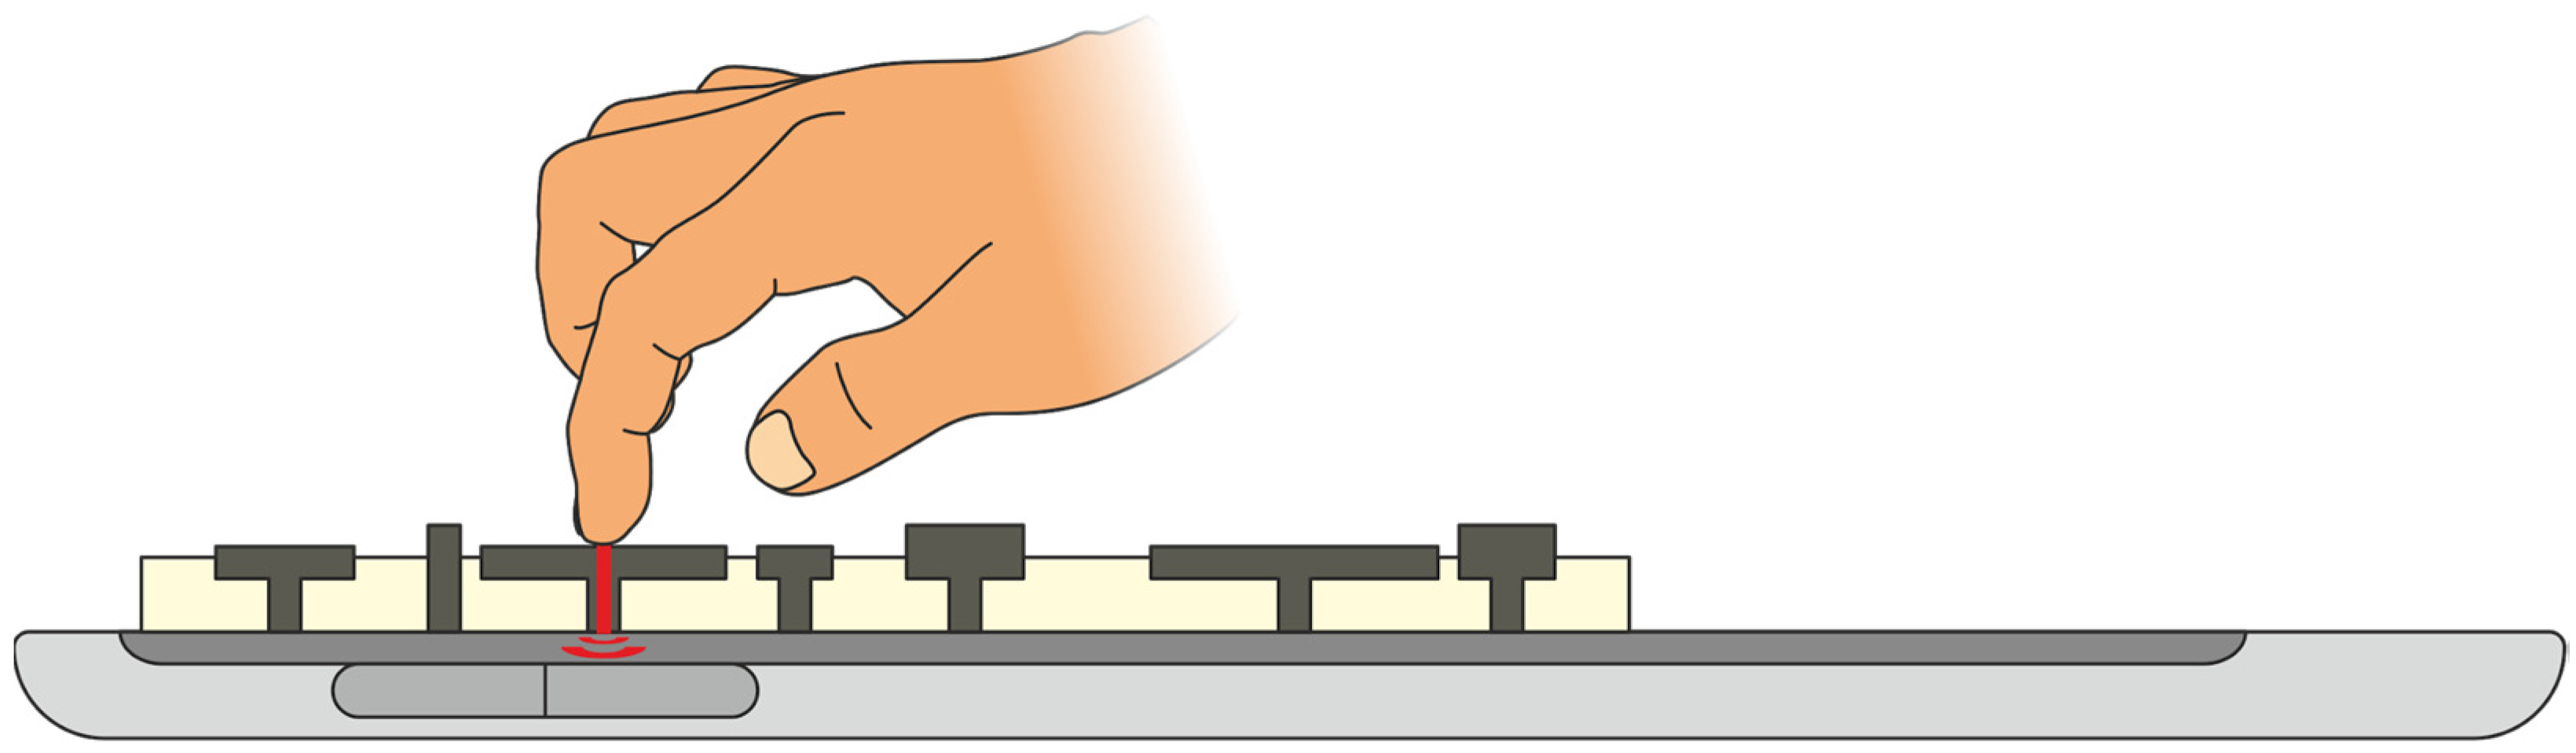
The TouchIt3D technology was developed in 2014 at Palacky University Olomouc, Department of Geoinformatics, to increase the efficiency and extend the functionality of tactile maps. Its principle consists of using a 3D printer with multiple extruders to manufacture plastic maps combining conductive (interactive map symbols) and nonconductive (non-interactive topographic base) materials. The TouchIt3D tactile maps, when laid flat on a capacitive touch display of a smart device (e.g., tablet), are connected via the display, and so the electric touch signal can go from the fingers of map users through the interactive map symbols made of conductive filament and interact with the display. A tablet using a preinstalled Android application provides an audio description that can differ according to the location of the signal interaction across the display. This combination allows to avoid the need of Braille in maps and to lower the complexity of each map while preserving the information amount that each map symbol represents.
Within the TouchIt3D technology, a tablet or another mobile device with a capacitive touch screen serves as a universal carrier of electronic equipment, enabling audio-visual and tactile information to be transferred to the user as a reaction to a finger contact (
Figure 3). It can be used for an unlimited number of different tactile maps or other landscape models. This approach advances the older-style interactive tactile maps, each of which contained its own electronic installation. The mobile device is also equipped with an elementary set of sensors (GPS, compass, accelerometer, etc.) and the possibility of connecting to the Internet via WiFi or mobile data. The exploitation of these sources is expected to be examined in further research. However, in this paper, no position sensors nor internet connectivity were used for tactile maps aiming especially for offline use. Nevertheless, a mobile application is a necessary component of TouchIt3D technology. It was developed for the Android operating system defining a set of buttons positioned according to the positions of each tactile map’s conductive elements. Predefined texts for individual buttons have been converted via a Text To Speech (TTS) function into a voice describing properties of POIs.
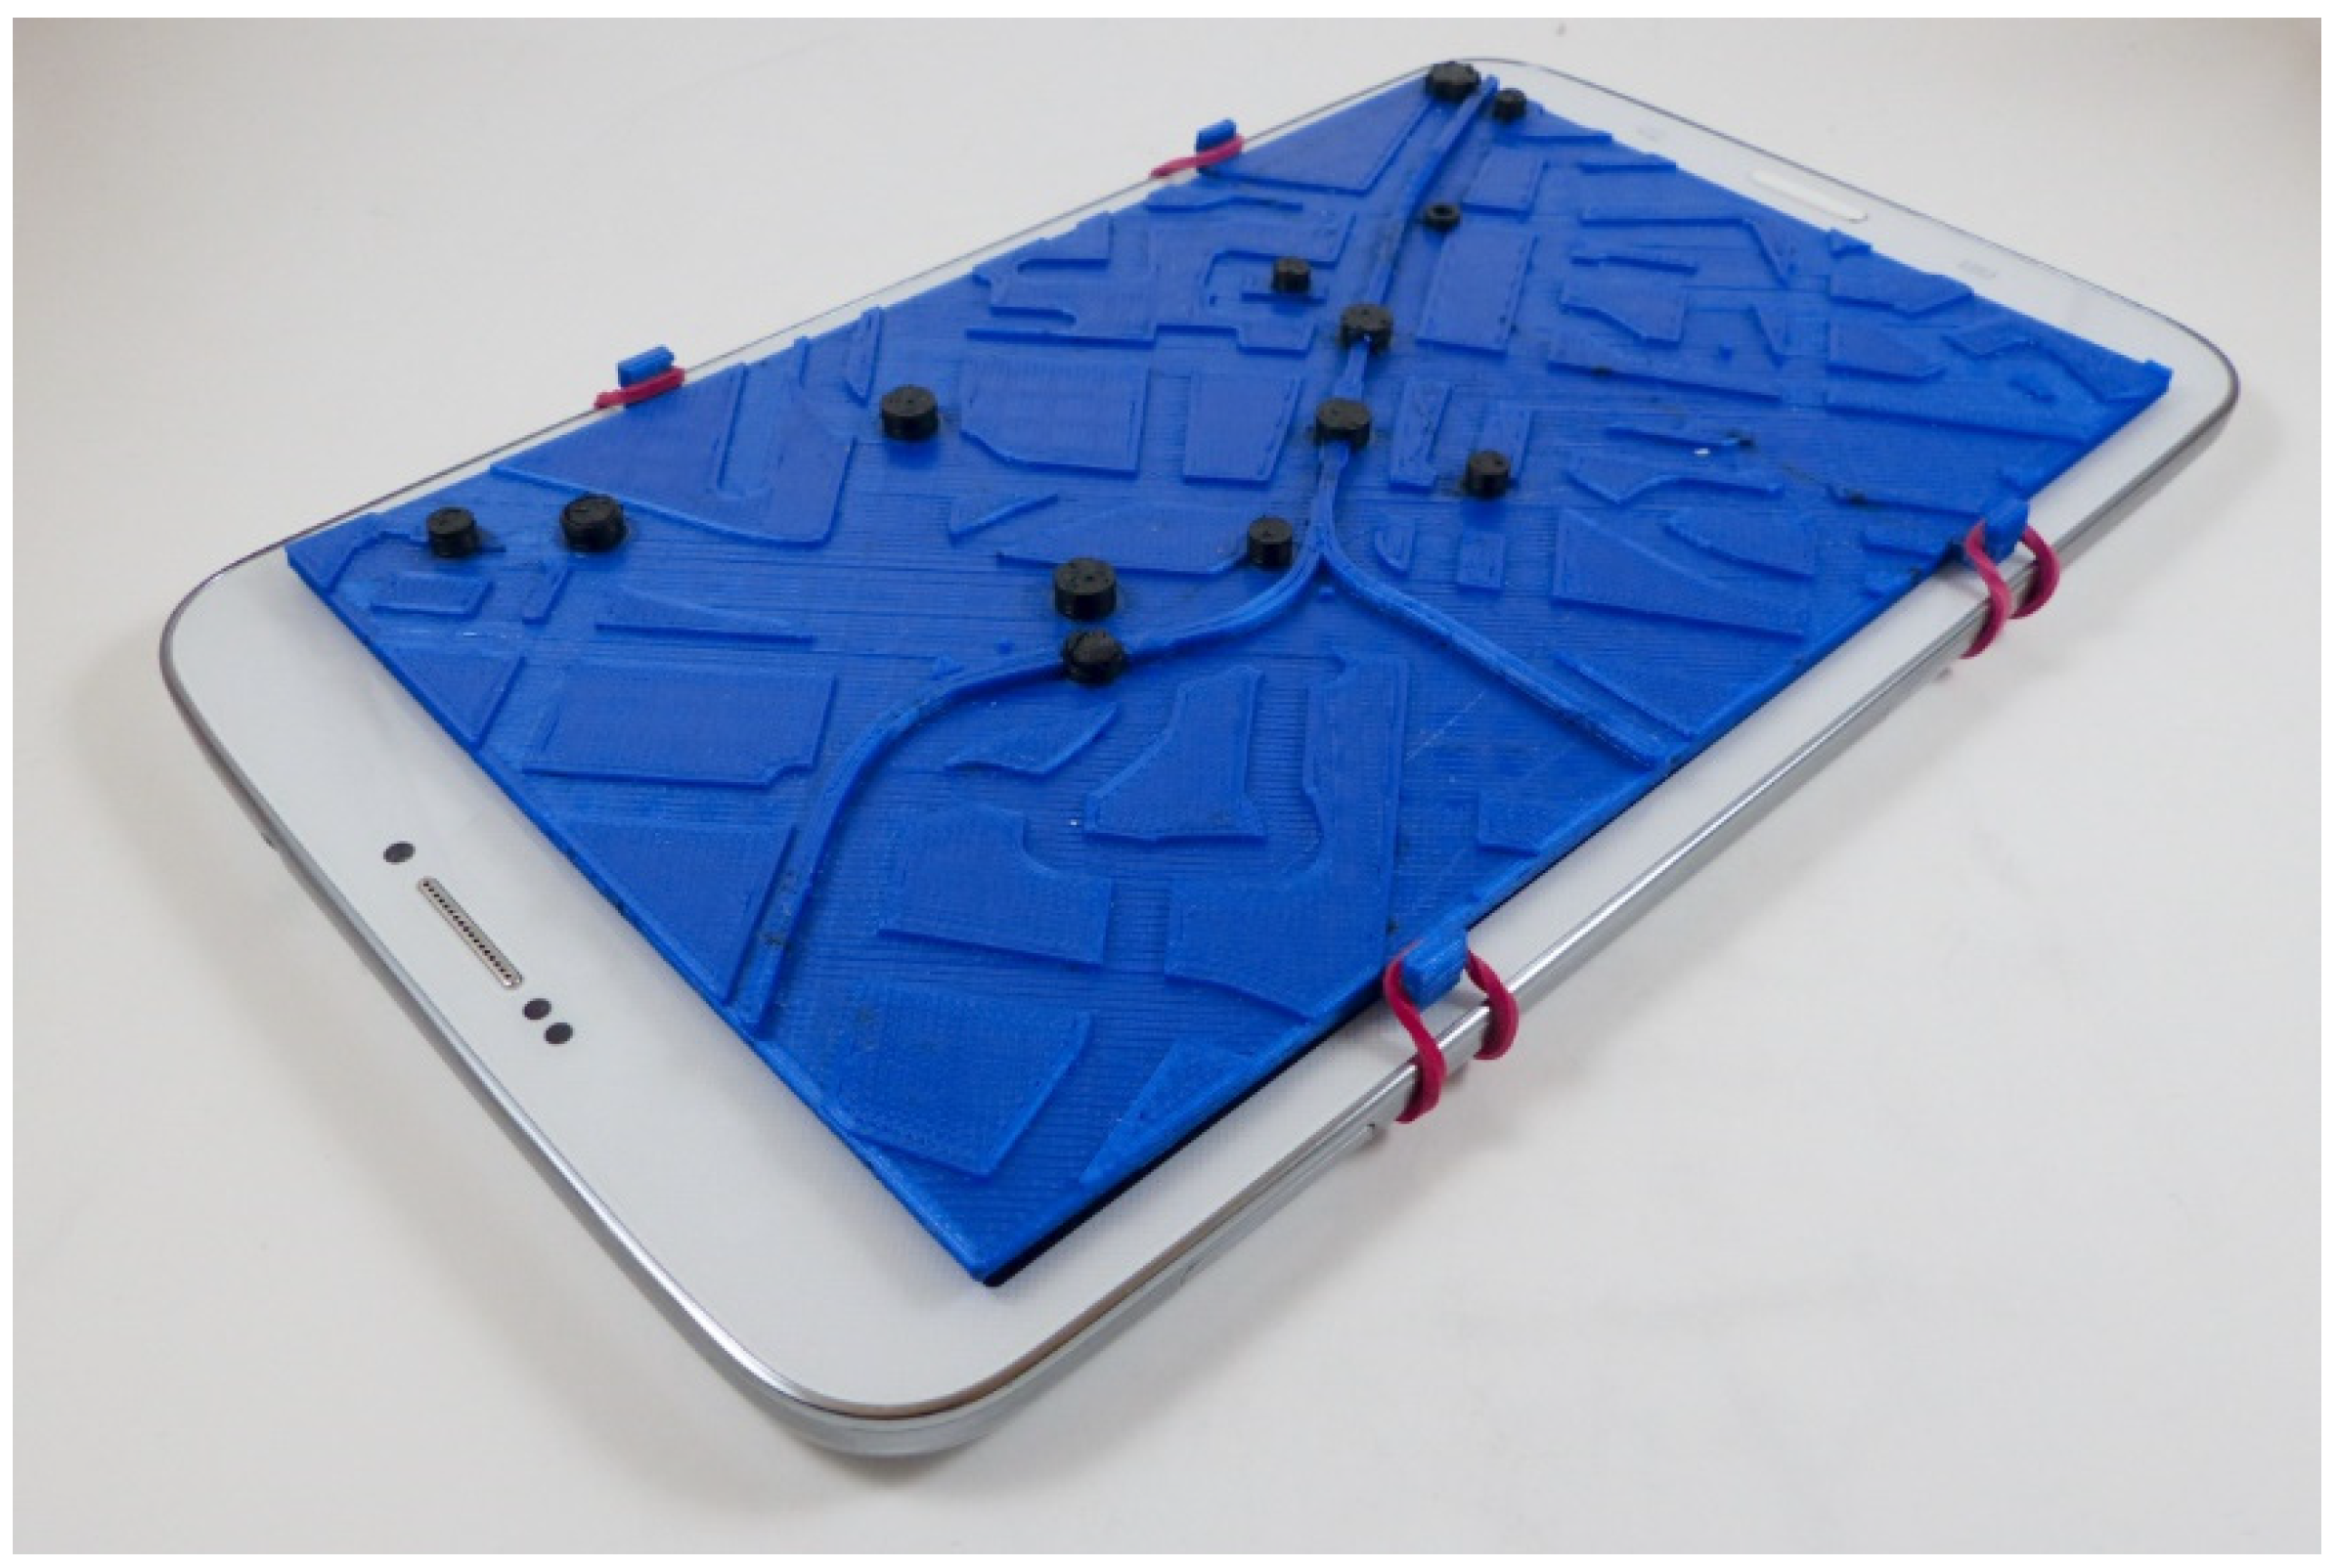
Tactile maps were linked with the tablet using rubber bands encircling the tablet from its bottom side and attached to hooks on both sides of the tactile map (
Figure 4). After launching the application, the user may choose the appropriate scheme (button distribution), add a new one from a JSON file, and delete schemes already loaded. After choosing a scheme and mounting the map, when an interactive map symbol is touched, the signal passes through the conductive element to the touch screen of the device, and an audio description is played (
Figure 3).
A low-cost 3D printer, the Poseidon Duo (priced around €500), was used for tactile map manufacture. This printer utilizes Fused Filament Fabrication (FFF) technology with two extruders. Using both nozzles allows the individual parts of the tactile map to be made of two different materials. Map symbols representing points of interest (POI) intended to be interactive were printed of the electrically conductive Proto-Pasta PLA material. Ordinary PLA (polylactic acid) filament was used for the fabrication of the topographic base and the rest of the tactile map body. It was necessary to create a separate virtual 3D model for each of the two tactile map parts, as described in detail in
Section 2.3. Conductive map symbols were stretched across the entire height of a tactile map from its lowest to the highest edge. The calibration of the proper height of the nozzles above the printing bed required the utmost attention during the preparation phase of the 3D printing process, as this step influences the quality and functionality of TouchIt3D maps.
2.2. User Preferences Survey
In order to determine appropriate map content, the ideas of testers with visual impairment were taken into account alongside our team’s previous experience with tactile map design. All consultations with people with visual impairment realized during the research were interview-based and focused on intensive and deep analyses of the issue rather than collecting flat data from a large set of anonymous people. Therefore, initial user input was collected to decide objects usable for people with visual impairment. Seven blind people aged 23 to 58 years joined the preliminary evaluation one after another. Additionally, one employee of an institution for the education of the visually impaired was interviewed, describing his knowledge of simple tactile map design and user issues. Meetings with all the users took place in familiar and calm locations in the city of Olomouc, Czechia.
Three sample tactile maps capturing a limited area of the Prague city center scaled 1:3000 to 1:5000 (one of them shown in
Figure 4) were used to demonstrate the map functionality and concept. Those maps were prepared manually using OSM data in the geographic information system (GIS) and 3D modeling software Blender. Maps contained streets at the lowest height level and blocks of buildings in the next one. The third layer represented tram lines and the highest interactive layer grouped all POIs (public transport stops and buildings important for the public, e.g., restaurants, shopping malls and banks). Additionally, a special star-shaped interactive symbol was added in the top left corner with a description of the map. The description contained what area the map covers, what the scale is, what each layer represents (the map legend) and the date of the map’s creation.
During the interview, each respondent was first questioned regarding their previous experiences with tactile maps. Subsequently, the sample maps and their functionality were described and shown. Respondents then had time to explore all three maps differing in the scale (1:3000; 1:4000; 1:5000) and were guided to experience all the different map symbols when needed. Respondents were asked to choose which scale levels were readable for them. In the next stage, each of them was asked to decide which real-world objects from several categories would be important for them to be mapped on this kind of tactile maps. Respondents were also asked which of those POIs would be helpful to be mapped using interactive map symbols with auditory descriptions, and, on the other hand, which POIs would be not. Finally, an unstructured discussion about their feelings regarding the maps, potential uses, suggested improvements, and locations worth mapping was held.
Six respondents of seven stated they had already used some kind of tactile map, but only one person claimed to use them regularly. All the respondents were used to handle with mobile devices like mobile phones and tablets. They were familiar with using various mobile applications and screen-readers using the TTS function, e.g., TalkBack (Android) and VoiceOver (Apple).
All participants positively evaluated the interactivity of map symbols. Minor difficulties with orientation occurred during the initial use of the maps. Respondents usually used both hands to explore the extent of the map. This behavior often launched multiple voice descriptions of the interactive map symbols and was confusing for the respondents as they had no idea which objects were being described at the time. Therefore, it was proposed to modify the audio description to launch only after a longer period holding a map symbol (e.g., 1 s). Scales 1:3000 and 1:4000 were generally considered appropriate and easily recognizable. As expected, the largest scale, 1:3000, was evaluated as the most easily readable one, but in the case of 1:4000, the larger scope was also appreciated. Except for two respondents, the map scale 1:5000 was evaluated to be difficult to read, as many mistakes related to skipping over (not noticing) some mapped streets occurred. A majority of the respondents also suggested more significant height differentiation of the interactive map symbols compared to the non-interactive background to be sure which objects launch the audio description. All respondents agreed that the best solution for height ordering the layers was according to how they were lined up in the real world.
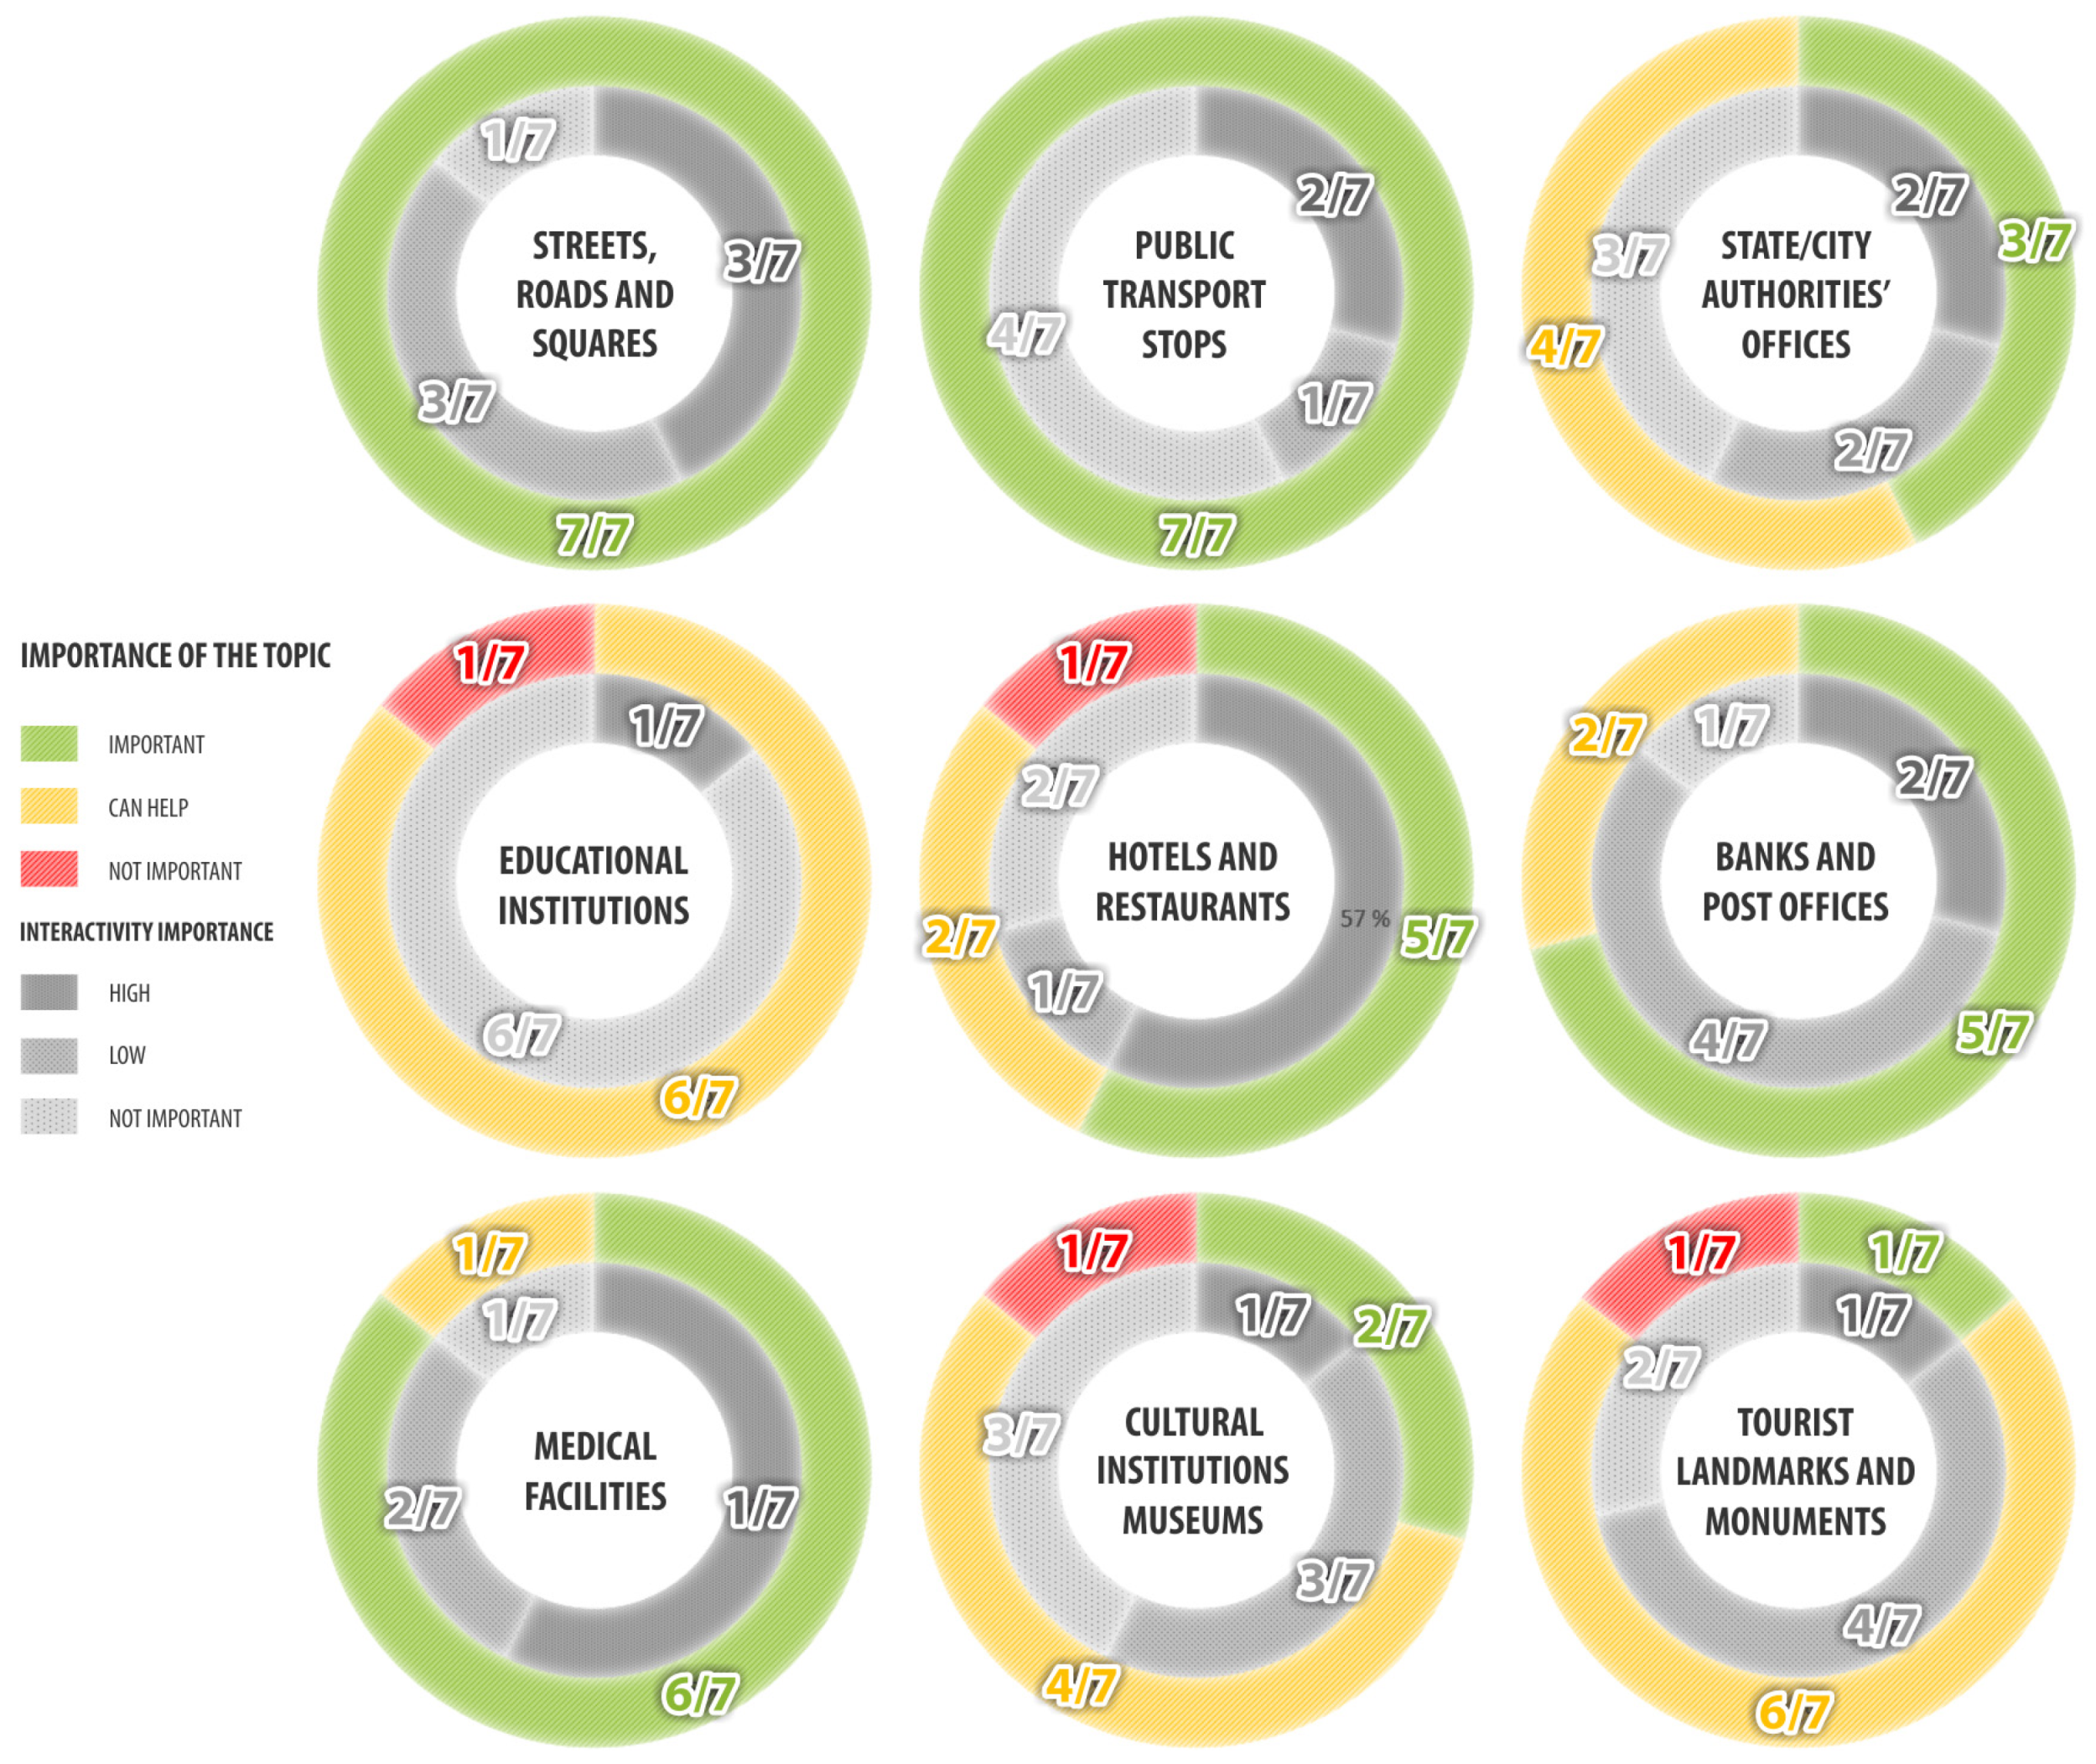
While there was generally a consensus among the participants on the recommendations mentioned above, answers related to the importance of POIs differed among respondents. Some preferred rather simple maps containing only the elementary landmarks necessary for orientation and movement (e.g., streets, inaccessible areas, and POIs). Conversely, more experienced tactile map readers were interested in more landscape features, e.g., water areas and railways. As described in
Figure 5, all visually impaired participants of the preliminary survey marked it as important to show the road network and public transport stops in tactile maps. The majority of them also highlighted the importance of marking medical facilities, banks, and post offices in tactile maps, while the rest of the respondents stated that those POIs can help but were not fundamental. Hotels, restaurants, and offices of state/regional/city authorities were found slightly less important for respondents. Cultural institutions, tourist landmarks, and monuments were mostly evaluated to be helpful but not necessary. None of the respondents marked educational institutions as important POIs to be visualized in the maps.
The highest demand for interactivity was noted in the case of medical facilities, restaurants, and hotels (mostly evaluated as highly important). Additionally, the interactive voice description of the street network, banks and post offices was found to be highly important compared to other categories. Map interactivity of tourist landmarks and monuments was mostly evaluated to have low importance, and the “not important at all to have the auditive description” was the most frequent response for the rest of POIs (
Figure 5).
2.3. Map Design Workflow
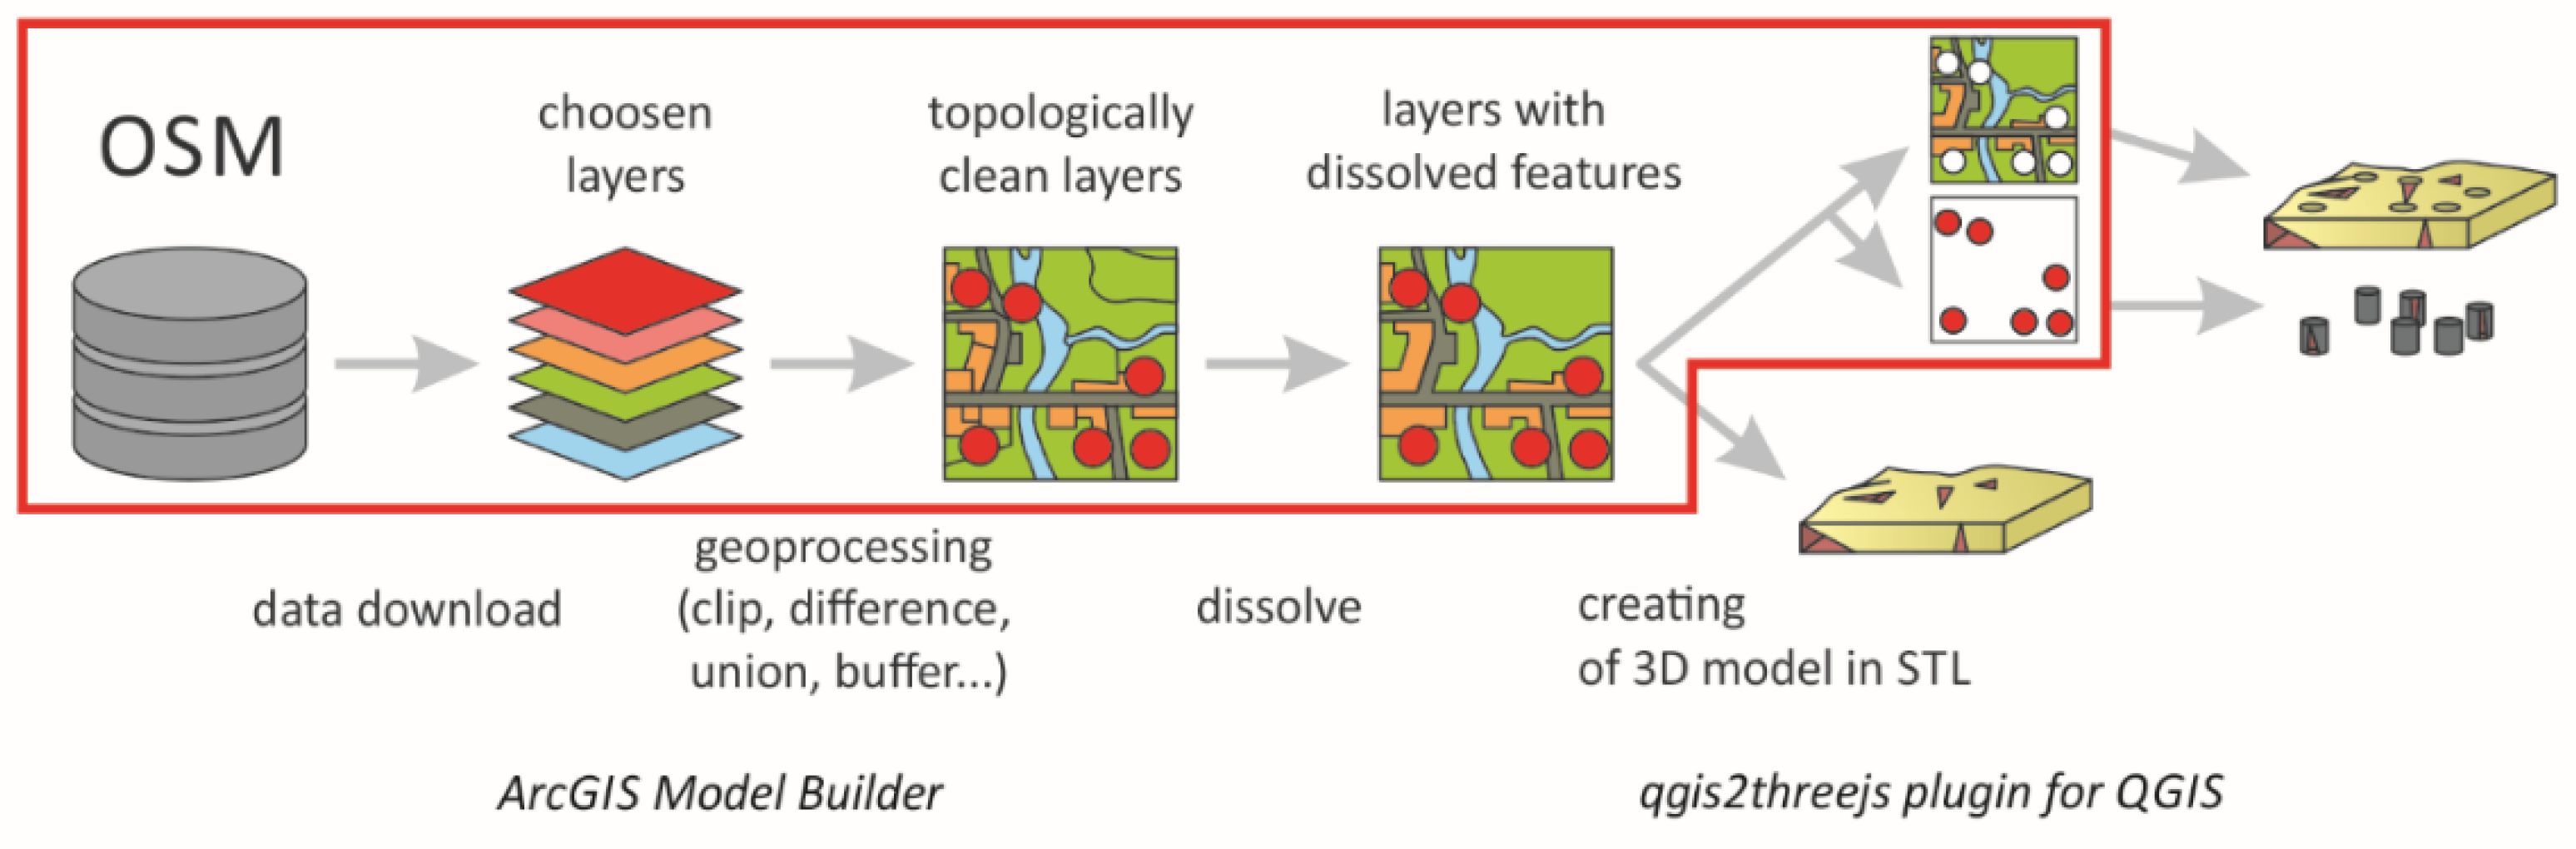
Based on findings from the user survey described in
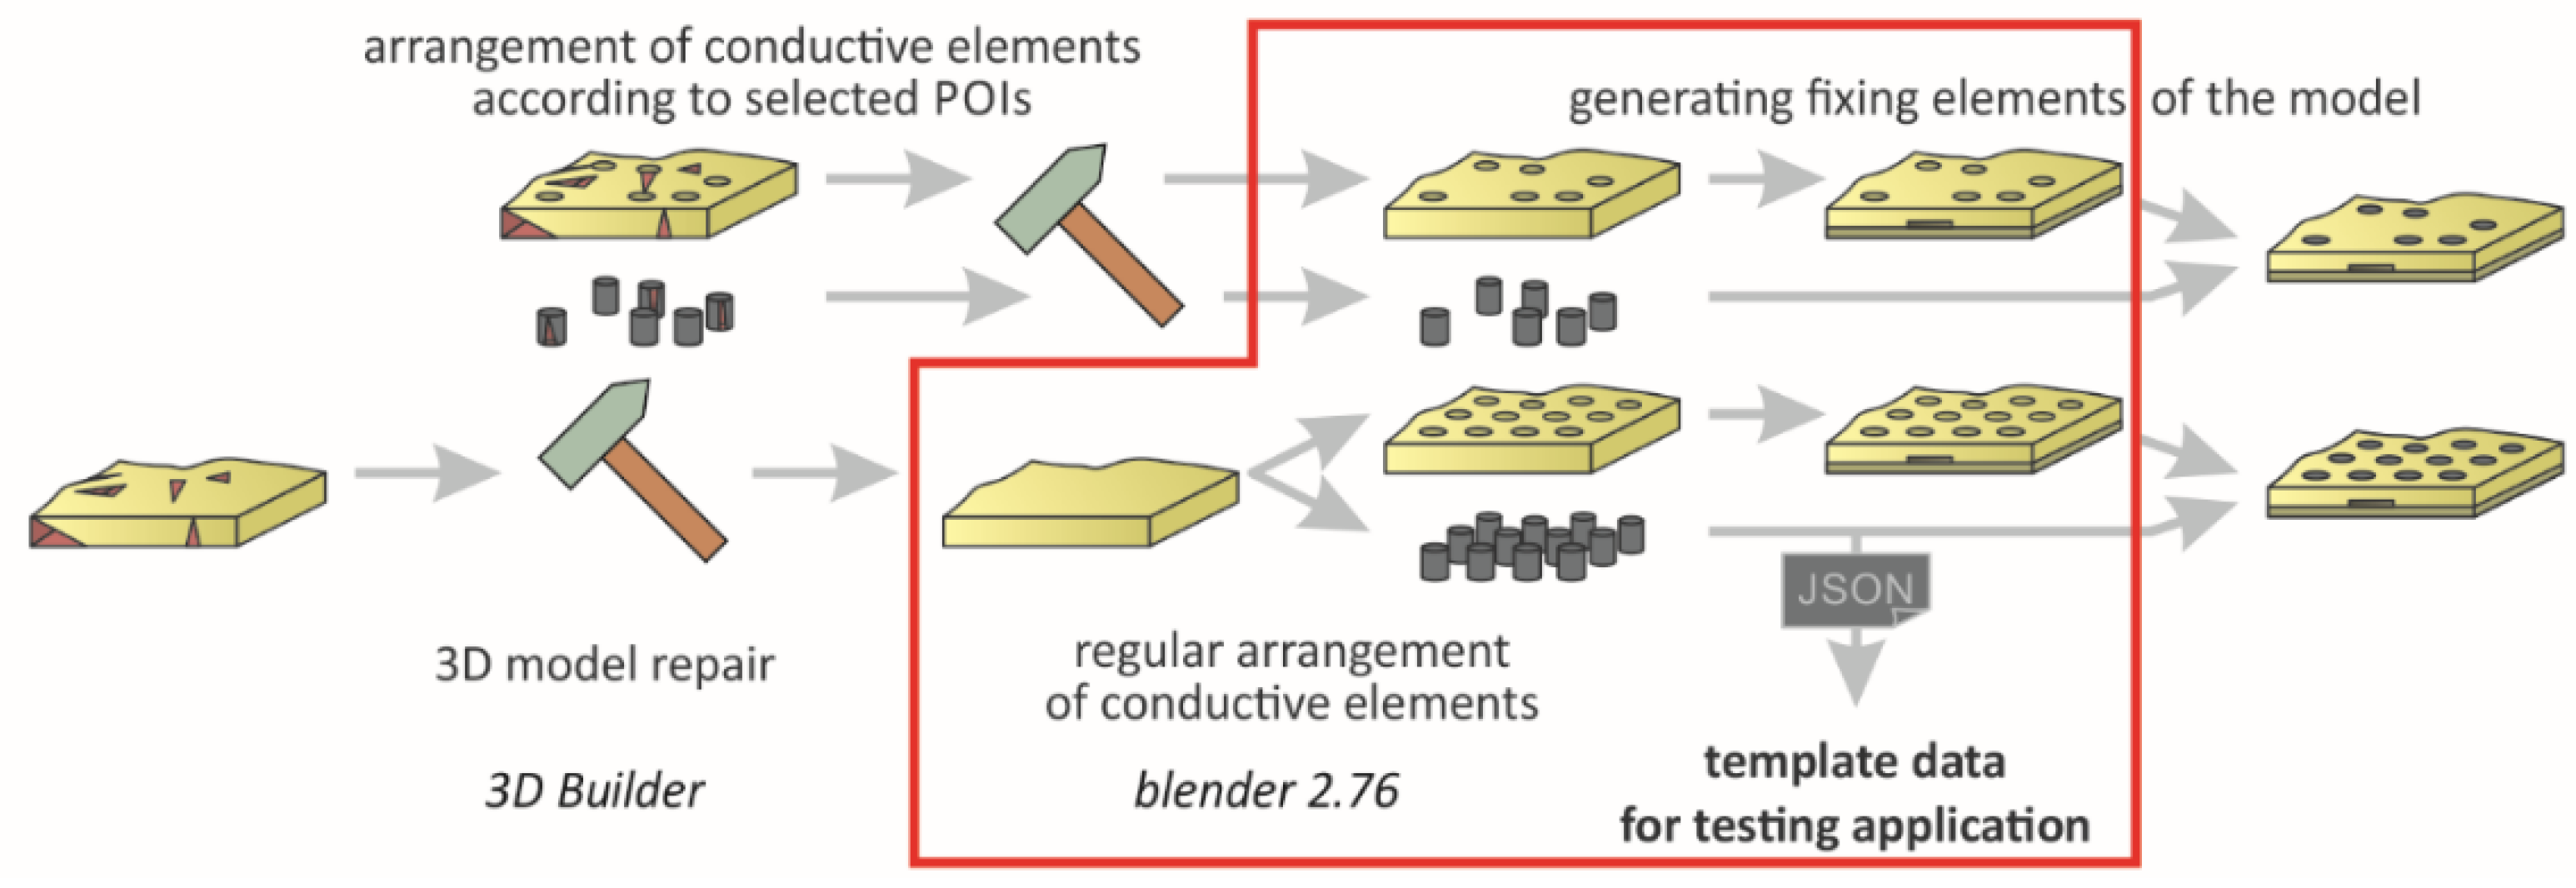
Section 2.2, a workflow for semi-automated creation of interactive tactile maps advancing the TouchIt3D technology was designed. The workflow includes obtaining geodata, the processing of that data, 3D modeling, the settings of printing parameters, the printing itself, and the preparation of a template for the mobile application. As there are conceptually different steps included, it is hardly imaginable to automate the entire workflow. In addition, some processes must be done specifically for each map and for each different 3D printer. Despite these challenges, several steps representing a consistent sequence of steps have been automated to make the design process more effective. Whole the process was divided into three blocks according to the primary environment of processing—the GIS block (
Figure 6), the 3D modeling block, and the 3D printing block (Figure 10). Automated parts are marked in red in the subsequent schemes.
The source data for further processing originated in the OSM database covering the whole world, although the quality could differ across regions. Data were imported using the ArcGIS Editor for OSM plugin in ArcGIS for Desktop software [
30] and transformed into a UTM Zone 33N projection as the sample areas of interest were located in Czechia (the city of Ostrava and the town of Konice). In the following steps, all point and line features were converted into polygons which could be later extruded into 3D. Therefore, the layers were processed using geoprocessing tools into a topologically clean representation covering the entire area of interest. All of the layers were also cropped for the area of interest defined by a separate polygon layer.
As the preliminary survey (see
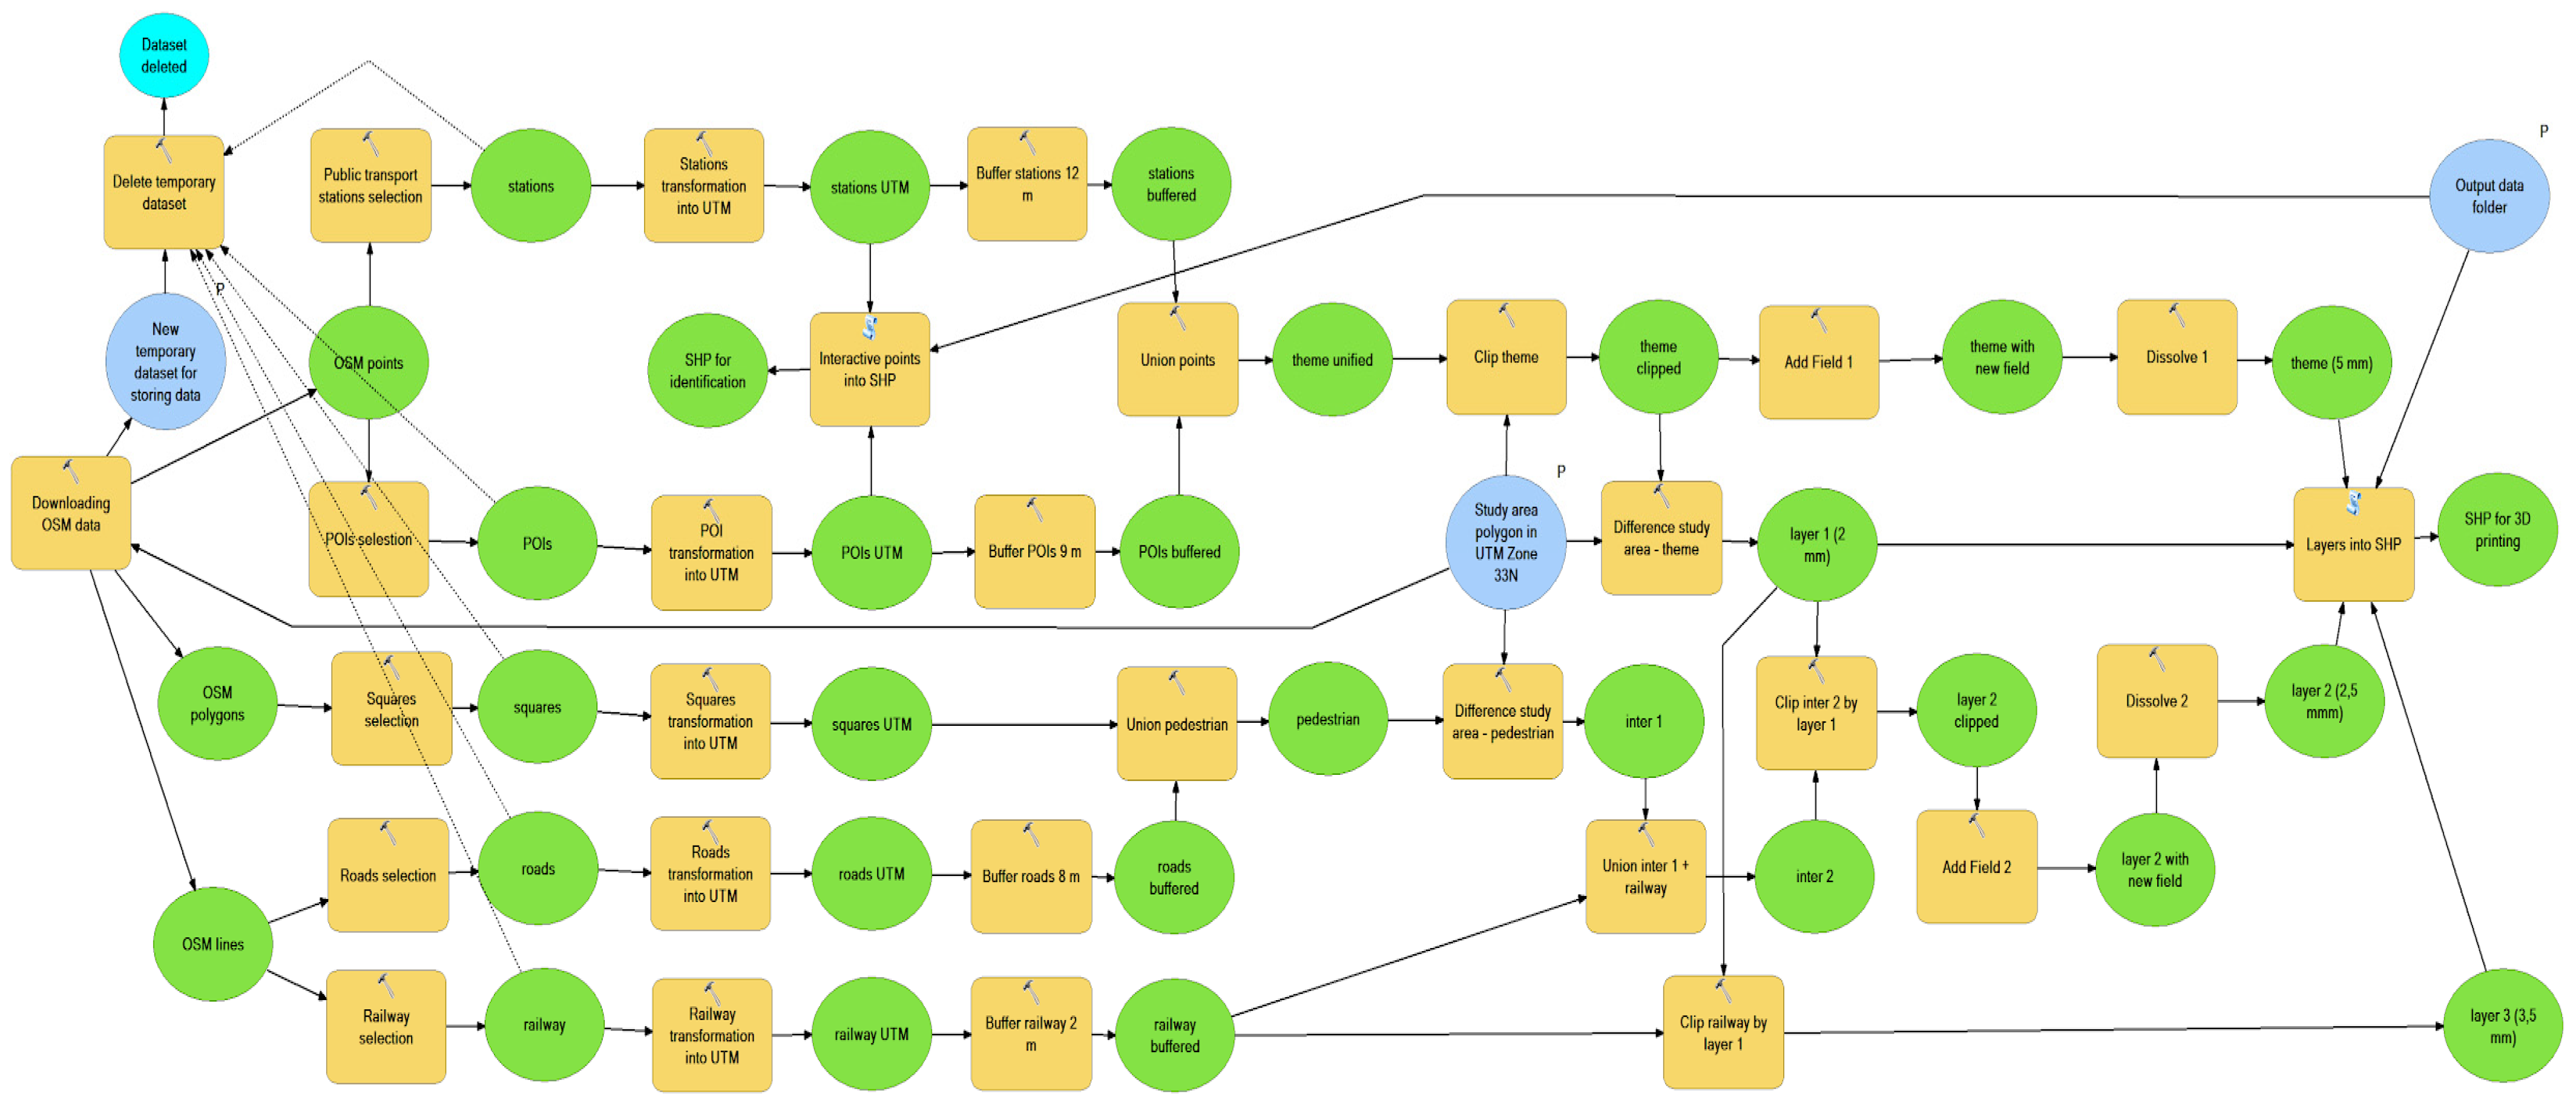
Section 2.2) showed various aims of potential map users, three different types of tactile maps were designed and visualized using 4 to 5 height layers. The first map type was designed primarily to assist people traveling on foot, the second one for those using public transport, and the third, most detailed map, being designed for tourism purposes. The ArcGIS Model Builder tool (a graphical programming interface of ArcGIS software used for automating processes) was used to automate the processing of the layers differently for each map type. The simplest model is captured in
Figure 7 to illustrate the number of steps included in the models. The model mostly used the Selection, Transform, Buffer, Dissolve, Clip, and Union tools to achieve geospatial layers representing individual height levels of tactile maps.
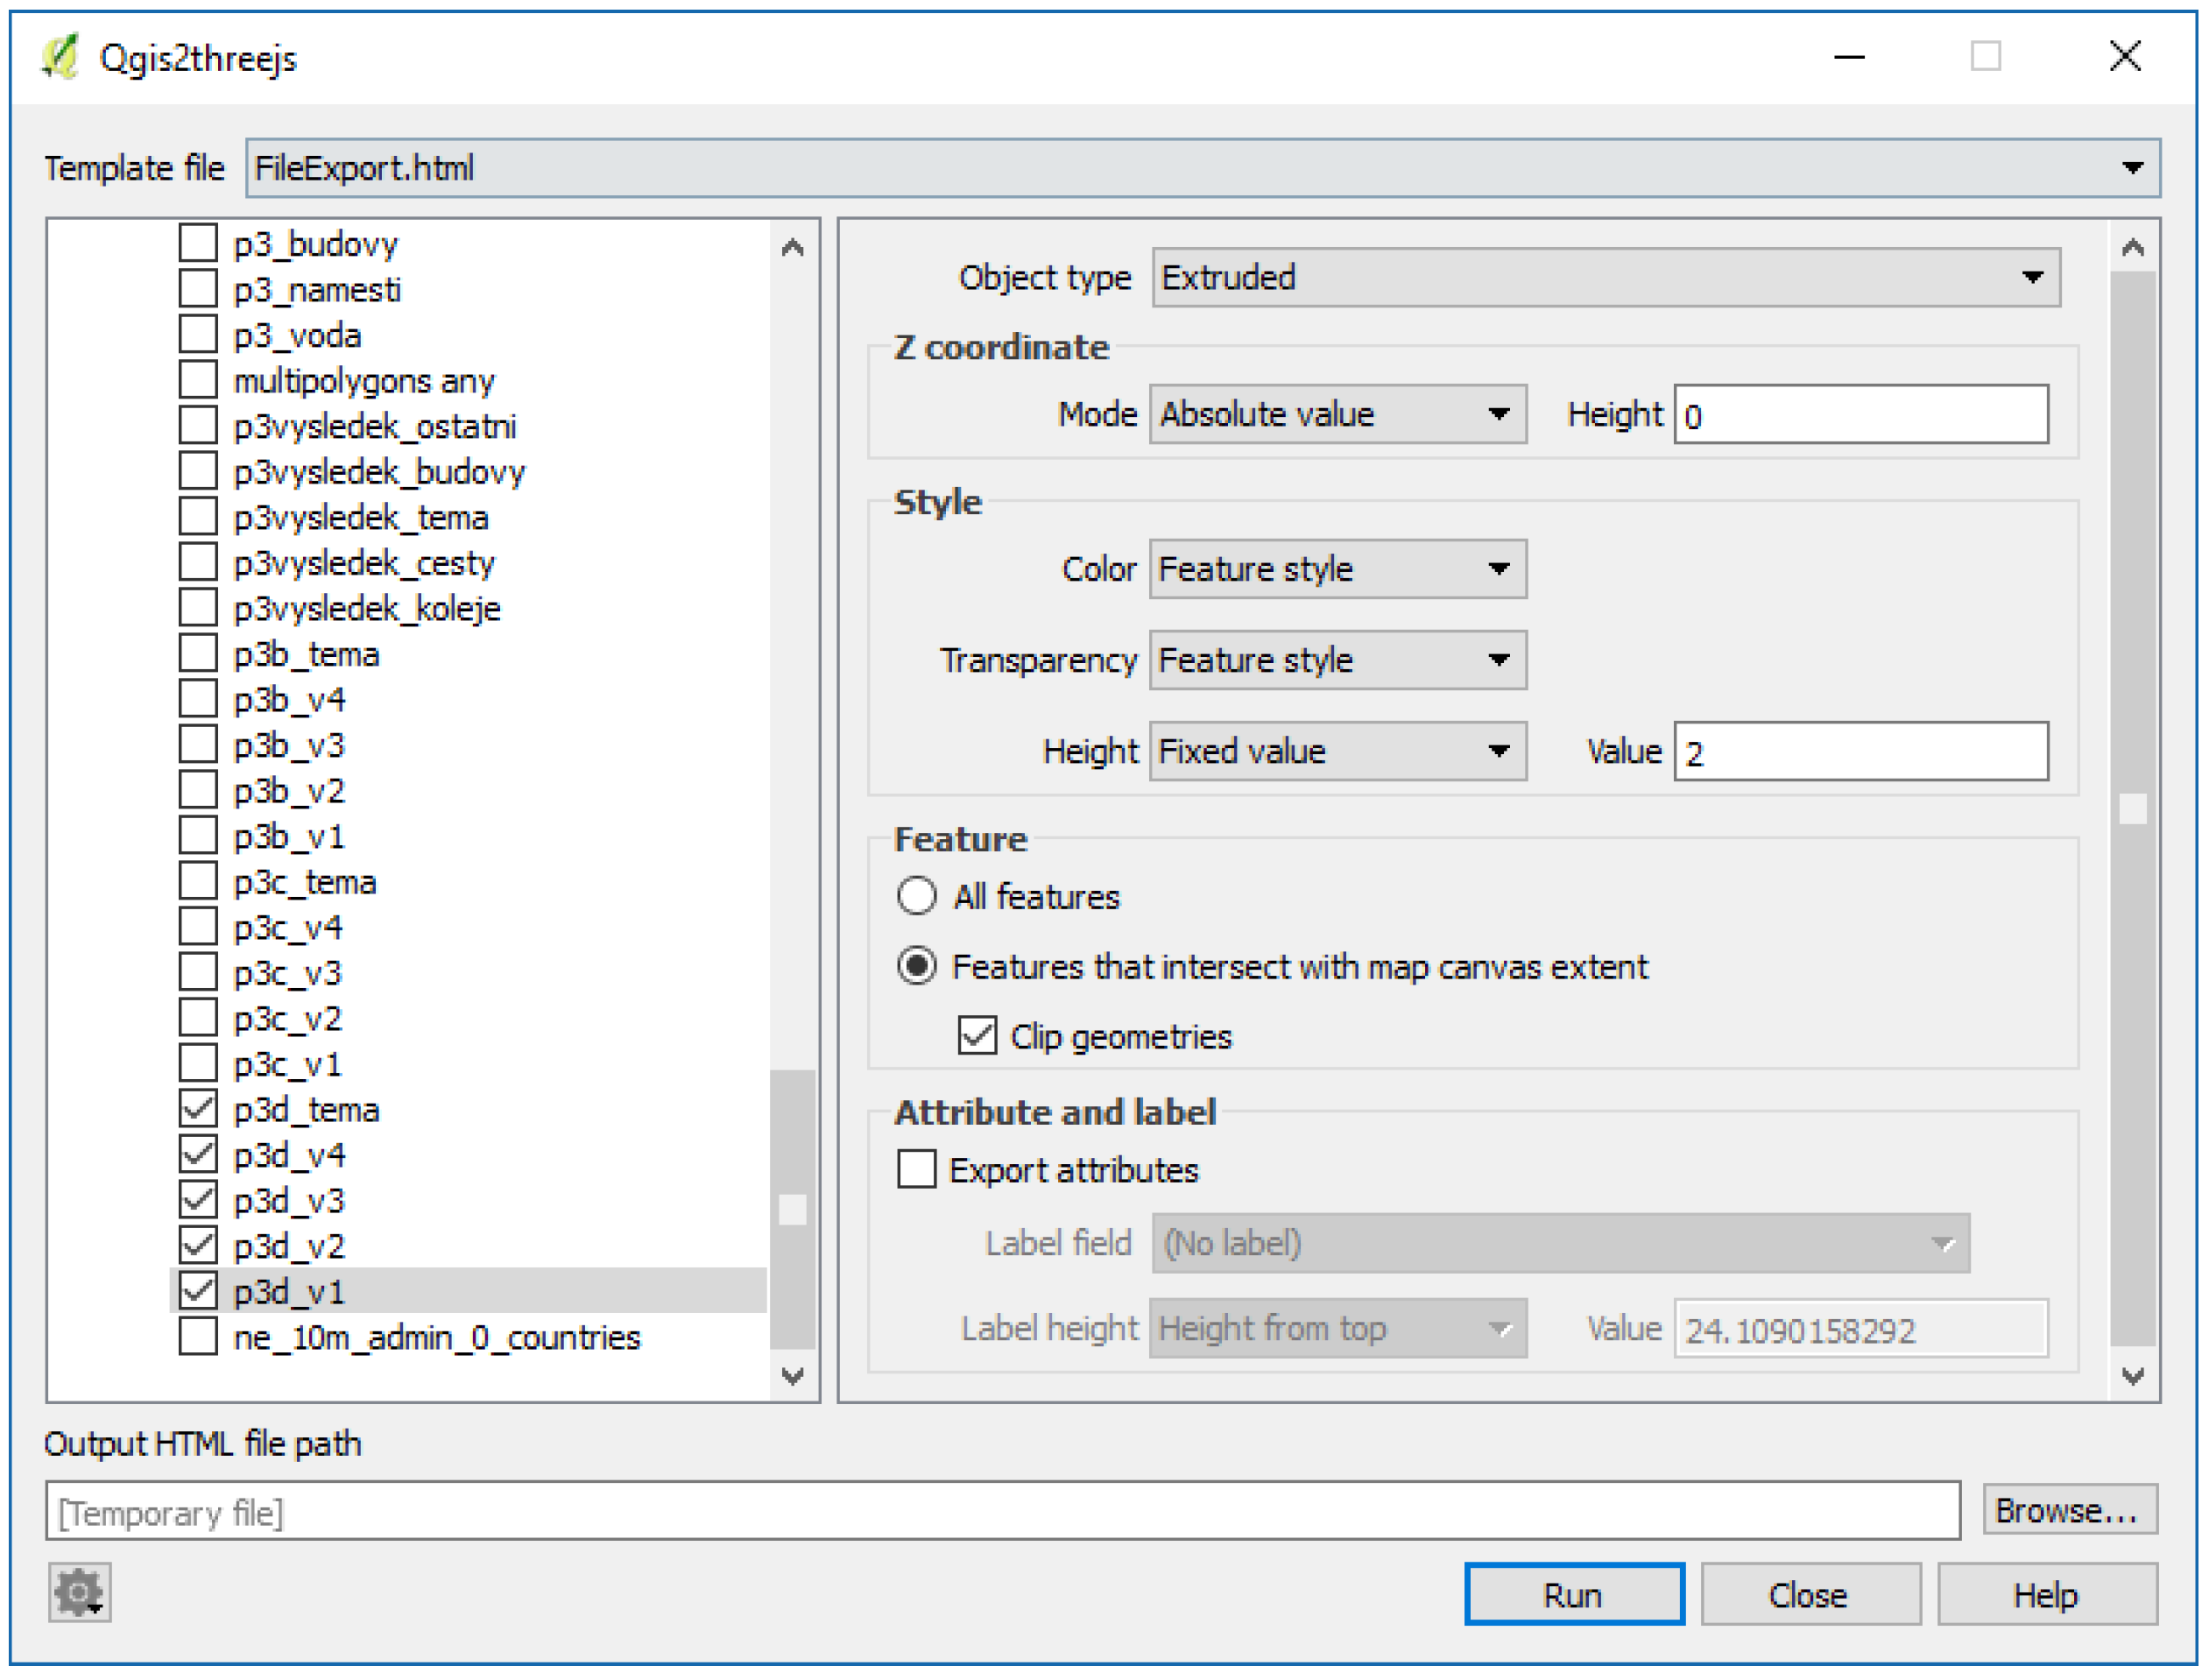
For further steps, the Qgis2threejs plugin along with QGIS [
31] software was used as the best solution for exporting GIS layers into a 3D model. This plugin provides, besides other functionality, the conversion of 2D vector layers into an STL file format according to parameters set in its user interface (
Figure 8). Layers were extruded to the height 2 to 5 mm, differing among map types (
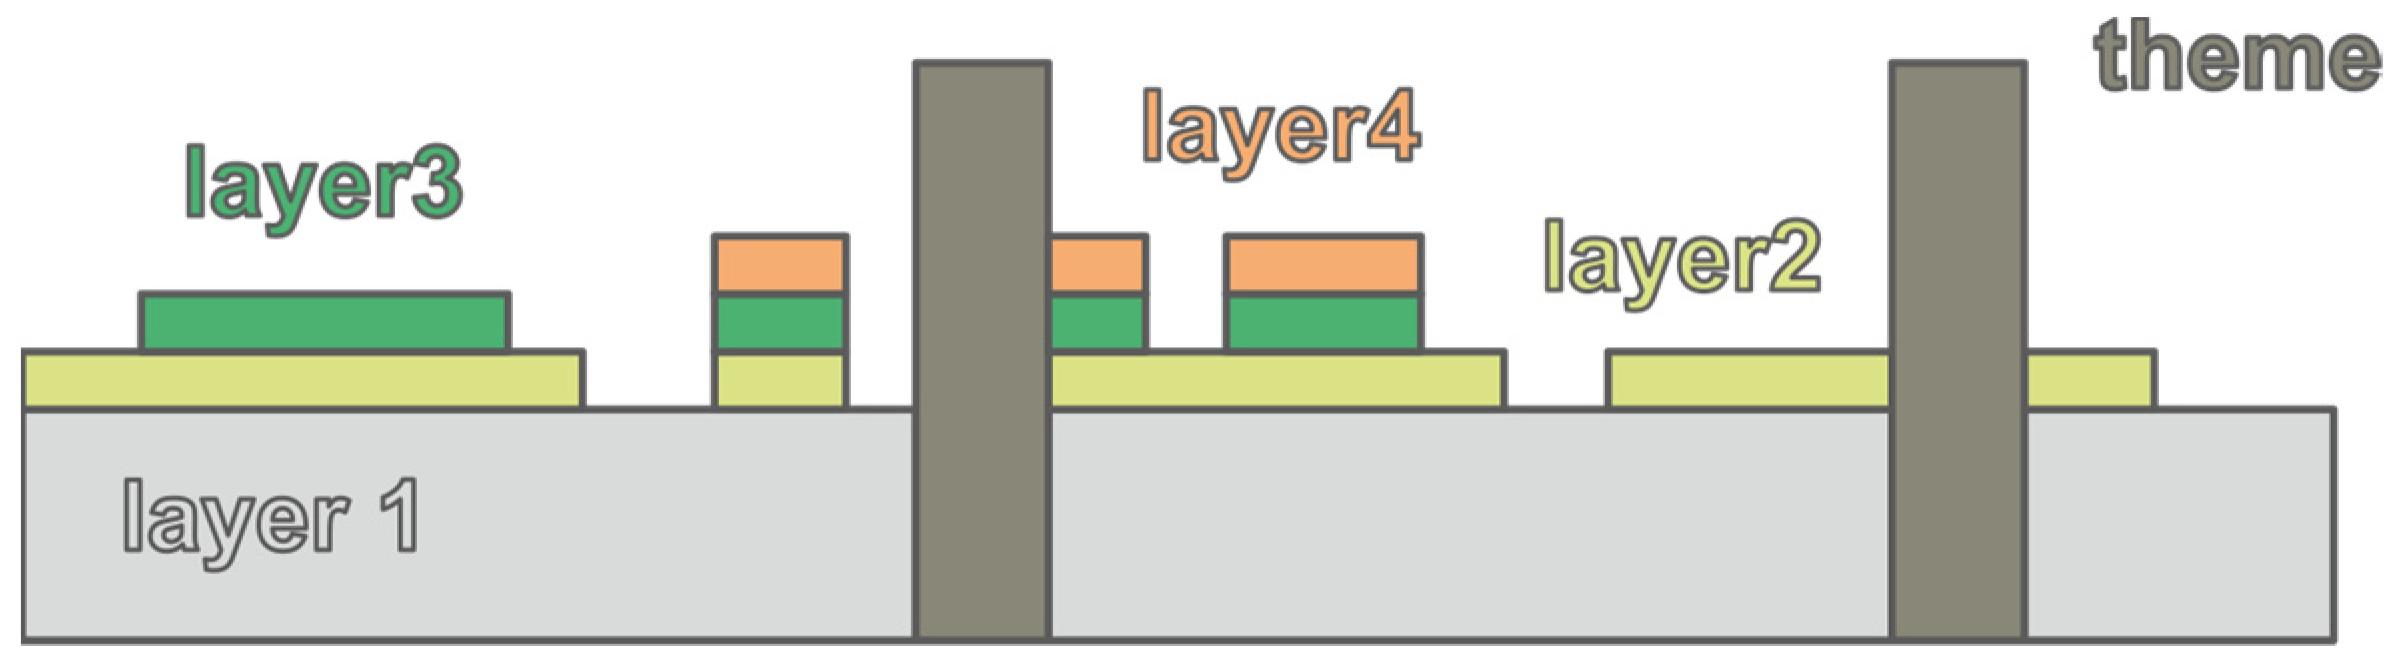
Table 1). The lowest layer representing the street network was identical for all three map types, reaching 2 mm height. Additionally, the height of interactive map symbols was extruded identically, reaching 5 mm height to adopt recommendations from the preliminary survey to be easily distinguishable from the others (
Figure 9). The interactive map symbols represented POIs, including public transport stops, shops, hotels, restaurants, banks, and medical services. Other POIs, e.g., educational institutions, were not mapped in order not to overload the map and due to their low attractivity for people with visual impairment.
The Public Transport map type was generally the simplest one, merging buildings with other open spaces without streets or paths. On the other hand, the Tourism map was expected to be the most complex and the most difficult to read, having five height layers instead of four (
Table 1). This map was intended for experienced tactile map readers. All the maps were prepared uniformly in 1:4000 scale. The 3D modeling block (
Figure 10) begins with automatic repair of potential geometry errors in STL files. In this step, realized in the 3D Builder [
32] freeware software. This process is very straight-forward and involves only to agree with the repair. Then, all non-interactive layers were merged, resulting in two 3D models instead of four to five separate models. One model represented the topographic base layers for non-conductive material, while the other represented the thematic layer of interactive POIs prepared for conductive material. Union Boolean operation was applied in the process of merging.
Another open-source software, Blender [
33], was used for the rest of the processing of the 3D models. This part consisted especially of generating primitive shapes (blocks, cylinders) at predefined locations according to the model size. These primitives were then either united or subtracted from the model. To automate the repetitive process, a Python script was developed to import both 3D models (interactive and noninteractive map parts), roughen the top surface of interactive map symbols, automatically place hooks on both sides of the maps in the suitable position according to the imported model size, and add the map symbol providing later basic information about the map and its content when touching it. The script also provided additional functionality to alternatively import one consistent model only, to generate interactive elements in a defined size and grid, and to export their position into a JSON file to be used in a mobile application (see the low branch in
Figure 10). This alternative functionality was not used in this case as it was implemented into the script for other types of 3D models. Final 3D models were exported by the script in a defined location in STL file format (both Binary and ASCII file may be used). Link to the Python script is available in the
Supplementary Materials.
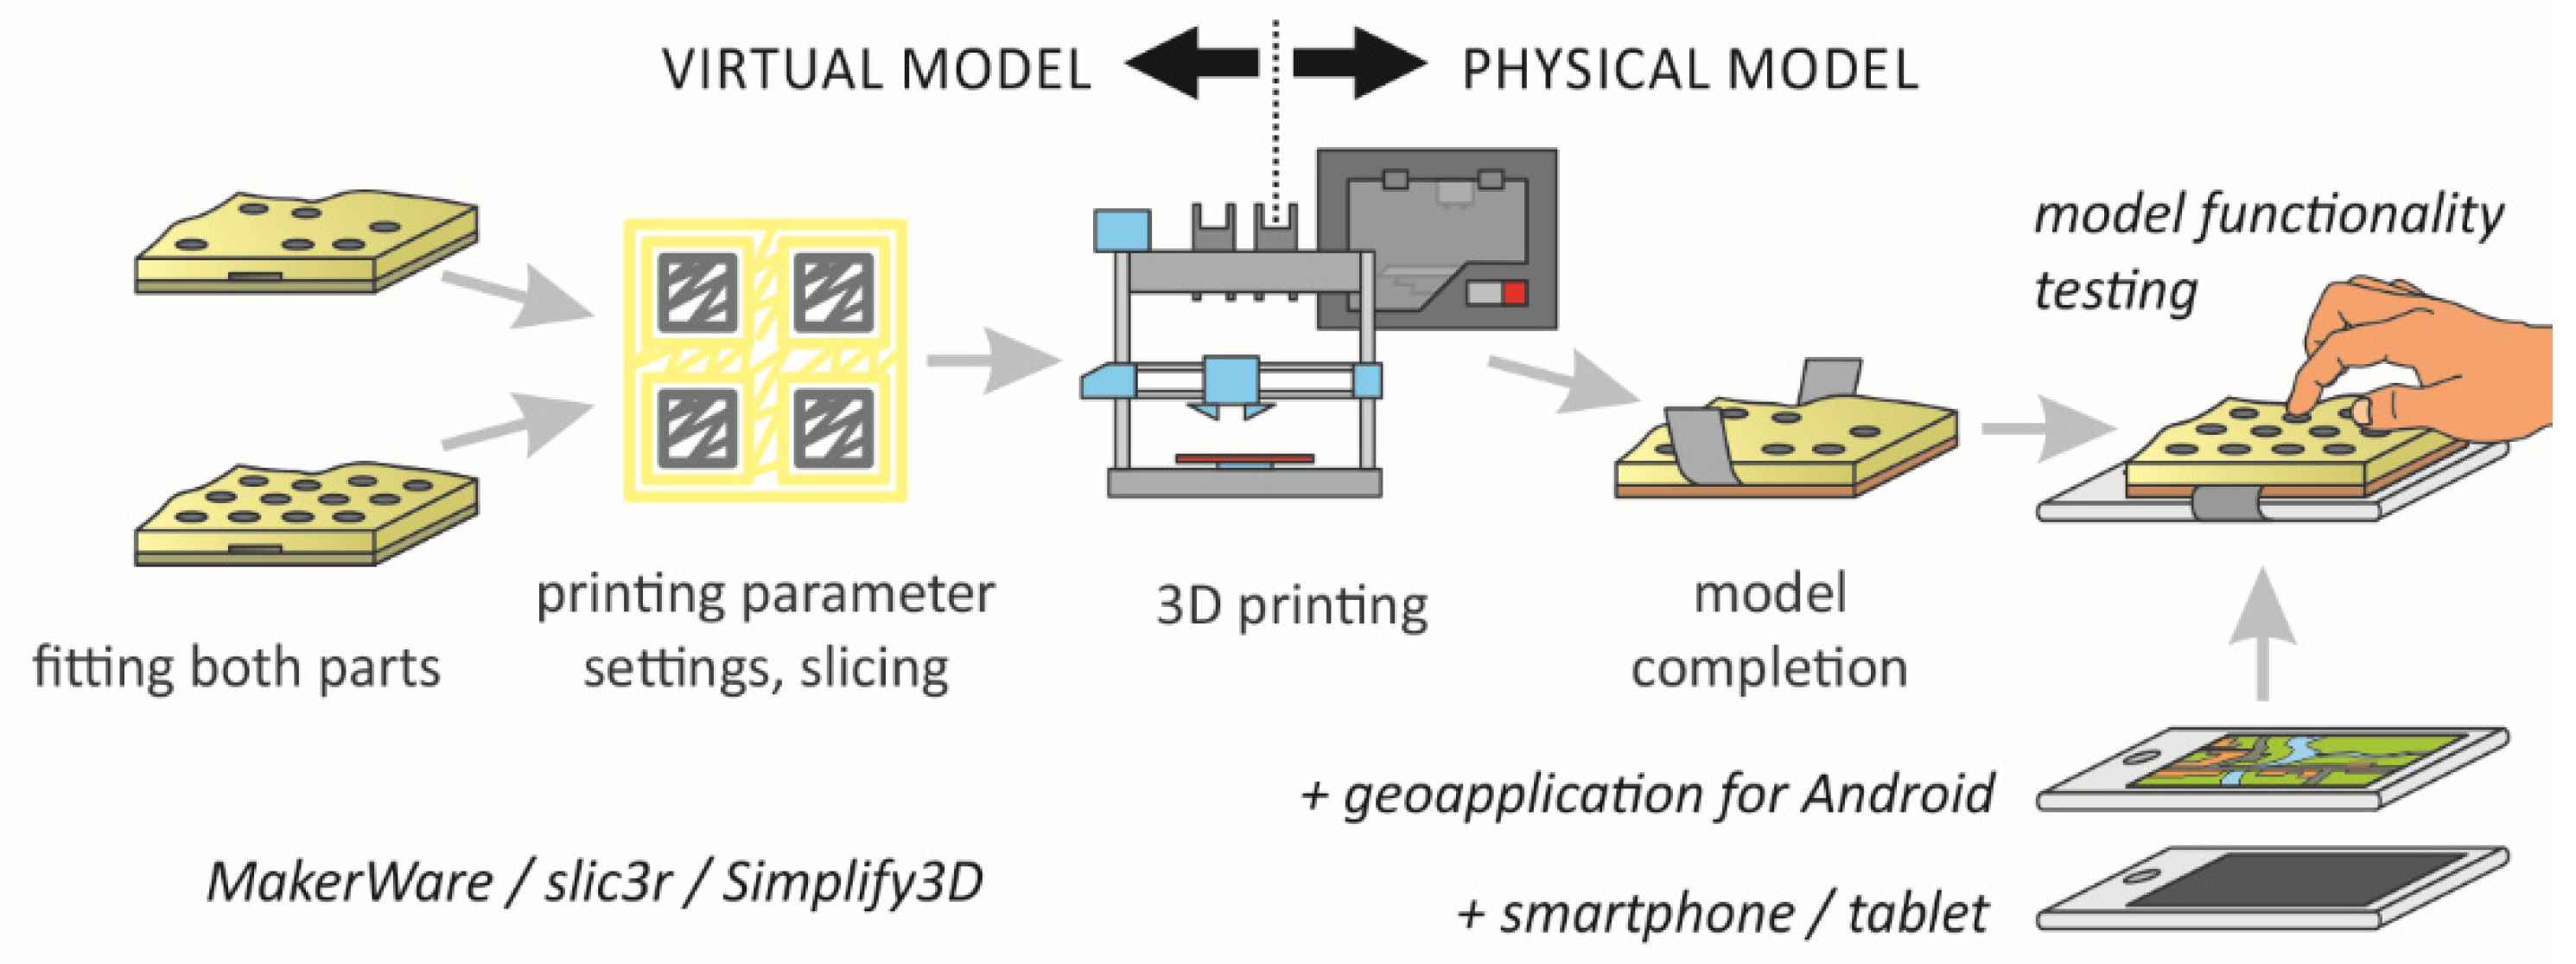
In the last part of the workflow (
Figure 11), Slic3r [
34] software was chosen to set printing parameters of both models to be printed using a Poseidon Duo 3D printer equipped with 0.4 mm nozzles. Precise calibration of the nozzles’ height above the printing bed had to be done before launching the 3D printing process as it may influence the quality of the outcomes [
16]. Otherwise, model parts printed by one nozzle could have been damaged by the second nozzle, and the adhesion of the model could be insufficient. Proto-pasta PLA filament was used for printing the conductive map elements, while blue non-conductive PLA was used for 3D printing of the non-interactive part of each tactile map. A layer height of 0.2 mm was used to reduce printing time because no continuous changes of the surface were present in case of the tactile maps. Using lower layer height would not, therefore, result in smoother surface. Infill of 60% was applied to keep especially the conductive parts durable enough. A temperature of 215 °C was set for both extruders and 50 °C for the printing bed. This, however, differs a lot according to the 3D printer and filament used. Therefore, no strict recommendations related to the printing temperature could be given. The printing time varied between two and three hours.
Finally, button schemes containing text captions to be paraphrased by TTS were coded in the form of a JSON file importable into the TactileMapTalk [
35] Android application developed especially for the TouchIt3D maps. It represents a simple application where software buttons are defined via a JSON file, and after touching these buttons, text of the caption associated with the button is read using the TTS function. This mobile application was used for testing in this case study. However, any other application or a simple website where software buttons can be defined may be used for TouchIt3D tactile maps. Proper functionality of each map (
Figure 12) was tested to avoid some interactive map symbols not working due to incorrect button placement or 3D printing errors. The content of predefined texts and their adaptation by TTS was examined similarly. Reflecting the preliminary user survey, the mobile application was upgraded to launch the auditory description only when pressing an interactive map symbol for at least 1 s.
2.4. User Evaluation
User testing of final tactile maps was realized similarly to how the preliminary survey was done. This testing aimed to obtain feedback from people with visual impairment on the readability and usability of these interactive tactile maps made using semi-automated processes. Most respondents were the same participating in the preliminary survey, although some were new for the final testing and some respondents from the preliminary survey declined to join the final one. A total number of 10 respondents joined the evaluation, from which five identified themselves as female and the other five as male. All the respondents had used some kind of tactile maps before. The same sets of tasks were given to all respondents, while the interview part was kept unstructured and developed various topics varying between respondents. The results of the experiments were later confirmed on a larger user group in follow-up research testing a similar type of new-generation TouchIt3D tactile maps [
36].
The meeting with each individual respondent was always introduced by presenting all three themes of the final tactile maps set in the uniform order from the simplest to the most complex one: Public Transport, Walking and Tourism maps. After explaining the content and functionality of each map, respondents were asked to finish a task related to that kind of map. In the case of the Public transport map, the given task (marked PT1) was to detect which tram line can be used to travel between two tram stops defined by their name and to which other means of transport they can transfer on one of these stops (PT2). For the Walking map, the tasks were to find the closest restaurant from a defined tram stop (W1) and to show the shortest path from the restaurant to a grocery shop (W2). In the Tourism map, respondents were asked to show and describe the path from a castle across the main town square to a specific hotel (T1). Additionally, they were asked to show where the areas covered by trees are situated on the map (T2).
Answers were marked as “correct” when respondents fully completed the task; as “partly correct” if they, for example, found a POI of the same type but not exactly the correct one, found the path but not the shortest one, and also if they showed forest but also showed another height layer in the task T2. Answers were deemed incorrect and marked “wrong” when the respondent indicated an incorrect map symbol or failed to finish the task at all. The final part of the testing utilized an interview format, in which respondents were asked to evaluate the distinctiveness of map symbols, the usability of presented maps and asked for suggestions they have for further development.
3. Results
The correctness of the answers from the user evaluation is captured in
Table 2. Correct answers occurred almost in all cases for the simplest map of the Public Transport type. With increasing map complexity, the success rate decreased. The majority of respondents answered the complex task T1 only partly correctly. It was expected that due to the presence of five different layers in the Tourism map type, there were also several mistakes in distinguishing the forested area in task T2.
Similar to the preliminary survey, all respondents were very satisfied with the interactivity of the maps, which was the most distinguishing feature compared to other tactile maps they had worked with before. Half of the respondents stated the edges of map symbols were appropriately rough, while two said the edges were a bit sharp. The others did not mention this aspect. A few participants asked for an interactive symbol for muting and unmuting the auditory descriptions. This feature is currently being implemented in the new generation of TouchIt3D maps to avoid interruption during the introductory map exploration. Only one respondent suggested the auditory content be launched by double-click, whereas the rest described the current solution to be good or did not mention this being problematic. Abbreviated responses are shown in
Table 3.
Additionally, the first respondent would appreciate having the map legend available separately. This participant experienced some problems with the unintentional launching of auditory descriptions. The second participant proposed having a more detailed scale for maps distinguishing individual buildings as he experienced difficulties touching the street surface when surrounded by buildings. In contrast, the fourth respondent joining the evaluation appreciated the large area covered by each map. She even stated that these maps were the most sophisticated tactile maps she had ever encountered (before, she experienced hand-made tactile maps, plastic foils, maps based on microcapsule paper, and few 3D printed tactile maps). The fourth and eighth respondents described themselves as “not map-based people” but were pleasantly surprised by the functionality and interactivity of the presented maps. While the sixth respondent suggested using these kinds of maps for orientating at exhibitions, concert halls, and railway stations, the seventh respondent, conversely, did not deem it useful to use these at train stations, which are generally equipped with navigation audio-beacons. Instead, she suggested that these maps could be very useful in hospitals. The last participant in the user testing suggested the idea of moving the interactive map symbols slightly so that they would be completely inside the buildings in order not to block a clear interpretation of street connectivity.
Despite the lower initial costs, the maps were very positively evaluated by our respondent group of people with severe visual impairment. All participants of the map evaluation enjoyed the interactivity of the presented maps and achieved a geospatial awareness of the mapped areas. The tactile map of the Public Transport type with inaccessible areas merged into a single map layer was usually evaluated to be easily readable. Other map types, even when they suffered from occasional misreading, were appreciated for their detailed shapes. The scale of 1:4000 was suggested as optimal for this kind of plastic tactile maps due to its balance of both good readability and sufficient extent. Considering map symbology, four height layers appeared to be optimal for less-experienced readers, while for the more experienced users, five layers were comprehensible as well providing a more detailed image of the mapped area.
As a result of the final user verification, interactive TouchIt3D tactile maps linkable with a tablet were considered innovative and new for all respondents in the user evaluation. The people with visual impairment, joining the map presentation and testing, introduced many interesting ideas regarding how those maps could be used and upgraded. The ideas included using these maps for indoor navigation, for capturing hospitals, large railway stations, shopping malls, exhibition grounds, and similar spots. Some suggested using the TouchIt3D maps for independent movement education directly in the field, while others would prefer to use them prior to their movement in order to memorize the area. All the examples suggest the need for specific upgrades, and several will be examined in follow-up research.
4. Discussion
Although the proposed workflow has made the creation of multimedia tactile maps significantly more effective, it still involves a number of steps that must be performed manually. The reasons for this include the fact that some operations are necessary to be done manually considering the individual characteristics of tactile maps (e.g., appropriate descriptions for mapped objects). Difficulties in automation were also caused by poor interoperability between GIS and 3D modeling software. Additionally, the final phase of so-called slicing (converting a 3D model into simple instructions for a 3D printer) is highly dependent on the type of 3D printer used. It also cannot be automated while preserving the possibility to use different 3D printers. Therefore, it is assumed that a fully automated workflow would not be widely usable and with current specifics of 3D printers not even possible.
The developed workflow is also limited in the diversity of map symbols representing POIs. All the conversions of point data into polygons were made using the Buffer tool (a processing tool creating buffer polygons around input features to a specified distance). Therefore, all the symbols are round, varying only in diameter (public transport stops different than other POIs). However, which object is represented by each map symbol is clarified by the auditory description. Besides the other similar approaches, the presented workflow for TouchIt3D maps preserve the possibility to use both positive and negative 3D relief surface and advance the connection with a mobile device to provide additional information. At the same time, the map’s simplicity is preserved.
Mostly, open-source software and open data like OSM were used in the workflow. Originally, open-source tools were intended to be also used for GIS geoprocessing analyses instead of commercial software. However, when the same operations were applied in the QGIS Graphic Modeler tool, the workflow consisting of multiple subsequent overlay analyses (Clip, Union, etc.) resulted in some invalid topology very often. Mostly, zero-width switchbacks/knots occurred along the boundaries of polygon layers. Unfortunately, these switchbacks/knots occurred even when implementing alternative open-source tools available in the QGIS list, and the result faulty layers were irreparable by common tools for repairing incorrect geometry. These errors either interrupted the automated workflow or would cause difficulties in the process of 3D modeling. Therefore, even though the workflow of subsequent operations in QGIS was correct and vocationally even resulted in usable output, the ArcGIS geoprocessing tools were used instead, providing correct results in all cases with clean topology without any switchbacks nor knots.
Even though it is difficult to calculate the final cost of each map, including the cartographer‘s time necessary for its preparation (which also differs worldwide), just a simple comparison of material costs shows the savings brought by the use of TouchIt3D technology in the financial aspects, while still keeping the map qualities.
While older-generation interactive maps [
4,
37] required costs reaching €350–400 (about €150–200 for the map and €200 for the electronics), one TouchIt3D map can be printed for €15; adding in a tablet costing €120 does not reach even half of this sum. Moreover, when using one tablet for ten tactile maps, the average price per map falls under €30. These savings were mostly achieved by: (1) using cheaper technology of 3D printing (low-cost 3D printers and cheaper filament instead of powder-based technologies), (2) using a tablet for multiple maps instead of mounting electronics into every single map, (3) using open-source data and sources. The costs of commercial software were not counted in costs before nor after the optimization as a university license was used in both cases. More savings could also be expected to be achieved due to a less time-consuming design process, but the impact of this aspect cannot be fully calculated due to diversity in labor costs.
Production of TouchIt3D interactive maps remains, of course, more expensive compared to simple non-interactive 3D tactile maps [
19,
20,
27]. Furthermore, it involves a multi-extruder 3D printer that is not necessary for maps made of one material or maps with colors variable only in the height direction. However, the interactivity of tactile maps was found to be very important for people with severe visual impairment when exploring the exterior in this study, similarly to the importance when orienting indoors [
17]. Among older studies [
17,
18], our approach presents interactive maps which are easily portable and usable both in the interior (for studying the landscape in advance) and in the exterior (e.g., when moving in a city). Henceforward, automatic generalization of input data (e.g., simplifying shape of polygon features), delineated by some studies [
28], has remained an unresolved issue and has been implemented neither in our study. Yet, some basic cartographic generalization was secured by overlay analyses in the process of data processing.


