
Research on the Longitudinal Section of River Restoration Using Probabilistic Theory


Department of Civil and Environmental Engineering, Pusan National University, Busan 46241, Korea
*
Author to whom correspondence should be addressed.
Entropy 2021, 23(8), 965; https://doi.org/10.3390/e23080965
Submission received: 14 June 2021
/
Revised: 13 July 2021
/
Accepted: 22 July 2021
/
Published: 27 July 2021
(This article belongs to the Section Information Theory, Probability and Statistics)
Abstract
:Since the 1960s, many rivers have been destroyed as a consequence of the process of rapid urbanization. As accurate figures are important to repair rivers, there have been many research reports on methods to obtain the exact river slope and elevation. Until now, many research efforts have analyzed the river using measured river topographic factors, but when the flow velocity changes rapidly, such as during a flood, surveying is not easy; and due to cost, frequent measurements are difficult. Previous research has focused on the cross section of the river, so the information on the river longitudinal profile is insufficient. In this research, using informational entropy theory, equations are presented that can calculate the average river slope, river slope, and river longitudinal elevation for a river basin in real time. The applicability was analyzed through a comparison with the measured data of river characteristic factors obtained from the river plan. The parameters were calculated using informational entropy theory and nonlinear regression analysis using actual data, and then the longitudinal elevation entropy equation for each river and the average river slope were calculated. As a result of analyzing the applicability of the equations presented in this study by R2 and Root Mean Square Error, all R2 values were over 0.80, while RMSE values were analyzed to be between 0.54 and 2.79. Valid results can be obtained by calculating river characteristic factors.
1. Introduction
While there has been a lot of research on the cross-section of rivers, there is not enough information on the longitudinal section, as there has not been much research on it. The longitudinal elevation and river slope are difficult to measure directly, especially when the flow velocity changes rapidly. However, owing to the development of measurement technology, it is now easy to obtain data such as river slopes and river longitudinal elevations through Light Detection and Ranging (LIDAR), which makes it easier to produce a Digital Elevation Model. However, using the data obtained through LIDAR, there are indisputable errors between the digital elevation models and measured values [1]. To resolve this problem, entropy theory was applied as a means of obtaining topographic factor data while minimizing errors.
2. Methodology
In recent years, the concepts of statistics, entropy, and probability have been often used to analyze rivers, and the method of calculating river Longitudinal Elevation studied in this paper can also be induced by maximizing entropy.
Lienhard derived the dimensionless unit water level of the drainage basin in a statistical method using the concept of the maximum entropy expression [2]. The concept of entropy was studied as a scientific discipline by Wilson [3], while Leopold and Langbein applied the concept of entropy to study river behavior [4]. Yang derived the river mean elevation law using the concept of physical entropy [5]. Singh and Fiorentino broadened the scope of the concept of information entropy [6]. Meanwhile, Chapman [7] used the concept of information entropy for the quantitative analysis of the uncertainty of hydrologic data.
Chiu introduced the concept of information entropy to calculate a two-dimensional flow velocity formula and calculated a flow velocity probability density function that satisfied the constraints on the maximum entropy law [8,9,10]. Fiorentino et al. defined the river longitudinal section by identifying the relationship between information entropy and the basin average elevation, and compared the river longitudinal section with actual measurements [11,12].
Recently, Mirauda et al. [13] and Kundu [14] analyzed the location of the dip phenomenon occurring in an open channel using entropy models. Although the concept of entropy has been widely studied as a scientific discipline, not many cases have been used to study river longitudinal sections.
In this study, formulae for calculating the river slopes, average river slopes, and river longitudinal elevation are suggested using concepts similar to those of Chiu. Maximizing entropy theory can be used to determine the parameters and to obtain the river longitudinal elevation before destruction. This can be used to make the river restoration model.
3. Theoretical Background
3.1. Nonlinear Regression
In statistics, regression analysis is used to model correlations between dependent and independent variables. Nonlinear regression models regress expressions using nonlinear prediction functions, and unknown parameters are estimated from the equation, which are called regression models. In general, for regression analysis, the basic method is to obtain parameters that minimize the sum of squares of residuals. For nonlinear regression, it is impossible to mathematically represent the error, and this can only be obtained by iterative methods. The regression model is conducted using the least squares method. If the purpose of the regression model is prediction rather than interpretation, nonlinear regression is used. This is because nonlinear models can also be modeled on data with complex patterns. Therefore, nonlinear regression analysis is used in this paper to predict the river longitudinal section by calculating river slopes and river longitudinal altitudes.
3.2. Entropy Theory
Since natural phenomena proceed in the direction of increasing entropy, the entropy equation can explain natural phenomena. From a mathematical point of view, river slopes and river altitudes can also be expressed using maximum entropy laws. There are three types of entropy that can quantify the characteristics of the system and be used to build a model of the system: thermodynamic entropy, statistical entropy, and information entropy. The probability distribution function of a mathematical variable can be determined by maximizing the entropy of the variable in a particular way, and from a physical point of view the maximized entropy of a river longitudinal section creates a constant probability distribution under constraints. Thus, the probability law of arbitrary river longitudinal sections and the corresponding entropy generally depends on constraints, and the most important point of an entropy-based approach is to determine how to constrain a situation. The probability density function p(x) for continuous state variables x is quantitatively represented by entropy, such as in Equation (1):
Entropy H, defined as Equation (1), represents the uncertainty or randomness of the state variable x, and p(x)∙dx represents the probability between the state variable x and the state variable x+dx. Equation (2) is defined as the mean of a continuous random variable :
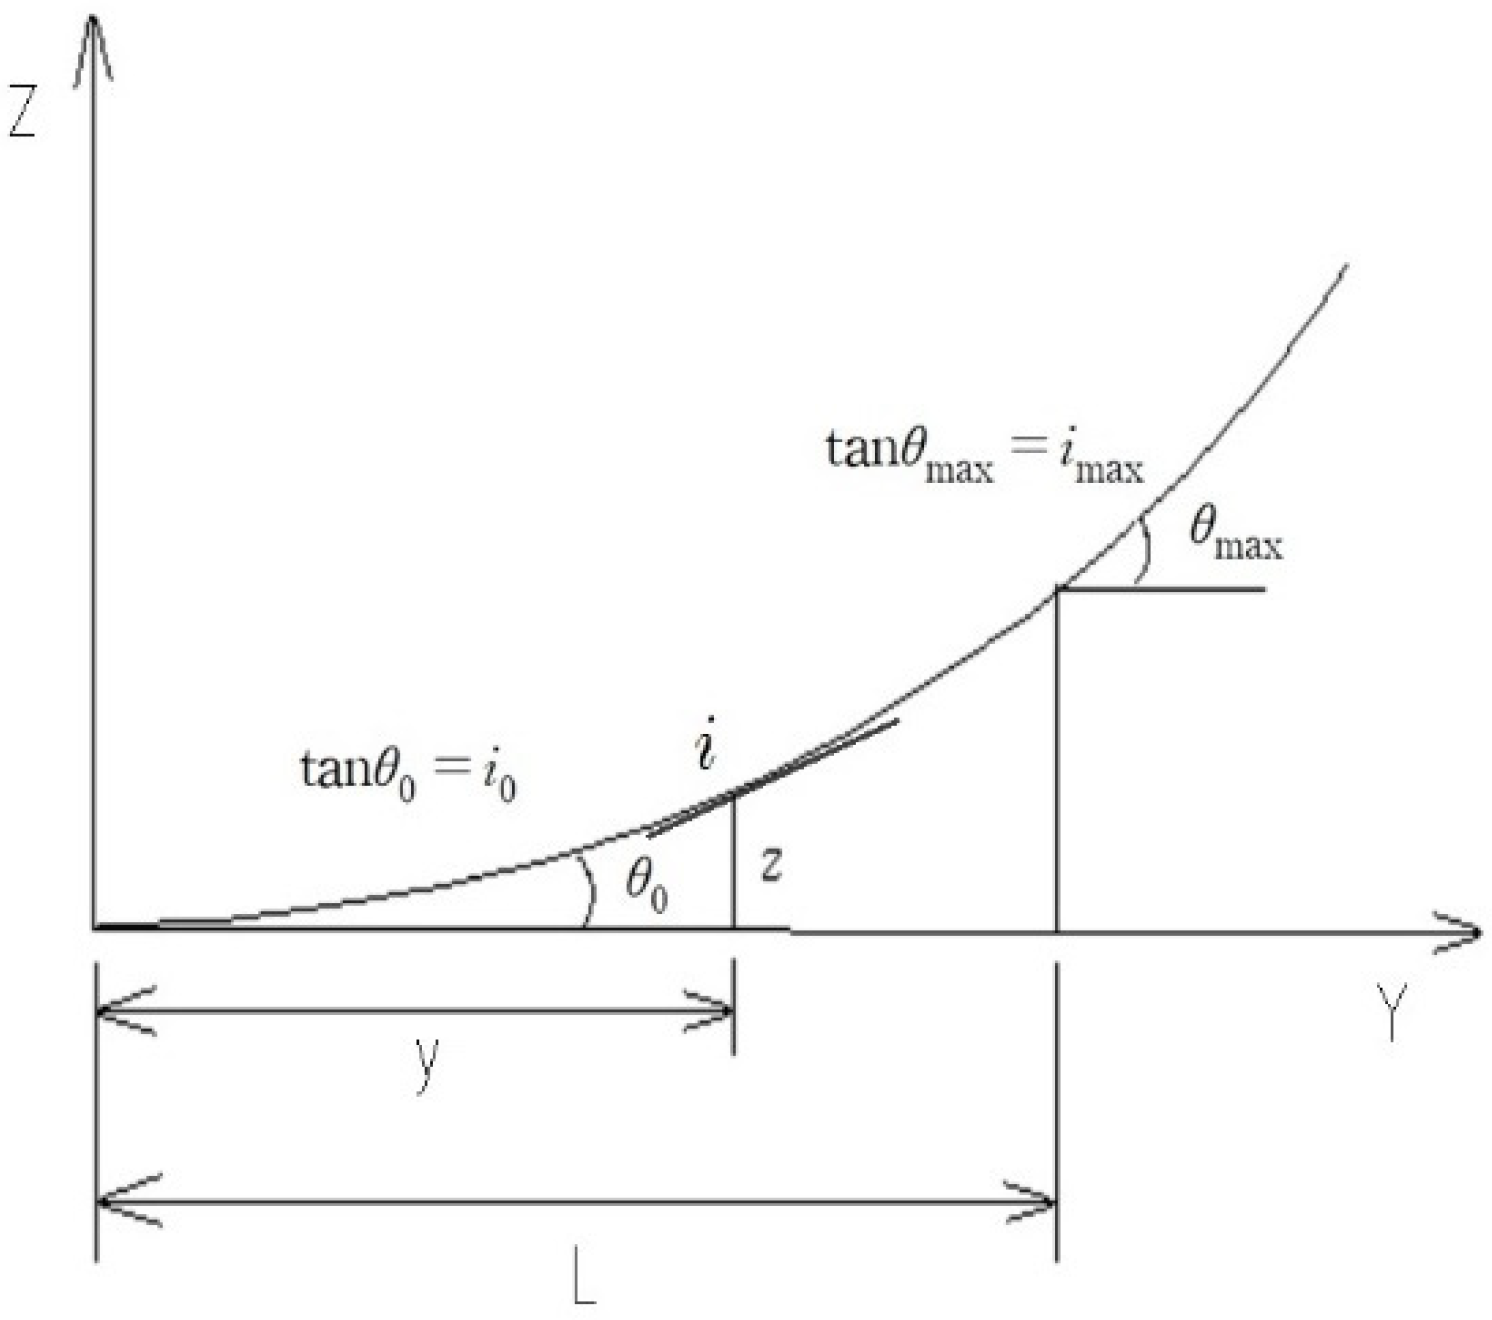
Figure 1 shows the longitudinal section of a stream, which is the altitude z at any elevation from its initial point, y is the horizontal distance, and the slope at that point is i. The slope of the initial point is , and the slope of the end point is . If a river basin is considered a system in which i is a river slope, and the state variable x of the system is defined in Equation (1), the entropy of the basin can depend on the probability. The probability density function of the basin is the same as Equation (4):
where p(i) is probability density function for slope i.
The first constraint is Equation (5), expressed using river slopes instead of state variations in Equation (2), and the second constraint is Equation (6), using the definition of general probability. By maximizing entropy, the probability density function p(i) for river slopes i can be obtained. The p(i)∙di is the probability of a state variable I and is expressed as Equation (6):
Arranging the independent constraint conditions can be given as Equation (7):
where is the minimum value of , is the maximum value of , and is the constraint number ( is Equation (5), is Equation (6)).
Therefore, , which maximizes the entropy, can be obtained using the method by Lagrange as Equations (8)–(10):
where .
where and are Lagrange multipliers.
Substituting Equations (12) and (13) into Equation (11) can be constructed as the following Equation (14):
where are the Lagrange multipliers.
Differentiating Equation (11) by p(i), Equation (12) shows the probability density function p(i).
Here, λ1 − 1 is , and λ is .
The organized formula is as follows:
Then, b1 is obtained by substituting the probability density function p(i) expressed in Equation (12) into the constraint Equation (6). The result is Equation (13), and the Lagrange multiplier b1 is Equation (14):
The variable b1 of the probability density function Equation (12) is eliminated by substituting b1 into Equation (14), and the probability density function p(i) follows as Equation (15):
3.3. River Mean Slope Formula Development
The probability density function p(i) is applied to the river mean slope of Equation (5). Equation (16) is integrated, and Mmax is substituted for ., and M0 for . The result is the same as Equation (17):
The river mean slope is expressed in Equations (18) and (19):
The river mean slope i is determined by the slope of the initial and final points, and the entropy parameter .
Integrating Equation (20) yields Equation (21), and the river slope is expressed in Equation (22):
Then, b1, b2 are eliminated by substituting b1 of Equation (14) into Equation (22), and the result follows as Equation (23):
The river slope of a random point i is defined as dz/dy, and dz follows as Equation (24):
By integrating Equation (24), the river elevation z can be obtained as Equation (27):
Here, c is an integral constant, so if the horizontal distance is y = 0, then the river longitudinal elevation is z = 0. Therefore, the integral constant is . Substituting c into Equation (25), the river elevation z can be shown as Equation (26).
We defined Mmax as the product of b and imax, and M0 as the product of b and i0. Thus, Equation (25) could be written as Equations (26) and (27):
3.4. RMSE
The Root Mean Square Error, RMSE, is a measure of the residual, which is the difference between the values predicted by the model and the actual observed values. The RMSE enables the predictive power to be integrated into a single unit of measurement. The RMSE of the model’s prediction for the estimated variable is defined as the square root of the mean square error (Equation (28)):
where indicates the actual observed value, and is the predicted value obtained from the model.
4. Application to Real River
This study compared and analyzed the measured and theoretical values obtained by the river mean slope formula. The river longitudinal elevation was obtained by the River Improvement Plan, which is considered reliable, and the initial slopes, last slopes, and lengths of the seven rivers are shown in Table 1. The length of Nakdong river is 510 km, but the data used in this research was only partial due to the long length. The river slope used in this research was used by all positive river slopes.
4.1. Determination of Parameter by Measured Values
Based on the river longitudinal section, the parameters were yielded by a nonlinear regression analysis of the river longitudinal value z in order to make the error sum of the predicted values as small as possible. The Equations (26) and (27) were used for the calculation. Table 2 shows the parameter value, while Table 3 compares the average slope of the river calculated by substituting the parameters of each river.
4.2. River Longitudinal Elevation
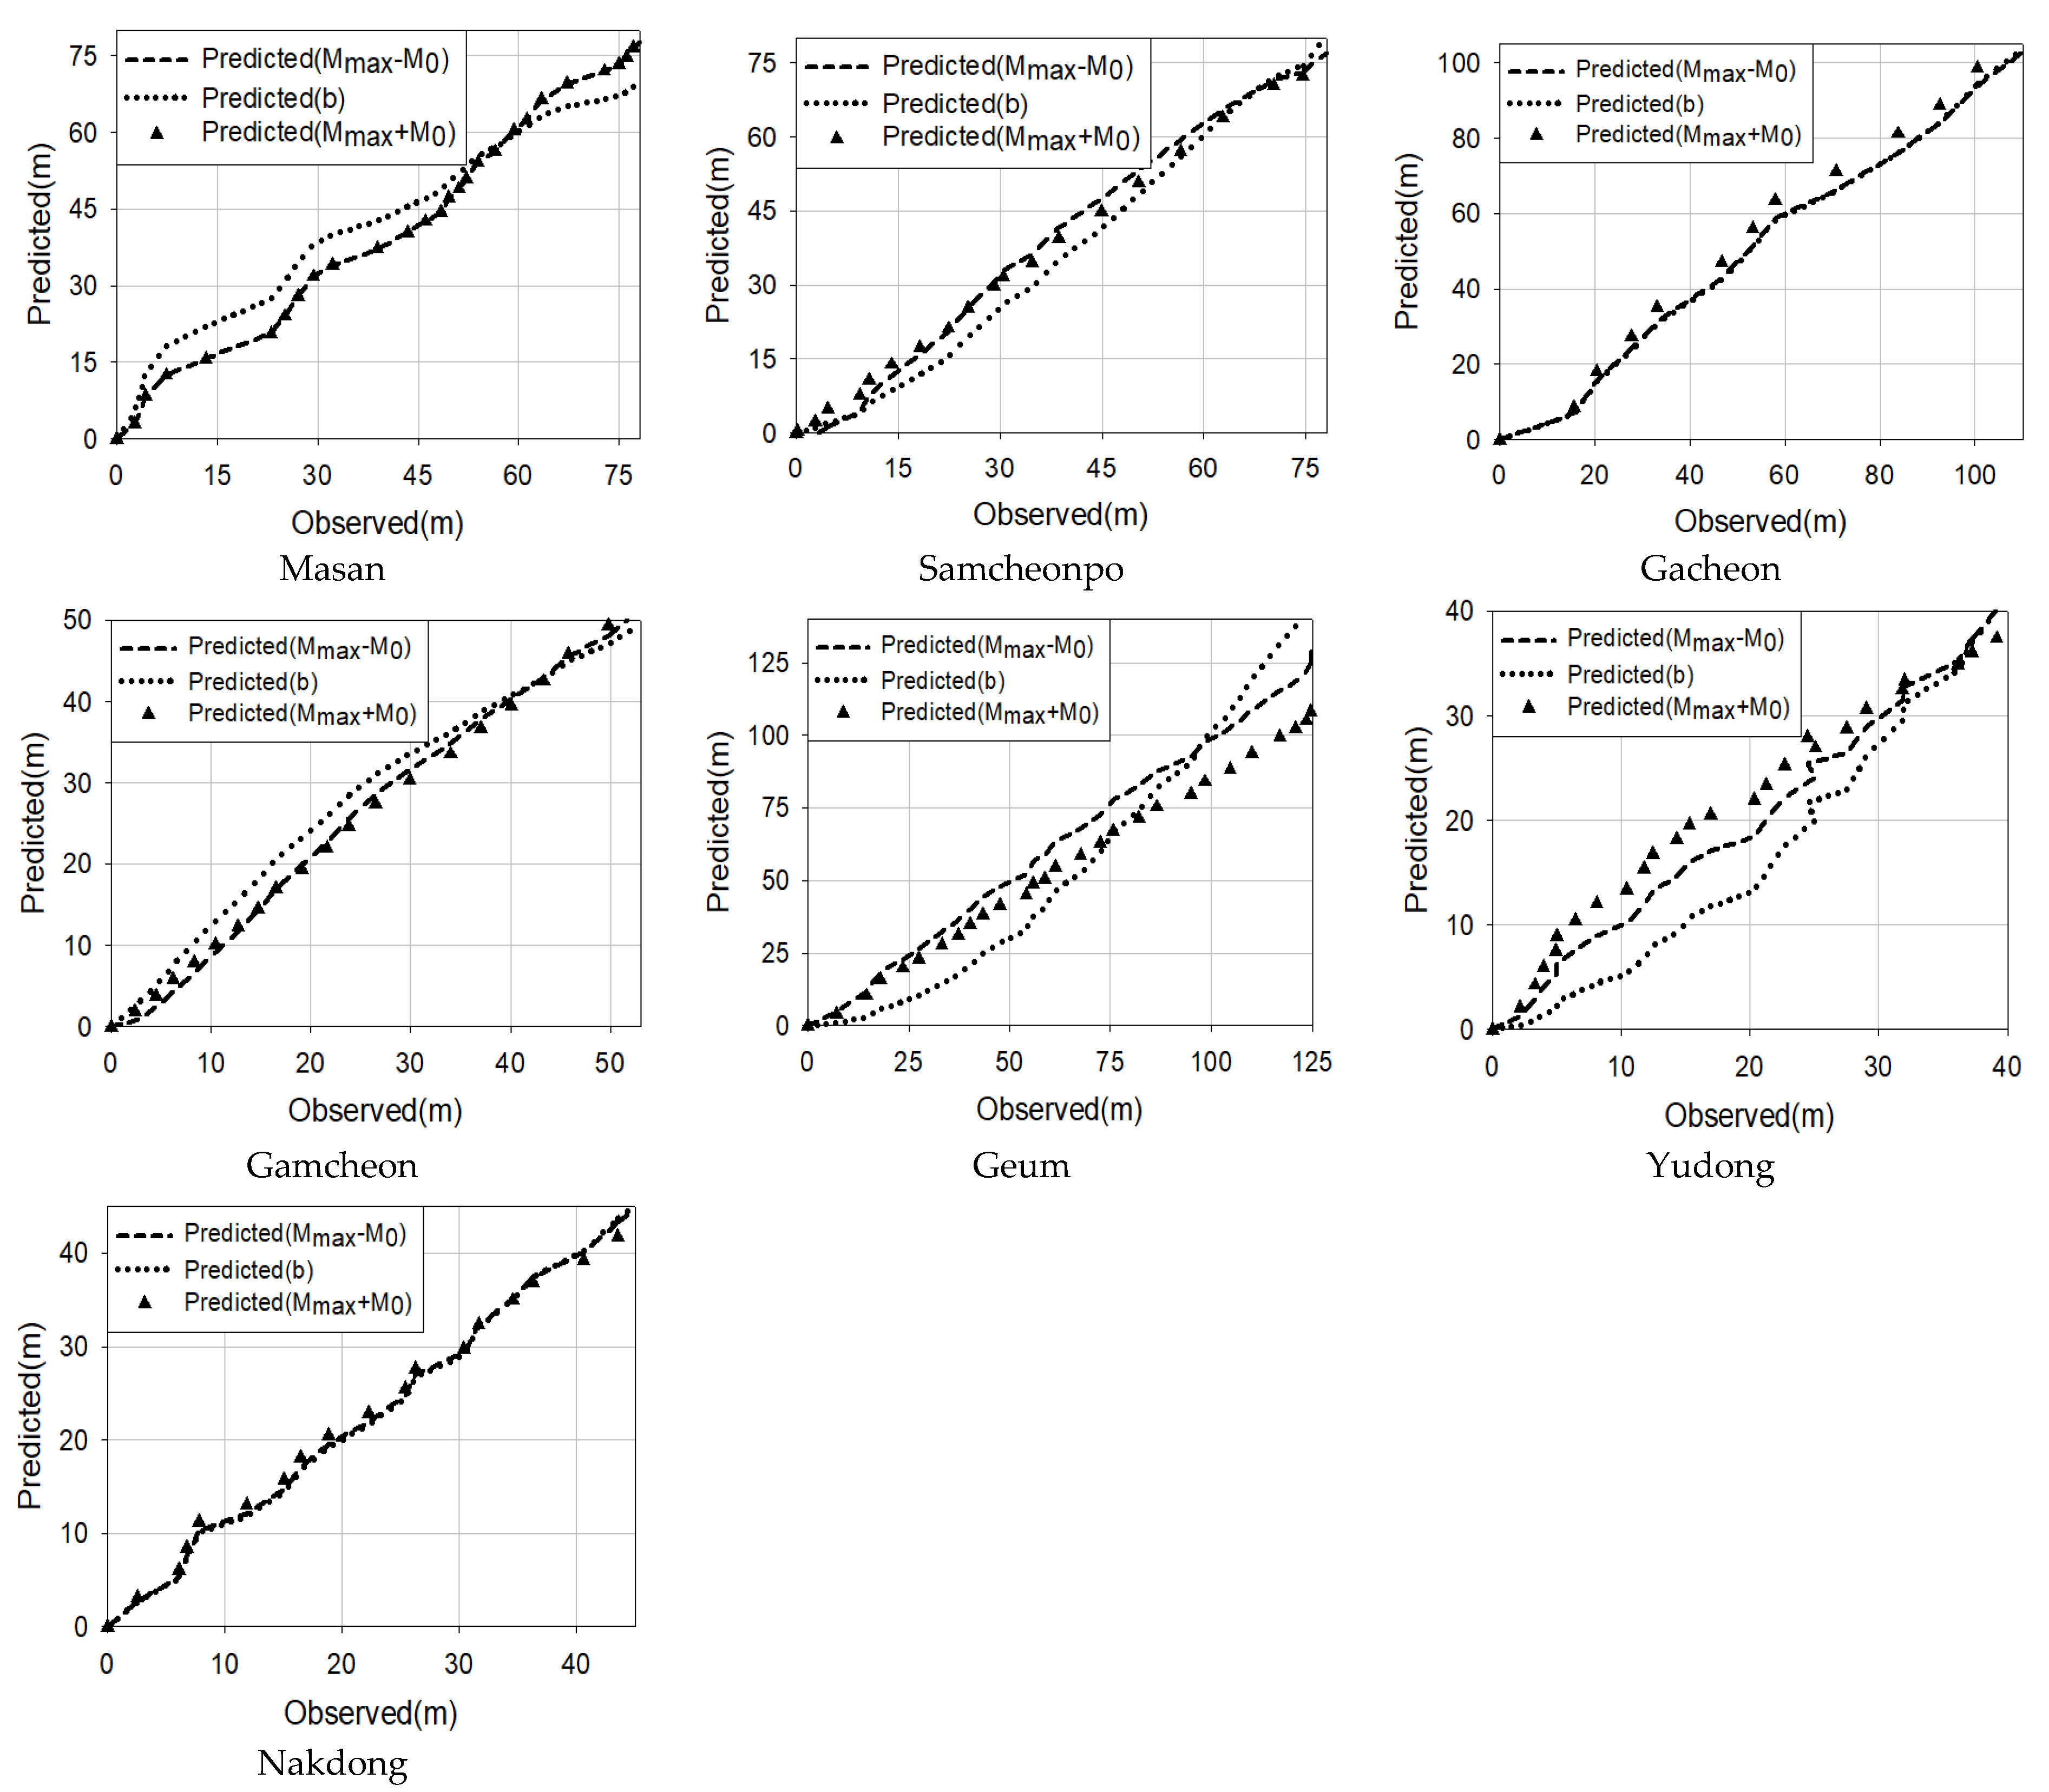
The parameters of the topological factors can be obtained through the measurement of the elevation of the river and the nonlinear regression of the suggested formula, respectively. The results are compared to the actual measurement of the river’s longitudinal elevation calculated using the equation, and the accuracy of the prediction is evaluated using R2. Figure 2 shows the comparison for each method. Table 4 shows the accuracy analysis comparison. Considering that the values of R2 were all above 0.80, the formula suggested in this paper was meaningful in calculating the river elevation and slope.
5. Conclusions
To date, many studies have analyzed rivers based on survey results, but there is the disadvantage that in the event of disasters, such as floods, in situations where measurement is impossible, many data cannot be obtained.
To resolve this, this study suggests obtaining the prediction formula of the river longitudinal section using information entropy theory. In addition, while existing studies have studied the river elevation with one parameter, in this study two parameters have been considered in order to calculate river characteristic factors more accurately than in conventional studies. In this study, information entropy theory was used to calculate the average slope, river slope, and river longitudinal elevation. Using the suggested river longitudinal elevation equation, parameters representing river characteristics were determined based on the average slope and river longitudinal section in the basin.
- (1)
- The verification of the accuracy of the equation in this paper is based on the nonlinear regression analysis with SPSS 26 and SYSTAT 6.0. The value is 0.8150 to 0.9950. The values show that the equation is valid, and the application to actual rivers is considered significant.
- (2)
- Gacheon river shows the highest accuracy of prediction (close to 0.99) out of all methods. Yoodong river has parts that do not increase monotonically, and all three methods predict that singularity similarly. The suggested formulae are able to predict the section where the slope changes are large.
- (3)
- Since Mmax and M0 are parameters of the river, once the parameter is calculated the longitudinal section of the river can be obtained before it is destroyed. The reliability of this method can be further enhanced by using the data measured over 40 years or over 100 years.
- (4)
- When making calculations using the equation presented in this study, it is easy to calculate the slope and elevation at a random point in the river basin.
- (5)
- It is expected that one use the river longitudinal section obtained through the equation to restore damaged rivers to their longitudinal elevations and ramps before development.
- (6)
- Using the method proposed in this paper, the river elevation can be obtained more accurately, which can help more precisely in the production of a digital elevation model or modify the data in places where it is hard to measure.
Author Contributions
Y.-M.C. and I.-T.A. conceptualized the research. Y.-M.C., J.-M.K. and I.-T.A. carried out the investigation. Y.-M.C. wrote the manuscript. I.-T.A. conceived the methodology of the proposed method. All authors have read and agreed to the published version of the manuscript.
Funding
This research was funded by the Institute of Industrial Technology, Pusan National University.
Acknowledgments
This research was supported by Institute of Industrial Technology, Pusan National University.
Conflicts of Interest
The authors declare no conflict of interest.
References
- Han, S.M.; Park, T.S. The comparative analysis of LiDAR data and actual measurement data. J. Korea Soc. Geospat. Inf. Syst. 2009, 72–77. [Google Scholar] [CrossRef]
- Lienhard, J.H. A Statistical Mechanical Prediction of the Dimensionless Unit Hydrograph. J. Geophys. Res. 1964, 24, 5231–5238. [Google Scholar] [CrossRef]
- Wilson, G. The use of the concept of entropy in system modeling. J. Oper. Res. Soc. 1970, 21, 247–265. [Google Scholar] [CrossRef]
- Leopold, L.B.; Langbein, W.B. The Concept of Entropy in Landscape Evolution; U.S Government Printing Office: Washington, DC, USA, 1962. [CrossRef]
- Yang, T. Potential Energy and Stream Morphology. Water Resour. Res. 1971, 7, 311–322. [Google Scholar] [CrossRef]
- Singh, V.P.; Fiorentino, M. A historical perspective of entropy application in water resources. Entropy Energy Dissipation Water Resour. 1992, 21–61. [Google Scholar] [CrossRef]
- Chapman, T.G. Entropy as measure of hydrologic data uncertainty and model performance. J. Hydrol. 1986, 85, 111–126. [Google Scholar] [CrossRef]
- Chiu, L. Entropy and probability concepts in hydraulics. J. Hydraul. Eng. 1987, 113, 583–600. [Google Scholar] [CrossRef]
- Chiu, L. Entropy and 2-D velocity distribution in open channels. J. Hydraul. Eng. 1988, 114, 738–756. [Google Scholar] [CrossRef]
- Chiu, C.L. Velocity distribution in open channel flow. J. Hydraul. Eng. 1989, 115, 576–594. [Google Scholar] [CrossRef]
- Fiorentino, M.; Claps, P.; Singh, V.P. An Entropy-based Morphological Analysis of River Basin Networks. Water Resour. Res. 1993, 29, 1215–1224. [Google Scholar] [CrossRef] [Green Version]
- Claps, P.; Fiorentino, M.; Oilveto, G. Informational entropy of fractal river networks. J. Hydrol. 1996, 187, 145–156. [Google Scholar] [CrossRef] [Green Version]
- Mirauda, D.; Pannone, M.; de Vincenzo, A. An entropic model for the assessment of stream-wise velocity dip in wide open channels. Entropy 2018, 20, 69. [Google Scholar] [CrossRef] [PubMed] [Green Version]
- Kundu, S. Prediction of velocity-dip-position at the central section of open channels using entropy theory. J. Appl. Fluid Mech. 2017, 10, 221–229. [Google Scholar] [CrossRef]
Figure 1.
River longitudinal section elevation (starting from z = 0).

Figure 2.
River longitudinal elevation.


Table 1.
River slopes and lengths.
| River | Length (km) | ||
|---|---|---|---|
| Masan | 18.57 (entire) | ||
| Samcheonpo | 7 (entire) | ||
| Gacheon | 21.19 (entire) | ||
| Gamcheon | 13.13 (entire) | ||
| Geum | 3.25 (entire) | ||
| Yudong | 11.31 (entire) | ||
| Nakdong | 21.42 (selected) |
Table 2.
Parameter by each method.
| River | b | ||||
|---|---|---|---|---|---|
| Masan | −44.778 | −8.481 | −53.336 | −8.481 | −104.898 |
| Samcheonpo | −1311.532 | −708.388 | −2.056 | 3.428 | −5.911 |
| Gacheon | −48.3386 | −21.8701 | −21.2442 | −47.2009 | −602.821 |
| Gamcheon | 1 | 0.9944 | −24.804 | 5.113 | −88,000 |
| Geum | −2.6198 | −101.655 | −2.6195 | −13.8264 | −456.546 |
| Yudong | −15.179 | −9.616 | −2.517 | −8.917 | 39.952 |
| Nakdong | −155.335 | −20.034 | −11.929 | −91.464 | −2458.048 |
Table 3.
Mean slope comparison between the measured and the predicted values.
| River | Measured | Predicted | ||
|---|---|---|---|---|
| b | ||||
| Masan | 0.01818 | 0.022464 | 0.022648 | 0.019296 |
| Samcheonpo | 0.054015 | 0.05124 | 0.194054 | 0.054411 |
| Gacheon | 0.015634 | 0.015098 | 0.01483 | 0.014972 |
| Gamcheon | 0.001508 | 0.001588 | 0.001247 | 0.001284 |
| Geum | 0.001591 | 0.001052 | 0.000876 | 0.001145 |
| Yudong | 0.003771 | 0.002601 | 0.002624 | 0.002942 |
| Nakdong | 0.028358 | 0.003568 | 0.00355 | 0.003488 |
Table 4.
Accuracy analysis results.
| River | b | |||||
|---|---|---|---|---|---|---|
| R2 | RMSE | R2 | RMSE | R2 | RMSE | |
| Masan | 0.987 | 2.153 | 0.987 | 2.153 | 0.938 | 5.883 |
| Samcheonpo | 0.94 | 0.828 | 0.991 | 2.72 | 0.979 | 4.175 |
| Gacheon | 0.995 | 2.794 | 0.987 | 4.908 | 0.987 | 5.142 |
| Gamcheon | 0.998 | 0.549 | 0.992 | 1.321 | 0.966 | 2.862 |
| Geum | 0.998 | 10.821 | 0.955 | 1.605 | 0.815 | 15.775 |
| Yoodong | 0.995 | 2.687 | 0.949 | 0.822 | 0.94 | 3.831 |
| Nakdong | 0.993 | 1.369 | 0.995 | 0.834 | 0.994 | 0.801 |
Publisher’s Note: MDPI stays neutral with regard to jurisdictional claims in published maps and institutional affiliations. |
© 2021 by the authors. Licensee MDPI, Basel, Switzerland. This article is an open access article distributed under the terms and conditions of the Creative Commons Attribution (CC BY) license (https://creativecommons.org/licenses/by/4.0/).
Share and Cite
MDPI and ACS Style
Choo, Y.-M.; Kim, J.-M.; An, I.-T. Research on the Longitudinal Section of River Restoration Using Probabilistic Theory. Entropy 2021, 23, 965. https://doi.org/10.3390/e23080965
AMA Style
Choo Y-M, Kim J-M, An I-T. Research on the Longitudinal Section of River Restoration Using Probabilistic Theory. Entropy. 2021; 23(8):965. https://doi.org/10.3390/e23080965
Chicago/Turabian StyleChoo, Yeon-Moon, Ji-Min Kim, and Ik-Tae An. 2021. "Research on the Longitudinal Section of River Restoration Using Probabilistic Theory" Entropy 23, no. 8: 965. https://doi.org/10.3390/e23080965
Note that from the first issue of 2016, this journal uses article numbers instead of page numbers. See further details here.