
Bibliometric Analysis of the Literature on Measuring Techniques for Manipulating Financial Statements


1
Faculty of Economics and Business Management, Cluj-Napoca University Babes-Bolyai, 400591 Cluj-Napoca, Romania
2
Faculty of Economic Engineering and Business, Technical University of Moldova, 2004 Chisinau, Moldova
*
Author to whom correspondence should be addressed.
Risks 2021, 9(7), 123; https://doi.org/10.3390/risks9070123
Submission received: 26 April 2021
/
Revised: 25 May 2021
/
Accepted: 16 June 2021
/
Published: 1 July 2021
(This article belongs to the Special Issue Economic and Financial Crimes)
Abstract
:Creative accounting has its background since early studies in 1975, until the present time. It continues to be a subject of great interest for the companies and interested parties. Thus, the current paper will aim to answer the following proposed research questions: 1. Which are the most used methods for detecting the manipulation of financial statements in the literature? 2. Which are the terms that are most frequently encountered in the literature associated with “creative accounting? 3. Which are the journals that have the highest frequency of articles written on the topic “creative accounting”? 4. Over time, how did research evolve in the field of creative accounting? 5. Which countries are most preoccupied in publishing regarding this topic? To answer the research question 1, the models published in the literature for measuring manipulation techniques through creative accounting were reviewed and analyzed. For the remaining research questions, a bibliometric analysis for the publications in this area was performed. For collecting the sample, articles on this topic were selected from the international Web of Science database. Following this, a bibliometric analysis of the articles was performed, using the VOSviewer program. A total of 4045 publications on creative accounting were identified. Through the bibliometric analysis we have answered research question 2, by identifying the key words that have the closest proximity to creative accounting. To answer the remaining research questions, we identified the journals with the highest frequency of publication and the countries with the highest interest on the topic. It is especially important to evaluate the quality of this many research papers and to obtain valuable information.
1. Introduction
For the conducted study, we chose to research a topic that is of interest both domestically and internationally. Through the literature we found many studies based on the companies that were on the verge of bankruptcy, using the concept for a long time. The accounting phenomenon occurs as a result of legislative gaps, which gives professionals the opportunity to “create” what they want to have in their financial statements. Previous studies show that the manipulation is done by those who prepare the financial statements. They can judge the situations by filtering the perception of the professional.
Once the professionals have a closer look on the financial statements, indicators can be calculated and red flags outlined in the case of financial fraud. The elements included in the financial statements, and those that can be manipulated, are incomes and expenses, part of the profit and loss account, assets and liabilities, and other elements such as equity; with these manipulations, a favorable image of the companies is presented (Achim and Borlea 2020).
Users of financial information pursue their own interests. Creative accounting gives those who prepare the financial statements the “freedom” to manipulate the numbers in the way that their users want to see (Groșanu 2013). Watts and Zimmerman (1978, 1986, 1990) approach the concept in a positive manner, especially in the conducted work on the bankruptcy issue.
The current economic and technological context is considered to be a complex, insecure one, due to the impossibility to identify the interdependencies between the elements of the financial statements (Alzard and Sépari 2001). The economic environment is going from simple and slightly variable to a complex one under the sign of top technologies, becoming dynamic, complex, and increasingly difficult to control. These changes have led to the redefinition of companies’ objectives, by setting the following new objectives that respond to current events: increasing quality, productivity, flexibility, and profit.
Economic companies need to have current financial information to carry out the activity and to meet the needs of shareholders, by maximizing profit, and to ensure a good approach in the activities undertaken, and to try to avoid the risks they face as much as possible. Exposing this information offers competitive advantages to companies in the market. Financial statements are used for both businesses and companies, and for users of financial information, such as managers, the state, suppliers, employees, customers, banks, potential investors, and shareholders. The main purpose of the information contained in the financial statements is to be intelligible to all who read them (Lau et al. 2013).
The economic and social environment of a company affects its strategy. These elements can be concretized in the following two concepts: culture and environment. There is ample evidence in the literature that these goals differ from country to country, and from culture to culture.
With the process of globalization, economic activity has been continuously developing, followed by the establishment of international economic relations, but this development of relations has led to inconsistencies in financial statements. To avoid such discrepancies, the European Union has implemented the standards international financial reporting system (IFRS) for all participating countries, as provided by the provisions Regulation (EC) No. 1.606/2002 of the European Parliament and of the Council of 19 July 2002. This implementation helps to standardize the financial statements. These are becoming comparable as follows: bi-accounting chain, profit and loss account, explanatory notes, etc.
The following five research questions were proposed to be answered for the current study:
- Research question 1: which are the most used methods for detecting the manipulation of financial statements in the literature?
- Research question 2: which are the terms that are most frequently encountered in the literature associated with “creative accounting”?
- Research question 3: which are the journals that have the highest frequency of articles written on the topic “creative accounting”?
- Research question 4: over time, how did research evolve in the field of creative accounting?
- Research question 5: which countries are most preoccupied in publishing regarding this topic?
This paper follows the following organization: The literature review, in which the existing literature is presented, which refers both to the theoretical part and to the practical part of the manipulation detection models. The “Materials and Methods” section describes the working techniques and how to work with the data. The “Results and Discussions” present what we obtained from the research. In the end we focused on the “Conclusions”, through these we tried to highlight what is most important, but we also drew the main research limits.
2. Literature Review
Creative accounting is not a new notion at all; this type of practice has been discussed since the Anglo-Saxon period. The concept is very complex and nuanced. In the literature, creative accounting is presented by almost all authors as having negative values on the economic environment, due to the fact that it helps the economic participants to manipulate financial statements. This can be perceived as the process by which managers use certain gaps or ambiguities within the accounting rules, with the goal of distorting information, making the company look more attractive (Shah 1988). Naser (1993) emphasizes, through his definitions, the dual character of this concept. On the one hand, his requests emphasize the fact that when there are gaps, manipulations of accounting figures occur, leading to the extreme flexibility and transformation of financial statements from what they should be to what managers exceptionally want. Another point of view is that even their structure allows the production of the desired result (Naser 1993).
The dual character of the notion is highlighted by many researchers in the field. Malciu (1999) claims that “creative accounting” can be defined by “using professional judgment in order to solve problems for which there are no, at least for now, accounting standards”, but also maintains “financial engineering techniques are applied depending on the impact on the financial situation and performance of the enterprise”.
Tarba and Rusu (2011) state that “creative accounting” describes accounting practices that derive from regulated accounting standards, explained by complex accounting creation techniques. In this process, the goal is to change the real state of a company in the desired direction. In the same way, Lambert (1984) mentions that by applying creative accounting, financial statements are presented incorrectly, and it aims at deception and manipulation. On the same note, Ian Griffiths (1986) stated that “Every company in the country earns its profits. Each set of published accounts is based on books that have been lightly cooked or completely fried. The figures, which are sent twice a year to the investing public, have been changed to protect the guilty. It is the biggest trick since the Trojan horse: It’s all legitimate. It’s creative accounting”.
Kamal Naser has an academic opinion on creative accounting, mentioning that this is the way to turn the figures from what they should be to what their management wants, this being circumvented by the existing rules and/or ignoring them completely or partially (Oriol et al. 1999).
Creative accounting is considered to exclude fraud. It is not considered illegal because it operates under the regulatory system. Various studies state that companies that aim to use this accounting do not break the law, but only use the shortcomings of accounting to serve their own interests (Jones 2010).
The use of creative accounting, and some fraudulent actions, is practiced when a company is in a difficult financial period (Sabau et al. 2020).
From our perspective, creative accounting has both positive and negative aspects. Accounting options have always been available to the person preparing the financial statements, as they do not involve creativity in the negative.
Therefore, books and articles in this field present the opinions of specialists and the perspectives of this practice. The term in the literature has been assigned different definitions, the basic effect of accounting manipulation is the same.
Given that the situation of companies does not always live up to expectations, there are temptations to use creative accounting, by recording sales much higher than the real ones, so that the results rise to at least half of the expectations of managers (Bilgin and Hakan 2019). Globally, “creative accounting” is referred to in several ways, depending on the country in which the phrase is used, as shown in Table 1.
“Creative accounting” appears in many languages and has a high level of citation, both in the literature and in the media, depending on the country in which it is used. The term “creative accounting” is widely appreciated in many countries, and is constantly used to design unfair practices, becoming synonymous with earnings management, manipulation, and fraud.
Most likely, the term “creative accounting”, translated into different languages and now widely used in many countries, comes from English. It can even be found in publications from the early 1975s, including works dealing with corporate bankruptcy.
Argenti (1976) argues that “creative accounting is a political intent followed by managers to deceive shareholders, creditors and themselves about the wealth and progress of the company in general and its financial difficulties in particular” (Argenti 1976).
In the following, we will present a brief analysis of the models for the identification and measurement of creative accounting and financial fraud found in the literature.
2.1. Beneish M-Score Model
The Beneish M-score was first developed in 1999 by Professor M. Daniel Beneish, a professor of accounting at the Kelley School of Business at Indiana University Bloomington, in a paper entitled “The Detection of Earnings Manipulation”. The basic theory from which Professor Beneish starts in the development of the model is that companies could be likely to manipulate their profits if they show damaged gross margins, significantly increased expenses, and last, but not least, the increase in sales. The model consists of eight indicators that identify anomalies in the financial statements that may be the result of the manipulation of earnings or other fraudulent types.
In his paper, Beneish found that he can correctly identify 76% of manipulators earnings. Beneish also found that 17.5% of companies whose situations were financial believed that they were fair and that they were free to manipulate their earnings, and they republished the financial statements later because of these manipulationsbecause of these manipul (Beneish, 1999).
Financial auditors consider that the correct identification percentage ensures that the information provided by the calculation of the score is reliable in terms of financial statements.
An M score higher than −2.22 suggests a higher probability of manipulating financial statements.
This model is considered a tool that helps the financial specialist not only by the fact that it offers the possibility of an overall analysis of the financial statements, but even by calculating each component of the model providing a specific control, by measuring the changes that occur from one period to another, regardless of the frequency of publication of the financial statements.
The formula of the Beneish M-score model is as follows:
where DSRP—days’ sales in a receivable index; GMI—gross margin index; AQI—asset quality index; SGI—sales growth index; DI or DEPI—depreciation index; SGAI or SGAEI—sales index, general and administrative expenses; TATA—total accruals to total assets; LI—leverage index (Sabau et al. 2020).
M-Scor = −4.84 + 0.92 × DSRI + 0.528 × GMI + 0.404 × AQI + 0.892 × SGI +0.115 × DEPI
0.172 × SGAI + 4.679 × TATA − 0.327 × LI
0.172 × SGAI + 4.679 × TATA − 0.327 × LI
2.2. Modelul Vladu
Another important score is the one obtained by Vladu et al. (2016), in the work “Truthfulness in Accounting: How to Discriminate Accounting Manipulators from Non-manipulators” (Vladu et al. 2016). The basic theory from which Vladu starts is that of dividing society into two categories of manipulators and non-manipulators. In her study, she starts from the explanatory variables from the theory of accounting (Watts and Zimmerman 1986) and from the researches of accumulations (Healy 1985; Jones 1991; Dechow and Skinner 2000) and Schilit (2010).
The model uses 12 independent variables to determine whether society is manipulative or non-manipulative.
The model contains the following variables: receivables index (RI); inventories index (II); gross margin index (GMI); sales growth (SG); depreciation index (DI); discretionary expenses index (DEI); leverage index (LI1); leverage index (LI2); asset quality (AQ); index—increase in net income (CFO1); index—increase income d standardized on total assets (CFO2); and sales index (SI) (Vladu et al. 2016). Thus, the MANOVA technique was used to select those arrangements that have the greatest discriminatory power. The MANOVA technique assumes that the sample came from two possible groups, manipulative and nonmanipulative, in which each observation has different variables (accounting reports).
2.3. Q Test Model
The Q-test model is the model developed by Putman et al. (2005), who proposed that the Q test an easy-to-use model for quantifying the quality of earnings, which consists of five financial statements, using in their calculation financial data from the financial statements. The variables of the Q test are as follows: cash flow from operating activities, sales revenue for the accounting period and the previous period accounts receivable for the accounting period and the previous period, income before interest and taxes, income from continuing operations, net income, and total liabilities (Putman et al. 2005).
In this model, each ratio is weighted by (0.2), having an equal “weight”. This equality of “weight” suggests that the ratios in the model have the same impact on the outcome. The value that indicates one or greater indicates a higher quality of revenue, but that less than one indicates revenue management.
The model of Putman et al. (2005) is presented as follows:
where CFO—cash flow from operating activities cash flow statement; S—sales income statement; IS—increase in sales from the previous year’s income statement; IAR—increase in the accounts receivable balance sheet; EBIT—earnings before the interest and taxes income statement; COI—income from the continuing operations income statement; NI—net income income statement; TL—total liabilities balance sheet (Putman et al. 2005).
QTest = Q Test = 10(CFO/S) + (IS/IAR) + (CFO/EBIT) + (COI/NI) +10(CFO/TL)
2.4. Piotroski F-Score Model (F-Score)
The Piotroski F-score was developed by accounting professor Joseph Piotroski at theUniversity of Chicago, through his work “The Use of Historical Financial Statements Information to Separate Winners from Losers” (Piotroski 2002). The model is based on nine criteria forassessing the financial strength of the business, based entirely on the leverage of profitability, liquidity, sources of funds, and operational efficiency.
The aim of his research was to develop a model based on financial information, which would create a stronger portfolio of values, and that could have distinct performances from possible underperformances. The model is applied at the level of the financial statements of private companies as well as at the level of state-owned companies, leading to a standardization of the analysis for those who make financial analyses (financial analyst, auditor, etc.).
Based on his research, Piotroski carried out a simple analysis consisting of several stages, namely, nine, which indicate scores that may suggest a possible manipulation of the company’s overall financial situation as “hesitant” versus “energetic”.
where the following definitions apply:
F_SCORE = F_ROA + F_∆ROA + F_CFO + F_ ACCRUAL + F_∆MARGIN + F_∆TURN +
F_∆LEVER + F_∆LIQUID + EQ_OFFER
F_∆LEVER + F_∆LIQUID + EQ_OFFER
- ROA—net income before extraordinary items, for the fiscal year preceding portfolio formation, scaled by the total assets at the beginning of year t;
- CFO—cash flow from operations, scaled by the total assets at the beginning of year t;
- MARGIN—cross margin (net sales, less cost of goods sold) for the year preceding portfolio formation;
- TURN—change in the firm’s asset turnover ratio between the end of year t and year t−1. The asset turnover ratio is defined as the net sales scaled by the average total assets for the year;
- LEVER—change in the firm’s debt-to-assets ratio between the end of year t and year t−1. The debt-to-asset ratio is defined as the firm’s total long-term debt (including the portion of long-term debt classified as current) scaled by the average total assets;
- LIQUID—change in the firm’s current ratio between the end of year t and year t−1. The current ratio is defined as the total current assets divided by the total current liabilities;
- ACCRUAL—net income before extraordinary items, less cash flow from operations, scaled by the total assets at the beginning of year t;
- EQ_OFFER—book value of equity at the end of the fiscal year (Piotroski 2002).
2.5. Dechow–Dichev Model (Accumulation Quality)
This model was developed by the professors Patricia Dechow and Ilia Dichev (Dechow and Dichev 2002) in “The quality of accumulations and gains: the role of errors in estimating accumulation”, through which we have the possibility to measure the quality of the accumulations through the cash flow from the commitments and the profit result.
Through their research we are told that where there is a low quality of accumulation, there are more indications unrelated to cash flows compared to companies with a higher commitment quality.
They also identify certain behaviors in their research on quality accumulation, respectively, as follows: a longer operating cycle decreases the buildup quality, as opposed to a short-cycle operation, which increases the quality of accumulation; the size of the company affects the quality of the accumulation, the smaller companies have a quality of lower employment; instability in sales decreases the quality of accumulation; unpredictable cash flow decreases the quality of accumulation, as unstable receipts lead to reduced storage quality. The formula for the Dechow–Dichev model is as follows:
where the following applies:
Dechow-Dichev = (CFO + ∆ WC)/∆TA
- CFO—cash flow from operations;
- WC—working capital;
- TA—total assets.
2.6. Robu Model
The Robu model was developed by the researchers Ioan-Bogdan ROBU and Mihae-la-Alina ROBU (Robu and Robu 2013) in the paper entitled “Audit Procedures for Estimating the Fraud Risk Based on Indexes for Detection of Accounting Manipulation”. Starting from the research hypotheses based on the Beneish model, they used descrimination analysis, with the help of the classification score function of the Romanian companies.
where Z is the score associated with each firm (i), Xi are the independent variables, and βi are the coefficients of the model with (i = 1, …, n).
Z = β0 + β1 × 1 + β2 × 2 + … + βiXi + … + βn × n
The classification function is represented as a linear combination of the indices proposed by Beneish, and is of the following form: estimating the risk of fraud.
M-RiskFraud-Beneish = −0.383 × DSRI+ 0.039 x GMI − 0.325 × AQI + 0.448 × SGI + 0.273 × DEPI + 0.915 × SGAI + 0.478x LVGI − 0.153 × TATA
For the function of discrimination, M-RiskFraud-Beneish elaborated for Romania by Robu and Robu (2013), the following three intervals of classification of the companies by groups of risk were obtained:
The area without the risk of financial fraud is between −2.841 and −0.355—the uncertainty interval is between −0.355 and 0.313—which is also considered a gray area; here, we also have the appearance of the audit, by applying the procedures and this leads to mitigation
The risk of fraud is indicated by the interval between 0.313 and 2.453—various methods of distorting the true image are usually used here (Robu and Robu 2013).
The first research question was answered by identifying the most used model in the literature to identify the presence of data manipulation. For the remaining research questions, a bibliometric analysis is required. In the following chapters, the methodology and results will be presented for this issue (Robu and Robu 2013).
3. Materials and Methods
The bibliometric analysis is based on data extracted from publications, bibliographic references, citations, and authors. With the help of this information, we can examine the historical development between individual scientific fields and the discovery of relationships between disciplines (Noyons et al. 1999).
Previous research has focused on identifying the emerging areas using bibliometric analysis. These studies suggested the importance of citations regarding the published papers, in the sense that the choice of work is a significant indicator of the quality of the paper. The analysis of emerging domains is important for the discovery of new areas, not just the study of existing ones (Sasaki et al. 2020).
Through bibliometric analysis the information is selected from a qualitative point view, using mathematical statistical methods and descriptive statistical methods to obtain the results from the content of the paper. The source of information for the bibliometric analysis is the records found in databases such as Web of Science, which is an online database that provides access to the following citation indexes:
- Science Citation Index Expanded (SCI-E);
- Social Science Citation Index (SSCI);
- Arts & Humanities Citation Index (AHCI);
- Index Chemicus;
- Current Chemical Reaction;
- Conference Proceedings Citation Index—Science (CPCI-S);
- Conference Proceedings Citation Index—Social Sciences & Humanities (CPCI-SSH).
The current research has a great deal of importance, due to the conducted bibliometric analysis, which reveals the most and least approached topics correlated with creative accounting. The least used words correlated with creative accounting can reveal novel research questions. They can indicate a decreased level of published research on a certain area, with a great deal of increasing potential for future researches.
Our contribution to the literature is to identify the correlations and connections with the closest fields in the literature.
The presentation of the statistical methods used in the bibliometric analysis will be illustrated with the help of figures. The search terms applied to identify the nearest published papers include the keyword “creative accounting” on the Web of Science platform, for the period 1975–2021 According to the Table 2. The elements that were taken into account and extracted in text format are the documents that went through the selection filter, which are formed by the following: the year of publication of the paper, the language in which the manuscript was written, the journal where it was found, the title of the paper, the author, affiliation, the most common keywords, document type, abstract and number of citations. The choice of the sample was based on the selection based on the keywords in the papers. The main sample was extracted from WOS. We chose this database because only indexed works are included and besides this, we wanted to avoid the double inclusion of journals, citations, type of works (Staszkiewicz 2019). For example, a database such as Google Scholar allocates citations much faster and assigns all works not only indexed ones (Elleby and Ingwersen 2010). Most of the time, high-quality journals expose new papers, as opposed to those less recent papers with a higher frequency of publication, which are disseminated in lower-level journals. In their work, Elleby and Ingwersen (2010) presented the impact of low-quality and high-quality works with a high frequency of publication.
To conduct the bibliometric analysis, we have selected the sample from the WOS database, in order to identify the published articles on the topic of “creative accounting” for the period 1975 to 2021.
The query for the database was 1 March 2021. VOSviewer (version 1.6.16) was used to analyze co-author, co-occurrence, citation, bibliographic link, co-citations, keywords and themes. Applying attributes of standard importance, which are defined as “Link At-tribute” and “Total Link Power Attribute”.
4. Results and Discussions
4.1. In Order to Answer the Research Question 2, 3, 4 and 5 a Bibliometric Analyze Was Conducted
4.1.1. Bibliometric Analysis of Publication Output
In total, we identified 4045 publications on creative accounting in the WOS database between 1975 and 2021, which included research articles, procedural papers, reviews, books, and early access. Of these, 3203 were published in 2010–2021, and the rest were published in 1975–2009. Almost all the publications were written in English (3895), followed by 150 publications in Chinese, and the rest in other languages.
To answer research question number two, we chose to present a bibliometric map constructed with the use of the VOSview, and the WordClouds program. We believe that it is very useful to identify these terms, so that future researchers will have an overview of the associations.
4.1.2. Bibliometric Analysis of the Keywords
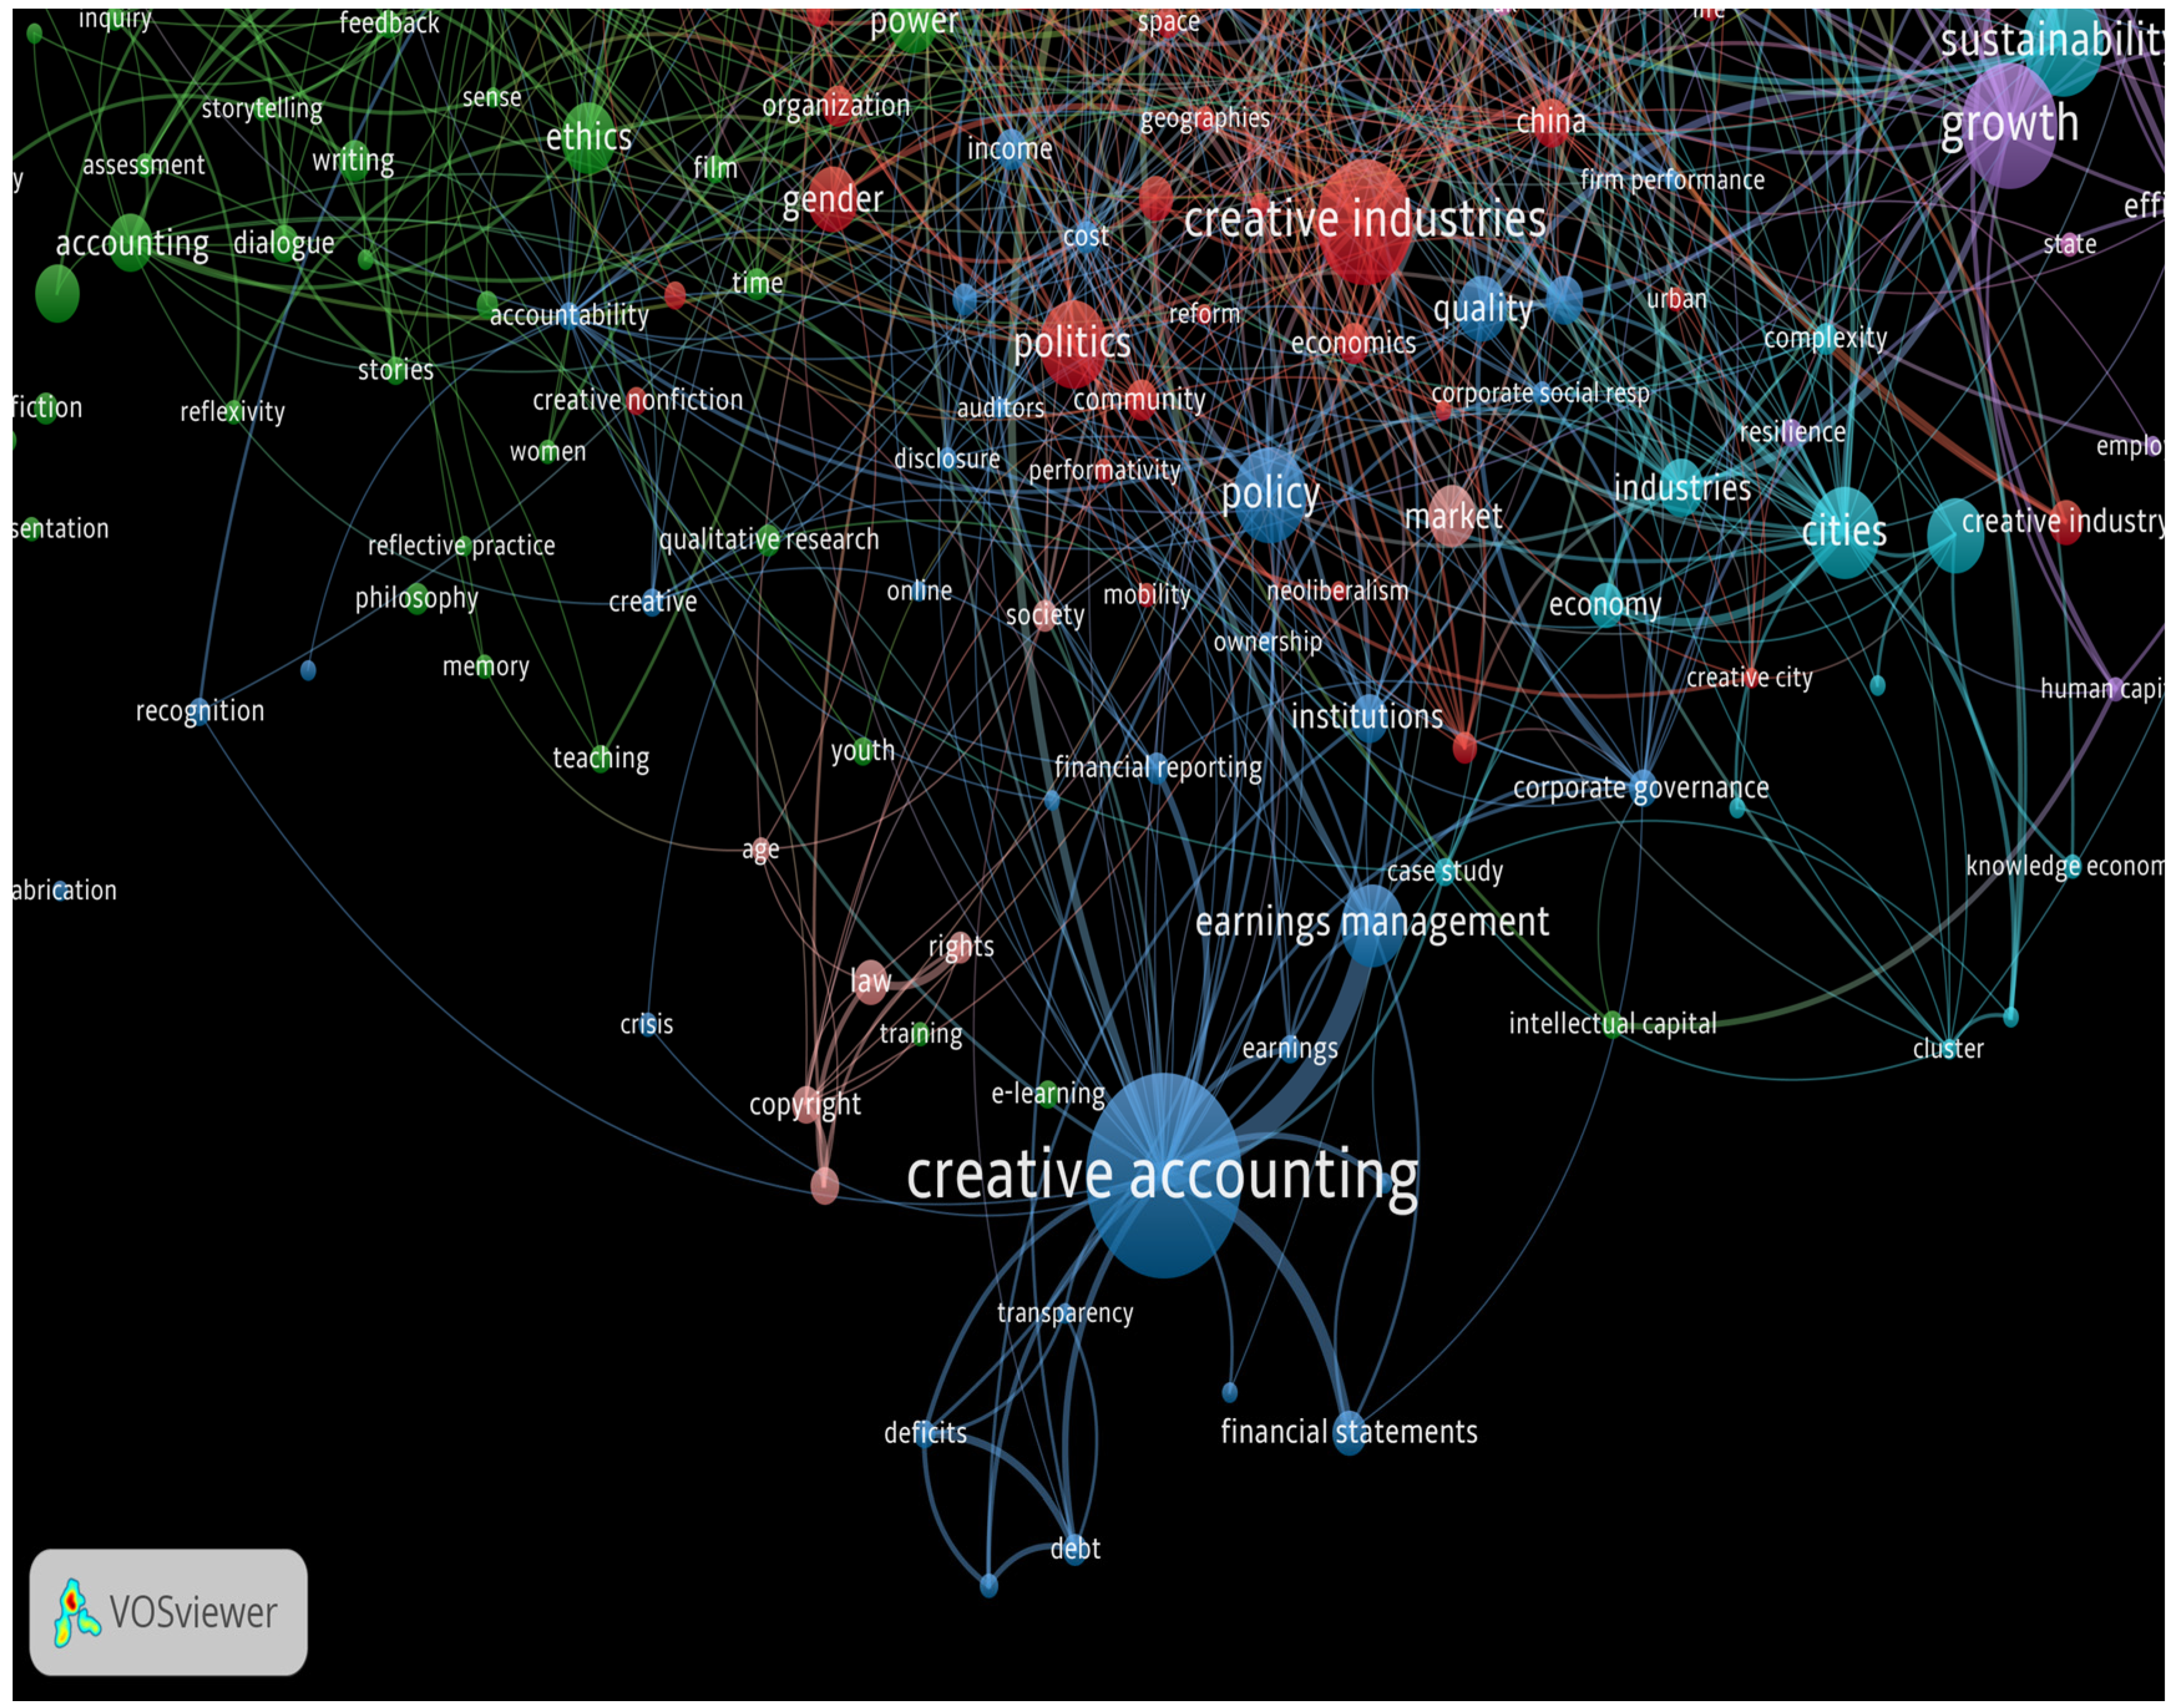
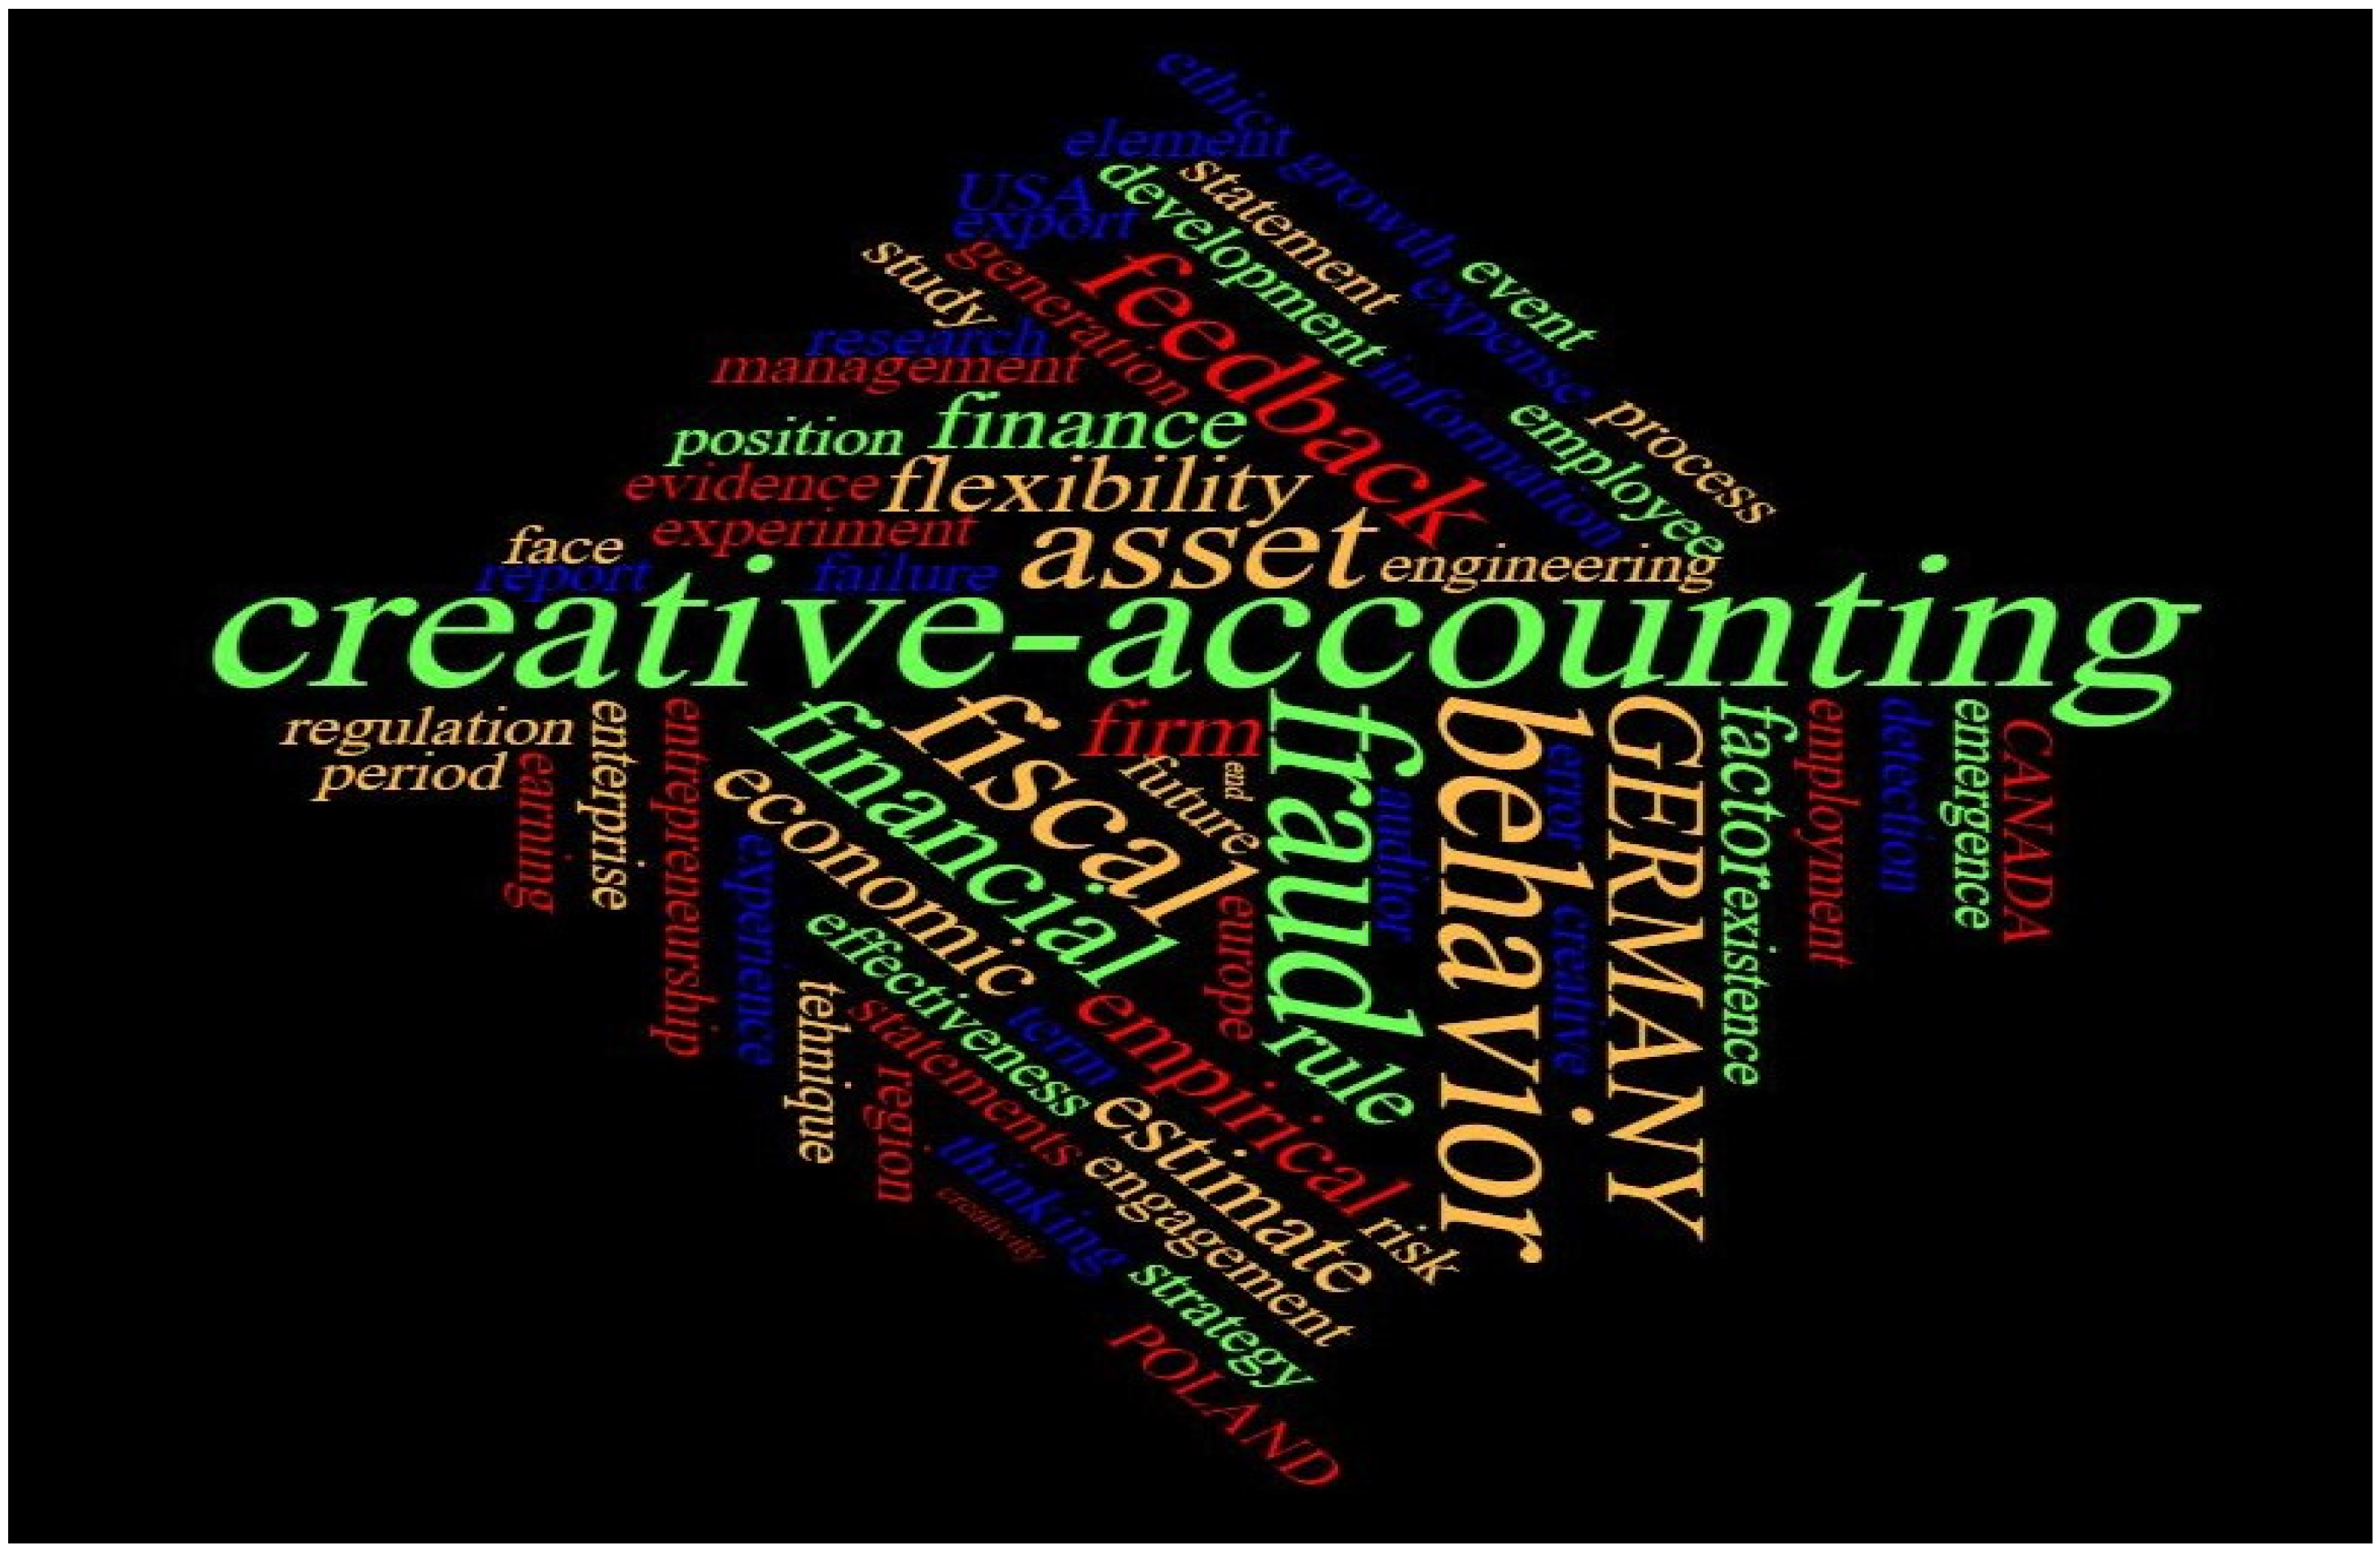
The keywords given by the authors of the papers and with an appearance more than five times in the basic WOS database were selected for the final analysis. The most common keywords were “creative accounting”, which had a strong link to “quality”, “management gain” and “financial statements”. As comparisons between creative accounting and fraud were two other keywords, the total power of the link between them is shown in Figure 1. In addition, a cloud of words was created that was more than 10 times apart, with “creative accounting” being the most common, followed by, “Handling” and “financial statements” (Figure 2).
Figure 1 and Figure 2 of the scientific maps represent a visualization of the clusters of publications in which the keywords from which the articles were searched are found. Keyword analysis helps the author to obtain information about factors related to the problem of creative accounting. The size of the dot represents the importance, so the larger the dot, the more important it is. The color of the dot indicates the cluster to which the keyword belongs. The correlation between the keyword and the other terms is re-reflected by the distance between the circles. The closer the keyword is to the terms, the stronger the relationship. We can see that the group of keywords of revenue management also includes words such as “accounting standards”, “society”, and “audit”. Around the keywords “creative accounting”, we also find terms such as creativity, effects, taxation, management, wealth accounting, finance, financial statements, etc.
In Figure 3 we can notice the map created with the help of the WordClouds program, in which we transposed the 70 keywords that appeared more than 10 times. Font size is the frequency of occurrence. Keywords such as ‘creative accounting’, ‘finance’ and ‘fraud’ were the most common. “Event” and “values” were rare.
With the help of bibliometric analysis of the citations and publications, we focus our attention on the third and fourth research questions—which are the journals that have the highest frequency of articles written on the topic “creative accounting”? Over time, how did research evolve in the field of creative accounting? We can see an increased interest in this topic from the evolution of the number of citations and the frequency of published papers over time.
4.1.3. Bibliometric Analysis of the Citations and Publications
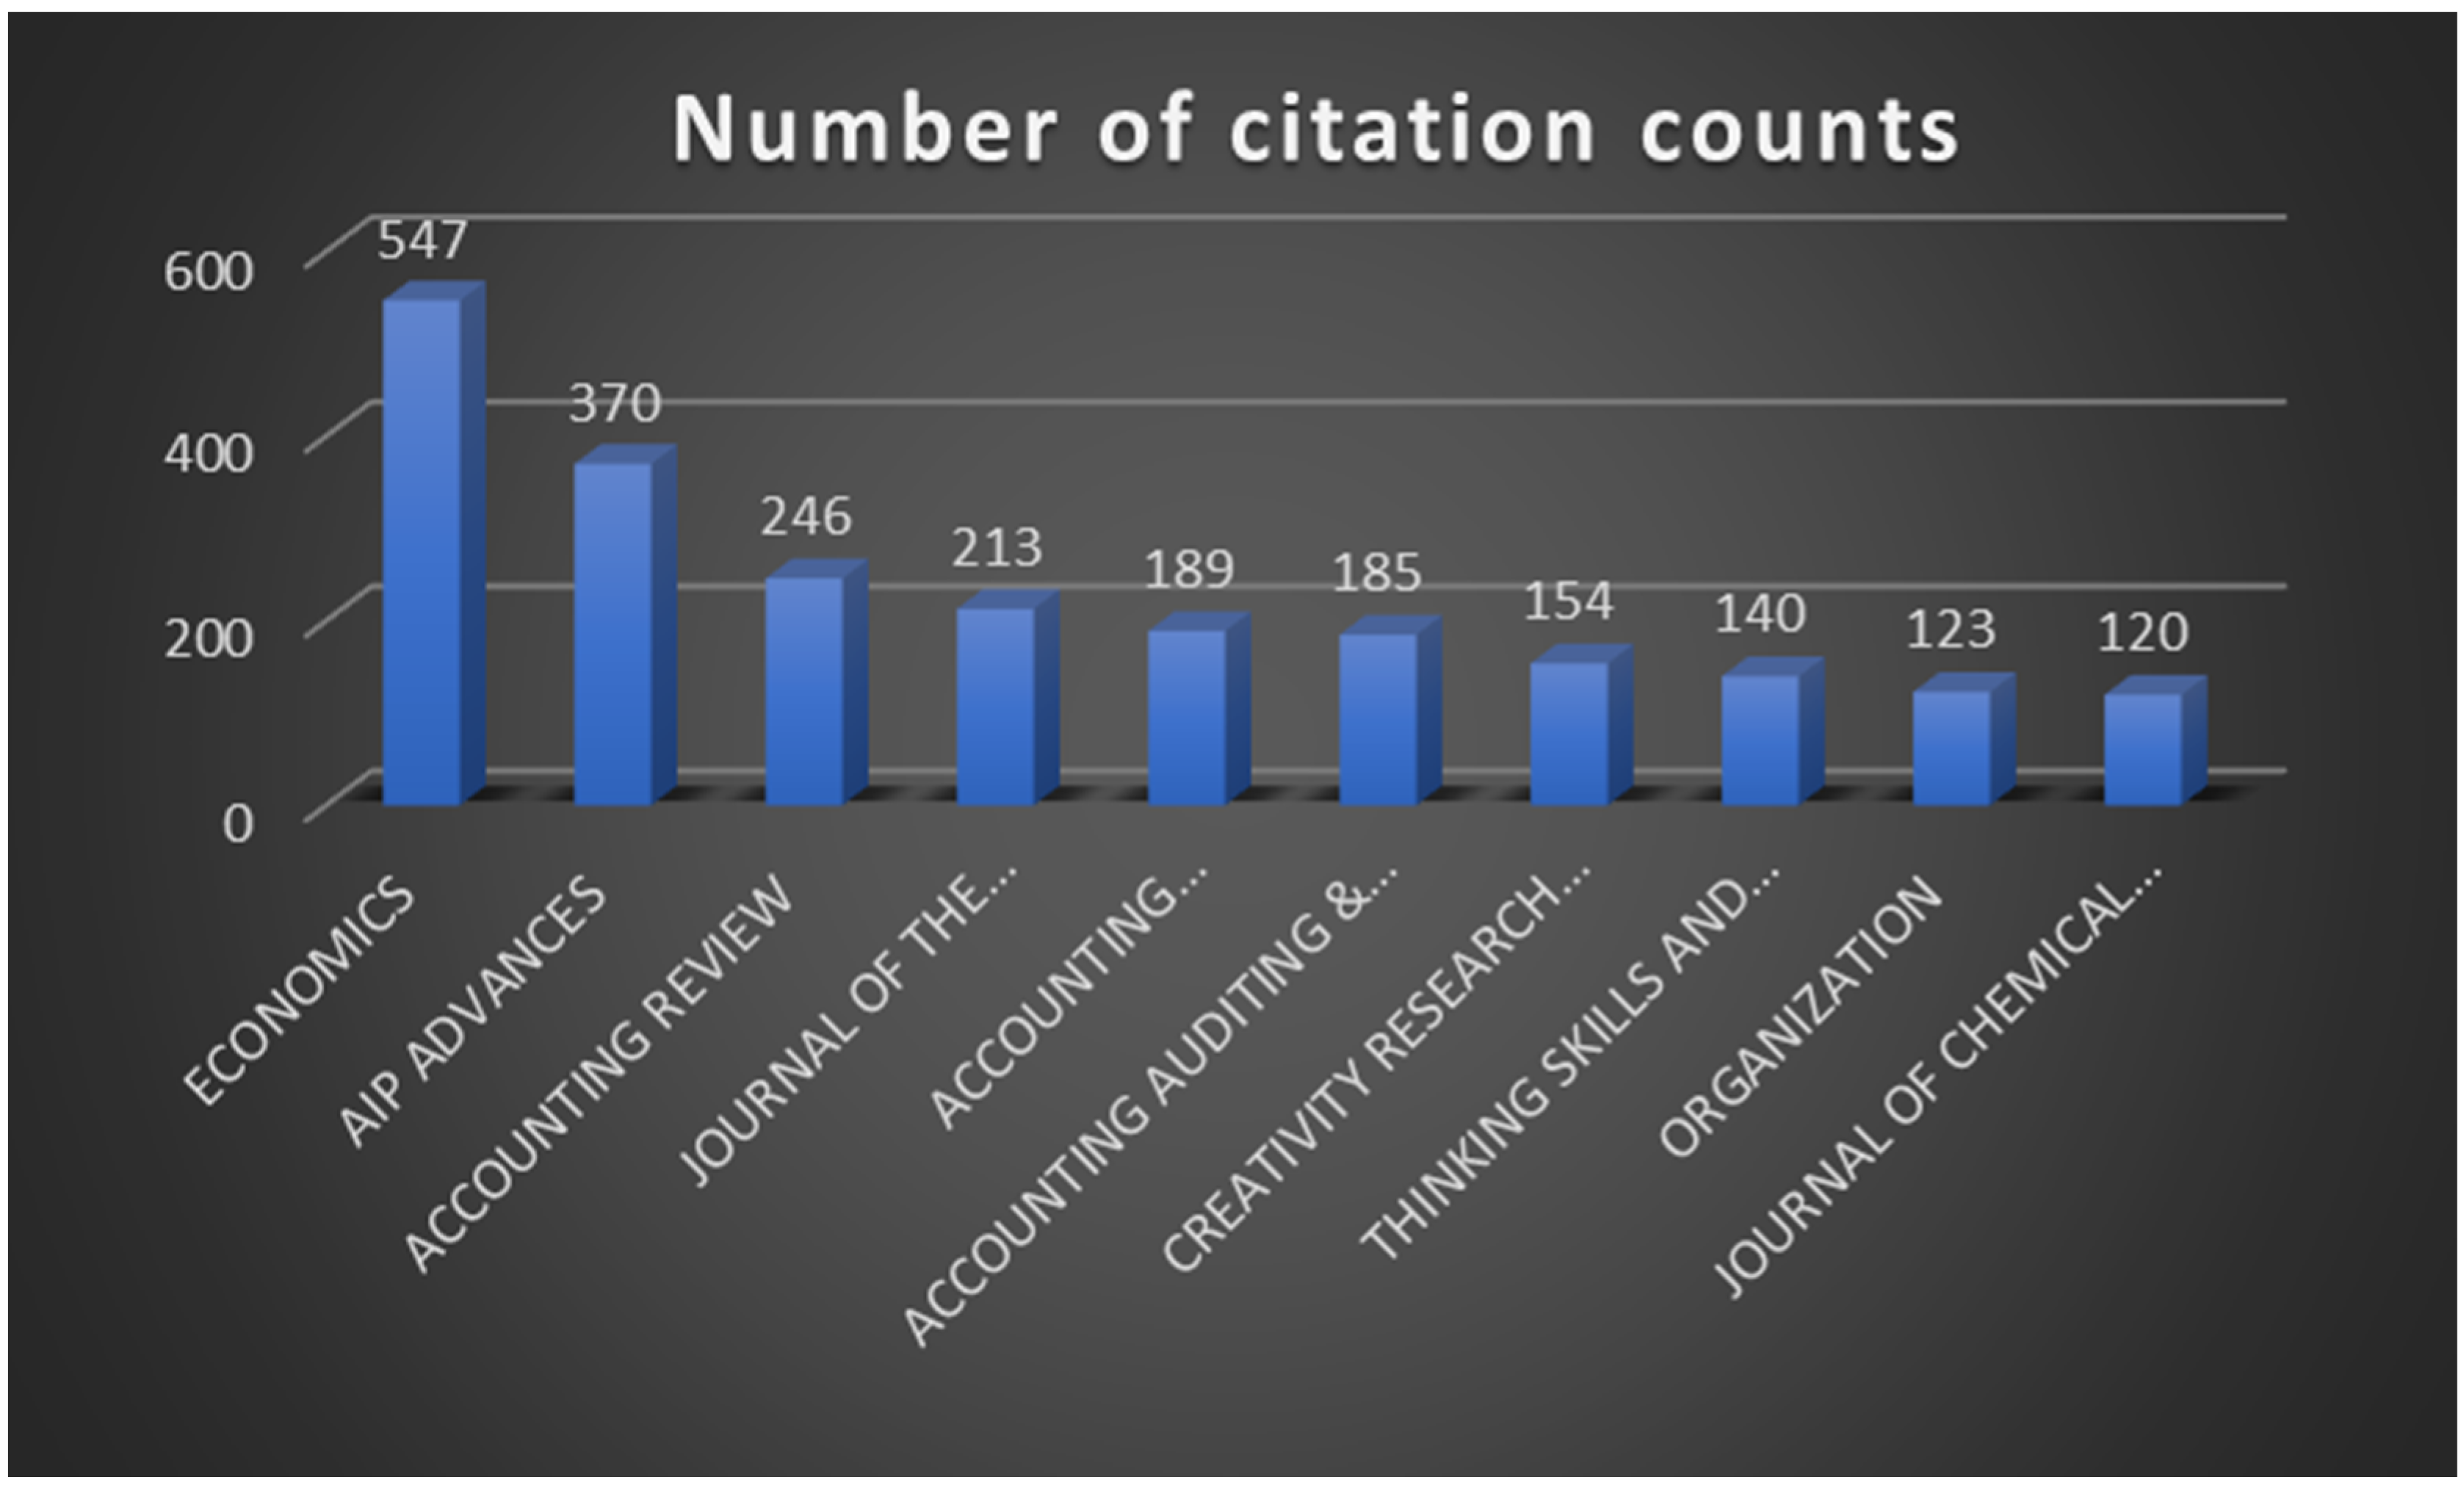
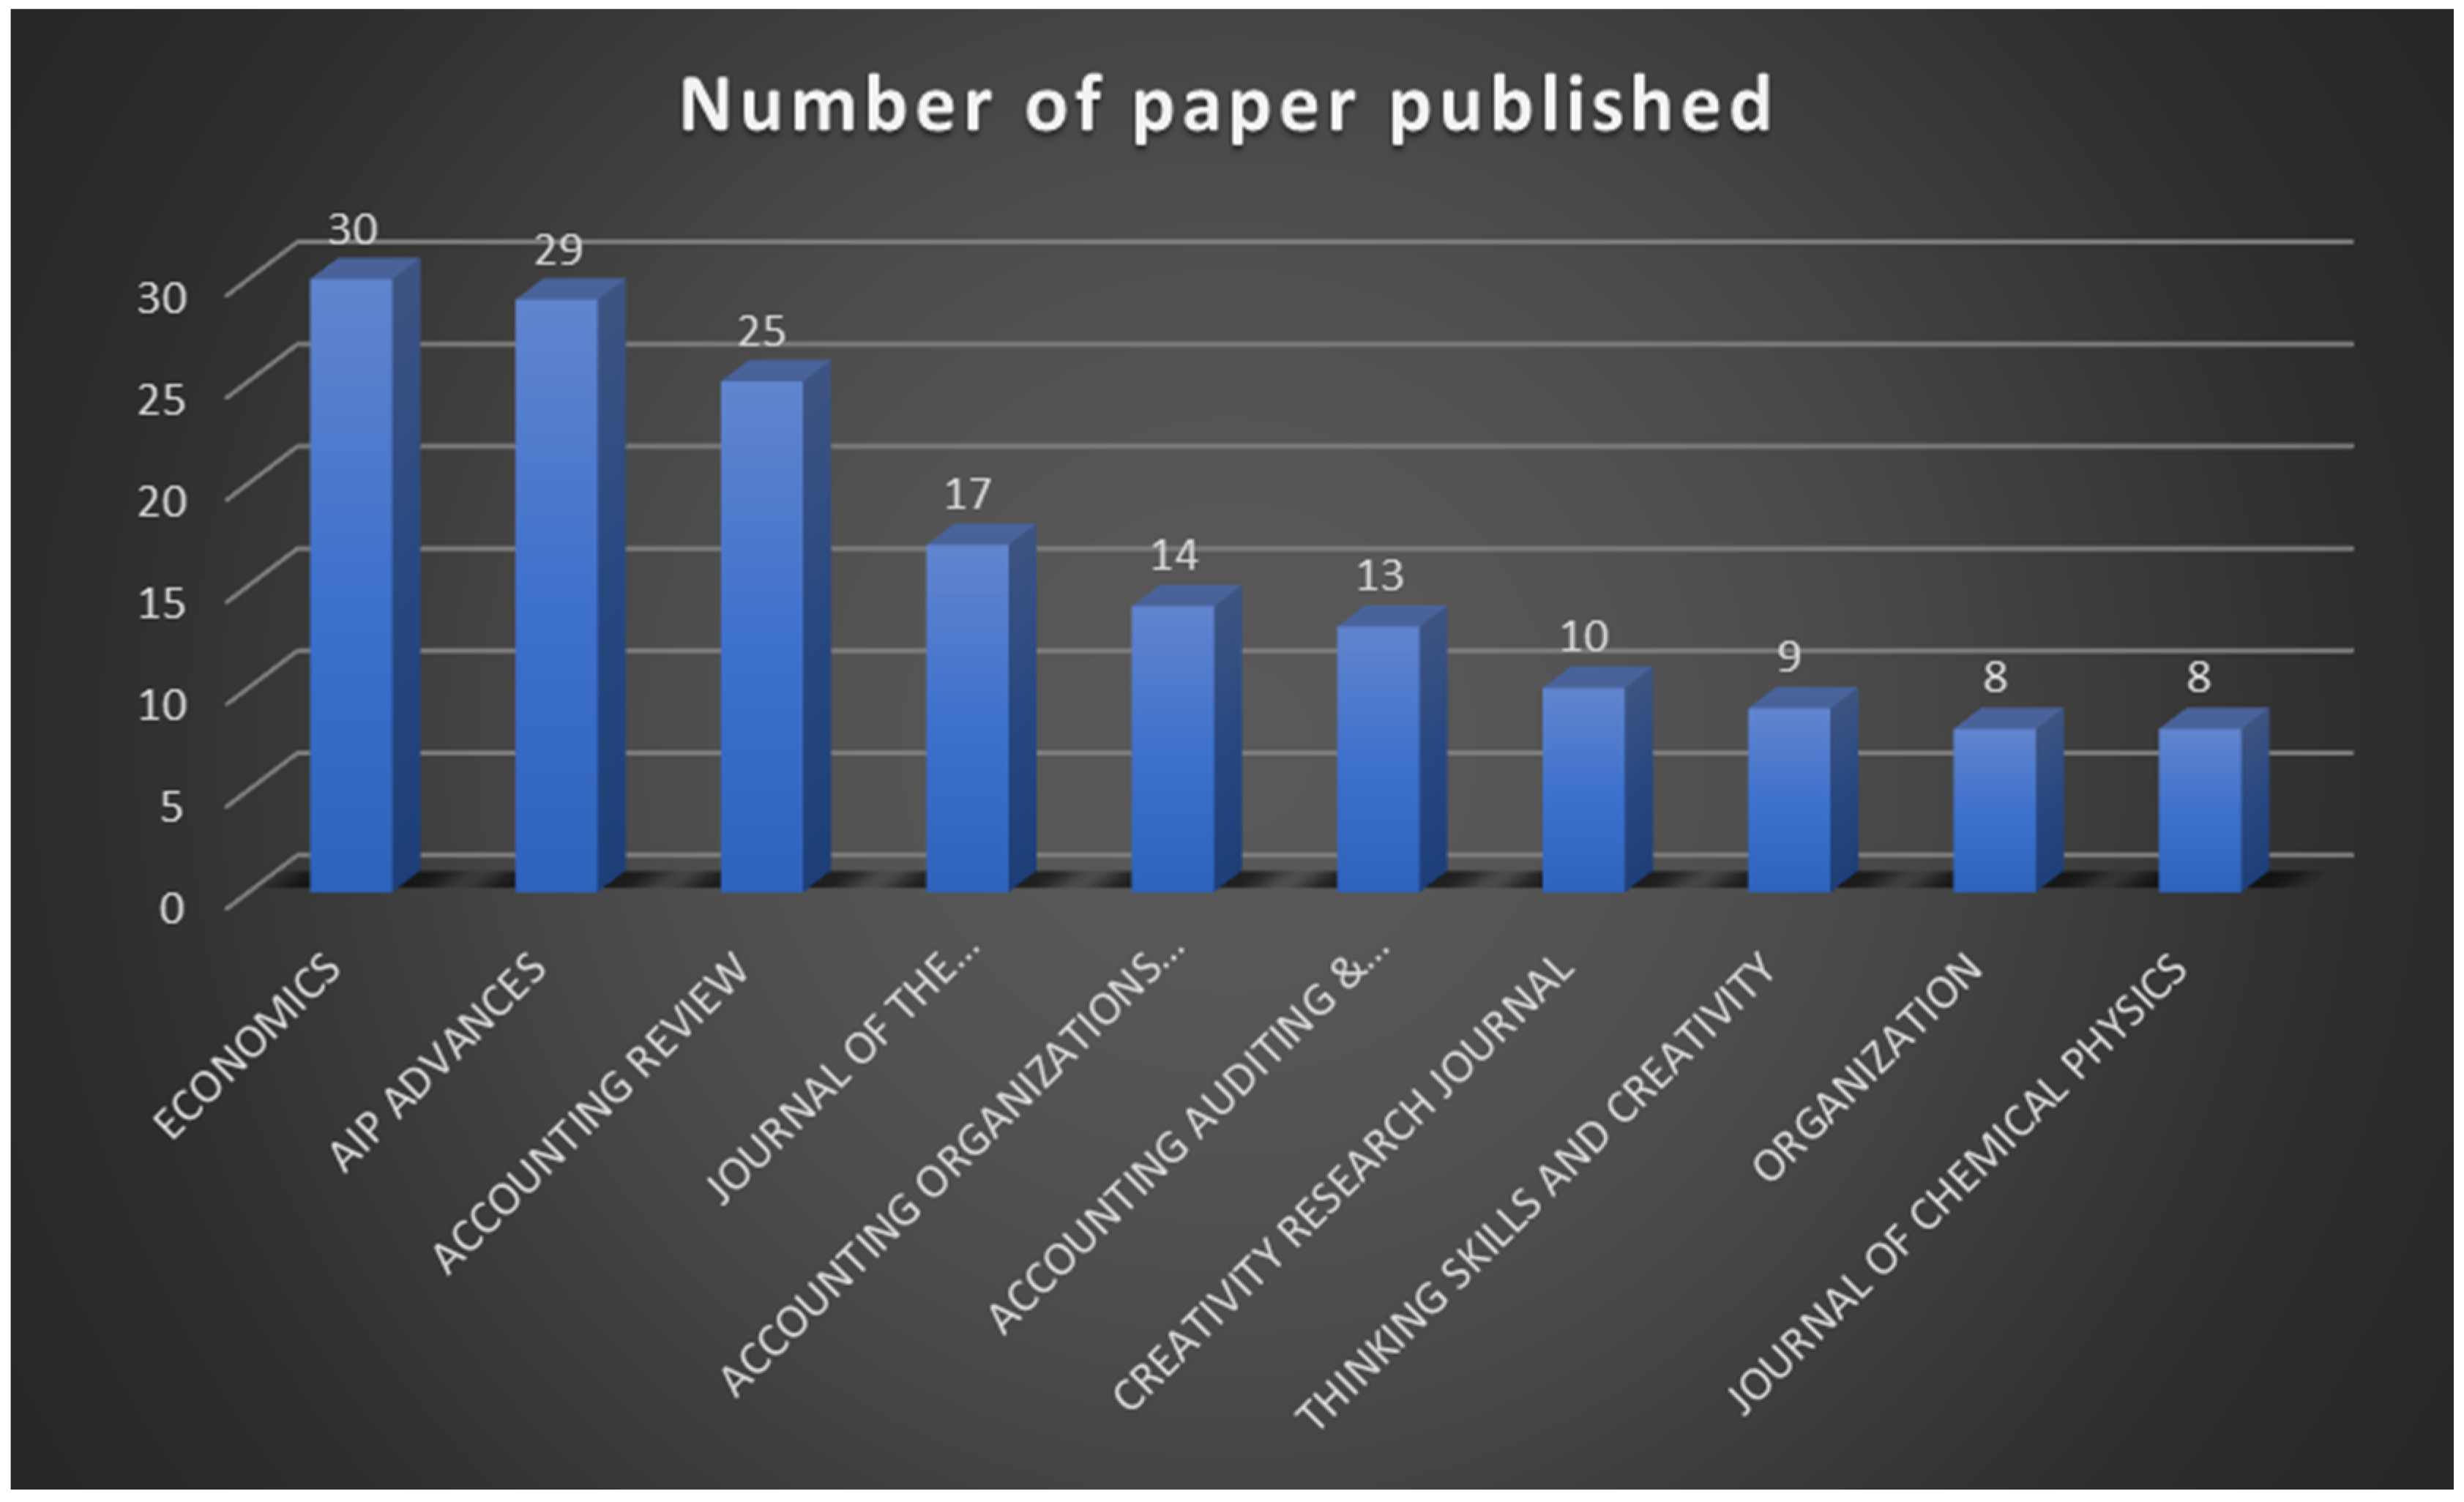
The top 100 of the most cited articles published articles on creative accounting, and 10 of them registered more than five articles. A total of 163 articles were identified in the top ten active journals, which were publications in the WOS database. The most cited journal was Economics, with 547 citations (Figure 3). Most articles were found in the journal Economics, with 29 publications (Figure 4).
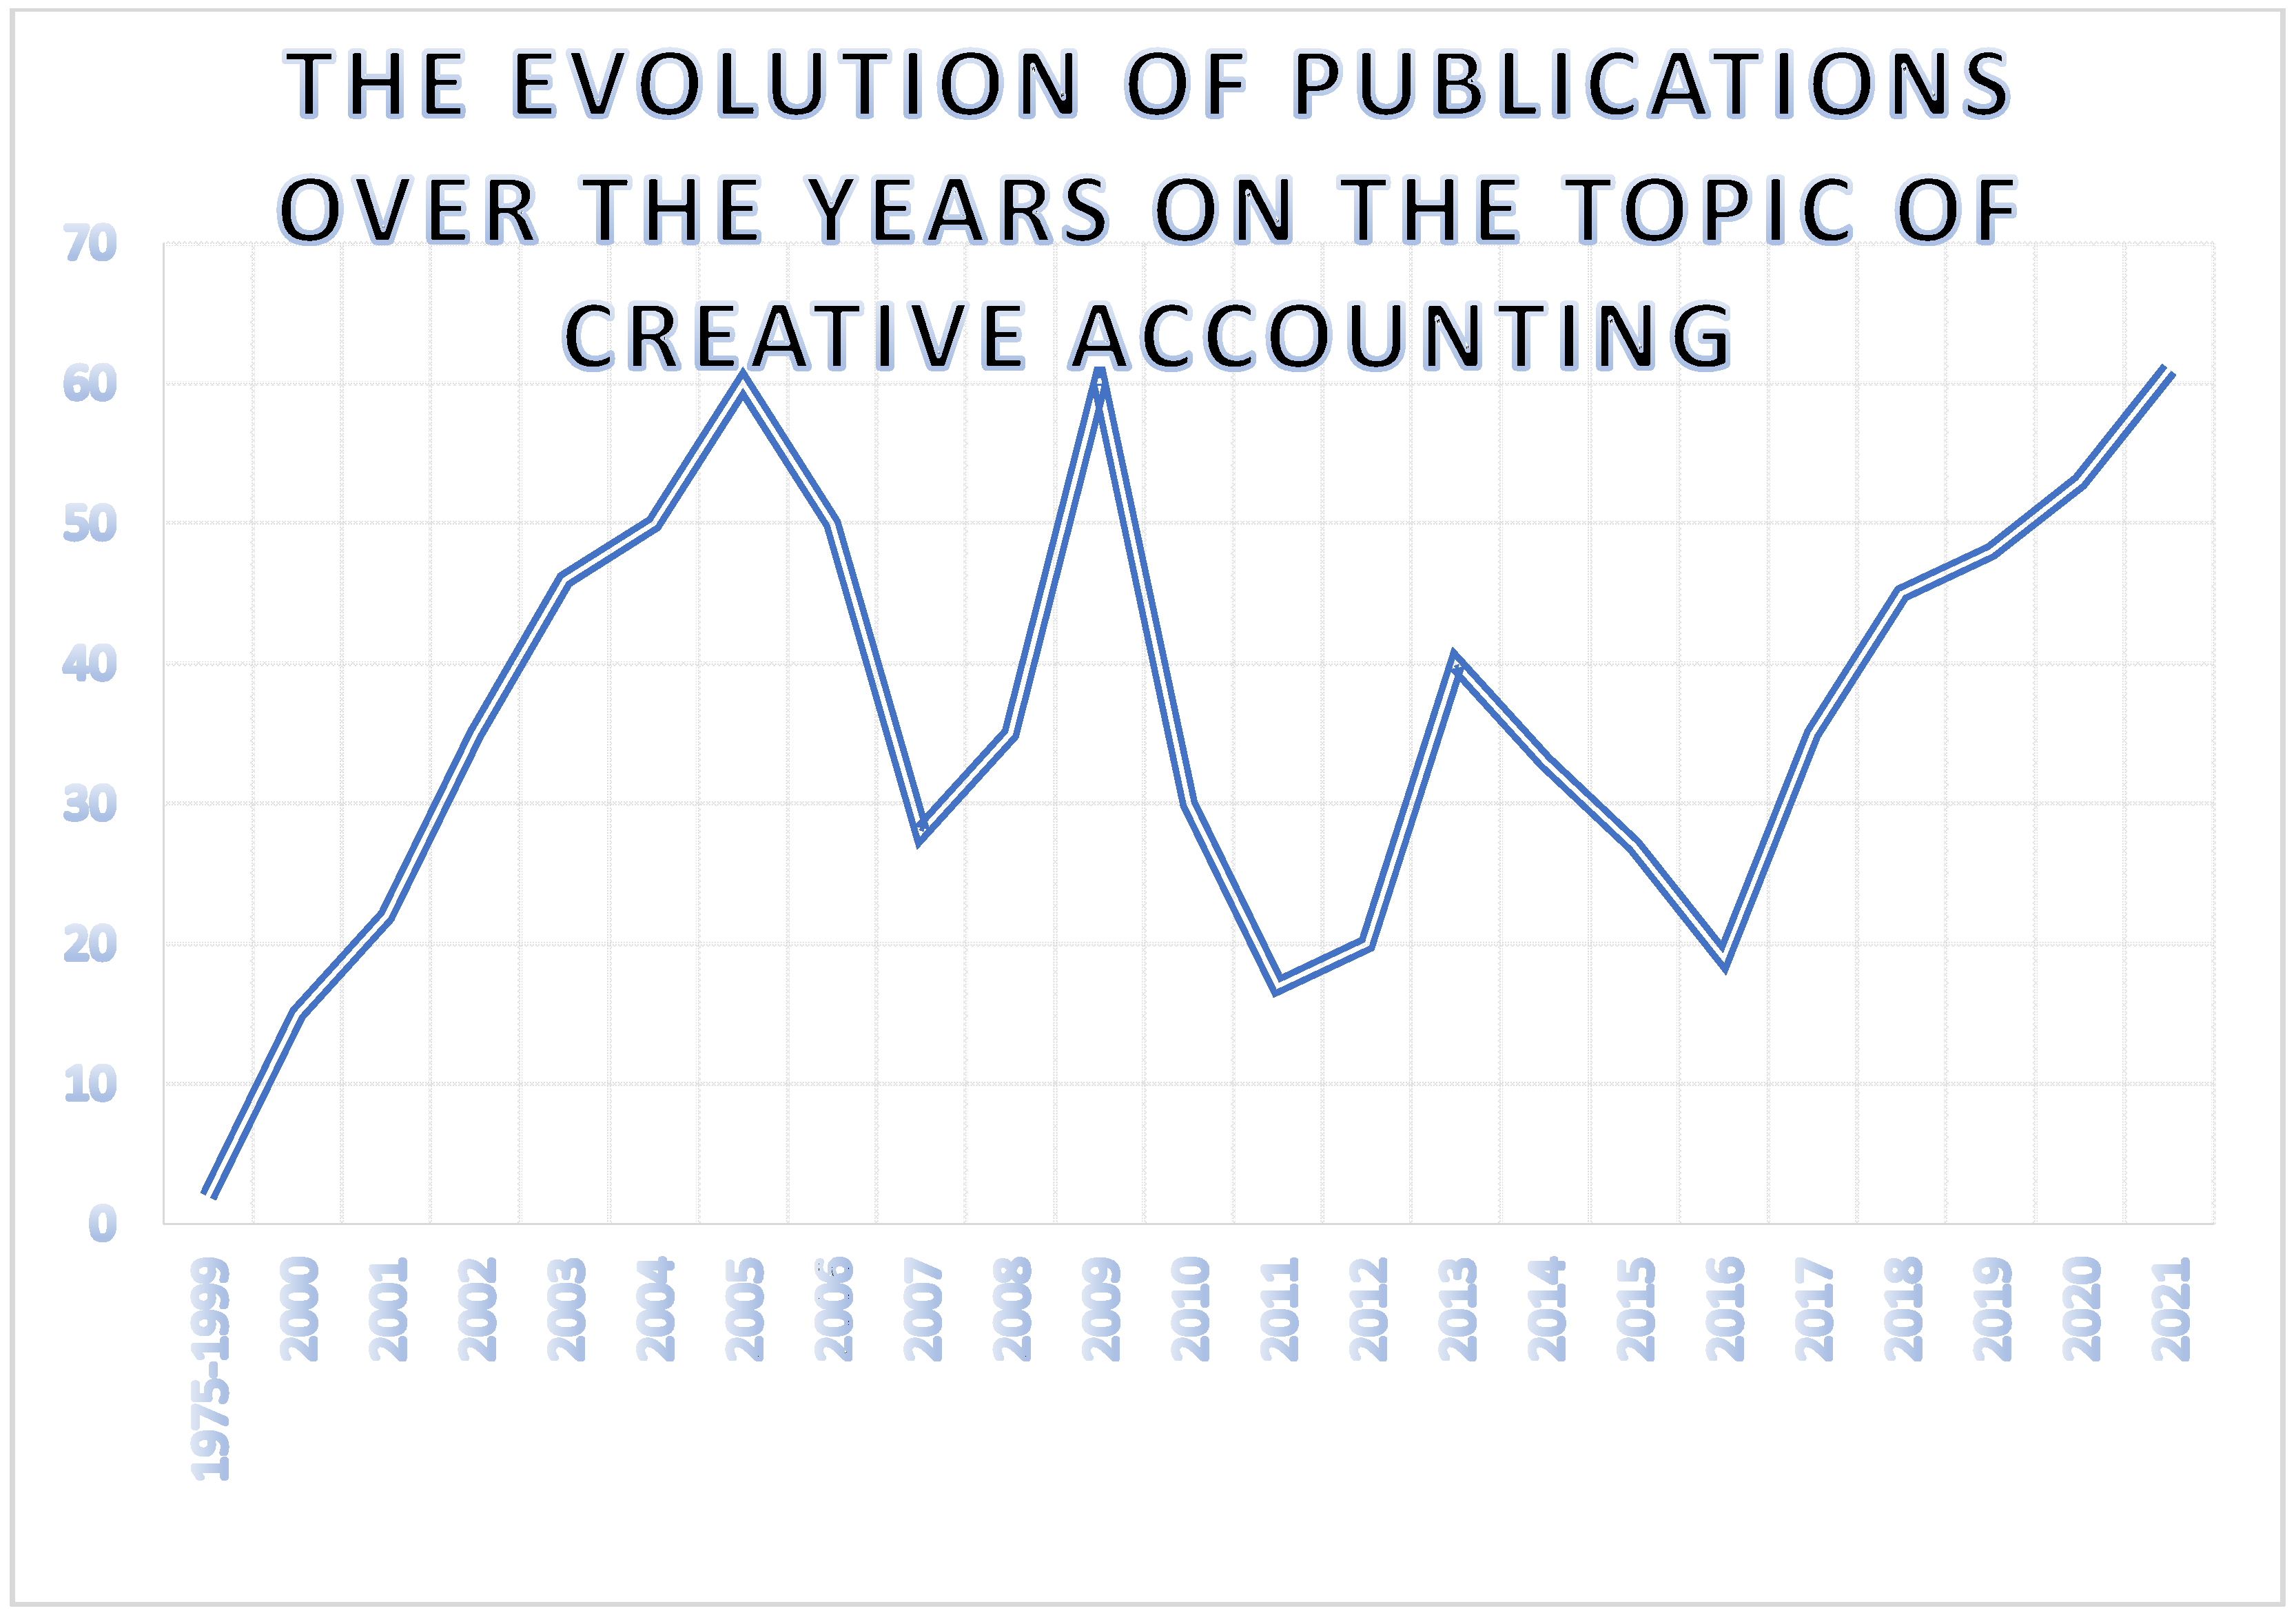
Figure 5 shows the increased interest in this topic, we can see a fluctuation in terms of creative accounting; it has a sharp increase from the beginning of 2000 to 2005, following a decrease, and after the economic crisis there is again an interest raised for this topic.
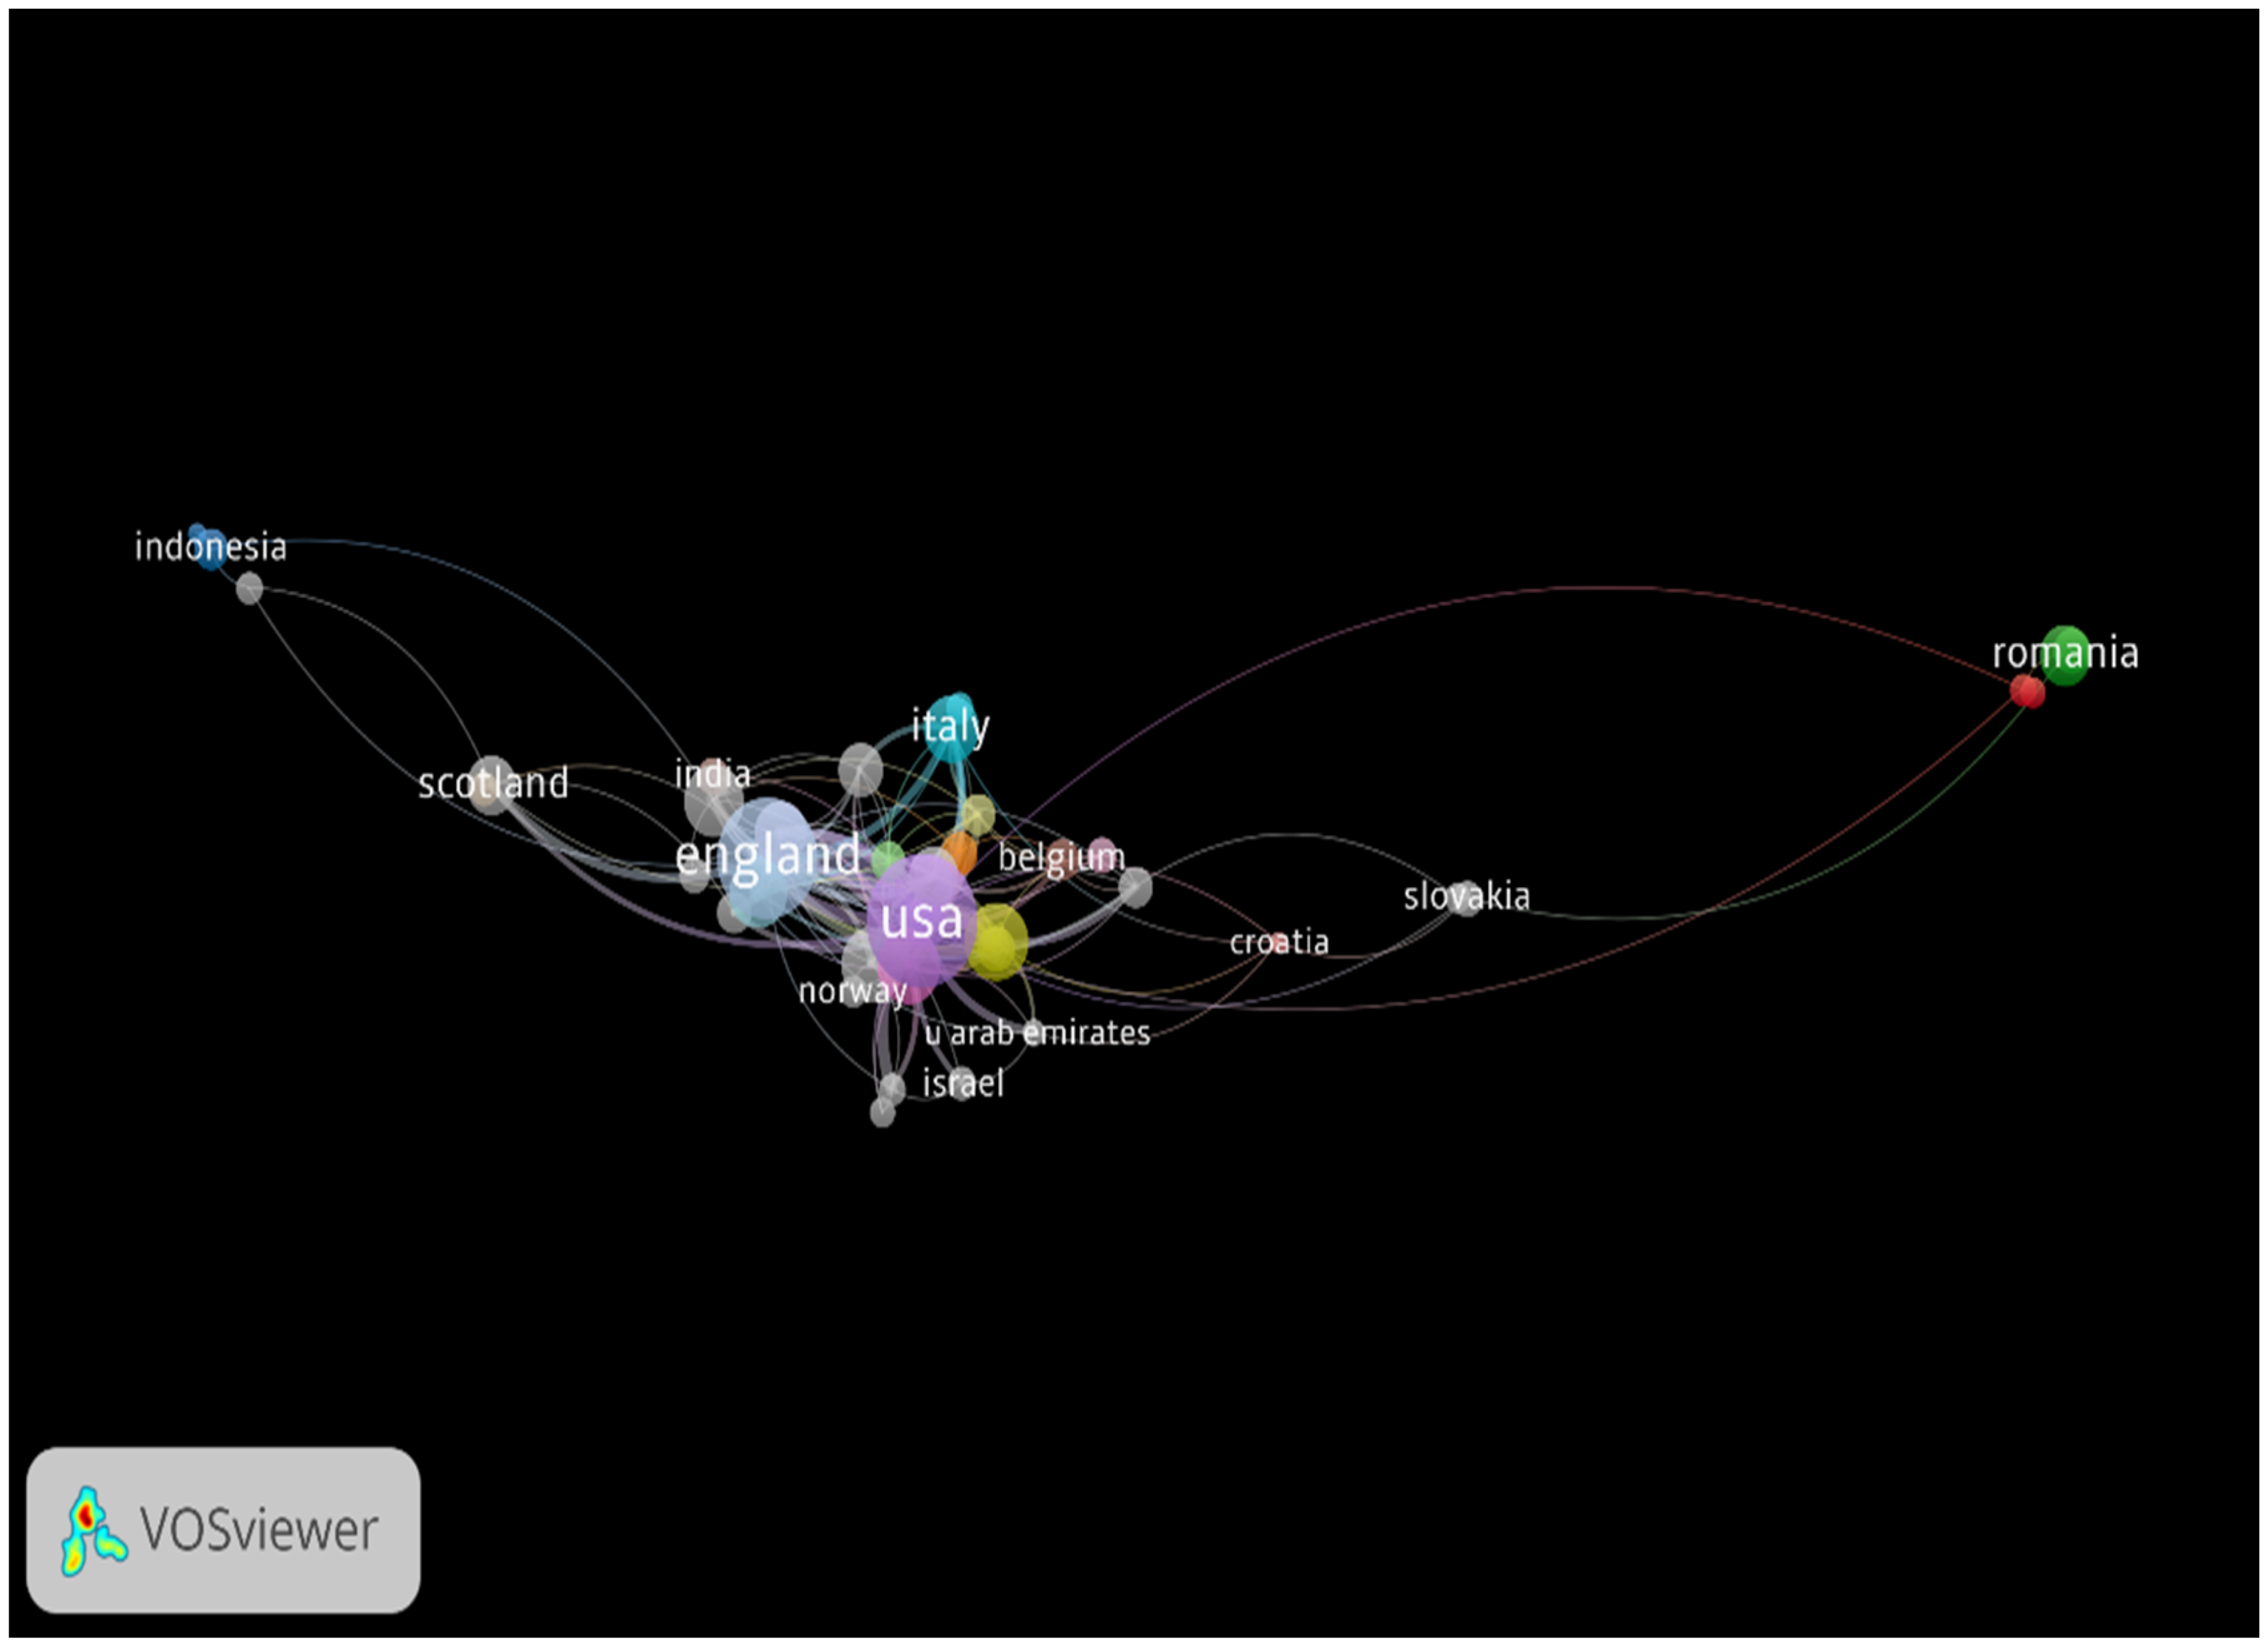
With the help of Table 3 and Figure 6, we answer question number five of the research, as follows: “Which countries are most preoccupied in publishing regarding this topic?”. We can see an increased interest for the topic in the USA, England, Croatia and Germany.
The 10 most important countries, organizations, and authors of creative accounting publications are listed in Table 3. Further, 230 articles have been published in the USA, being cited 4011 times.
4.1.4. Bibliometric Analysis of the Co-Authorship
In the domestic and international literature, it is relevant to us that 1645 organizations have published related papers. The number of collaborators in the USA is 321, and the total power of the connection is 144. The main partners of the USA are England, Croatia and Germany (Figure 6).
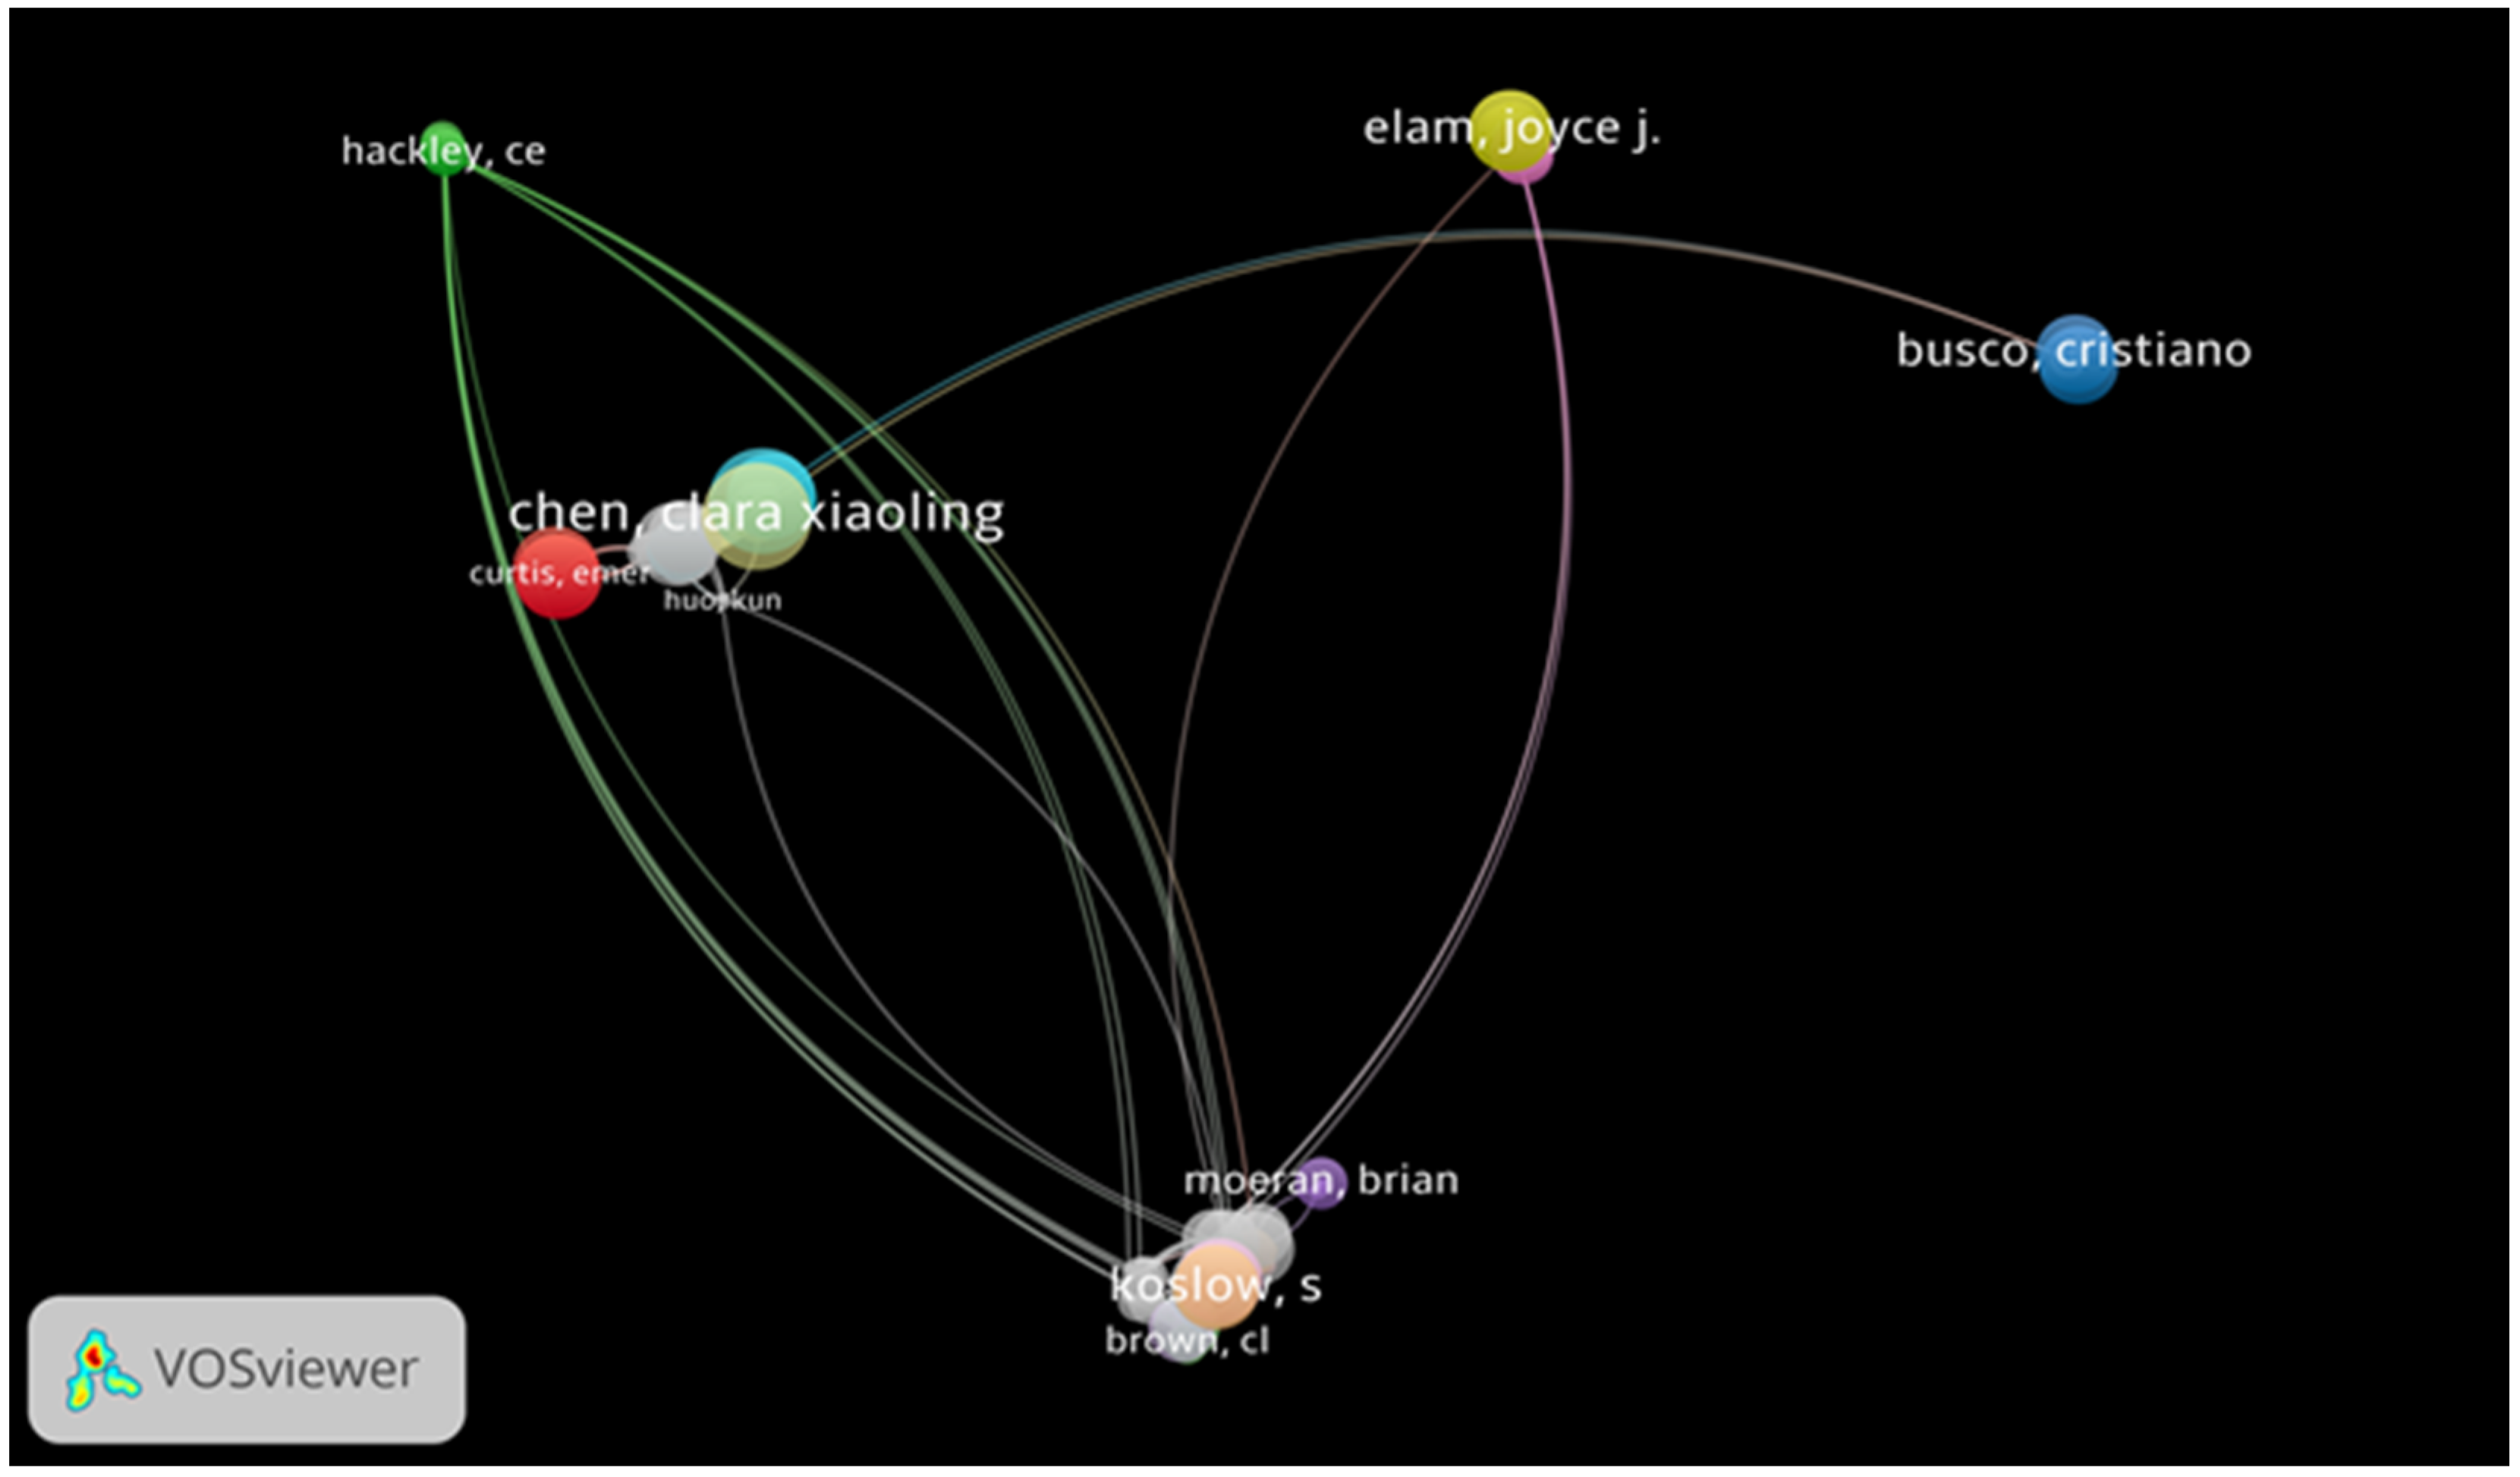
In Figure 7 we can see eight clusters were presented in different colors. The different colors indicate different groups, and the size of the circles indicates the number of citations. In our current study, 4045 creative accounting publications published in the WOS database were analyzed. The three aspects that have been included in the publications are as follows: creative accounting, financial statements, and models for detecting manipulation techniques. The most common keyword, “creative accounting”, has a strong connection with “fraud” and “earning management”.
The USA has made the most significant contribution to this important field. Research continues to spread around the world. Thus, the most used keywords, “creative accounting” and “fraud”, have a strong connection with “financial statements” and manipulation techniques. However, some limitations are still inevitable.
5. Conclusions
In the context of a performant or less performant company, creative accounting or fraud should not be used, even though the results may not be as expected. The reality shows us that, in the most cases, they restore to manipulative techniques, so the numbers are as expected, or better. The motivating factor behind this technique is the personal incentive.
In this study we first presented the models used internationally by analysts, economists, and auditors to analyze the accuracy of financial statements. This presentation aimed to describe the models for determining the techniques that lead to the handling of situations and the use of creative accounting. With the help of models, we answered the first research question, which are the most used methods for detecting the manipulation of financial statements in the literature?
A qualitative analysis can be performed at the individual or global level of the company. The models presented in the paper are effective, because they all indicate the application of creative accounting and can signal fraud by significantly modifying some reports.
Through the bibliometric analysis we answered the remaining research questions, by identifying the novelty of the study, the large number of citations, which indicates that these practices are by no means recent. This is indicated by the fact that the first 100 of the most cited articles have published articles on creative accounting, and 10 have been published more than five times. In total, 85 were published. The first ten papers were published in active journals, publications from the WOS database. In total, 3671 authors participated in the publication of the works. Through the research of domestic and international literature, it is suggested that 1645 organizations have published papers related to the topic and connected with it, and 400 have over five publications.
In future studies we intend to expand our research on both the literature and the application of existing models in the literature. It is very important to evaluate the quality of a large number of works and obtain the most valuable information.
Author Contributions
Conceptualization, I.L.S., A.-I.S. and N.M.; methodology, I.L.S., A.-I.S. and N.M.; resources, I.L.S., A.-I.S. and N.M.; writing—original draft preparation, I.L.S., A.-I.S. and N.M.; writing—review and editing, I.L.S., A.-I.S. and N.M. All authors had an equal contribution. All authors have read and agreed to the published version of the manuscript.
Funding
This work was supported by a grant of the Romanian Ministry of Education and Research, CNCS—project number PN-III-P4-ID-PCE-2020-2174, within PNCDI III. This work was possible with the financial support of the Operational Programme Human Capital 2014-2020 under the project number POCU 123793 with the title “Researcher, future entrepreneur—New Generation”.
Data Availability Statement
The data presented in this study are contained and available in the framework articles and in the Web of Science database.
Conflicts of Interest
The authors declare no conflict of interest.
References
- Achim, Monica Violeta, and Sorin Nicolae Borlea. 2020. Economic and Financial Crime. Corruption, Shadow Economy, and Money Laun-Dering. Berlin/Heidelberg: Springer. [Google Scholar] [CrossRef]
- Alazard, Claude, and Sabine Sépari. 2001. Contrôle de Gestion. Paris: Edition Dunod, 4eme. [Google Scholar]
- Argenti, John. 1976. Corporate planning and corporate collapse. Journal Elsevier 9: 12–17. [Google Scholar] [CrossRef]
- Beneish, Messod D. 1999. The Detection of Earnings Manipulation. Financial Analysts Journal 55: 24–36. [Google Scholar] [CrossRef]
- Bilgin, Mehmet Huseyin, and Danis Hakan. 2019. Entrepreneurship, Business and Economics. Berlin/Heidelberg: Springer, vol. 2, Available online: https://link.springer.com/book/10.1007%2F978-3-319-27573-4 (accessed on 1 March 2021).
- Dechow, Patricia, and Douglas J. Skinner. 2000. Earnings management: Reconciling the views of accounting academics, practitioners, and regulators. Accounting Horizons 14: 235–50. [Google Scholar] [CrossRef]
- Dechow, Patricia, and Ilia Dichev. 2002. the quality of accruals and earnings: The role of accrual estimation errors. The Accounting Review 77: 35–59. [Google Scholar] [CrossRef]
- Elleby, Anita, and Peter Ingwersen. 2010. Publication point indicators: A comparative case study of two publication point systems and citation impact in an interdisciplinary context. Journal of Informetrics 4: 512–23. [Google Scholar] [CrossRef]
- Griffiths, John. 1986. Creative Accounting: How to Make Your Profits What You Want Them to Be. Unwin Paperbacks. Basingstoke: Palgrave Macmillan. [Google Scholar]
- Groșanu, Adrian. 2013. Creative Accounting, Editure. București: ASE, pp. 15–66. [Google Scholar]
- Healy, Paul M. 1985. The effect of bonus schemes on accounting decisions. Journal of Accounting and Economics 7: 85–107. [Google Scholar] [CrossRef]
- Jones, Jennifer J. 1991. Earnings management during import relief investigations. Journal of Accounting Research 29: 193–228. [Google Scholar] [CrossRef]
- Jones, Michael J. 2010. Creative Accounting, Fraud and International Accounting Scandals. Hoboken: John Wiley & Sons. [Google Scholar]
- Lambert, Richard. A. 1984. Income smoothing as rational equilibrium behavior. Accounting Review 59: 604–18. [Google Scholar]
- Lau, Marco Chi Keung, Ender Demir, and Mehmet Huseyin Bilgin. 2013. Experience-based corporate corruption and stock market volatility: Evidence from emerging markets. Emerging Markets Review 17: 1–13. [Google Scholar] [CrossRef]
- Malciu, Liliana. 1999. Contabilitate creativa. Bucharest: Economica Publishing House. [Google Scholar]
- Naser, Kamal. 1993. Creative Accounting: Its Nature and Use. Londra: Editura Prentice Hall International, p. 9. [Google Scholar]
- Noyons, E., H. Moed, and A. Van Raan. 1999. Integrating research preformance analysis and science mapping. Scientometrics. Scientometrics 46: 591–604. [Google Scholar] [CrossRef]
- Oriol, Amat, Blake John, and Dowds Jack. 1999. The ethics of creative accounting, economics working paper. Journal of Economic Literature Classification 349: 715–736. [Google Scholar]
- Piotroski, Joseph D. 2002. Value Investing: The Use of Historical Financial Statement Information to Separate Winners from Losers. Selected Paper Number 84, was Supported by the Albert P. Weisman Endowment. Journal of Accounting Research 38. [Google Scholar] [CrossRef] [Green Version]
- Putman, Robert L., Richard B. Griffin, and Ronald W. Kilgore. 2005. A Model for the Determination of the Quality of Earnings. Academy of Accounting and Financial Studies Journal 9: 41–50. Available online: https://www.abacademies.org/articles/aafsjvol932005.pdf (accessed on 10 April 2021).
- Robu, Ioan-Bogdan, and Mihaela-Alina Robu. 2013. Proceduri de audit pentru estimarea riscului de fraudă bazate pe indici de detectare a manipulărilor contabile. Audit financiar 106: 4–16. [Google Scholar]
- Sabau, Andrada Ioana, Ioana Lavinia Safta, Gabriela Monica Miron, and Monica Violeta Achim. 2020. Manipulation of Financial Information through Creative Accounting: Case Study at Companies listed on the Romanian Stock Exchange. Rsep Conferences 18: 64–80. [Google Scholar]
- Sasaki, Hajime, Bunshi Fugetsu, and Ichiro Sakata. 2020. Emerging Scientific Field Detection Using CitationNetworks and Topic Models—A Case Study of the Nanocarbon Field. Applied System Innovation 3: 40. [Google Scholar] [CrossRef]
- Schilit, Howard. 2010. Financial Shenanigans. New York: Tata McGraw-Hill Education. [Google Scholar]
- Shah, Atul K. 1988. Exploring the influences and constraints on creative accounting in The UnitedKingdom. European Accounting Review 7: 83–104. [Google Scholar] [CrossRef]
- Staszkiewicz, Piotr. 2019. The application of citation count regression to identify important paper in the literature on non-audit fees. Managerial Auditing Journa Doil 34: 96–115. [Google Scholar] [CrossRef]
- Tarba, Neculai, and Alina Rusu. 2011. Considerații privind impactul contabilității creative asupra calității informațiilor prezentate în situațiile financiare anuale. Audit Financiar 9: 11. [Google Scholar]
- Vladu, Alina Beattrice, Oriol Amat, and Dan Dacian Cuzdriorean. 2016. Truthfulness in Accounting How to Discriminate Accounting Manipulators from Non-manipulators. Journal of Business Ethics 140: 633–48. [Google Scholar] [CrossRef] [Green Version]
- Watts, Ross L., and Jerold L. Zimmerman. 1978. Towards a Positive Theory of the Determination of Accounting Standards. The Accounting Review 53: 112–34. [Google Scholar]
- Watts, Ross L., and Jerold L. Zimmerman. 1986. Positive Accounting Theory. Hoboken: Prentice Hall. [Google Scholar]
- Watts, Ross L., and Jerold L. Zimmerman. 1990. Positive Accounting Theory: A Ten Year Perspective. JSTOR 65: 131–56. [Google Scholar]
Figure 1.
Bibliometric analysis of keywords in “creative accounting” publications. Co-occurrence of keywords. Source: author’s processing using VOSviewer.
Figure 1.
Bibliometric analysis of keywords in “creative accounting” publications. Co-occurrence of keywords. Source: author’s processing using VOSviewer.

Figure 2.
“Creative Accounting” keyword cloud. Source: author’s processing using WordClouds.

Figure 3.
The top ten journals with the most cited articles in the field of creative accounting. Source: author’s processing.
Figure 3.
The top ten journals with the most cited articles in the field of creative accounting. Source: author’s processing.

Figure 4.
The top ten journals with the most cited articles in the field. Source: author’s processing.
Figure 4.
The top ten journals with the most cited articles in the field. Source: author’s processing.

Figure 5.
The evolution of publications. Source: author’s processing.

Figure 6.
Countries where creative accounting publications were published. Source: author’s processing using VOSviewer.
Figure 6.
Countries where creative accounting publications were published. Source: author’s processing using VOSviewer.

Figure 7.
Bibliometric analysis of citations. Authors’ citations. Source: author’s processing using VOSviewer.
Figure 7.
Bibliometric analysis of citations. Authors’ citations. Source: author’s processing using VOSviewer.


Table 1.
Equivalent terms of the concept of “creative accounting”.
| Countries | Terms Consistent with “Creative Accounting” |
|---|---|
| Switzerland | Bilanzmanipulation (balance sheet manipulation), Bilanzkosmetik (cosmetizarea balance sheet) |
| Germany | Trickserein (balance sheet tricks), Bilanzartistik (art balance sheet), geschonte Jahresrechnung, Serifenblasen |
| The Netherlands | Winstegalisatie (equalization of profits), Creatif boekhouden (creative accounting), Creatieve jaarverslaggeving (creative annual reporting), Winststuring (profit management), Windstflattering, Verliesmaximalisatie (maximizing losses) |
| France | Bricolage (improvised method), fabricated accounts, unlimited creativity (unlimited creativity) |
| USA | Cooking the books (preparation of accounting), (fabrication of numbers), (game of numbers), more debits than credits (more debits than credits), earnings management (revenue management) |
| Italy | Politiche di bilancio (budgetary policies) |
| Japan | (inadequate accounting), Funshoku (window-dressing), Kara- uri (dummy, “empty sales”), Maedaoshi |
| Australia | Fudging (inventive accounting), manipulative accounting (handling in accounting), feral accounting (brutal accounting) |
| Spain | Balance manipulado (balance sheet manipulation), estados financieros mejorados |
| Romania | Manipulare (manipulation), netezirea veniturilor (income smoothing) |
| Greece | Katartístike isologismós, oikonomiká parapoiiménes katastáseis, dimiourgikí logistikí |
| Sweden | Economic scandals, unethical practices, illegal behaviors |
| UK | Accounting for profits, fabricated accounts, income smoothing |
Source: author’s processing based on (Groșanu 2013).
Table 2.
Description of the dimensions research of “creative accounting”.
| Research Dimensions | |
|---|---|
| Analyzed period | 1975–2021 |
| Methods used | Statistical maps and descriptive statistics |
| Bibliometric analysis | Creative accounting |
Source: author’s processing.
Table 3.
The top ten most active countries, publications.
| Country | Citations | Documents |
|---|---|---|
| USA | 4011 | 230 |
| England | 2276 | 165 |
| Canada | 1263 | 49 |
| Peoples R China | 1059 | 59 |
| Sweden | 780 | 25 |
| Netherlands | 706 | 36 |
| Germany | 656 | 50 |
| Scotland | 631 | 32 |
| Belgium | 598 | 18 |
| Australia | 542 | 57 |
| France | 419 | 45 |
| Italy | 340 | 41 |
| Spain | 280 | 48 |
| New Zealand | 258 | 13 |
| Denmark | 188 | 12 |
| Ireland | 155 | 6 |
| South Korea | 154 | 10 |
| Colombia | 119 | 4 |
| Switzerland | 98 | 11 |
| South Africa | 97 | 12 |
| Finland | 90 | 13 |
| Austria | 76 | 12 |
| Taiwan | 74 | 13 |
| Russia | 70 | 56 |
| Japan | 67 | 12 |
| Norway | 63 | 6 |
| Cyprus | 57 | 4 |
| Israel | 56 | 5 |
| Greece | 51 | 10 |
| Singapore | 47 | 6 |
| Wales | 46 | 7 |
| Poland | 42 | 23 |
| Indonesia | 39 | 13 |
| Romania | 36 | 52 |
Source: author’s processing.
Publisher’s Note: MDPI stays neutral with regard to jurisdictional claims in published maps and institutional affiliations. |
© 2021 by the authors. Licensee MDPI, Basel, Switzerland. This article is an open access article distributed under the terms and conditions of the Creative Commons Attribution (CC BY) license (https://creativecommons.org/licenses/by/4.0/).
Share and Cite
MDPI and ACS Style
Safta, I.L.; Sabău, A.-I.; Muntean, N. Bibliometric Analysis of the Literature on Measuring Techniques for Manipulating Financial Statements. Risks 2021, 9, 123. https://doi.org/10.3390/risks9070123
AMA Style
Safta IL, Sabău A-I, Muntean N. Bibliometric Analysis of the Literature on Measuring Techniques for Manipulating Financial Statements. Risks. 2021; 9(7):123. https://doi.org/10.3390/risks9070123
Chicago/Turabian StyleSafta, Ioana Lavinia, Andrada-Ioana Sabău (Popa), and Neli Muntean. 2021. "Bibliometric Analysis of the Literature on Measuring Techniques for Manipulating Financial Statements" Risks 9, no. 7: 123. https://doi.org/10.3390/risks9070123
Note that from the first issue of 2016, this journal uses article numbers instead of page numbers. See further details here.