
STEM Faculty Instructional Data-Use Practices: Informing Teaching Practice and Students’ Reflection on Students’ Learning


College of Education, Oregon State University, Corvallis, OR 97331, USA
*
Author to whom correspondence should be addressed.
Educ. Sci. 2021, 11(6), 291; https://doi.org/10.3390/educsci11060291
Submission received: 21 May 2021
/
Revised: 9 June 2021
/
Accepted: 9 June 2021
/
Published: 12 June 2021
(This article belongs to the Special Issue New Research and Trends in Higher Education)
Abstract
:This paper explores the affordances and constraints of STEM faculty members’ instructional data-use practices and how they engage students (or not) in reflection around their own learning data. We found faculty used a wide variety of instructional data-use practices. We also found several constraints that influenced their instructional data-use practices, including perceived lack of time, standardized curriculum and assessments predetermined in scope and sequence, and a perceived lack of confidence and competence in their instructional data-use practices. Novel findings include faculty descriptions of instructional technology that afforded them access to immediate and nuanced instructional data. However, faculty described limited use of instructional data that engaged students in reflecting on their own learning data. We consider implications for faculty’s instructional data-use practices on departmental and institutional policies and procedures, professional development experts, and for faculty themselves.
1. Introduction
1.1. Calls for Increasing Instructional Data-Use Practices in Postsecondary Education
In response to calls for increased accountability from policymakers, accreditation agencies, and other stakeholders, higher education institutions are devoting more resources to gathering and analyzing evidence around student learning outcomes to inform strategies promoting student success and persistence [1,2,3]. Specifically, educators are asked to gather and respond to evidence of student learning to inform their future teaching-related decisions and practices. These calls, including for those faculty working in the STEM disciplines (science, technology, engineering, and mathematics), demonstrate a growing focus for many concerned with improvements to postsecondary education [4,5]. This push is well founded. Educators’ systematic use of instruction-related data has been shown to enhance student learning and achievement via faculty data-driven decisions [6].
The push for faculty to engage in systematic instructional data-use practices goes beyond their summative examination of students, often infrequent and not particularly illuminative [1,5], to include more formative data-use practices, including those that can inform immediate teaching practices. These connote increased repertoires of practice for many faculty, placing additional demands on them and, by association, those who seek to help develop their teaching-related practices. Emerging research indicates that STEM faculty are not necessarily ready to utilize diverse instructional data effectively or to constructively inform practice generally [5]. Teaching improvement interventions that target STEM faculty development of effective instructional data-use practices are becoming more numerous [1,4]. However, alongside limited knowledge about how postsecondary educators make decisions about their teaching overall [7], we still know little about how instructional data informs faculty teaching-related decisions [5,8]. This lack of knowledge limits abilities to help faculty enhance their instructional data-use practices, meet the calls of those calling for this, and respond to faculty members’ actual realities and needs.
What we do know from the research around educators’ instructional data-use practices largely concerns the degree to which K-12 educators implement policies mandating these practices [9,10]. A growing body of practice-based research investigates the experiences of K-12 educators’ agency and capability to employ data-use interventions in light of their professional contexts, e.g., [10,11,12]. From this research, we have some insight into why and how instructional data-use interventions are effective (or not). For instance, we know that educators must find instructional data relevant and meaningful concerning their teaching realities to consider changing their teaching practices in light of it [10]. In addition, we know that K-12 educators appreciate talking with other educators about data, including how to interpret it in light of practice [12]. Furthermore, educators’ data use happens in light of larger contextual complexities. Institutional norms and structures, including departmental and social networks, can influence educators’ access to and practices around data, including the knowledge and skills they need to analyze and use data to improve instruction [12,13,14]. Research in K-12 educators’ successful interventions that target educator’s data-use practices can lead to meaningful and more reliable assessments of students’ learning [15].
1.2. What We Know About Postsecondary Faculty’s Instructional Data-Use Practices
While the above K-12-focused research provides some important insights, we need empirical evidence that examines how postsecondary educators use instructional data [4]. Limited empirical research indicates that most postsecondary educators may not consider collecting and reflecting on instructional data to be their responsibility [16]. In addition, faculty may not have access to meaningful instructional data that they feel can inform their teaching [16], including those in the STEM disciplines [4,8]. Faculty also may not feel confident or competent in analyzing instructional data [3,17]. They may not have adequate time or appropriate resources or tools to engage in data-driven decision-making concerning instructional practices [5,18].
Even those postsecondary educators trained in STEM disciplines, where effective data collection skills and use may be assumed, have shown more limited instructional data use, even when data were made available to them. In one study, Bouwma-Gearhart and Hora and colleagues [4,5,8] explored the instructional data-use practices of 59 STEM faculty and 20 administrators at three institutions. Faculty noted they collected instructional data due to accreditation requirements and policies related to departmental reviews, but less so as part of their other instructional decision-making processes. Departmental and institutional interventions designed to improve faculty use of instructional data had low impact due to limits to faculty time and their lack of expertise with using teaching-related data. Notably, faculty found the availability of instructional data experts at their institutions to be an affordance, such as other faculty and staff, sometimes located in centers for teaching and learning. Faculty were more likely to implement instructional data-use practices and types of data if they aligned with their overall instructional goals. They generally found institutionally collected data, such as student evaluations, to be unreliable and insufficient, which discouraged their use of this data and provided motivation to create and implement some other instructional data practices. Although many faculty did not implement many instructional data-use practices, they found that those who did across their wide sample used various instructional data-use practices, both quantitative and qualitative. Decisions regarding data analysis that applied to practice included altering future versions of the courses based on analysis of exams and altering the pace of teaching, including time spent on particular topics.
While the above studies are helpful in understanding faculty use of instructional data, we need additional research to confirm or test these limited findings. Much of the scholarship related to arguments for the use by postsecondary educators of instruction-related data is anecdotal with limited empirical rooting [1]. What we do know about these faculty members comes from one study of STEM faculty from three universities, i.e., [4,5,8]. Specifically, we need additional inquiry about faculty realities that may drive interventions, development, and implementation to serve as affordances for what happens when faculty interact with data in their work [12]. Additionally, while instructional technologies hold the promise of influencing faculty’s collection and use of data and the ability to involve students more in the learning process, we largely lack evidence of this promise for these educators. Further, given the increased recognition of the value of involving students in reflecting on their learning, more research is needed on how STEM faculty can foster and engage students in reflecting on data around their learning [19,20]. Knowledge of these phenomena can assist in designing effective supports for faculty to more frequently and better use instructional data to improve their teaching and student learning, ultimately translating into greater success for students [21].
1.3. Instructional Technology That Influences Instructional Data-Use Practices
One affordance championed for faculty collection and instructional data-use practices is instructional technologies (e.g., electronic learning platforms and their analytics tools). Behind the push for faculty to use these tools are assumptions around the easy and quick collection and basic analyses of learning-related data they can provide [22]. Studies suggest faculty adoption and use of instructional technologies is slow and inconsistent [23]. In a report, Lester et al. [24] state much of the research around instructional technologies focuses on the different types of technology tools that faculty and institutions may use (e.g., clickers, learning management systems, adaptive learning). This research includes how technologies are adopted and adapted by institutions and their use and perceived usefulness by students of these tools. Lester and colleagues also state a paucity of research on faculty pedagogical changes resulting from using instructional technologies. However, they suggest insights gained from research around individual faculty decisions to incorporate other innovations into their teaching practices can inform faculty use of instructional technology. Specifically, they cited research that has identified faculty identity and beliefs established through disciplinary socialization and behaviors that can affect decision-making, e.g., [23,25,26].
Although instructional technologies may be appreciated by faculty as a potential means to improve teaching and learning, other studies found that many instructional technologies were not used to their fullest potential. Klein et al. [27], in a study of 6 faculty and 21 advising staff, identified barriers to effective use included a lack of reliable data infrastructure that was deemed cumbersome and misaligned with user needs as a deterrent to technology use. In another study, Hora and Holden [23] interviewed and observed 40 faculty in STEM departments at 3 universities in the U.S. Not surprisingly, perhaps, they found that faculty use of instructional technologies largely depended on its availability (or not). They also found faculty use turned on faculty perceptions of relevance to and alignment with their pre-existing beliefs and instruction goals, meaning faculty needed to see the instructional tool supporting their pedagogical practices. They also found that faculty members’ prior experiences with the technology and the perceived affordance of particular tools influenced their use. These studies suggest that faculty use of instructional technologies, and the promise of such for their instructional data use practices, may be more complex than just access to technology. Still, more research is needed in this area to confirm or challenge these limited findings and provide insight into how faculty use instructional technology to inform decisions related to their teaching practices.
1.4. Instructional Data-Use Practices That Involve Students Reflecting on Their Learning
Calls for research investigating instructional data-use practices that involve students reflecting on their own learning-related data are growing as faculty are encouraged to shift their instructional practices from teacher-centered to more learner-centered approaches [16]. Faculty must shift their thinking from seeing their role, primarily, as a transmitter of knowledge to one that empowers students in their own learning and provides students more meaningful feedback around their learning, beyond only results of summative assessments and final grades [21,28,29]. Ryan and Ryan [30] assert that including students in reflecting on their learning data is more than just sharing grades or exams with them. They state that students reflecting on their learning have generally included having students complete structured and unstructured reflective journaling, formal reflective papers, interviewing, and group memory work. Ryan and Ryan acknowledge the value of these activities but contend that examples of faculty engaging their students in systematic and deliberate activities that involve reflective learning are rare. The researchers noted potential barriers that influence faculty engagement of students in reflecting on their learning, including factors related to students’ socio-cognitive abilities. These factors include students’ developmental stages, such as whether they were in their first year or a later year of study in the discipline or field of study. The faculty’s use of reflective practices was also influenced by the context and potential complexity of the discipline in which the learning occurred. A final factor that may influence faculty when engaging students in reflective learning is the diversity of learners who bring prior knowledge, abilities, and experiences that may add to the challenges faculty may encounter when engaging students in reflective learning practices [30].
Indeed, the faculty’s use of instructional activities that have students reflecting on their learning data has been shown to foster student learning of course content and instill a greater sense of accountability for their learning [21]. Some research results seem promising, demonstrating that some STEM faculty are meeting researchers’ calls to engage students in reflecting on their learning-related data (e.g., [20]). Nonetheless, more research is needed that investigates how faculty use their instructional data to design activities that engage students more in reflecting on their data.
1.5. Paper Focus
This paper details an exploratory study conducted at one U.S. research university of STEM faculty members’ instructional data-use practices. Specific findings confirm the work of Bouwma-Gearhart and Hora et al., including faculty constraints to their data-use practices such as lack of time needed to implement data-use practices, standardization of course content that constrained some types of data collection, and a perceived lack of confidence and competence in their instructional data-use practices [4,5]. Novel findings include faculty descriptions of instructional technologies that they claimed allowed more timely and complete data to respond to more immediately in practice. Faculty who used adaptive learning technologies specifically claimed it helped them collect more nuanced data on achievement trends for different groups of students. Although all faculty used summative data (i.e., exams, written assignments), several faculty described less reliance on these typical data indicators of student learning, rather using other practices such as group work to measure student learning. Faculty were mixed in their practice of engaging students in reflecting on their own learning data. These practices were generally described as activities in which students were asked to reflect on their overall performance in class and how their use of study techniques may (or not) be helping them. We discuss the affordances and constraints that faculty perceive in their instructional data-use practices. We also discuss implications for departmental and institutional leaders, faculty leaders, professional developers, and for faculty themselves.
2. Methodology
2.1. Conceptual Frameworks
We assume faculty work within “complex network[s] of structures, tasks, and traditions that create and facilitate practice” [31], p. 2, which Halverson terms systems-of-practice. Faculty encounter in their systems-of-practice structures such as procedural norms and policies, physical objects and tools, and activities that can serve as affordances and impediments to their work (see Figure 1). Perceived affordance theory [32,33] is also relevant to our study as it helps to explain how and which structures and activities are salient to faculty and impact their practice. Perceived affordances are factors in the system that faculty sense and deem relevant around a task related to their self-perceived ability to attend to the task [33,34]. As examples, affordances can be structures or activities that educators believe will allow (or inspire) them to engage in collecting and using instructional data. For instance, educators may use instructional technologies, such as clickers, to collect certain types of instructional data of their interest, assuming they have some competency to use the tool.
Affordance theory has been used by other researchers who recognize postsecondary educators as functioning within complex socio-cultural systems. Hora [35] found that structural and sociocultural factors afforded and constrained teaching practices. Affordances included the high degree of autonomy faculty had in making decisions related to their teaching practices. Constraints included policy implications related to issues such as promotion and tenure requirements. As demonstrated in some of this past research, affordances are not always positive for an educator’s actions or insights [33]. Affordances may also be barriers to action [7]. For instance, Bouwma-Gearhart and colleagues found that frequent formative assessments that took up class time could act as barriers if faculty felt pressed to cover large quantities of specific types of content. We use perceived affordance theory to illuminate the realities of educators operating in complex socio-cultural systems in light of their professional realities, including their pedagogical knowledge, skills, norms, and felt competencies.
2.2. Research Questions
Our exploratory research is guided by the following questions:
- What are the instructional data-use practices of a sample of STEM faculty from one U.S. research university and why?
- What affordances and constraints, including instructional technologies, do these faculty claim regarding their instructional data-use practices?
- To what extent do faculty engage students in reflecting on their own learning data?
2.3. Study Context
This study took place at one large university in the United States, classified in the Carnegie Classification of Institutions of Higher Education [36] as a “doctoral university with the highest research activity”. A comprehensive (campus-wide) STEM education improvement initiative was underway to foster evidence-based instructional improvements in large-enrollment, lower-division STEM courses by leveraging the distributed expertise of faculty to learn from one another. Funded by the National Science Foundation, a project research goal was to investigate changing faculty perceptions of teaching and their teaching-related practices in light of the initiative activities. This paper centers around findings from interview data collected near the end of the initiative, in 2017, specifically around the questions exploring faculty instructional data-use practices.
Participant Sample and Data Collection
Prior to collecting the interview data that roots this paper, surveys were sent to 420 faculty across STEM disciplines with 127 faculty responding, a 30% response rate. Table 1 shows the total number of survey respondents in each of the disciplines surveyed.
Quantitative survey data were collected to ascertain the influence of the initiative’s various aspects and inform subsequent interview protocol development. While the survey and interviews, focused on various aspects of the teaching of interest to the larger NSF-funded project, this paper focuses solely on faculty experiences around instructional data use.
We used descriptive analysis from three survey questions to probe for faculty perceptions of the larger group regarding their gathering, analyzing, and responding to data that informed their teaching. Respondents indicated their level of agreement on a scale of 0 (Not true at all), 2 (Somewhat true), and 4 (Very true) to the following prompts:
- I know how to gather, analyze, and respond to data that informs my teaching.
- I regularly gather, analyze, and respond to data that informs my teaching.
- I am committed to gathering, analyzing, and responding to data that informs my teaching.
When faculty were asked if they regularly gather, analyze, and respond to data that informs their teaching, the results of the 127 faculty surveyed were a mean score of 2.50 (“Somewhat true” on a 5-point scale; SD = 1.04). Faculty indicated a slightly higher mean of 2.74 (“Somewhat true”; SD = 1.02) when asked if they were committed to gathering, analyzing, and responding to data. Faculty indicated a mean score of 2.75 (“Somewhat true”; SD = 0.94) when asked whether they knew how to gather, analyze, and respond to data that informed their teaching (see Table 2). A standard deviation of approximately one showed a relatively uniform view of faculty perceptions regarding instructional data use.
These survey results prompted us to explore instructional data use in interviews to allow richer data around these issues. From those responding to the survey, invitations were sent to faculty across the represented disciplines to conduct interviews. Nineteen out of twenty-one faculty invitees consented to interviews (90% response rate). (See Appendix A for full interview protocol.) An external project evaluator conducted the semi-structured interviews, which lasted approximately one hour.
Table 3 shows disciplines, participant pseudonyms, and professional positions for the 19 STEM faculty who participated in the interviews for this study. Faculty disciplines included physics, biology, chemistry, mathematics, and engineering (chemical, biological, environmental, and mechanical engineering). Nine of the faculty were in tenure-track faculty positions (assistant, associate, and full professor), and ten were in fixed-term faculty positions (instructor and senior instructor). Participants had taught at least one lower-division STEM course in the previous year and were involved in the campus initiative. Race/ethnicity and gender data were not collected in this study, and we do not want to make assumptions about participants’ identities. We were further concerned with ensuring anonymity given the sample size, identification of disciplines, and professional positions of a group of faculty from just one university. Thus, we use pseudonyms that we perceive as gender-neutral.
2.4. Data Analysis
Data analyzed from the interviews for this paper pertained to the following questions:
- I’d like to hear more about your assessment practices while teaching.
- To what extent do you collect data/information about student learning?
- Are your teaching practices informed by data/information about student learning?
- Are there means in the classes/courses that you teach for students to reflect on their own learning data? (If yes), Can you detail these processes?
Interviews were transcribed verbatim and transferred to Dedoose coding software for qualitative analysis. The first author created inductive codes from a first read of the verbatim transcripts, drawing perspectives from interviewees’ own words in response to interview questions [37]. We attempted to stay grounded in faculty descriptions and matching those with definitions of the concepts. During both rounds of coding and analysis, the first analyst created theoretical memos [38] to provide a record of developing ideas and interconnections.
We used several methods put forth by Creswell [39], pp. 201–202 to address our findings’ trustworthiness. One method we used to ensure the trustworthiness of the analysis was peer debriefing. The second author supported the codes’ development and participated in debriefing and data analysis sessions with the first author throughout the coding and analysis of the data. The second author also reviewed 20% of the coding to increase reliability and consistency and provide ongoing contributions to the emerging codebook. (See Appendix B for codes.) In both phases, the authors discussed emerging concepts and themes based on their critical reflections on the data, and an ongoing discussion of codes and interpretations addressed (dis)agreements within the data [37]. At least two interviewees made all the claims we report in this paper. We included exact numbers of participants in conveying claims.
2.5. Limitations
We acknowledge the multiple limitations of our research. For one, our study took place at one institution with one improvement initiative targeting select STEM disciplines. Overall, our exploratory study is based on a small sample size, with some claims voiced by a few and, in some cases, two participants. As well, faculty who agreed to be interviewed may represent a biased sample of faculty who were engaged in making improvements via some affiliation with a campus-based improvement initiative, and thus, may not fully reflect the larger population of STEM faculty. Disciplinary norms and practices, which may influence faculty practices and perspectives, were also not explored per limited sample size. We did not collect observations of actual faculty data practices, including how faculty reacted to data or how types of data linked with any corresponding faculty actions across our sample. Finally, although we discuss our findings in light of past research around the effectiveness of types of data or faculty data-use practices, we did not collect data that would allow comment on effectiveness.
3. Results
3.1. Types of Instructional Data Faculty Collected
3.1.1. Summative Data-Use Practices
All faculty indicated that they collected summative data to inform them about their students’ learning. Summative instructional data generally included a combination of mid-term and final exams, quizzes, and, to a lesser extent, written assignments. Typically, these assessments were quantitative (e.g., multiple-choice) if class sizes were large and generally administered two to three times during the term. A majority of faculty perceived summative evaluations as an effective measure of student learning and determinants of grades.
Robin (physics) indicated that 70% of their students’ grades came from exams, including two exams around “mid-term” and a final course exam. They felt these types of assessments, and the data they generated, gave them the best opportunity to know what an individual student comprehended.
Let’s start by saying roughly 70% of my student grades come from exams. There’s two midterms, and a final and those are the best way that I know that student is presenting me the information that they personally know and they’re not working with others.
Alex, a chemistry instructor, described these summative data-use practices as “traditional,” utilized, in part, because of the significant number of students in their classes. They described weekly individual quizzes, mid-term, and final exams consisting primarily of multiple-choice questions out of necessity, although they did have some open-ended questions on the exams.
We do very traditional assessments in a sense because, in the fall term, we have fourteen hundred students. We have ten weekly quizzes, and those are individual. We have ten small group activities, one per week. We have two midterm exams and a final consisting of a section of multiple-choice, which is out of practicality, and about forty percent of that exam is open-ended, so it’s free-response for students.
3.1.2. Perception of Changes to Summative Data Practices
While acknowledging the need for summative data-use practices, some faculty also signaled their data practices were shifting away from typical exams as the only determinant of student learning to other means such as group exams. A few faculty (4) described how they felt relying only on summative data-use practices was problematic, per student diversity and in terms of data quality. Two faculty indicated concern that typical means of gathering summative data (e.g., exams) did not allow all students ample opportunities to show what they had learned and, thus, did not accurately reflect student progress. These faculty also felt typical exams did not provide them with sufficient data to determine students’ course grades and sought to minimize the use of summative data-use practices as the primary determinant of these grades.
Tracy, a chemistry instructor, exemplified both of these findings. Tracy described a shift they had made away from exams as the sole determination of students’ grades to a grading structure that allowed for over fifty percent of the final grade to be determined by students’ work on papers, class presentations, and online work. Some of these activities involved group work. Nonetheless, they were considered a significant part of the grade students earned. Tracy discussed how they were deemphasizing formal exams and a desire to engage students more actively in the material. Tracy stated,
This year was a pretty dramatic change to over fifty percent of the grade, and the assessment was not exam-based. So the students were writing papers, which they got formative feedback on, and they were developing presentations that they gave in class and also published on the website where they also had some feedback and revision steps there. Teaching assistants were assigned to some of those activities, so they hopefully got some fairly frequent feedback. Most people were working in groups rather than individually on some of those assignments, sharing their results, presenting them, and all of that was pretty high stakes because the total for those activities like I said, was over half the grade. So we deemphasized formal exams, there were midterms and final exams, but they were lower stakes. That came out of both the desire to get students more actively engaged in the material. On the assessment end, I think we’ve recognized, I’ve seen over many years, that exams are great for many students, but I think they don’t measure all student activity and success and learning.
Tracy perceived that adding different student assessments to their teaching repertoire resulted in more traditional ones feeling like “lower stakes” for students.
3.1.3. Formative Data-Use Practices
Nine faculty (47%) described engaging in collecting formative instructional data, which they felt gave them immediate information about student learning. These included qualitative forms of data, either curricular artifacts or verbal information qualitatively gathered from students. Nine faculty (47%) described collecting this type of formative data, described as “submission sheets,” “exit points,” “muddiest points,” or “Tuesday problem.” These activities required students to evaluate or respond to a question or statement related to course content. These activities resulted in data artifacts that faculty stated informed them about their students, learning, and interests. These activities were often described as “low stakes” for students, supposedly concerning more typical assessments of their learning (e.g., formal exams).
Drew, a mathematics instructor, described using “exit cards” at the end of class to assess students’ level of understanding or confusion. They allowed students to be anonymous in their submission. They described this activity as giving them a quick opportunity to see what students were learning and what might need to be addressed again. They said it in this way, indicating some benefit of the anonymous, low-states (not graded) nature of the activity for students.
In terms of formative assessment, I have used things like exit cards, where at the end of a class, I just have students [write down a question or comment]. There’s no grade at all attached to this. It’s just for me to get some sense of what did you [student] think was the most significant thing you learned today, what was the muddiest point. These kinds of quick questions that people jot down on a card and can even be anonymous, and then a quick look through all of that gives me a sense of, ‘oh wow,’ I really missed the boat here. I need to re-address that topic again.
Lee, an engineering instructor, talked about using “muddiest point” activities that gave him information about topics that students wanted to know more about. Lee also perceived these formative assessments as providing him data about students’ understanding of the concepts and via a low-stress activity to assess their level of understanding. Lee stated that the activity allowed insight into.
...whether they want more coverage on a specific subject. In terms of reflecting on their own performance, I certainly think that when you make an assignment like full credit for participation or sort of the check if they are there working and engaged, it also sends a message to them about how they engage in the material. Both of those were sort of meant to reward them for being there and engaging, but not making it so high stakes, so it wasn’t supposed to be a stress out sort of thing.
Lee also felt giving credit for these kinds of assignments sent a message to students about the importance of attendance and being engaged in the assignments. Like Drew, Lee discussed this being lower stakes for the students.
Lynn, another engineering instructor, described using an activity they called “the Tuesday problem.” This activity would give students a problem to work on during a break during a class. After the break, they walked around to observe and help students who presented as needing extra attention. Like Drew and Lee, Lynn indicated this activity gave them an informal way to engage with students, resulting in a less stressful assessment activity for them. Lynn described it this way,
The Tuesday problem or something like this, where I take a break in a two-hour lecture, a ten-minute break, and I put up a problem, and I say you guys are welcome to solve it or not, but when we get back from the ten minutes I’ll solve it, and then we’ll talk about it, and you put it up, and you walk around, and you see if people are trying and you kind of help them, or you give them pointers on what direction to go. So there is a way to create way more informal engagement by doing things that way because there’s very little stress because it doesn’t count for any points, really.
As Lynn also alluded to, faculty also detailed gathering verbal forms of data (i.e., talking with others) to provide them with information about their students’ learning. Six faculty (32%) spoke of collecting instructional data through verbal interactions with students, usually informally, to gather information.
Jordan, a chemistry instructor, spoke about providing an open environment for students to discuss challenges and fears. They described how talking and interacting with students allowed them to “have a discussion about the growing pains of going through science education.” Sidney (chemistry) said that informal interactions with students gave them some of the most valuable instructional data they collected. They describe how most of their assessments, depending on the course, were done through these informal, information-gathering interactions with students to determine if students liked the course or what parts they did not like.
Most of my assessment, and I think this is true for most people, comes from informal interactions. Of course, it depends on the course, but oftentimes I informally really try to just talk to students as much as I can and see how things are going. I often say, ‘Hey, what do you like about the course? What don’t you like?’—again, about as informal as could be, but I sometimes find those are most valuable.
Another faculty, Bailey (engineering), similarly talked about informal interactions with students to gather information about their courses. They indicated using their office hours and visits from students to ask them questions about how they were feeling about the content that was being taught. They even probed via questions to students about whether students understood a particular concept that the instructor was trying to convey.
Then students in office hours, if they seem willing, I’ll often ask how do you feel about this content area, or even more specific things like I tried to tell you this, did you notice that in class, or do I need to do that differently.
Another faculty, Peyton (biology), talked about meeting with students frequently to assess what students were saying to understand where they were and where the instructor thought they ought to be. Peyton said,
I meet with my students a lot, so I hear what they’re saying, and I use that to inform where they’re at and where I think they need to be.
Two faculty described how talking with their teaching or learning assistants provided them insight into student learning. In this excerpt, Robin (physics) described a learning assistant program they developed that allowed them another way to collect formative types of data on students. During weekly meetings, the learning assistants provide feedback to the instructor about students, including what they perceived to be working or not working. Robin said,
Qualitatively, I’m talking to my students constantly. I’ve developed a learning assistant program, so I have ten learning assistants, and they’re constantly giving me feedback about what’s working, what’s not working, helping me try to guide the students. And I have seven T.A.’s [teaching assistants] at any given moment, and we also have meetings every week.
Looking across these data, two main goals were apparent. Faculty collected instructional data to assign student grades and to assess learning. Some faculty recognized that certain summative data, from exams, was not adequately allowing for meaningful assessment and grading of students, thus motivating them to also collect other types of instruction-related data. Some faculty also went so far as to comment that data around student learning then allowed them to plan for future teaching (i.e., reteaching or teaching in a way that students most appreciated), to secure better student understanding or success. Faculty linked timely impact on teaching practices to formative forms of data.
3.2. Affordances That Influenced Instructional Data-Use Practices
3.2.1. Faculty and Organizational Student Assessment Norms
We also found several affordances that influenced the instructional data-use practices of faculty. Not surprisingly, they often pointed to data they collected that provided insight around their teaching as data types and means that were norms for them as practitioners and within their larger organizations. For example, more traditional types of student learning assessments (i.e., exams, written assignments) remained privileged by faculty and their departments. Thus, faculty kept using them and claimed to be informed of students’ progress via them. Nevertheless, many faculty also claimed a desire for other data to inform them in ways that more traditional assessments did not. Narrative and verbal types of data, for some students, provided them novel data around students’ understanding and provided them more timely feedback for more immediate response to students, like “submission sheets,” “exit points,” “muddiest points,” or the “Tuesday problem” exercise. Generally, faculty relied on “tried and true” methods, like course exams, to gather summative, often quantitative data to inform their teaching. When they sought different or more complete information or to help students feel more comfortable and relaxed in providing them with information around their learning, some faculty gathered and utilized other data, namely formative and largely qualitative.
Learning and teaching assistants were another affordance that two faculty used to gather data on students’ performance. As described by one faculty, the development of a learning assistant program afforded them feedback on what was working or not related to students’ learning.
3.2.2. Instructional Technologies
Eleven faculty (58%) reported that instructional technologies afforded them opportunities to collect and analyze data to inform their teaching. These included audience response systems (i.e., clickers), online platforms for homework or other course materials, and adaptive learning technologies. Overall, faculty detailed these technologies in comparison to when they did not have them or had to rely on more traditional, or lower-tech data gathering means. The instructional technologies allowed more timely and complete data to respond to more immediately in practice.
Several faculty used clickers, which they claimed provided them in-the-moment snapshots of students’ levels of understanding and the opportunity to correct student (mis)comprehensions. Peyton, a biology instructor, noted that if the class scored below 85% on the clicker question, they knew they needed to add an immediate class discussion, asking students to explain why they chose their answers. Peyton explained,
Whenever we have a clicker response that’s less than 85%, we’ll spend time talking about why the right answer is right, why the wrong answer is wrong, and I’m always soliciting their voices for that. I’ve moved away from me explaining to getting them to explain and then affirming.
Several faculty discussed the formative nature of the data they were collecting. In this example, Peyton (biology) again described doing formative assessment using clickers, alongside having students complete daily group assessments that they could then read after class to inform subsequent teaching practice. Peyton said,
I do formative assessment in my classes through clickers, but I also have daily what I call submission sheets, so the groups work together to answer a couple of concept type questions, and they turn those into me, and I read those each day.
Several faculty talked about having students complete homework and pre-class quizzes on online platforms, which they claimed afforded them a quick, formative assessment of student comprehension, allowing them more immediate adjustment to their instructional practices. For example, Sidney, a chemistry instructor, noted that students took a pre-class quiz after first viewing a video in an online course environment. Before the class session, Sidney would meet with colleagues who were also teaching the class to discuss understanding as reflected by the quizzes across the complete array of students in the course. Sidney noted they had built flexibility into their courses to adjust their instruction to accommodate any changes that such data indicated the need for. Sidney stated this process was an improvement to trying to ascertain student understanding from, perhaps, fewer students that they could check in with in class.
Students are supposed to take a pre-class quiz, but the catch is that in order to be able to access it, they have to have first viewed the video. So ideally, it sort of forces them to watch the video and then take the quiz. The nice thing was that I and the colleague I taught with, we would have a discussion before class every time of, ‘Hey, what questions on the quiz were they really getting? Which questions didn’t they get?’… we were flexible enough that we could go into class that day and say, ‘Hey, you know we realized we should spend a little more time on this.’ That was a huge change that we hadn’t [done previously]—we might have gotten a feel for it kind of walking around talking to students, but there we had very nice concrete data to inform what we would do and enough flexibility built in that we could say, ‘Hey, today we’re going to spend some more time going through Topic A quickly because most of you seem to be fine with that and spend more time on Topic B.
Two faculty described adaptive learning technologies as affording them more immediately actionable data around their students’ learning. Alex (chemistry) described adaptive technology as “a real eye-opener” related to their ability to respond and change their curriculum within days.
Adaptive learning has certainly been a refinement that I made because I went from an adaptive learning model where changes were being made to the curriculum based on student understanding, perhaps term by term, and now I’ve shortened that gap where feedback is immediate, evaluation is immediate, and then changes could be made for the very next assignment, which would be the next meeting. So I think that has been a real eye-opener in refining the response time, in that a change to the curriculum is not occurring the next term it’s occurring within the term, and, as a matter of fact, up to within two days.
Jodi (biology) found the adaptive learning technologies helpful in understanding trends over time and particularly useful in understanding how underrepresented and first-generation students were doing and where they might need more support.
I think the predictive analytics things are useful if it’s things like underrepresented minorities, first-generation college students, information like that, like more of the demographics of who my students are to figure out if there are pockets of the population that aren’t doing really well in the class.
3.3. Impediments to Instructional Data-Use Practices
Faculty perceived several impediments to their instructional data-use practices. Constraints included (a) a perceived lack of time needed to implement instructional data-use practices, (b) standardization of course content, and (c) perceived lack of confidence and competence in instructional data-use practices.
3.3.1. Perceived Lack of Time to Engage in Instructional Data-Use Practices
Six faculty described how some instructional data-use practices took a great deal of time to implement and were therefore difficult to utilize effectively. Casey, a chemistry instructor, said that time constraints hindered their ability to try new or innovative practices, and they viewed this as a problem with implementing new practices.
Time constraints definitely hinder it [data-use practices], and they hinder actually doing anything innovative. That’s actually a huge problem.
Madison, a mathematics instructor, saw instructional data-use practices as necessary, but those practices were often pushed to the side by other instructional activities. They said, “Important things [like collecting instructional data] go to the back burner when the rubber hits the road, even when you know they’re important.” One faculty talked about the difficulty of fitting the instructional data-use practices into their curriculum. They wanted to do more and thought it was necessary but felt constrained by established practices.
That’s definitely something I’ve wanted to do more of, just the issue of where do you fit that into the curriculum, but I think that’s important, and I wish I was doing more.
Two faculty stated their instructional data-use practices were constrained by a lack of time, as they often taught large classes. Casey, chemistry, elaborated that large class size can equate with a lack of time to implement instructional data-use practices, at least ones they felt significant. They described having students complete short writing assignments if students were struggling. Although they acknowledged that students gained from this experience, they also acknowledged that this type of practice was difficult to do with hundreds of students to measure student learning. Casey said,
A lot of times, I’ll do a short writing assignment, especially if I think they’re struggling with a concept, I’ll have them write about it. But there’s hundreds of them, so it’s difficult to get a lot out of that, although the students get a lot out of it.
Madison, mathematics, felt constrained by class sizes and the number of classes that instructors taught per quarter, and other responsibilities that influence data-use practices such as making exams predominantly multiple-choice.
Because of the class sizes and some people are teaching, some of the instructors are teaching four courses per quarter. I have another portion of my job is managing the math learning center, so I usually only teach three, but when they have that size classes, a large portion of the exam needs to be multiple choice.
3.3.2. Constraints Due to the Standardization of Course Content
Several faculty (5) perceived constraints in using different kinds of instructional data-use practices due to the “standardization” of course content taught by various faculty and usually indicated requirements for standardized exams and grading policies. In some cases, these constraints were tied to whether the course was a sizable lower-division course taught by several faculty simultaneously at the same institution. In other cases, faculty described being constrained in their practices if the course was also taught at a community college or as a dual credit option in local high schools. While all faculty indicated they had autonomy concerning how they taught, several faculty indicated they were constrained by requirements related to student assessments of learning. Kelly, mathematics, said, “Most of the assessment I do is out of my control. Sixty-five to seventy-five percent of the grade for the courses I teach have to come from two midterms and a final.” Notably, such realities were most often detailed by mathematics faculty. Still, Kelly talked about moving towards more group exams, a novel practice, and described the reluctance (i.e., constraint) within their department to adopt this practice.
I’m slowly trying to have conversations with the powers that be in the department to be adjustable [with doing exams] so maybe we’ll do group exams, or maybe we’ll try some other things other than just those very traditional midterm and final exam structures.
3.3.3. Perceived Lack of Confidence and Competence in Instructional Data-Use Practices
Several faculty (4) stated a lack of confidence and competence in collecting and using instructional data to inform teaching practices. Bailey, an engineering instructor, described their instructional data-use practices as “terrible” in relation to more effective practices that they knew existed but did not know enough to implement.
Yeah, they’re [instructional data-use practices] terrible. I know enough to reject a lot of common practices, but not enough to replace them with better alternatives. So I am really struggling with that right now. It’s not formulated at all.
Leslie (mathematics) also perceived instructional data-use practices as the weakest part of their teaching. They understood the importance of assessing student learning and formative practices specifically but struggled to respond to data in their teaching practice directly.
I would say that’s probably the weakest part of my teaching practice. I’m not really formal about incorporating results of assessment into teaching, which sounds pretty bad. Yeah. Formative assessment, I read the literature, I drink the kool-aid, but that is the thing I drop the most in terms of my teaching practice. What I do is so informal. I don’t know if I can even describe it.
Another faculty was uncomfortable with their colleagues finding out about their instructional data-use practices. They perceived pushback that could result, partially based on their already being seen as an outsider in their field per their gender. They did not want to advertise what they did differently because of the possible repercussions they would experience.
You know, gender-wise, honestly, I’ve come into this profession, and I’ve been an outsider. I’m not going to take something I do that’s different than what other faculty members do and advertise it. I may be very successful at it, but if I advertise it, there will be repercussions.
3.4. Engaging Students in Reflecting on Their Own Learning Data
The overall sample was mixed in their practice of engaging students in reflecting on their own learning data. A slight majority of faculty (n = 10, 53%) indicated that they did not implement any instructional practices for students to engage with or reflect on data around their learning. Of these instructors, five instructors stated they did use formative data to inform their teaching practices. However, they did not explicitly use these data to engage students in reflecting on their learning. Lynn, engineering, described providing students with exam scores, a bell curve showing averages, and the range of grades, but no other data. When asked if students had an opportunity to reflect on their learning, they said,
Oh, no. Not aside for their own grades. They see averages and things like that. I guess that’s really professor-dependent, but for me, whenever I go over the exam, I always put out the bell curve and say this is the average, this is the standard deviation, this is the range of grades.
Two faculty mentioned the institution’s end-of-term student evaluation of teaching survey as a means of students reflecting on their learning. One faculty stated they added a question to the survey related to whether students understood a particular concept covered in the course. Tracy, a chemistry teacher, said they would advocate for other faculty to do this kind of practice.
That’s the one where we add the question on their electronic evaluation of teaching, so in the electronic evaluation of teaching for the students, there’s a series of standard questions, I think there’s ten, how was the course basically, what was the instructor’s contribution to the course and there’s a few others, and then I add, and I advocate for all other faculty to do this as well, you add at the end of this course [a specific question related to the content].
Still, around half of the faculty (n = 9, 47%) indicated they implement instructional practices that engaged students in reflecting on their learning data. These practices were generally described as activities in which students were asked to reflect on their overall performance in class and how their use of study techniques may (or not) be helping them. Jordan, a chemistry instructor, stated, “I really try to actively engage them in utilizing critical self-review and then coming together with others once that review has taken place to gather the information necessary to move forward.”
Alex (chemistry) described posing to students open-ended questions on worksheets, asking them to describe whether they understood the material and how comfortable they were with their learning. Alex perceived this type of student reflection as allowing students more autonomy with their learning.
[in the student’s voice] “I understood this material, I feel comfortable with this material,” and then they [students] produce a little bit of evidence and they will say things like “I am completely lost on buffer systems, I have no idea what is happening in a buffer system. I don’t even know what a buffer system is.” I think that’s part of the empowerment [of students]. I think that’s part of their confidence in that this seems to be very meta. So, students are plugged into their empowerment and their own understanding. They’re not looking at it as how I did on an exam. They’re looking at it as, I think I get this, I’m supposed to be learning these key concepts.
Drew, a mathematics instructor, had students keep a journal of their progress in understanding course concepts and any related difficulties. Students received credit for their reflections.
In some courses, I’ve gone as far as actually having students keep a journal of what they struggled with that they actually turn in with the homework. So there’s actually some “credit” awarded for going through that exercise. But I think the bigger value of that is getting the students themselves to reflect on their own learning.
Jodi, a biology instructor, had students do “real-time” writing in class in response to a question. They would write on a notecard and hand it in. While this served as formative feedback for Jodi around her practice, she also saw it as an opportunity for students to reflect on their learning data.
When I’m teaching in the classroom, I also have them do some real-time writing. I think writing is a really good way to start to help them see what they don’t understand. So I have them do an individual note card where they write down an answer to a prompt, and then I have someone else, not me, read them, because there are seven hundred of them, and give me some summaries, and then I go back over that with them in the class as sort of a way to see if their thinking is right or what is a good response to these things versus what’s not a good response to these things. So those are kind of the way I think that they get to reflect on what they’re learning.
Lee, engineering, used a formative instructional data-use practice, “the muddiest point type thing,” to have students reflect on their level of understanding.
I often will do the muddiest point type thing, which has them reflect not so much on performance but on their level of understanding.
Two faculty described using peer or small group activities to afford students opportunities to reflect on their learning. Casey, chemistry, has students complete short writing assignments, especially if they struggle with a concept. They describe collecting the writing but also giving students time to share in groups with assigned friends.
Sometimes they give them to me. They are in groups, they have assigned friends in my class, so they do share among their group members also.
Kelly, a mathematics instructor, had students engage in self-reflective activities during a “recitation class,” where students from a large-enrollment main class meet in smaller groups to work. Students discussed their homework assignments and compared answers to those given by the instructor.
It [student reflection on their own learning data] gets facilitated in smaller groups, in like a recitation situation. So normally my lecture would have a hundred people and then one day a week there’s four different classes of twenty-five. When [students] get their written homework back with some sort of marks on it, they’re encouraged to look over that and discuss the solutions that have been provided by me. They’re asked to compare and contrast between what their answer looks like, what the solution organization looks like. It’s the logical thought process of putting things together that I want them to focus on. So it’s sort of done in small groups, face-to-face discussions.
4. Discussion
4.1. Instructional Data-Use Practices and Motivations
In this paper, we report on a study of STEM faculty members’ instructional data-use practices, including the types of instructional data that faculty collected. In general, faculty claimed to use multiple instructional data-use practices to inform their teaching practices and their students’ learning. We found that all faculty described mostly gathering data via summative assessments, such as mid-term and final exams and weekly quizzes. While a few faculty also discussed written assignments they generally gathered, most data coming from summative assessments were qualitative in nature. Faculty indicated they used these assessments most often in classes they described as large-enrollment and generally administered them two or three times during the term. Most faculty perceived summative assessments as practical in providing measurements of student learning and determining grades. Several faculty indicated these were the only means for individual students to demonstrate what they had learned as opposed to other types of more formative assessments or group work.
However, a few faculty acknowledged that summative evaluations did not always reflect student progress. For these faculty, their perceptions of the value (i.e., importance) and function (i.e., purpose) of summative assessments had evolved to privilege more formative assessments. Several of these faculty indicated their concern that diverse students did not have ample opportunities to demonstrate their learning via more traditional and common (i.e., summative and qualitative in type) assessments, in essence questioning the quality of the data to inform their teaching. These practices minimized the impact of more common and traditional assessments on students’ overall grades in the course. A small number of faculty were considering experimenting with students working in small groups and giving presentations, instead of formal exams, or having students take exams together; a practice that faculty perceived would need further discussion with department colleagues or leadership before implementing.
Roughly half of the faculty we interviewed also gathered formative data that they perceived gave them more immediate ways to assess student learning. Much of this data was qualitative in nature, collected via course artifacts or verbal exchanges. Such artifacts as “submission sheets” and “muddiest points” asked students to evaluate or respond to a prompt or question about the course content. The purpose of these novel strategies was to intentionally provide a more collaborative and inclusive process for students to demonstrate their learning that still offered them insight into students’ learning and interests. Faculty also described these as less stressful (“low stakes”) for students when compared to formal exams.
Some of these findings indicated an awareness on the part of faculty that not all students bring the same background and experience to STEM coursework, which would make more traditional and common assessments less than meaningful for them as educators. These faculty, thus, knew to implement other assessments that would allow a wider array of students to demonstrate the learning and progress faculty expected they were making. Faculty use of activities that provide students with “low stake” options seemed especially promising in promoting students’ success across the diversity of learners in their courses. Through their implementation of these less stressful assessments, faculty also provided students means to ask for more review or coverage of particular topics. As they did this, faculty may have been engaging students in determining the pace and depth of content coverage, all the while sending a message to students about their role and agency in their learning. These faculty practices are promising per research that demonstrates a recognition of student achievement and faculty responsibility in creating more equitable learning environments [40,41].
Some of the formative data that faculty collected were of verbal form, described as some of the most informative data faculty collected about how students were doing in their courses. These included having an open discussion in class, talking to students during office hours, and talking with learning and teaching assistants about student progress. These findings are also promising, as faculty interactions with students are essential in building rapport and positive relationships with students [42] and can ultimately enhance student success [43]. Many of these interactions resulted in verbal data that were described as informal, such as asking students questions during office hours or talking with them one-on-one during class or as groups in work sessions. While we did not explore with faculty the proportion of students faculty connected with via these informal interactions, we assume that these informal interactions may not have involved all, or even most, students. There may, in fact, be a reason to be concerned that some students may find these interactions with faculty intimidating and be unwilling to share areas where they may be struggling due to their perceptions of the potential reactions of the faculty. Some students, additionally, may feel unable to initiate such interactions (as during office hour visits). This reality may position students not comfortable, agentic enough, or able to make time to talk with their instructors at a disadvantage [43,44], including those struggling as well as those succeeding, both groups that can provide faculty important insights into their teaching. A few faculty described using their learning and teaching assistants’ assessments of student comfort and understanding of the material as indicators of student progress. This strategy provided indirect data gathering from students that may counteract our last concern, allowing faculty insight from students who do not feel comfortable talking to them directly. Faculty might consider fostering more of these interactions of their students with others who students may see more as peers to collect meaningful and timely, learning-related data to inform their teaching.
Additionally, we need to consider the potential limitations of data that faculty reported collecting, including those which may seem to be more anecdotal. Andrews and Lemons [17] found that postsecondary biology faculty primarily relied on personal perceptions and experiences rather than empirical evidence to inform their teaching practice. They found that using data to convince faculty to change was ineffective. Indeed, this may be one reason that faculty may not be willing to change comfortable, already established practices, especially if departmental climates further stifle the implementation of novel practices. Professional developers and education leaders might need to help faculty recognize this limitation and find a “sweet spot” between the comfort, ease, and meaning they feel (for themselves and students) around verbal, informal formative data and data that is also valid and reliable. Faculty in our study indicated a concern for the meaningfulness of more common, traditional assessments such as multiple-choice exams that may not demonstrate student learning. Overall, our study points to how we must help them evaluate, modify, and create instructional data-use systems that sit at the intersection of being reliable and valid, as well as meaningful and usable. These systems must also be practical, timely, and engaging for a majority of diverse students.
4.2. Impediments to (Meaningful) Faculty Instructional Data-Use Practices
Many of the summative and formative data types we heard about were consistent with Bouwma-Gearhart’s [4] and Hora et al.’s [5] research with postsecondary STEM faculty. These researchers, too, found a diverse repertoire of practices used to measure student learning to inform their teaching. They, too, found that most faculty relied predominantly on summative and largely quantitative forms of data to inform teachings. Some faculty also relied heavily on formative and qualitative forms. Also consistent with the findings of Bouwma-Gearhart, Hora, and colleagues were the constraints that faculty identified as limiting their instructional data-use practices. These impediments included a perceived lack of time needed to implement instructional data-use practices, standardization of course content that restricted the types of practices used, and departmental structures that determined some types of practices. Like Bouwma-Gearhart, Hora, and colleagues’ research, ours suggested that many STEM faculty may generally not feel prepared or empowered to effectively utilize diverse forms of instructional data to inform their teaching practice. Survey data that helped to motivate this study (detailed in the methodology section of this paper) pointed to a general lack of confidence and competence in collecting and using instructional data by faculty. Our study confirms this, mainly around qualitative and formative types of data.
Our faculty participants noted several nuances around the impediments to their instruction data-use practices. Specifically, time constraints revolved around certain types of formative assessments (e.g., journaling, group exercises), especially in large classes. Although faculty acknowledged that these formative assessments were valuable and even necessary, they were not always implemented. In part, faculty felt pressed to cover content, which suggests a perception that certain types of instructional data-use practices (e.g., formative) were somehow outside regular teaching norms and therefore needed to be added or fit into the class.
Notable too were mathematics instructors’ laments of the “standardization” of course content. This usually indicated departmental requirements for common exams and grading policies. In some cases, this indicated large introductory courses that were taught by multiple faculty. These departmental structures suggested that faculty were not empowered to gather, analyze, and use instructional data to meaningfully inform their specific teaching-related questions and practices or to help students reflect on their learning achievements, a reality hinted at elsewhere in the literature (e.g., [5,23]).
Those faculty stating a lack of confidence and competence in collecting and using instructional data admitted it was the weakest part of their teaching. Faculty understood the importance of using instructional data-use practices to assess student learning, but they struggled with responding to data in their teaching practices. One faculty, additionally, was uncomfortable with their colleagues finding out about what they did to assess student learning. They perceived pushback from colleagues, partially based on their perception of being seen as an outsider in the field per their gender.
Attending to faculty comfort and norms with instructional data-use practices is one step in promoting faculty engagement in this research-confirmed practice to improve teaching. Interestingly, in comparison to Bouwma-Gearhart, Hora, and colleagues’ study, faculty in our study were all involved in teaching improvement initiative activities and had largely been involved in multiple teaching improvement initiatives in their past. Arguably we might assume these STEM faculty are the most confident and competent (when compared to peers not engaging in such initiatives) in gathering, analyzing, and responding to data. Limited research points to STEM faculty members’ participation in teaching professional development opportunities as predicted by their previous participation, as long as past opportunities were meaningful; in essence, those involved in improvement initiatives should be some of the most aware and practiced in implementing research-based teaching practices [45,46,47]. If this rationale is correct, and arguably we are in need of more research to confirm this, it points to multiple implications, namely that 1) many (most?) initiatives still do not focus on instructional data-use practices, and/or 2) such initiatives are not especially fruitful in expanding faculty practice around instructional data-use. Either reality presents implications for department leaders and professional development experts who aspire to support faculty development towards improvements to their teaching and, ultimately, student success.
4.3. Supports of Faculty Data-Use Practices
Faculty claimed multiple affordances for their instructional data-use practices that informed their decisions related to their teaching. Most faculty pointed to data they collected that provided insight around their teaching as data types and means that were norms for them as practitioners within their larger departments and organizations. Most faculty and departments privileged traditional types of student learning data such as exams and written assignments. Nevertheless, faculty also claimed they used other data to inform them of students’ learning, not traditional assessments. Several faculty claimed narrative and verbal forms, as discussed earlier, provided them novel and timely data to assess student learning and allowed them opportunities to interact and respond to students. However, most faculty still relied primarily on traditional methods, like exams, to gather quantitative data to inform their teaching. Faculty did seek different and more nuanced information, largely qualitative and formative, and several faculty tried to help students feel more comfortable and relaxed in demonstrating what they had learned. Learning and teaching assistants were other affordances that a few faculty used to gather data on students’ achievements. Those faculty described developing a learning assistant program made up of former students who provided feedback on what was working or not related to the courses and students’ understanding of concepts and content.
We found instructional technology afforded most faculty multiple instructional data-use practices by providing them with opportunities to collect and use data in different ways, such as clickers, online homework, adaptive learning tools, and other uses. Faculty who incorporated instructional technology tools in collecting student learning data were more likely to collect formative types of data. Having relatively easy access to large amounts of formative data encouraged faculty to collect this type of data more often and make more immediate or next-class-meeting changes to what content faculty would teach and what teaching strategies they would use. Instructional technology eased the burden of collecting, especially in large classes. In some cases, this allowed instructors to share student learning data with their students more readily. Faculty also used instructional technologies to assess trends in different groups of students, suggesting that some faculty intentionally recognize and attend to achievement gaps. In short, faculty who used instructional technology to collect data, largely formative, indicated they modified their instructional practices more often and quickly than those who collected data in other ways. Furthermore, they were more likely to engage students in reflecting on their learning. We think this finding is important because it adds to our understanding of how faculty perceive the instructional technology often, though not always, at their disposal, technologies that are often pointed to as allowing educators’ data-based decision-making. Indeed, the faculty we spoke to claimed instructional technologies afforded them collecting different kinds of data and the ability to assess trends in student learning in a timely manner. Our research somewhat confirms the exploratory research of Hora and Holden [23] on the role of instructional technology in STEM faculty’s practices and backs their assertion that understandings around faculty practice are needed to design more locally tuned interventions, and that faculty must see the technology as salient to their practice. Based on our more nuanced findings regarding faculty’s use of instructional technology, we recommend those who have responsibility for adopting and implementing instruction technology consider that faculty use instructional technology for multiple reasons and in multiple ways. Thus, including faculty in the decision-making process can result in more faculty adopting and using it.
4.4. Engaging Students in Reflecting on Their Learning
Our findings suggest that faculty were mixed in their practice of engaging students in reflecting on their learning data. Those faculty who did indicate they implemented these practices described activities where students reflected on their overall performance in class, such as open-ended questions that were added to daily in-class or homework assignments. Some faculty asked students through journaling activities to talk about their use of study techniques that may or may not be helping them. Again, these findings are promising, based on other research confirming structured and unstructured activities such as engaging students in journaling and open-ended questions that asked students to write about what they were learning or having difficulty with. These are effective strategies for promoting students’ reflection on and understanding about their learning [21,30].
Still, a majority of faculty indicated they were not intentionally engaging their students in reflecting on their learning. Faculty described doing this least so with students in their lower-division courses, primarily based on the perception that students lacked the ability to meaningfully reflect to the degree that upper-division students could. These faculty claims seem to suggest their assumptions that students have to achieve a certain level of cognitive development and/or understanding in a discipline before they can engage in reflecting on their learning. This may also suggest a faculty perception that students acquire reflection skills through means other than activities that are directed by themselves as their course faculty. Such assumptions may very well be unfounded [29]. Regardless, such thinking shifts the responsibility for student learning entirely to students’ shoulders and suggests that faculty bear little responsibility for helping students be reflective learners. We assert that faculty need to provide opportunities for students to reflect on their learning in order for the student to gain an understanding of the particular aspects of their work that they need to attend to in order to be more successful. Professional developers and leaders can help by providing examples of practices that can be incorporated into classroom activities effectively and that engage students in meaningful reflection on their learning.
4.5. Further Recommendations
Throughout our above detailing of findings concerning STEM faculty instructional data-use practices, we have noted some recommendations for faculty leaders, professional development experts, and faculty themselves to design initiatives that support faculty practices that improve teaching and student learning. Largely, these are towards what we see as the main goal of our study, that is to build from what we know to be working, around important faculty realities and needs towards improving the frequency and efficacy of instructional data-use practices, including faculty engaging students in more meaningful reflections on their learning. Here we detail recommendations more by main theme and stakeholder group.
- Faculty leaders and professional development experts must foster ongoing and targeted professional development activities that support faculty toward improving their instructional data-use practices based on best practice research. Professional development activities can elicit perceptions and experiences that will help faculty see which instructional data-use practices afford them the greatest potential for analyzing instructional data that improve their teaching practices and student learning.
- Faculty leaders and faculty must commit to innovating and developing their use of instructional data-use practices by recognizing that research-based instructional data-use practices can inform their teaching and improve student learning. Faculty are encouraged to explore the potential for collecting more formative data and finding efficient ways to gather and use it in timely and relevant ways to inform their teaching and students’ learning.
- Faculty must recognize the shared responsibility for providing students the opportunity to reflect on and improve their learning. Fostering students’ ability to reflect on their learning has implications for students and faculty through increased learning and achievement for students and data that inform adjustments to teaching that can enhance student learning.
- Faculty are encouraged to take advantage of instructional technologies available to them to enhance the gathering, analysis, and response to instructional data. Increasing faculty competence in collecting and responding to data that involves instructional technologies is critical. Faculty leaders and professional development experts must guard against mandating technology that is not perceived as relevant and usable.
- Faculty leaders and faculty are encouraged to reevaluate curricular content development and processes that may stifle faculty instructional data-use practices and explore changes to policies and norms that promote more research-based instructional data-use practices.
Understanding faculty perceptions about instructional data-use practices can further support professional development activities that help faculty understand their use and beliefs about effective instructional data-use practices. We know that faculty perceptions and practices are based on their previous experience, perceptions, attitudes, and practices [48,49]. Any targeted professional development strategies that better support faculty must account for these realities. Indeed, faculty are much more likely to feel competent in using instructional data when they have a say in their experiences with the instructional tools and the teaching practices that effectively incorporate instructional data in daily processes (Hora and Holden, 2013). Professional development activities must invest faculty in the data-driven decision-making processes that make sense.
4.6. Future Research
Faculty instructional data-use practices, and the perceptions and realities that root them, can inform future research and interventions towards postsecondary STEM education improvements, ultimately towards enhanced success for diverse student populations. Our study is one step in this direction, yet there is still much to discover. Future research could explore more nuanced faculty perceptions and practices across disciplines, including across STEM. Indeed, STEM is not a monolith [50], and we need to explore differences that may exist for faculty and their organizations that may rely on different ways of knowing, cultures, and structures [51]. For instance, are there instructional data-use practices that faculty find particularly effective in certain disciplines? How can departments and institutions support effective instructional data-use practices and still maintain requirements mandated across their specific stakeholders (e.g., faculty and students, accreditation bodies, industry)?
More research is also needed that further explores the impact of instructional technologies on actual faculty practice. For instance, how do faculty incorporate these tools, and what intervention strategies are most helpful in supporting their actual use? What technologies generate the most meaningful and efficient data for faculty to inform their teaching? How can department leaders and professional development experts support faculty in engaging students in reflecting on their learning? What professional development activities increase faculty confidence and competence and actual use of instructional data to inform practice? What data provide the most reliable and valid read for faculty across numerous problems of practice? Future research could also explore the most effective and efficient ways that faculty can engage students in reflecting on their learning. What else inhibits faculty from engaging students in reflecting on their learning, given the benefits for students? What data are most effective in providing students accurate and discipline-aligned insight for students? What practices best inspire students to accept their agency in assessing and ensuring their learning across STEM disciplines?
5. Conclusions
Faculty and student interactions in learning environments are complex. Given a relatively typical target of postsecondary education improvement interventions, we are especially in need of understanding how and why STEM faculty gather, analyze, and respond to instructional data. This study adds to the limited research that examines STEM faculty’s instructional data-use practices. As research has confirmed, innovation and changes to instructional practices can be slow and challenging. However, we contend that this study indicates some research-confirmed instruction data-use practices of STEM faculty that inform their teaching. STEM faculty now, more than ever, may be attempting more effective and inclusive strategies to assess their students’ learning, reflecting a diverse student population who has not traditionally experienced sustained success in STEM files. Faculty are recognizing and incorporating more formative types of data and rethinking how they are using summative data to determine student learning and grades. Faculty may be incorporating more instruction technology that provides them with more strategic ways to collect student learning data and to respond in real-time teaching. We suggest that departmental leaders, administrators, and professional development experts are critical in the continued support of faculty in their development of effective data-use practices that make sense per their and their students’ realities. We see a need for more research that explores these realities to strengthen and expand support efforts.
Author Contributions
Conceptualization, C.L. and J.B.-G.; methodology, C.L.; formal analysis, C.L.; investigation, C.L.; resources, C.L.; data curation, C.L.; writing—original draft preparation, C.L.; writing—review and editing, J.B.-G.; project administration, J.B.-G.; funding acquisition, J.B.-G. All authors have read and agreed to the published version of the manuscript.
Funding
This work is based upon work supported, in part, by the National Science Foundation under Grant #1347817. Any opinions, findings, and conclusions or recommendations expressed in this material are those of the authors and do not necessarily reflect the views of the National Science Foundation.
Institutional Review Board Statement
The study was conducted according to the guidelines of the Declaration of Helsinki, and approved by the Institutional Review Board of Oregon State University (protocol code IRB-2019-0049 and date of approval, 27 March 2019).
Informed Consent Statement
Informed consent was obtained from all subjects involved in the study.
Data Availability Statement
The data presented in this study are available on request from the corresponding author. The data are not publicly available due to research subject confidentiality concerns.
Conflicts of Interest
The authors declare no conflict of interest. The funders had no role in the design of the study; in the collection, analyses, or interpretation of data; in the writing of the manuscript, or in the decision to publish the results.
Appendix A
Interview Protocol
Faculty Interview Questions
1. I’d like to know more about your position at (Name of University).
- Specifically: What is your official title?
- What classes did you teach this academic year, 2016–2017?
- Have your teaching responsibilities changed since last interviewed for this project?
- How much autonomy do you have over what and how you teach?
2. Do you interact regularly with any others concerning issues of teaching and learning?
- (If yes), please provide detail regarding those interactions: including
- who? 1. Are these people in your discipline/department/program?
- how often?
- regarding what specifically?
- What encourages or discourages these interactions?
- Has (Name of Initiative) influenced these interactions in any way?
3. I’d like to hear about your engagement with the (Name of Initiative) project. Specifically:
- What has been your affiliation with the (Name of Initiative) project? What activities have you attended?
- Have you noted any impact of (Name of Initiative) on you?
- Have you noted any impact of (Name of Initiative) on others?
4. Please describe any evolution in your teaching practices over the last couple of years that you can attribute to improvement initiatives or professional development activities. (If not mentioned, probe for specifics via questions a and b).
- Have any university or departmental initiatives or teaching professional development opportunities impacted this evolution?
- Has (Name of Initiative) influenced your evolution in any way?
5. I’d like to hear about your assessment practices while teaching.
- To what extent do you collect data/information about student learning?
- Are you teaching practices informed by data/information about student learning?
- Are there means in the classes/courses that you teach for students to reflect on their own learning data? (If yes), Can you detail these processes?
6. Describe a successful student in the courses or programs in which you teach.
- Overall, what do you consider as the most effective teaching strategies towards developing these things?
- To what extent do you employ these teaching strategies?
7. A goal of the (Name of Initiative) project is widespread improvement to teaching practices and learning outcomes in undergraduate STEM education across (Name of University). Our general strategy is promoting educators’ learning about evidence-based instructional practices via interactions with other educators.
- What do you think about this goal and strategy? Do you have any evidence that widespread improvement to teaching practices and learning outcomes in undergraduate STEM education have happened in the last couple of years at (Name of University)?
- Can you attribute any changes to the (Name of Initiative) project?
- Have you noted any affordances and barriers towards widespread improvement to teaching practices and learning outcomes in undergraduate STEM education, that can inform efforts like (Name of Initiative)?
8. A specific goal of the (Name of Initiative) project was to promote active learning and cooperative learning, especially in large, introductory, gateway courses. We define active learning and cooperative learning as X (definitions provided to interview on a handout).
- What do you think about this goal and strategy?
- Do you have any evidence that promote active learning and cooperative learning has increased in large, introductory, gateway courses in the last couple of years at (name of university)?
- (If so) Can you attribute any changes to the (Name of Initiative) project?
- Have you noted any affordances and barriers towards active learning and cooperative learning has increased in large, introductory, gateway courses, that can inform efforts like (Name of Initiative)?
Appendix B
| Code Names | Code Descriptions |
| Narrative Data Practices | Informal methods of collecting student learning data. Different formats: (a) examination of curricular artifacts, (b) notes to self about curricular artifacts, (c) qualitative data such as exit slips or muddy point exercises. |
| Numeric Data Practices | Numeric data practices include formative data, summative data, and student evaluations. |
| This code indicates strategies that were formative in nature and usually done throughout the course. Data are collected on the spot using technology such as clickers and online pre-quiz activities. Data are analyzed in real time and changes or adjustments are made to teaching practices and decisions quickly. |
| Commonly used forms of assessment such as weekly homework assignments and quizzes, midterms, final exams, and essays. Analyzed at the end of a section or term to guide decisions about teaching and course design for the next term. |
| Data collected from students at the end of the term regarding feedback related to instructor’s teaching practices. Generally done through an institution-wide process. |
| Verbal Data Practices | Verbal data collected by the instructor either through talking with students or talking with teaching assistants or other instructors. |
| Sample of Codes and Definitions | |
References
- Bouwma-Gearhart, J.; Collins, J. What We Know about Data-Driven Decision Making in Higher Education: Informing Educational Policy and Practice. In Proceedings of the International Academic Conferences, Florence, Italy, 16–19 September 2015; pp. 89–131. [Google Scholar]
- Ewell, P.T.; Kuh, G.D. The state of learning outcomes assessment in the United States. High. Educ. Manag. Policy 2010, 22, 1–20. [Google Scholar]
- Jenkins, D.; Kerrigan, M.R. Evidence-Based Decision Making in Community Colleges: Findings from a Survey of Faculty and Administrator Data Use at Achieving the Dream Colleges; Columbia University: New York, NY, USA, 2008. [Google Scholar]
- Bouwma-Gearhart, J. Bridging the Disconnect between How We Do and Teach Science: Cultivating a Scientific Mindset to Teach in an Era of Data-Driven Education; IAP—Information Age Publishing Inc.: Charlotte, NC, USA, 2021. [Google Scholar]
- Hora, M.; Bouwma-Gearhart, J.; Park, H. Data driven decision-making in the era of accountability: Fostering faculty data cultures for learning. Rev. High. Educ. 2017, 40, 391–426. [Google Scholar] [CrossRef]
- McClenney, K.M.; McClenney, B.N.; Peterson, G.F. A culture of evidence: What is it? Do we have one? Plan. High. Educ. 2007, 35, 26–33. [Google Scholar]
- Bouwma-Gearhart, J.; Ivanovitch, J.; Aster, E.; Bouwma, A. Exploring postsecondary biology educators’ planning for teaching to advance meaningful education improvement initiatives. CBE Life Sci. Educ. 2018, 17, ar37. [Google Scholar] [CrossRef]
- Bouwma-Gearhart, J.; Hora, M. Supporting faculty in the era of accountability: How postsecondary leaders can facilitate the meaningful use of instructional data for continuous improvement. J. High. Educ. Manag. 2016, 31, 44–56. [Google Scholar]
- Meyer, J.W.; Rowan, B. Institutionalized organizations: Formal structure as myth and ceremony. Am. J. Sociol. 1977, 83, 340–363. [Google Scholar] [CrossRef] [Green Version]
- Spillane, J.P. Data in practice: Conceptualizing the data-based decision-making phenomena. Am. J. Educ. 2012, 118, 113–141. [Google Scholar] [CrossRef] [Green Version]
- Ahren, C.; Ryan, H.G.; Massa-McKinley, R. Assessment matters: The why and how of cracking open and using assessment results. Campus 2008, 13, 29–32. [Google Scholar] [CrossRef]
- Coburn, C.E.; Turner, E.O. The practice of data use: An introduction. Am. J. Educ. 2012, 118, 99–111. [Google Scholar] [CrossRef] [Green Version]
- Datnow, A.; Hubbard, L. Teacher capacity for and beliefs about data-driven decision making: A literature review of international research. J. Educ. Chang. 2016, 17, 7–28. [Google Scholar] [CrossRef]
- Halverson, R.; Prichett, R.; Grigg, J.; Thomas, C. The New Instructional Leadership: Creating Data-Driven Instructional Systems in Schools. WCER Working Paper No. 2005-9. Wis. Cent. Educ. Res. 2005, 25, 447–481. [Google Scholar]
- Mandinach, E.B. A perfect time for data use: Using data-driven decision making to inform practice. Educ. Psychol. 2012, 47, 71–85. [Google Scholar] [CrossRef]
- Blaich, C.F.; Wise, K.S. Moving from assessment to institutional improvement. New Dir. Institutional Res. 2010, 2010, 67–78. [Google Scholar] [CrossRef]
- Andrews, T.C.; Lemons, P.P. It’s personal: Biology instructors prioritize personal evidence over empirical evidence in teaching decisions. CBE Life Sci. Educ. 2015, 14, ar7. [Google Scholar] [CrossRef] [PubMed] [Green Version]
- Anderson, G.; Gregory, M.; Sun, J.C.; Alfonso, M. Effectiveness of statewide articulation agreements on the probability of transfer: A preliminary policy analysis. Rev. High. Educ. 2006, 29, 261–291. [Google Scholar] [CrossRef]
- Evans, C. Making sense of assessment feedback in higher education. Rev. Educ. Res. 2013, 83, 70–120. [Google Scholar] [CrossRef] [Green Version]
- Nicol, D.J.; Macfarlane-Dick, D. Formative assessment and self-regulated learning: A model and seven principles of good feedback practice. Stud. High. Educ. 2006, 31, 199–218. [Google Scholar] [CrossRef]
- Taras, M. Using assessment for learning and learning from assessment. Assess. Eval. High. Educ. 2002, 27, 501–510. [Google Scholar] [CrossRef]
- Kuh, G.D.; Ikenberry, S.O.; Jankowski, N.A.; Cain, T.R.; Ewell, P.T.; Hutchings, P.; Kinzie, J. Using Evidence of Student Learning to Improve Higher Education; Jossey-Bass: San Francisco, CA, USA, 2015; ISBN 13: 1118903391. [Google Scholar]
- Hora, M.; Holden, J. Exploring the role of instructional technology in course planning and classroom teaching: Implications for pedagogical reform. J. Comput. High. Educ. 2013, 25, 68–92. [Google Scholar] [CrossRef]
- Lester, J.; Klein, C.; Rangwala, H.; Johri, A. Learning analytics in higher education. ASHE High. Educ. Rep. 2017, 43, 1–145. [Google Scholar] [CrossRef]
- Austin, A.E. Promoting evidence-based change in undergraduate science education, Paper commissioned by National Academies Research Council Board on Science Education. In Fourth Committee Meeting on Status, Contributions, and Future Directions of Discipline-Based Education Research; Michigan State University: Michigan, MI, USA, 2011. [Google Scholar]
- Fairweather, J. Linking evidence and promising practices in science, technology, engineering, and mathematics (STEM) undergraduate education. In Board of Science Education, National Research Council; The National Academies: Washington, DC, USA, 2008. [Google Scholar]
- Klein, C.; Lester, J.; Rangwala, H.; Johri, A. Technological barriers and incentives to learning analytics adoption in higher education: Insights from users. J. Comput. High. Educ. 2019, 31, 604–625. [Google Scholar] [CrossRef]
- Poulos, A.; Mahony, M.J. Effectiveness of feedback: The students’ perspective. Assess. Eval. High. Educ. 2008, 33, 143–154. [Google Scholar] [CrossRef]
- Sadler, D.R. Beyond feedback: Developing student capability in complex appraisal. Assess. Eval. High. Educ. 2010, 35, 535–550. [Google Scholar] [CrossRef] [Green Version]
- Ryan, M.; Ryan, M. Chapter 2—A model for reflection in the pedagogic field of higher education. In Teaching Reflective Learning in Higher Education A Systematic Approach Using Pedagogic Patterns; Ryan, M., Ed.; Springer International Publishing AG: Cham, Switzerland, 2015; pp. 15–30. [Google Scholar]
- Halverson, R.R. Systems of practice: How leaders use artifacts to create professional community in schools. Educ. Policy Anal. Arch. 2003, 11, 37. [Google Scholar] [CrossRef] [Green Version]
- Gibson, J. The theory of affordances. In Perceiving, acting, and knowing; Shaw, R.E., Bransford, J., Eds.; Lawrence Erlbaum Associates: Hillsdale, NJ, USA, 1977. [Google Scholar]
- Norman, D.A. Affordance, conventions, and design. Interactions 1999, 6, 5. [Google Scholar] [CrossRef]
- Bouwma-Gearhart, J.; Lenz, A.; Ivanovitch, J. The interplay of postsecondary science educators’ problems of practice and competencies: Informing better intervention designs. J. Biol. Educ. 2018, 52, 1–13. [Google Scholar] [CrossRef]
- Hora, M. Organizational factors and instructional decision-making: A cognitive perspective. Rev. High. Educ. 2012, 35, 207–235. [Google Scholar] [CrossRef]
- Carnegie Classification the Carnegie Classifications of Institutions of Higher Education. Available online: https://carnegieclassifications.iu.edu/ (accessed on 17 April 2020).
- Auerbach, C.F.; Silverstein, L.B. Qualitative Data: An introduction to Coding and Analysis; New York University Press: New York, NY, USA, 2003. [Google Scholar]
- Montgomery, P.; Bailey, P.H. Field notes and theoretical memos in grounded theory. West. J. Nurs. Res. 2007, 29, 65–79. [Google Scholar] [CrossRef]
- Creswell, J.W. Research Design Qualitative, Quantitative, And Mixed Methods Approaches, 4th ed.; SAGE: Los Angeles, CA, USA, 2014. [Google Scholar]
- Guinier, L. The Tyranny of the Meritocracy: Democratizing Higher Education in America; Beacon Press: Boston, MA, USA, 2015. [Google Scholar]
- McLaren, P. Critical pedagogy: A look at the major concepts. In The Critical Pedagogy Reader; Darder, A., Torres, R.D., Baltodano, M., Eds.; Routledge: New York, NY, USA, 2017; pp. 56–78. [Google Scholar]
- Kuh, G.D. What we’re learning about student engagement from NSSE: Benchmarks for effective educational practices. Change 2003, 35, 24–32. [Google Scholar] [CrossRef]
- Kahu, E.R.; Nelson, K. Student engagement in the educational interface: Understanding the mechanisms of student success. High. Educ. Res. Dev. 2018, 37, 58–71. [Google Scholar] [CrossRef]
- Shapiro, C.A.; Sax, L.J. Major selection and persistence for women in STEM. New Dir. Institutional Res. 2011, 2011, 5–18. [Google Scholar] [CrossRef] [Green Version]
- Bouwma-Gearhart, J. Teaching Professional Development of Science and Engineering Professors at a Research-Extensive University: Motivations, Meaningfulness, Obstacles, and Effects; University of Wisconsin-Madison: Madison, WI, USA, 2008. [Google Scholar]
- Bouwma-Gearhart, J. Research university STEM faculty members’ motivation to engage in teaching professional development: Building the choir through an appeal to extrinsic motivation and ego. J. Sci. Educ. Technol. 2012, 21, 558–570. [Google Scholar] [CrossRef]
- Fisher, K.Q.; Sitomer, A.; Bouwma-Gearhart, J.; Koretsky, M. Using social network analysis to develop relational expertise for an instructional change initiative. Int. J. STEM Ed. 2019, 6, 1–12. [Google Scholar]
- Pajares, M.F. Teachers’ beliefs and educational research: Cleaning up a messy construct. Rev. Educ. Res. 1992, 62, 307–332. [Google Scholar] [CrossRef]
- Bouwma-Gearhart, J.; Adumat, S. Fostering successful interdisciplinary postsecondary faculty collaborations. Int. J. Univ. Teach. Fac. Dev. 2011, 2, 207. [Google Scholar]
- Reinholz, D.L.; Matz, R.L.; Cole, R.; Apkarian, N. STEM is not a monolith: A preliminary analysis of variations in STEM disciplinary cultures and implications for change. CBE Life Sci. Educ. 2019, 18, mr4. [Google Scholar] [CrossRef] [PubMed] [Green Version]
- Bouwma-Gearhart, J.; Sitomer, A.; Fisher, K.; Smith, C.; Koretsky, M. Studying organizational change: Rigorous attention to complex systems via a multi-theoretical research model. In Proceedings of the 2016 ASEE Annual Conference & Exposition, New Orleans, LA, USA, 26 June 2016. [Google Scholar]
Figure 1.
Conceptual Framework: Integrating Perceived Affordances [32,33] and System-of-Practice [31] Theories.


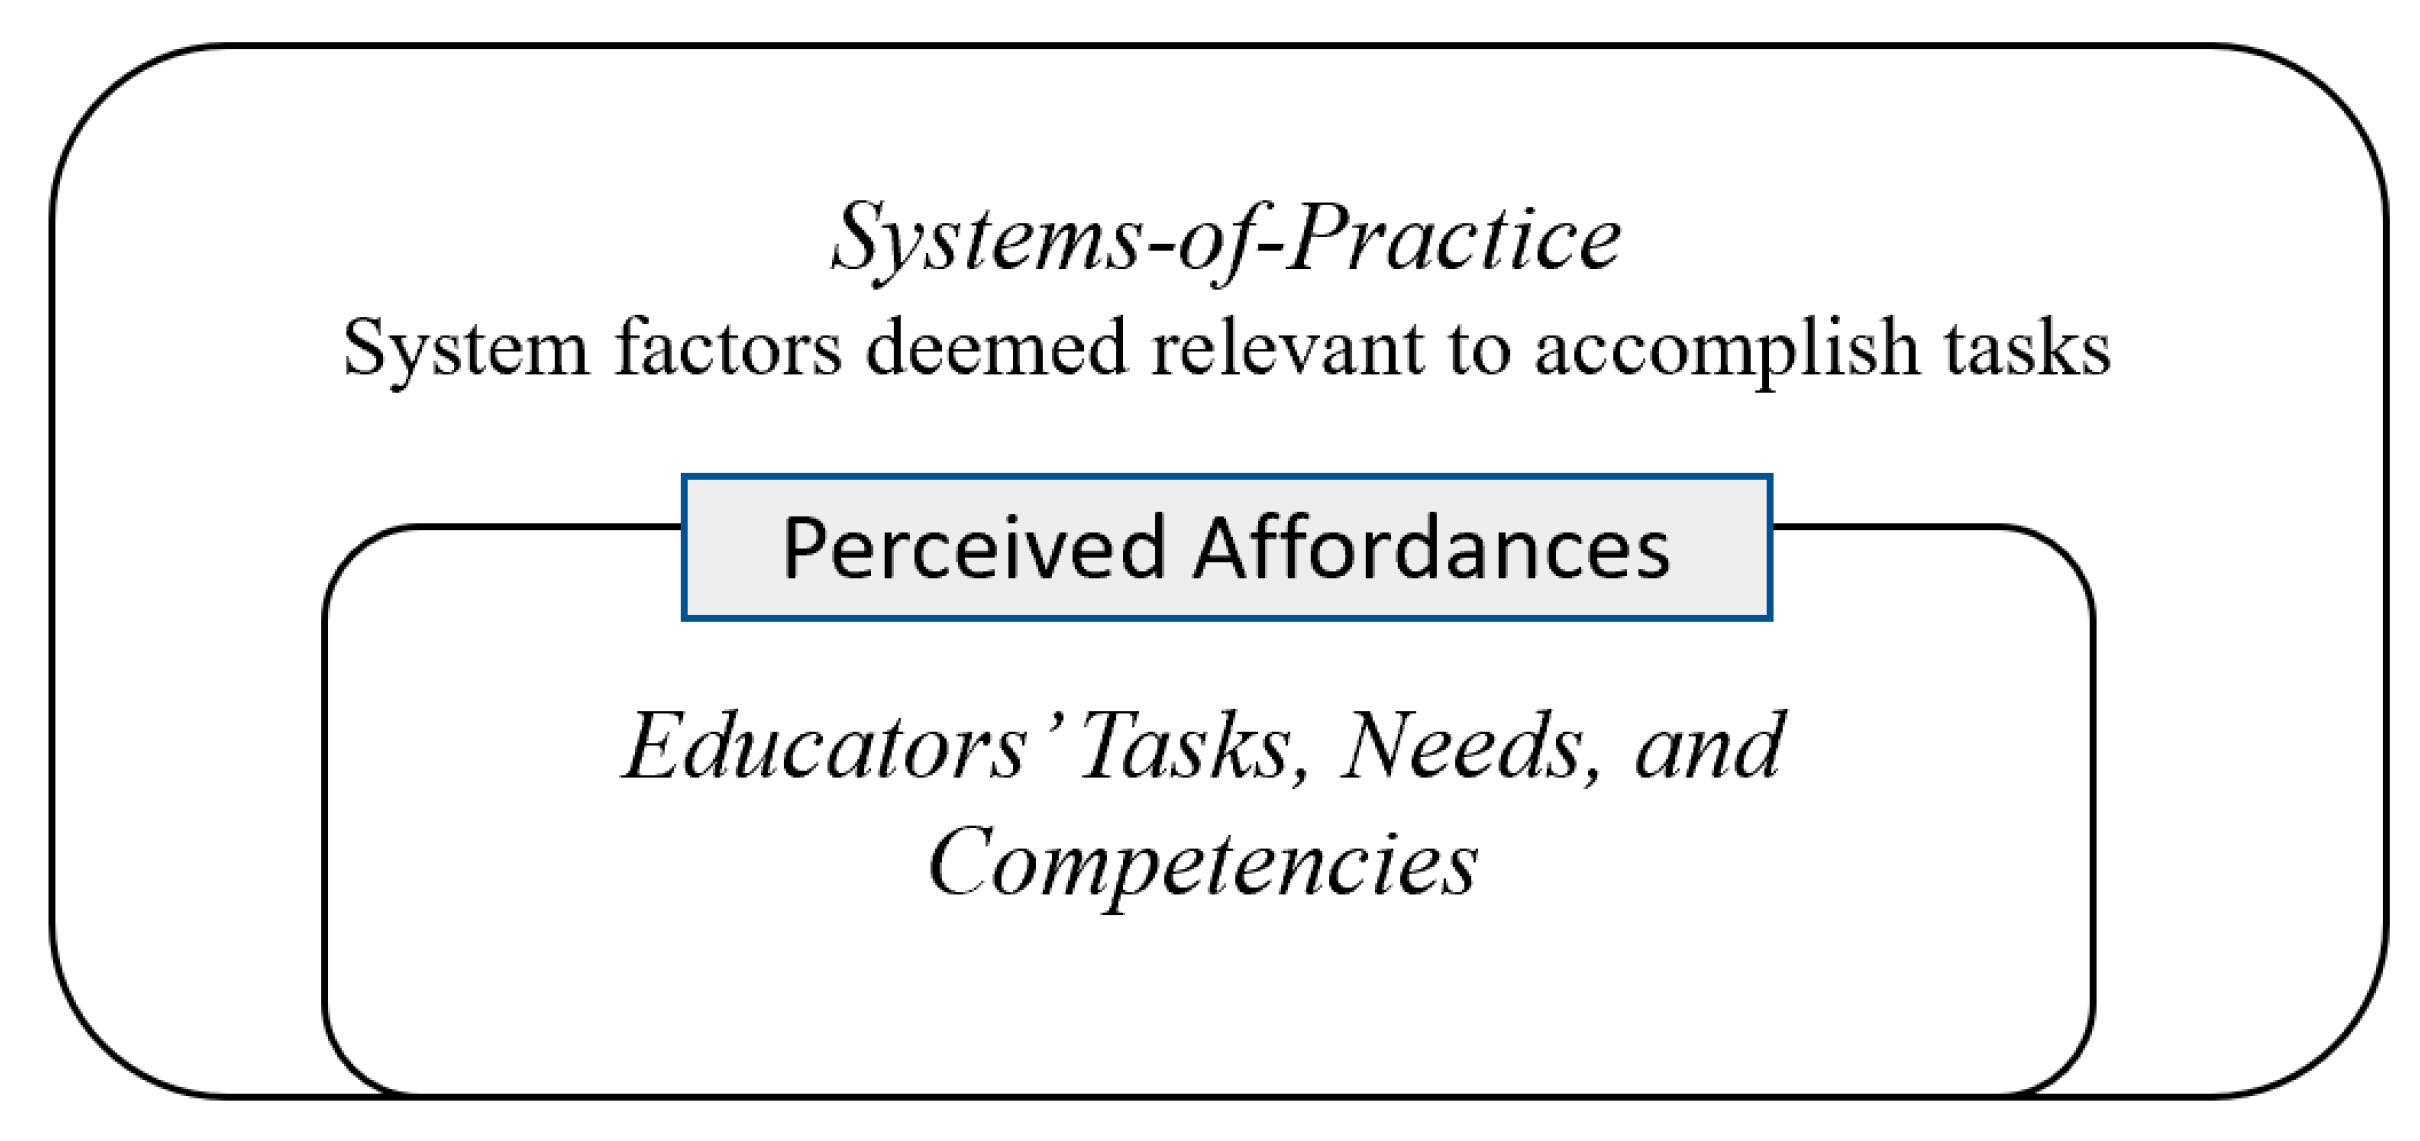
Table 1.
Faculty respondents in STEM disciplines. N = 420 (n = respondents); Engineering includes civil, chemical, biological and mechanical.
Table 1.
Faculty respondents in STEM disciplines. N = 420 (n = respondents); Engineering includes civil, chemical, biological and mechanical.
| Physics | Chemistry | Biology | Mathematics | Engineering | Total | ||||||
|---|---|---|---|---|---|---|---|---|---|---|---|
| n | % | n | % | n | % | n | % | n | % | n | % |
| 12 | 9 | 18 | 14 | 13 | 10 | 27 | 21 | 57 | 45 | 127 | 30 |
Table 2.
Faculty perceptions of gathering, analyzing, and responding to instructional data. 1 Variable mean coded on a 5-point scale of 0 = “Not true at all,” 2 = “Somewhat true,” 4 = “Very true” (n = 127).
Table 2.
Faculty perceptions of gathering, analyzing, and responding to instructional data. 1 Variable mean coded on a 5-point scale of 0 = “Not true at all,” 2 = “Somewhat true,” 4 = “Very true” (n = 127).
| Survey Item | M1 | SD |
|---|---|---|
| I know how to gather, analyze, and respond to data that informs my teaching. | 2.75 | 0.94 |
| I regularly gather, analyze, and respond to data that informs my teaching. | 2.50 | 1.04 |
| I am committed to gathering, analyzing, and responding to data that informs my teaching. | 2.74 | 1.02 |
Table 3.
List of Disciplines, Participants’ Pseudonyms, and Participants’ Professional Positions. N = 19. Tenure-track faculty include assistant, associate, and full professors, Fixed-term faculty include instructors and senior instructors.
Table 3.
List of Disciplines, Participants’ Pseudonyms, and Participants’ Professional Positions. N = 19. Tenure-track faculty include assistant, associate, and full professors, Fixed-term faculty include instructors and senior instructors.
| Discipline | Participant | Professional Position |
|---|---|---|
| Physics | Robin | Fixed-Term Faculty |
| Jamie | Tenure-Track Faculty | |
| Chemistry | Jordan | Fixed-Term Faculty |
| Alex | Fixed-Term Faculty | |
| Sidney | Fixed-Term Faculty | |
| Casey | Fixed-Term Faculty | |
| Tracy | Tenure-Track Faculty | |
| Biology | Jodi | Fixed-Term Faculty |
| Peyton | Fixed-Term Faculty | |
| Mathematics | Leslie | Tenure-Track Faculty |
| Jackson | Fixed-Term Faculty | |
| Madison | Fixed-Term Faculty | |
| Kelly | Fixed-Term Faculty | |
| Drew | Tenure-Track Faculty | |
| Shannon | Tenure-Track Faculty | |
| Engineering | Lee | Tenure-Track Faculty |
| Bailey | Tenure-Track Faculty | |
| Logan | Tenure-Track Faculty | |
| Lynn | Tenure-Track Faculty |
Publisher’s Note: MDPI stays neutral with regard to jurisdictional claims in published maps and institutional affiliations. |
© 2021 by the authors. Licensee MDPI, Basel, Switzerland. This article is an open access article distributed under the terms and conditions of the Creative Commons Attribution (CC BY) license (https://creativecommons.org/licenses/by/4.0/).
Share and Cite
MDPI and ACS Style
Lenhart, C.; Bouwma-Gearhart, J. STEM Faculty Instructional Data-Use Practices: Informing Teaching Practice and Students’ Reflection on Students’ Learning. Educ. Sci. 2021, 11, 291. https://doi.org/10.3390/educsci11060291
AMA Style
Lenhart C, Bouwma-Gearhart J. STEM Faculty Instructional Data-Use Practices: Informing Teaching Practice and Students’ Reflection on Students’ Learning. Education Sciences. 2021; 11(6):291. https://doi.org/10.3390/educsci11060291
Chicago/Turabian StyleLenhart, Cindy, and Jana Bouwma-Gearhart. 2021. "STEM Faculty Instructional Data-Use Practices: Informing Teaching Practice and Students’ Reflection on Students’ Learning" Education Sciences 11, no. 6: 291. https://doi.org/10.3390/educsci11060291
Note that from the first issue of 2016, this journal uses article numbers instead of page numbers. See further details here.