Article

Application of Integrated Watershed Management Measures to Minimize the Land Use Change Impacts

by
Fatemeh Rajaei
1,
Reza Dahmardeh Behrooz
2,*,
Ebrahim Ahmadisharaf
3,
Saman Galalizadeh
4,
Branislav Dudic
5,6,*,
Velibor Spalevic
7,8 and
Rajko Novicevic
9
1
Department of Environmental Sciences, Faculty of Science, University of Zanjan, Zanjan 45371-38791, Iran
2
Department of Environmental Sciences, Faculty of Natural Resources, University of Zabol, Zabol 98615-538, Iran
3
Department of Civil and Environmental Engineering, Resilient Infrastructure and Disaster Response (RIDER) Center, FAMU-FSU College of Engineering, Tallahassee, FL 32310, USA
4
Department of Environmental Sciences, University of Tehran, Tehran 1417935840, Iran
5
Faculty of Management, Comenius University in Bratislava, 82005 Bratislava, Slovakia
6
Faculty of Economics and Engineering Management, University Business Academy, 21000 Novi Sad, Serbia
7
Biotechnical Faculty, University of Montenegro, Mihaila Lalica 1, 81000 Podgorica, Montenegro
8
Geography, Faculty of Philosophy, University of Montenegro, Danila Bojovica, 81400 Niksic, Montenegro
9
Faculty of Business Economics and Law, Adriatic University, 85000 Bar, Montenegro
*
Authors to whom correspondence should be addressed.
Water 2021, 13(15), 2039; https://doi.org/10.3390/w13152039
Submission received: 11 June 2021 / Revised: 17 July 2021 / Accepted: 21 July 2021 / Published: 26 July 2021
(This article belongs to the Special Issue Nitrates Pollution in Water: Sources, Pathways and Receptors)

Abstract

:
Non-point source pollution is a major factor in excessive nutrient pollution that can result in the eutrophication. Land use/land cover (LULC) change, as a result of urbanization and agricultural intensification (e.g., increase in the consumption of fertilizers), can intensify this pollution. An informed LULC planning needs to consider the negative impacts of such anthropogenic activities to minimize the impact on water resources. The objective of this study was to inform future land use planning by considering nutrient reduction goals. We modeled the LULC dynamics and determined the capacity for future agricultural development by considering its impacts on nitrate runoff at a watershed scale in the Tajan River Watershed in northeastern Iran. We used the Soil and Water Assessment Tool (SWAT) to simulate the in-stream nitrate concentration on a monthly timescale in this watershed. Historical LULCs (years 1984, 2001 and 2010) were derived via remote sensing and were applied within the Land Change Modeler to project future LULC in 2040 under a business-as-usual scenario. To reduce nitrate pollution in the watershed and ecological protection, a conservation scenario was developed using a multi-criteria evaluation method. The results indicated that the implementation of the conservation scenario can substantially reduce the nitrate runoff (up to 72%) compared to the business-as-usual scenario. These results can potentially inform regional policy makers in strategic LULC planning and minimizing the impact of nitrate pollution on watersheds. The proposed approach can be used in other watersheds for informed land use planning by considering nutrient reduction goals.

1. Introduction

Evaluating likely changes in water quantity and quality in the future is important for informed planning and adaptive management. Land use/land cover (LULC) change is an important stressor that impacts both water quantity and quality. It is, therefore, crucial to evaluate these impacts and incorporate them into our decisions for sustainable management of water resources.
Conversion of forests, which cover ~30% of the world’s land, to agricultural lands is a prevalent LULC change and a major concern across the globe. The United Nations’ (UN’s) Food and Agricultural Organization [1] estimated that over one million km2 of the Earth’s tropical rainforests and moist deciduous forests were destroyed during the 1981–1990 period, representing an average annual deforestation rate of 0.8% of such forests throughout the decade. Since forests provide several benefits such as flood protection and ecosystem services, their loss has huge implications for water resources. While the loss of forests is a global concern, their loss is a bigger concern in developing countries since it can lead to more adverse impacts due to the limited synergy among the authorities and stakeholders, the reliance on traditional management strategies for pollution and flood mitigation and limited resources to study and manage these impacts [2]. It is, thus, critical to project the impact of forest loss (as a result of conversion to other LULCs) on water quantity and quality in these countries.
An example of such developing countries is Iran. The country has been experiencing an escalating population growth and many forest lands have been converted to farmlands as an effort to support increasing food demands. Loss of forests in Iran has been a serious concern in recent years. Between 2015 and 2020, approximately 12,000 ha of forests across the country has wiped out annually. According to Iran’s Forests, Range and Watershed Management Organization (2018) [3], nearly 14.2 million ha of the entire country’s area is covered by forests in 2017, compared to 19.5 million ha in 1942. In northern Iran, where the forest LULC is dense and several valuable species exist, forest lands have been shrinking, in which the area of this LULC has been estimated at 2.1 million ha in 1960, and in 2020, it has shrunk to 2.0 million ha, even by taking the replanted areas into account. An emerging example of such valuable forest species is Hyrcanian that has a long history (arised in the Jurassic Period) and is among the world’s most valuable natural resources; the rapid decline in its area has been a major concern in the recent years. Rajaei et al. [4] studied the LULC dynamics in the northern parts of Iran and revealed that, in the past four decades, the forest area decreased by 3.0%, while dry farming increased by 9.2%. Emadodin [5] reported that the LULC change in Iran has increased over the past 50 years and is expected to accelerate in the future. In addition, results obtained by Gholamalifard et al. (2013) [6] showed that increased fragmentation in the Hyrcanian forest will continue in the future and more shape complexity will be observed in coastal areas along the Caspian Sea. Tavangar et al. [7] projected the effects of LULC change in a watershed in northern Iran for the future period of 2016–2030 and found that, from 2016 to 2030, forest area will decrease by 5.3%, while the area of both residential and agricultural LULCs will increase by 20% and 6%, respectively. These past studies are in agreement on the escalating loss of forest and increase in agricultural LULC, thereby raising concerns on the potential impacts on water resources.
Over the past decades, improper agricultural management has negatively affected the ecosystem services provided by Hyrcanian forest. LULC planning through identifying the most suitable locations for agricultural activities based on local and regional knowledge is vital to protect ecosystem services by such valuable natural resources through the development of sustainability-based policies. Considering multiple benefits of Hyrcanian forest and regional needs for the agriculture, an advanced optimization is needed to identify the most suitable locations for agricultural activities. Multi-criterion evaluation (MCE) could assist this problem based on a set of production scenarios and decision makers’ preferences. MCE techniques can be integrated with GIS to support LULC planning and prioritizing competing alternatives. These techniques enable the determination and prioritization of alternative zones, dealing with a number of parameters.
Recent years have witnessed an increasing use of MCE techniques like analytical hierarchical process (AHP) [8] for LULC suitability analysis and land development [9,10,11,12]. To predict the impact of LULC change on water quality and quantity, researchers have coupled LULC change models with watershed models like Soil and Water Assessment Tool (SWAT) [12]. Example applications in northern Iran include Sigaroodi et al. [13], Salmani et al. [14], Zare et al. [15], Tavangar et al. [7] and Mehri et al. [16]. However, these studies have focused on evaluating the LULC change on water quantity (surface runoff) without studying the impacts on water quality.
The objective of this study was to investigate the applicability of LULC planning on the reduction of nutrient rate in the Tajan River Basin in northern Iran. Three LULC maps were first analyzed for the period of 1984–2010 using remote sensing and satellite imagery. Land change modeler (LCM) was then applied to investigate the LULC transition and to project future LULC. We projected future LULC change (year 2040) under two scenarios: (i) business-as-usual or continuing the recent trend of LULC; and (ii) conservation scenario, in which a LULC suitability map was developed for future agriculture development using a GIS-based MCE technique and weighted linear combination (WLC). SWAT was then used to simulate the nitrate load corresponding to years of 2010 and the two future scenarios (business-as-usual and conservation). The method presented in this study can be a foundation for sustainability-based land use planning and comprehensive management of river basins in northern Iran to minimize negative impacts of LULC change on the surface water pollution.

2. Materials and Methods
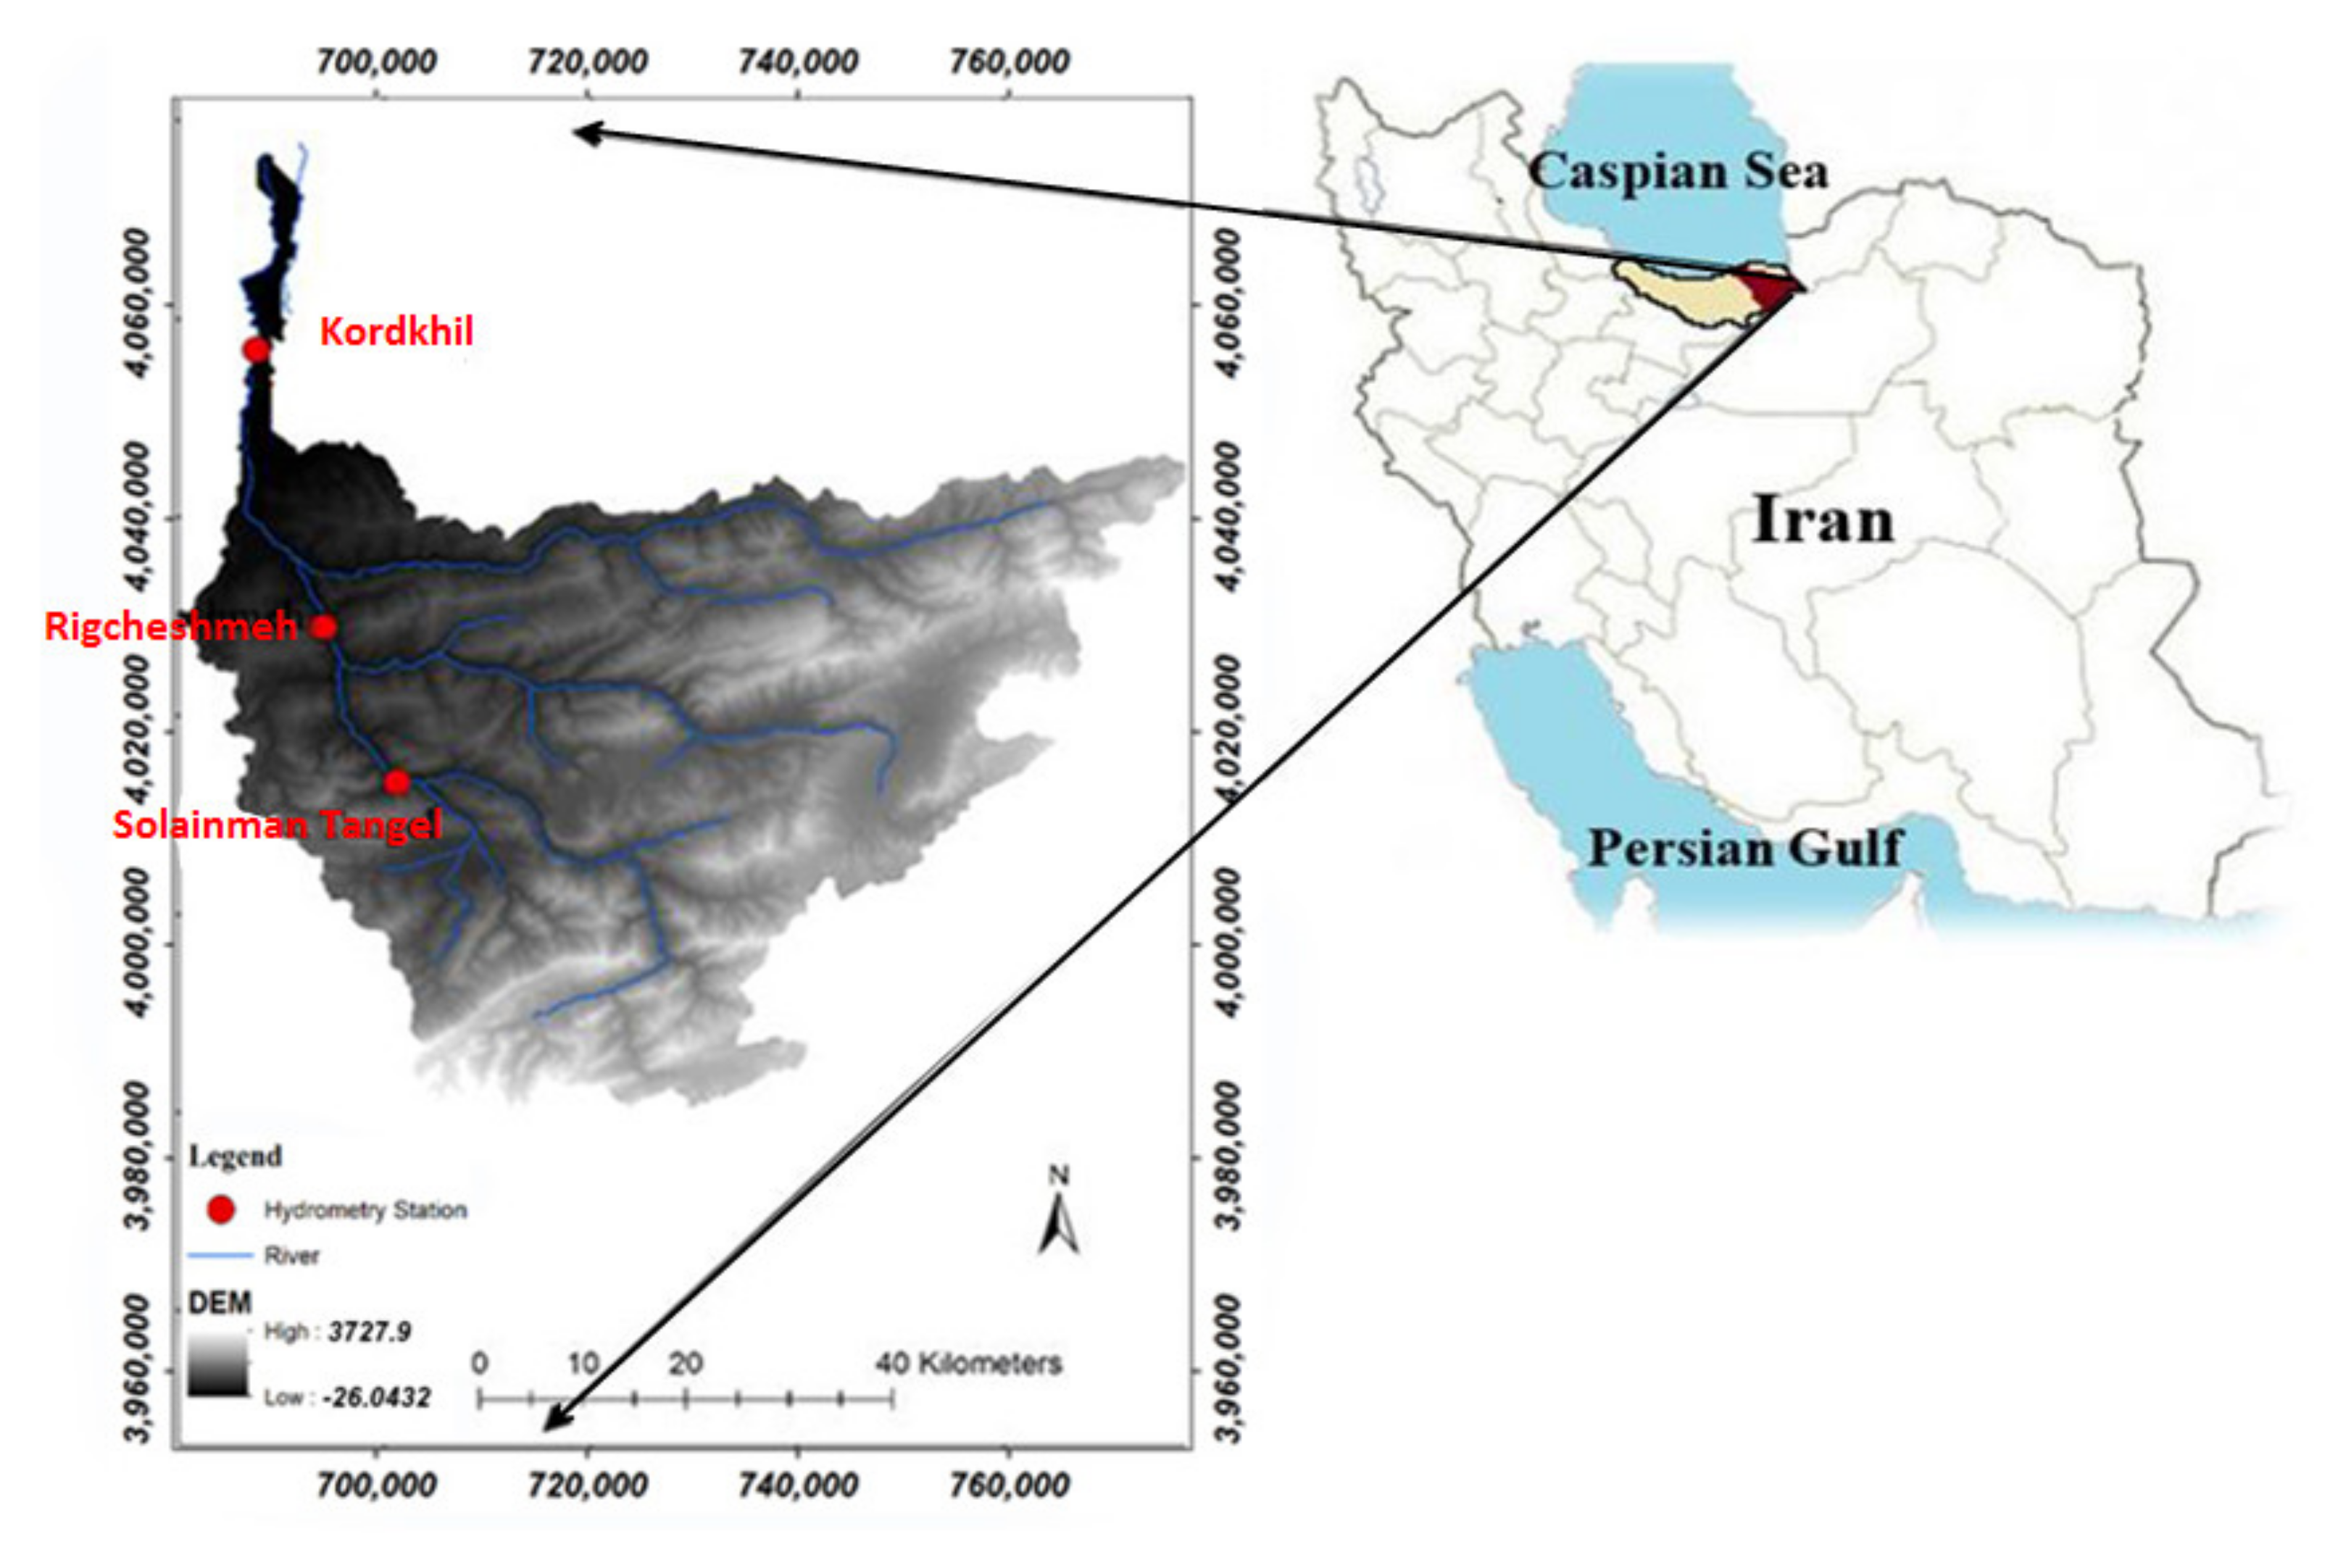
2.1. Study Area

The 4000 km2 Tajan watershed is in Mazandaran Province, Iran (Figure 1). Tajan watershed includes forested mountains in the upstream and comprises of pasture and agricultural areas in the coastal plain. The largest city in the watershed is Sari, the capital of Mazandaran Province, with a population of ~310,000 in 2016. Given that the climate in the watershed is wetter than other arid and semi-arid parts of the country, there have been a growing interest in the use of lands for agricultural activities. Due to the recent droughts in Iran, migration from other provinces to the Mazandaran province has also increased, which has intensified and accelerated the LULC changes in this area. Deforestation is ongoing in the region and the absence of appropriate conservation, restoration and rehabilitation programs could result in even more dramatic forest loss in the future. Increase in farmlands and agricultural activities and livestock grazing in forested areas are the primary causes of forest loss [17].
In Mazandaran Province, agriculture is a major source of nutrient loading. Agricultural activities, particularly paddy cultivation in the riparian zone, and application of manure and livestock grazing, play a significant role in the contamination of surface water through the pollutant washoff [18]. Other sources of nutrient pollution include nonpoint source pollution from residential lands and direct deposit of untreated sewage from population centers (e.g., Sari). The pollution from the agricultural, urban and industrial lands is transported by Tajan River to the Caspian Sea, the largest inland waterbody across the world. Tajan watershed also includes national parks and preserved areas and is a primary source of water supply (irrigation and drinking water) in the region and a critical habitat supporting commercial fishery and includes; the nonpoint source pollution can negatively affect all of these.
Excess loading of nutrients to streams from agricultural runoff is the leading cause of eutrophication of waterbodies and the loss of aquatic ecosystems in the watershed. Since the late 1970s, increasing pollutants flowing into the Caspian Sea has resulted in an accelerated eutrophication. Caspian Sea provides several benefits to the region, including food and energy supply, transportation, aesthetic benefits and tourism, among others. Any pollution in the Tajan watershed can, therefore, directly affect all these benefits. Tajan River is also one of most important fisheries in Iran. During the reproductive season, adult sturgeon fish enter the Tajan River; their population is imperiled because of overharvesting, spawning habitat loss and extreme chemical pollution [19]. These all suggest the extent of adverse impacts of unplanned agricultural activities and conversion of forests to ecosystem services provided by Tajan River and Caspian Sea.

2.2. Land Use/Land Cover Change Modeling

The LCM is a method to predict LULC changes using transition probabilities. It is a suite of tools, which the LUCC analysis and modeling can be combined with biodiversity and greenhouse gas emission assessments. The change modeling module is based on Markov chain matrices and transition susceptibility maps obtained by the logistic regression or by training learning machines. The LCM was applied to identify trends in LULC, tropical deforestation, urban growt, erosion under different conservation scenarios and habitat modeling [20].
The remote sensing-based approach implemented here is based on IDRISI software’s LCM module [20,21]. Modeling changes in LULC via the LCM is performed in five main stages: (i) historical change analysis; (ii) modeling of potential transition (At this stage, the probability of transfer from one type of land cover to another was determined by stimulus variables) [21]; (iii) LULC change prediction (2010); (iv) assessing model accuracy; and (v) LULC change projection for the future (2040). For the case study, LULC maps for 1984 and 2001, and five spatially-distributed variables [21]—normalized difference vegetation index (NDVI), distance to rivers, distance to the edge of forests, distance to pasture lands and empirical likelihood to change (To produce the empirical likelihood to change (qualitative variable), a transition map was generated from all classes to agriculture)—were used to model the transition potential (i.e., the potential for a LULC to transition to another LULC). Transition potential included forest to agriculture, forest to pasture and pasture to agriculture. After ensuring the model efficiency to predict the changes, LULC maps of 2001 and 2010 alongside the five driving variables were used to project LULC 30 years forward (year 2040) [22]. Additional details on LCM could be accessed in Eastman [20,21].
The LULC maps for 1984 and 2001 and 2001 and 2010 were used sequentially and changes in LULC were assessed and quantified over these years in each time slice across all grid cells. All types of changes and transitions between the LULCs were classified and categorized in sub-models and potential explanatory variables are identified. The results obtained from this stage were mapped as potential transitions for each change. Five variables—NDVI index as well as the distance to rivers, forests and pastures—with an assessment of empirical likelihood to change were used in the LCM for the purpose of modeling the transition potential. These are the standard variables in previous LULC change modeling [18,20,21]. To investigate the extent of relationship between variables in the model (independent variables) and changes in the LULC (dependent variables), we used the Cramer’s correlation coefficient [21]; the coefficient ranges between 0 and 1, and a greater value indicates a higher correlation between the independent and dependent variables.
In projecting the future LULC map for the Tajan watershed, we used a multi-layer perceptron (MLP) neural network embedded in the LCM to assess the transition potential. In using an artificial neural network, the accuracy rate and skill measures were computed to evaluate the model performance [23].
LULC change prediction is quantified as probabilities of transitions from one year to another (e.g., from 2001 to 2010) was calculated using the Markov chain. The predicted LULC of 2010 was then compared with the observed LULC by LANDSAT 7 satellite with a 30 m spatial resolution.
We validated the LULC model against historical LULC maps. A three-way cross tabulation between the most recent land cover map (2010), the prediction map and observed LULC, was used as the validation approach. Multiple metrics—hits to false alarms ratio, kappa index [2] and Relative Operating Characteristic (ROC)—were used to evaluate the LULC model performance. The former metric measures the correlation between the modeled and observed LULC; a ratio of >25% indicates a good correlation [20]. The ROC statistic determines how well a continuous surface predicts the locations given the distribution of a Boolean variable. Both kappa and ROC range from 0 to 1; a value of 1 indicates a perfect spatial agreement. An ROC >0.8 was considered a strong agreement [20]. The MLP quantifies the relationship between the analyzed transitions and the corresponding explanatory variables. MLP confirms that the model has a root mean square error (RMSE) of <0.002 in both the training and the validation phases. Upon validation, the model was applied to project LULC 30 years forward (2040).

2.3. Future Land Use/Land Cover Scenarios

The business-as-usual scenario was produced using the LCM and the MCE, assuming that the future LULC follows the historical trends. In the conservation scenario, the most suitable zones for agricultural development were selected. The MCE process includes multiple phases (Figure 2). First, the relevant criteria (factors and constraints) are defined based on a literature review and interviews with experts. Factors used to assess the ecological potential of LULCs included pasture geology, soil erosion, climate, water resources, LULC, elevation, ground slope, aspect, vegetation density, distance from the population centers, distance to roads and distance to the population centers. The ground slope and aspect maps were created from the digital elevation model (DEM) obtained from SRTM (Shuttle Radar Topography Mission), roads map obtained from the Roads and Urban Development Organization and Soil map obtained from Jihad Keshavarzi organization. LULC map was used to extract the spatial distribution of vegetation density and population centers. Climatic and water resources information were obtained from the Meteorological Organization, and Water Resources Management Organization respectively. The layers were then converted to raster in the IDRISI software.
The second step in the MCE procedure was to define membership functions to determine the degree of class membership for each criterion. In the fuzzy model, which was utilized to model human decision making behavior and human experience, each attribute must be converted into a comparable scale for the use in the weighted linear combination method. Using a standardization function, all parameters were given commensurate values that allow their subsequent aggregation. Among the various standardization methods, including deterministic, probabilistic and fuzzy methods, the map layers were standardized using the fuzzy procedure in this study. The fuzzy set [24] is a class of objects with a continuum of grades of membership. It is a superset of conventional Boolean logic that handles the partial truth concept [25]. This set is characterized by a membership function that assigns each object a membership rank between zero and one [24]. This is in contrast to the classic set in which each element must have 0 or 255 as the membership rank [24,26]. Since the fuzzy method is capable of expressing gradual transitions from membership to non-membership, it is widely used, not only to represent geographical entities with indeterminate boundaries, but also for GIS-based operations and analyses, including MCEs. The concept of membership function can be used to standardize criterian maps (Malczewski & Rinner, 2015, p. 197). The fuzzy method involves determining a membership function in a fuzzy set that can have one of the following forms: the, J-shaped, sigmoidal, linear, or user-defined function” (Malczewski & Rinner, 2015) fuzzy memberships for Standardization of parameters is provided in the IDRISI Selva software. This approach attempts to turn the artificially crisp and clear-cut criteria of the simple Boolean approach into real-life continuous criteria that express a degree of suitability. Criteria can be modeled as a continuous variable ranging from the most suitable to the least suitable, in which the lowest value belongs to the minimum membership (zero) and the greatest value showing the best choice belongs to the maximum membership, which was chosen to be 255 herein [24,25,27,28].
The third step was to derive the criteria weights based on the expert judgements. Criteria weighting was based on the AHP and the Weight module in the IDRISI Selva 17.2 software were used to calculate the criteria weights. Pairwise comparisons were done to facilitate the judgments and calculations for different decision making scenarios. The AHP consists of the following steps: (1) identify and define the problems and objectives; (2) determine the criteria and alternatives and rearrange them into a hierarchical sequence; (3) apply pairwise comparisons to prepare comparison matrices; (4) determine the relative weights of the factors; (5) compute the consistency index of the matrices; and (6) obtain an overall weighting for each factores [29]. This method also computes the Consistency Ratio (CR) as follows Equation (1):
C R = C I × R I
where RI is the random consistency index. The CR must be less than 0.1 for the comparisons to be consistent. Table 1 shows the weight of each criterion. Last, the factors were aggregated in GIS via the WLC method; a map, which shows the land suitability for agricultural development, was generated.Among the different multi-criteria evaluation methods proposed for GIS-based land suitability analysis, the WLC and the Boolean overlay operations are the most common in land suitability evaluation and considered appropriate for combining a set of criterion maps. WLC is to obtain an overall suitability score by standardizing the suitability maps, assigning weights of relative importance to these, and then combining the weights and standardized suitability maps. Unlike the Boolean operations, the WLC is a compensatory method, in which a low score on one suitability criterion can be compensated by a high suitability score on another. In the WLC, the overall suitability of an alternative can be defined as follows:
S = 1 = 1 n W i X i
where S is the overall suitability; Xi is the value of index i; Wi is the weight of index i and n represents the number of indexes. There are four steps in the WLC based on the above Equation (2): selecting index (i), providing index value (Xi), determining index weight (Wi) and employing the overlaying rule [26,27].
Finally, 10% of best suited locations for the agriculture, based on the future LULC (2040 year), were selected for future agricultural development in addition to the existing agriculture LULC. Upon generation of the future LULC scenarios, we analyzed the future dynamics and interchanges among LULC classes by comparing the three scenarios: baseline (historical), business-as-usual (future) and conservation (future) scenarios.

2.4. Watershed Modeling

SWAT version 2012 was used to simulate nitrate [10]. Required input datasets include topography (DEM), climate (precipitation, air temperature, solar radiation, wind speed and relative humidity), hydrology, soil, vegetation, LULC, point sources and agricultural practices (e.g., manure and fertilizer). The watershed was delineated into 27 subwatersheds and 407 Hydrologic Response Units (HRUs). A uniform spatial resolution of 30 m was used for the spatially distributed datasets and a daily time step was used for all the temporally varied datasets. Collected data from five meteorologic stations, which were in or close to the study watershed, were used to represent the climate data. Point sources in the watershed included fish ponds along the river, residential houses (pets and straight pipes), industrial plants, dairy, poultry and livestock slaughterhouses, a pharmaceutical factory and livestock enclosures [18]. Required information on cropping pattern, planting and harvesting dates, irrigation management, the area of the main cultivated crops and fertilizers, were obtained from Iran’s Ministry of Agriculture Jihad (MAJ) [30]. We also verified and updated these data by interviewing several local farmers.
The actual evapotranspiration (ETact) was simulated in SWAT via a user-defined potential evapotranspiration (ETP) method and daily leaf area index (LAI). For the purpose of this study, we: (1) specified harvesting period (growing season) of major crops in the model; (2) adjusted the parameters affecting LAI, ETact and crop yield; (3) simulated and calibrated LAI and actual daily evapotranspiration, and finally, (4) simulated the crop yield.
SWAT Calibration and Uncertainty Procedures (SWAT-CUP) [31] was used to assist with the model parameterization and Sequential Uncertainty Fitting version 2 (SUFI2) was used as the optimization technique. The periods of 2001–2010 and 2011–2014 were used for calibration and validation, respectively. Calibration parameters are listed in Table 2; these were selected based on the general recommendations for SWAT calibration [12] and previous SWAT applications in the study area [18]. Observations at three stream gauges—Solaimantange, Rigcheshme and Kordkhil—were used to calibrate and validate the model for the 2000–2014 period. Nash–Sutcliffe efficiency (NSE) (Nash and Sutcliffe, 1970) and coefficient of determination (R2) were used to assess the model performance. The model performance was graded following the recommendations by Moriasi et al. [32,33] and Ahmadisharaf et al. [34] Additional details on the model setup and calibration-validation can be found in the study of Rajaei et al. [18].
The calibrated-validated model was then applied to simulate nitrate in the baseline (2010) and the two future (business-as-usual and conservation) scenarios. In these simulations, only the LULC dataset was changed and other model inputs were kept the same. The simulated nitrate in a five-year period (2035–2040) was used for the comparative analyses between the baseline and future scenarios.

3. Results and Discussion

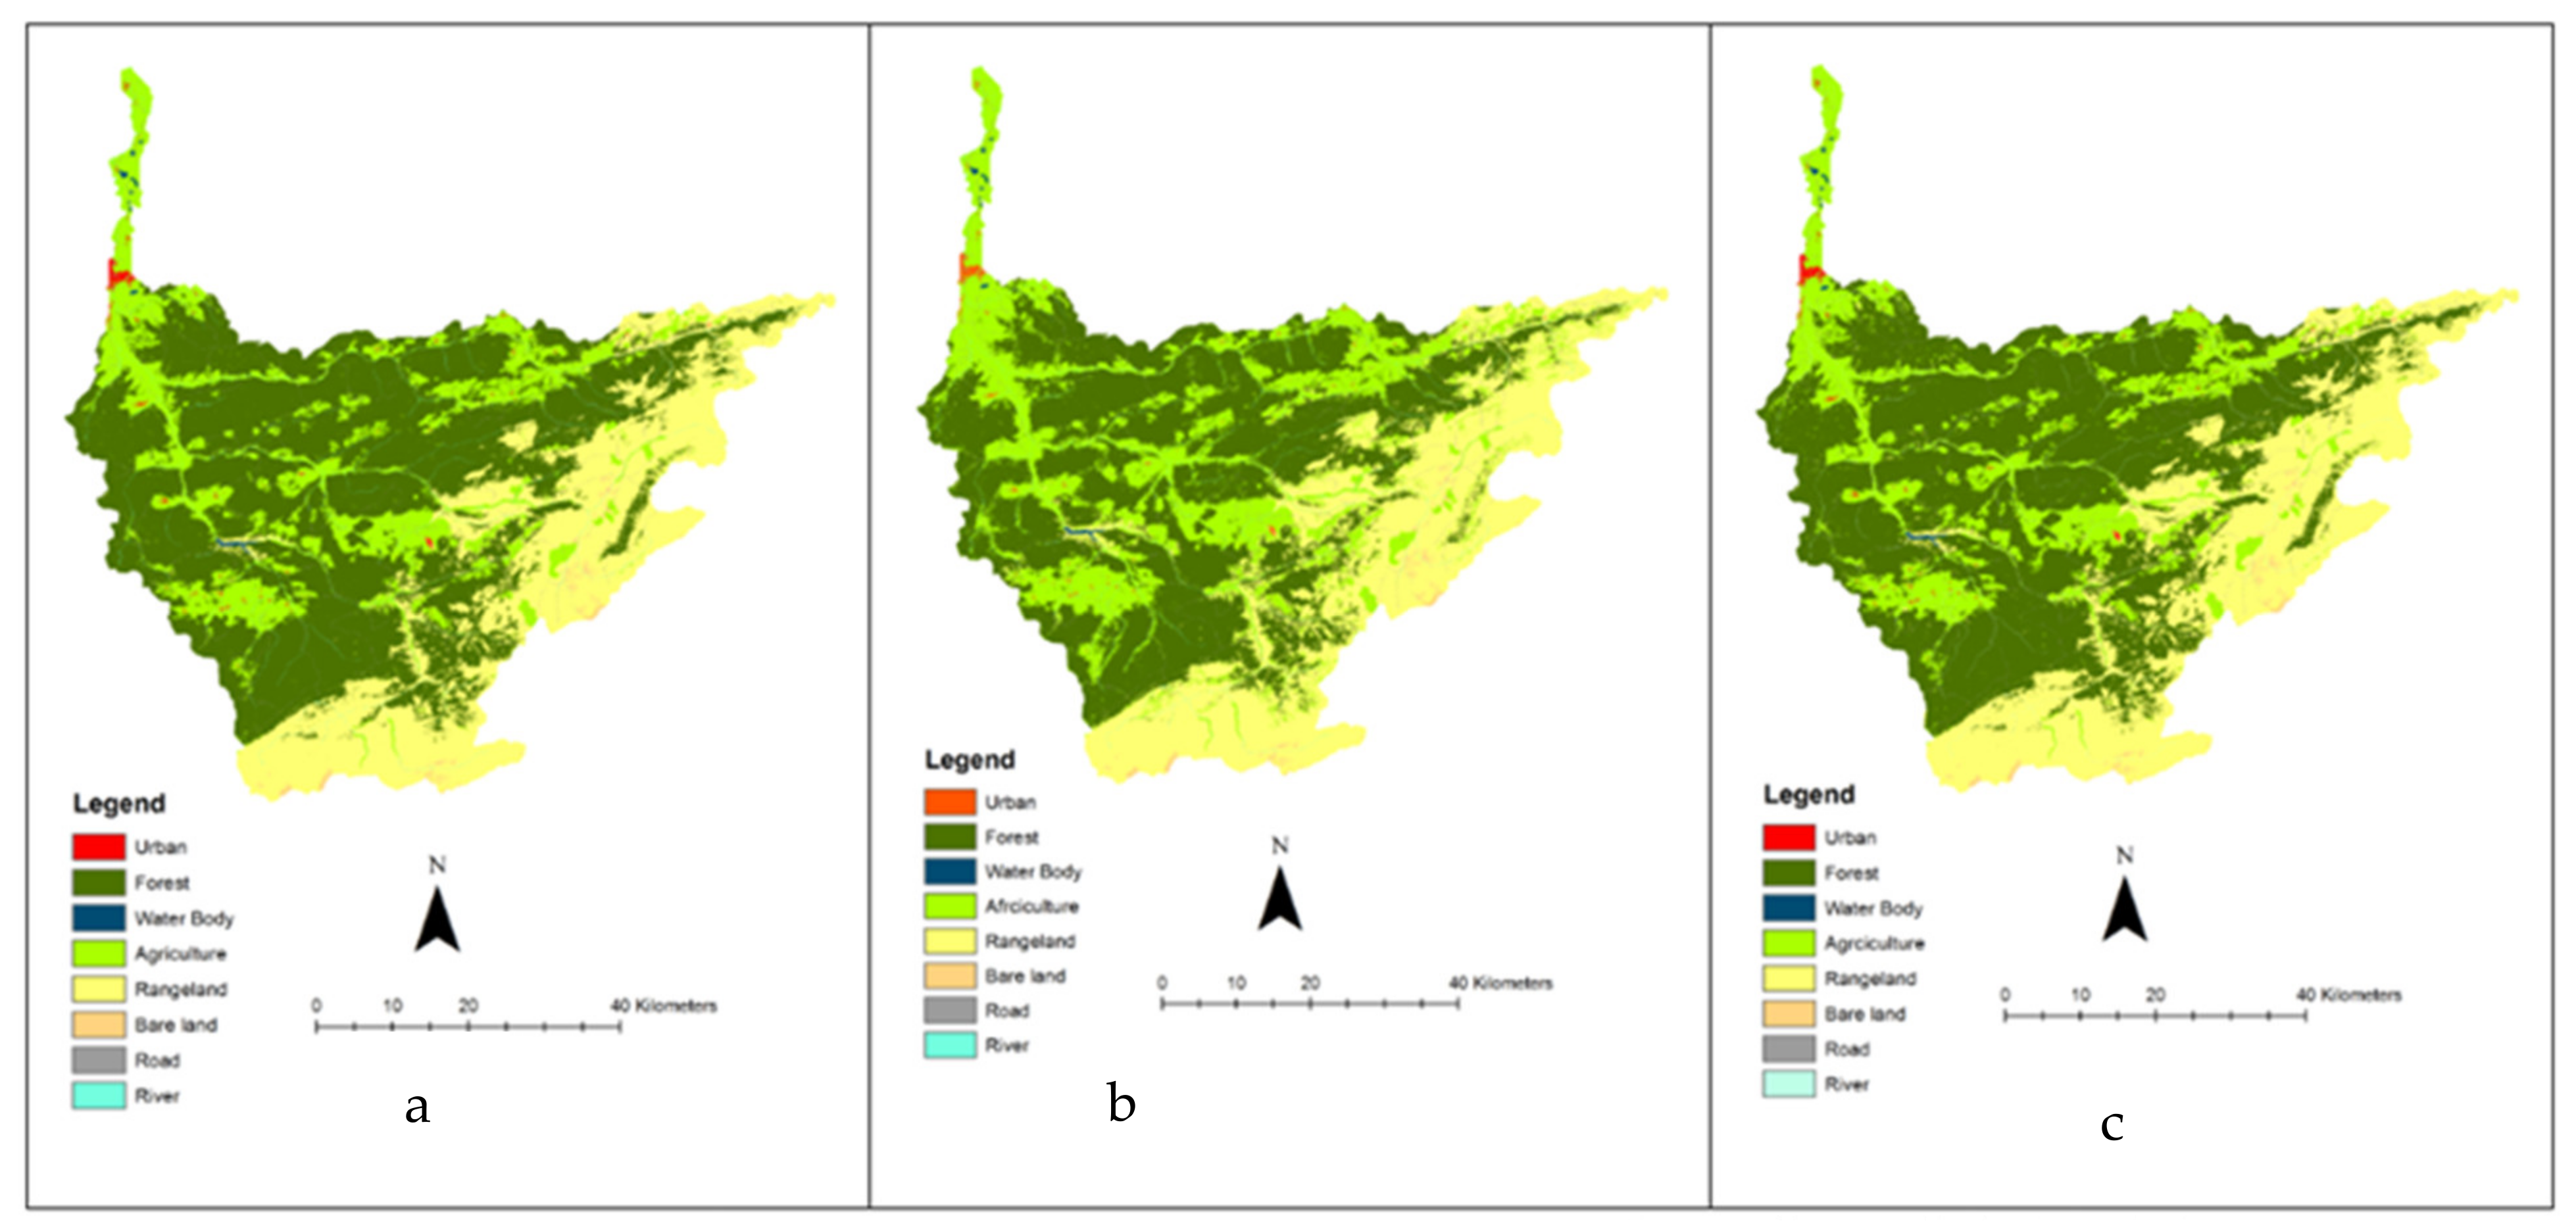
3.1. Land Use/Land Cover Change Modeling

The overall kappa index in the LULC maps of 1984, 2001 and 2010, was 81%, 83% and 87%, respectively. The results of the model validation show that the predicted output of the model had an ROC value of 0.92, suggesting a high spatial agreement to the reference LULC map (2010). Hits to false alarms ratio was at 45%, which reflects the accuracy of predicted changes. Accuracy rate and skill measures of transition modeling using MLP were 0.82 and 0.81, respectively, suggesting a satisfactory performance based on Onate-Valdivieseo et al. [35].
Major LULC changes in Tajan watershed have occurred during the past 26 years (1984–2010). The rates at which the transition occurred is of concern, as high transition rates might act in the system as if they were unique and extreme events from which the system need to recover. During the period of 1984–2010, forest area decreased from 286,748 ha to 281,983 ha, while the area of pasture and agricultural increased from 75,821 ha and 90,919 ha to 107,236 and 123,145 ha, respectively. The forest was still the dominant land cover in the entire period (72% in 1984 and 55% in 2010). Area occupied by agricultural land was 19% in 1984 and 26% in 2010. In general, gains in the agricultural land came from forest and pasture land We projected that, during the 2010–2040 period, forest areas can decrease by 34,739 ha (16.3%), if the recent LULC trends continue (Figure 3a,b). Pasture and agriculture are expected to increase by 7668 ha (+7.3%) and 27,071 ha (+40.5%), respectively. In the business-as-usual scenario, forests are projected to face a high conversion to other land covers, in which only ~84% of its 2010 extent will remain in 2040.
The LULC trends detected for the study watershed was similar with trends in other parts of Iran and the world [36,37,38,39,40,41]. Deforestation is due to the expansion of agricultural land, with more than 70% of deforested land in Africa and Asia and about 90% in South America being converted to farmland [42]. During the 26 years studied (1986 to 2010), about 1.6% of the forests in the Tajan watershed have decreased, most of which, like other parts of the Hyrcanian forests [43] has become the agricultural land. This trend of forest reduction has been less compared to deforestation in other areas of Iran and the world. For example, between 2000 and 2012, about 32% of the world’s tropical forests were destroyed [41]. However, it is predicted that about 0.5% of the forest area of the Tajan watershed will decrease per year by 2040, which is more than 0.06% of the global average projected for 2030 [44,45]. Moreover, the deforestation rate of the study area is higher compared to the western Iran, which decreased by an average of 0.4% per year during the years 1993 to 2016 [46].

3.2. Future Land Use Planning

We produced the suitability map for LULCs via the MCE module of IDRISI software. The top 10% areas with the greatest suitability were chosen as the most suitable areas for future agricultural expansion in the watershed (Figure 3c). The results showed that sub watersheds 21, 17, 12 and 13 are the most suitable areas for agricultural development in the future. As per the resulting land suitability map, the suitable area for cropland was 2379 ha.

3.3. Land Use/Land Cover Change Impact on Nitrate Load

Using the criteria suggested by Moriasi et al. [33] and Ahmadisharaf [34], the model represented the observed flows and nitrates satisfactorily, during both the calibration and validation periods. Model evaluation statistics and optimized parameter values for calibration and validation of runoff and nitrate for the three stations are presented in Table 3 and Table 4. Observed and simulated nitrate during calibration and validation period for the three stations are presented in Figure 4. Also, Figure 5 shows the simulation values and the reported values of the National Water Document. The results of this figure indicate the proper performance of the model in simulating real evapotranspiration. Due to the lack of lysimetric data in the region, the maximum reported evapotranspiration rates from the Iran National Water Document in the study area were used as a basis for comparison and calibration of the model for each crop in wet years. The mean values of simulated evapotranspiration were compared with the mean values of maximum evapotranspiration reported by the Iran National Water Document [47].

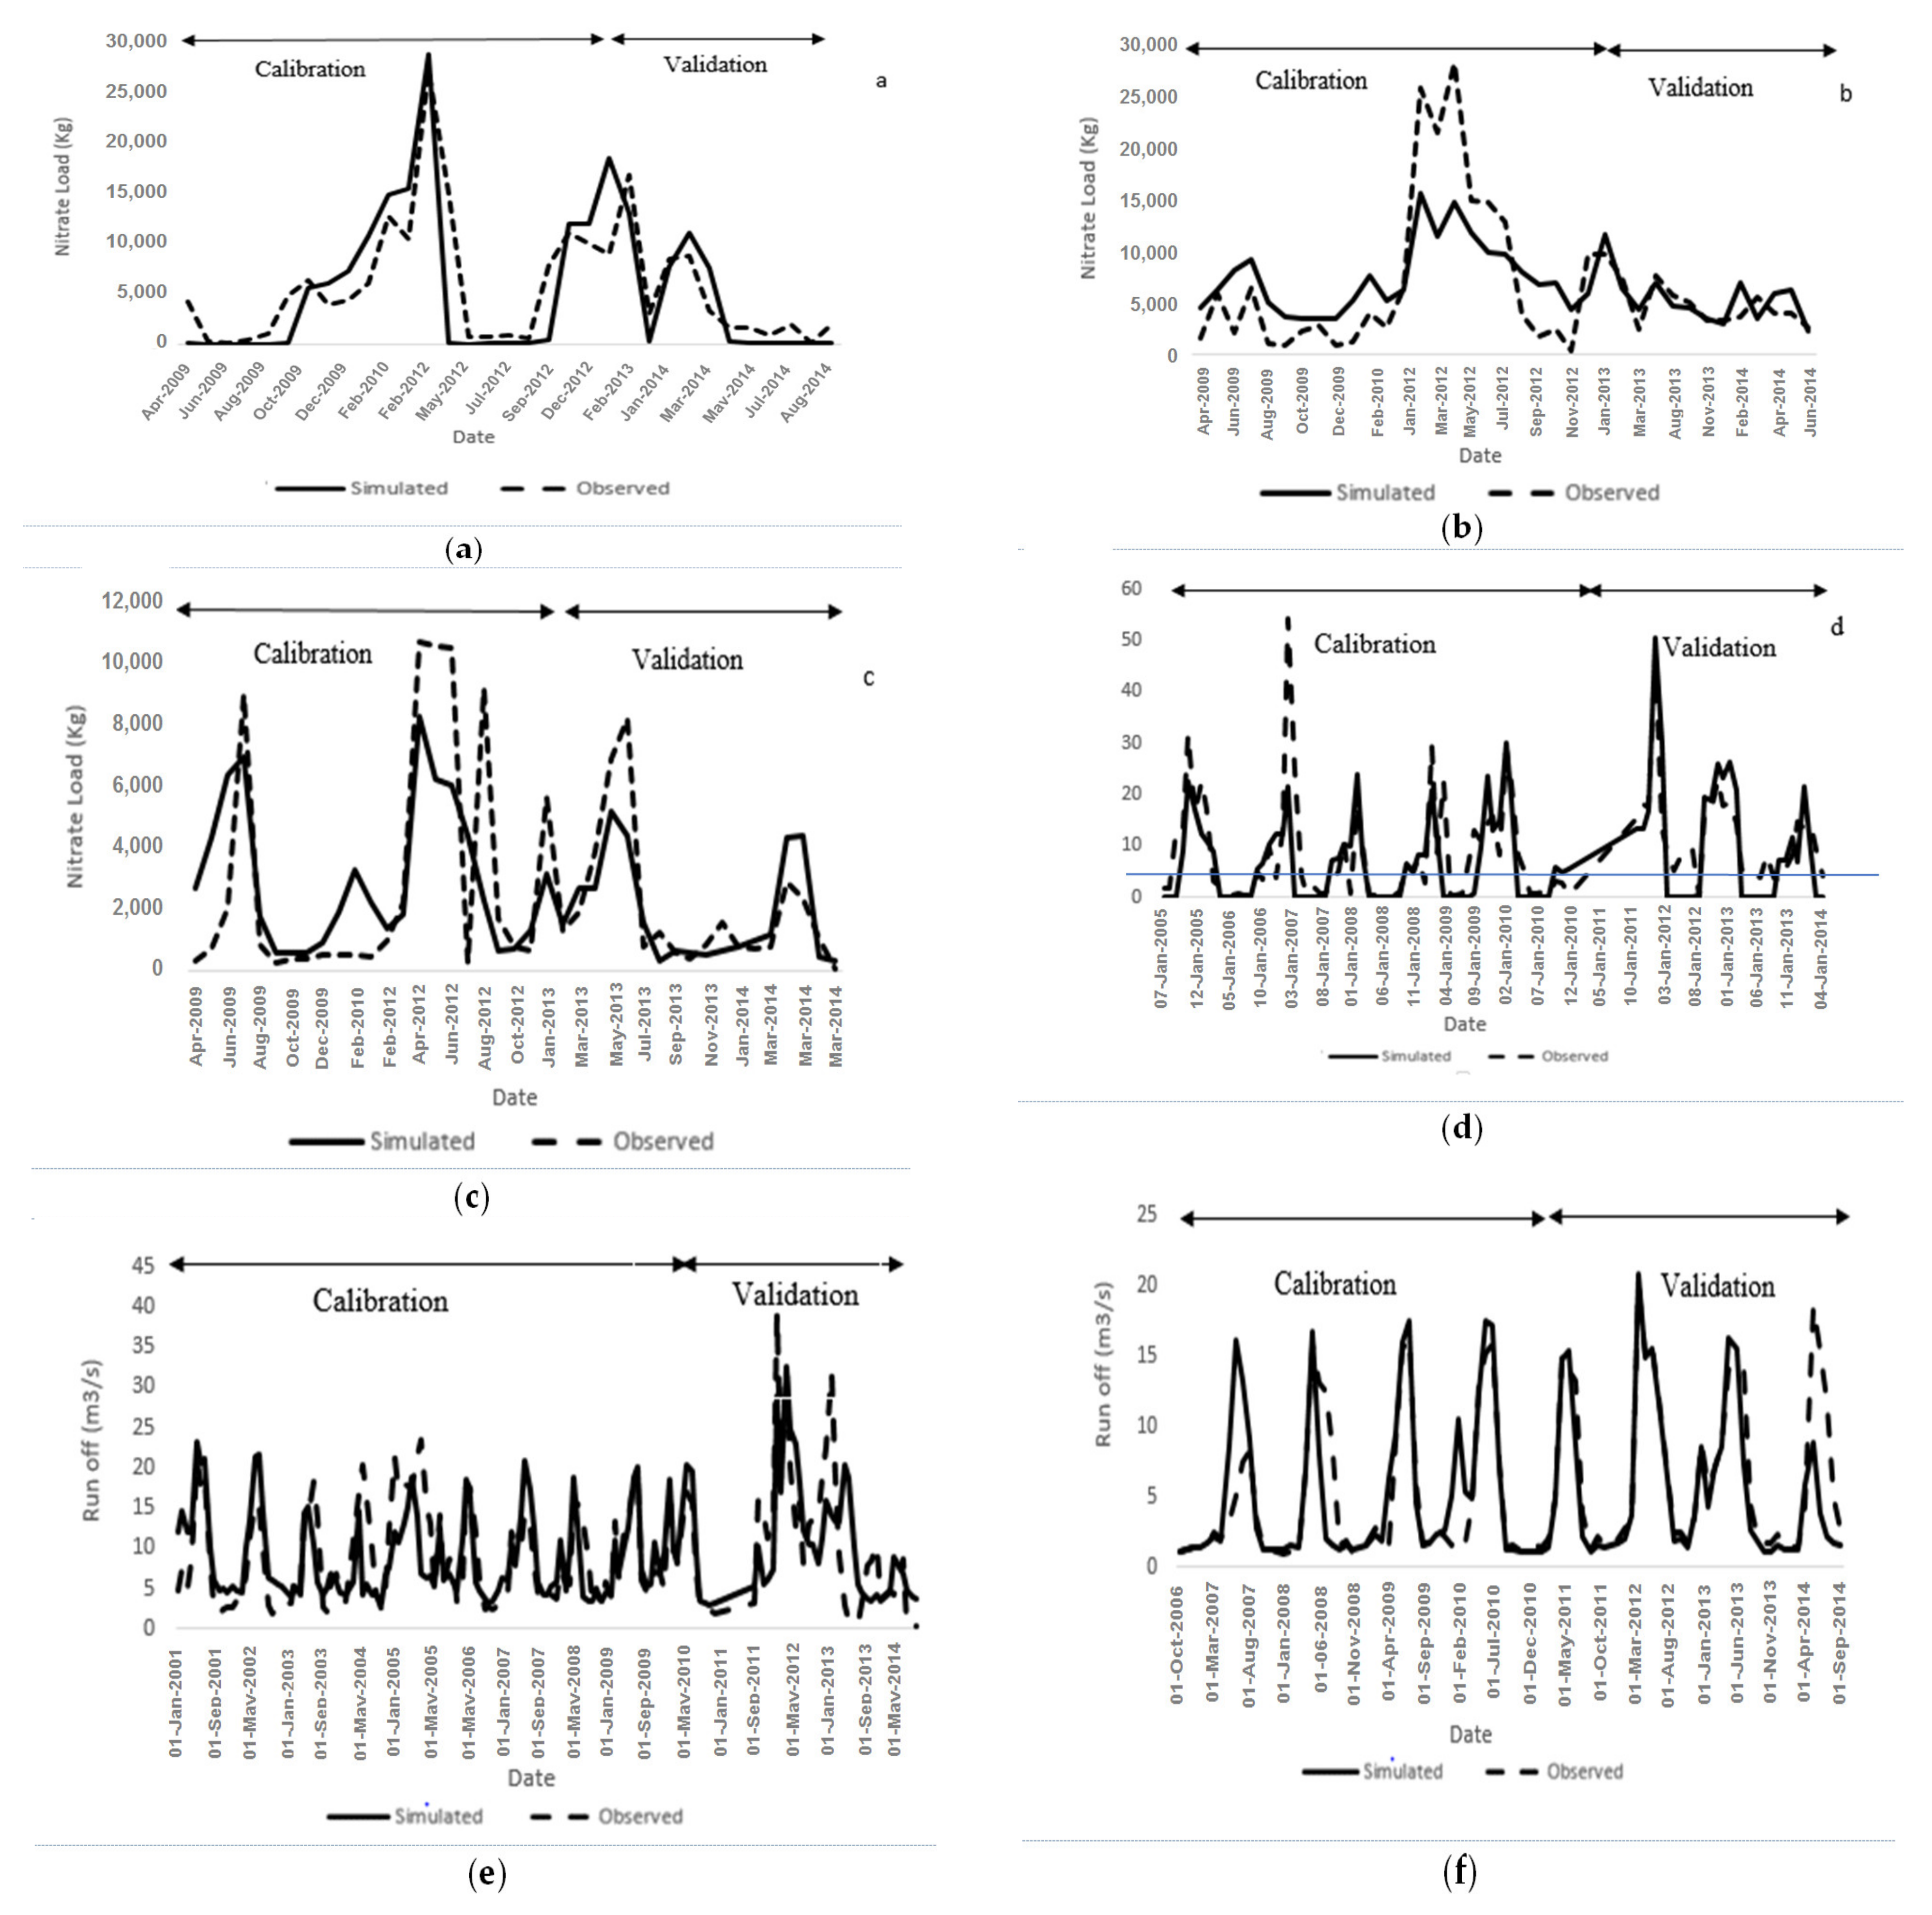
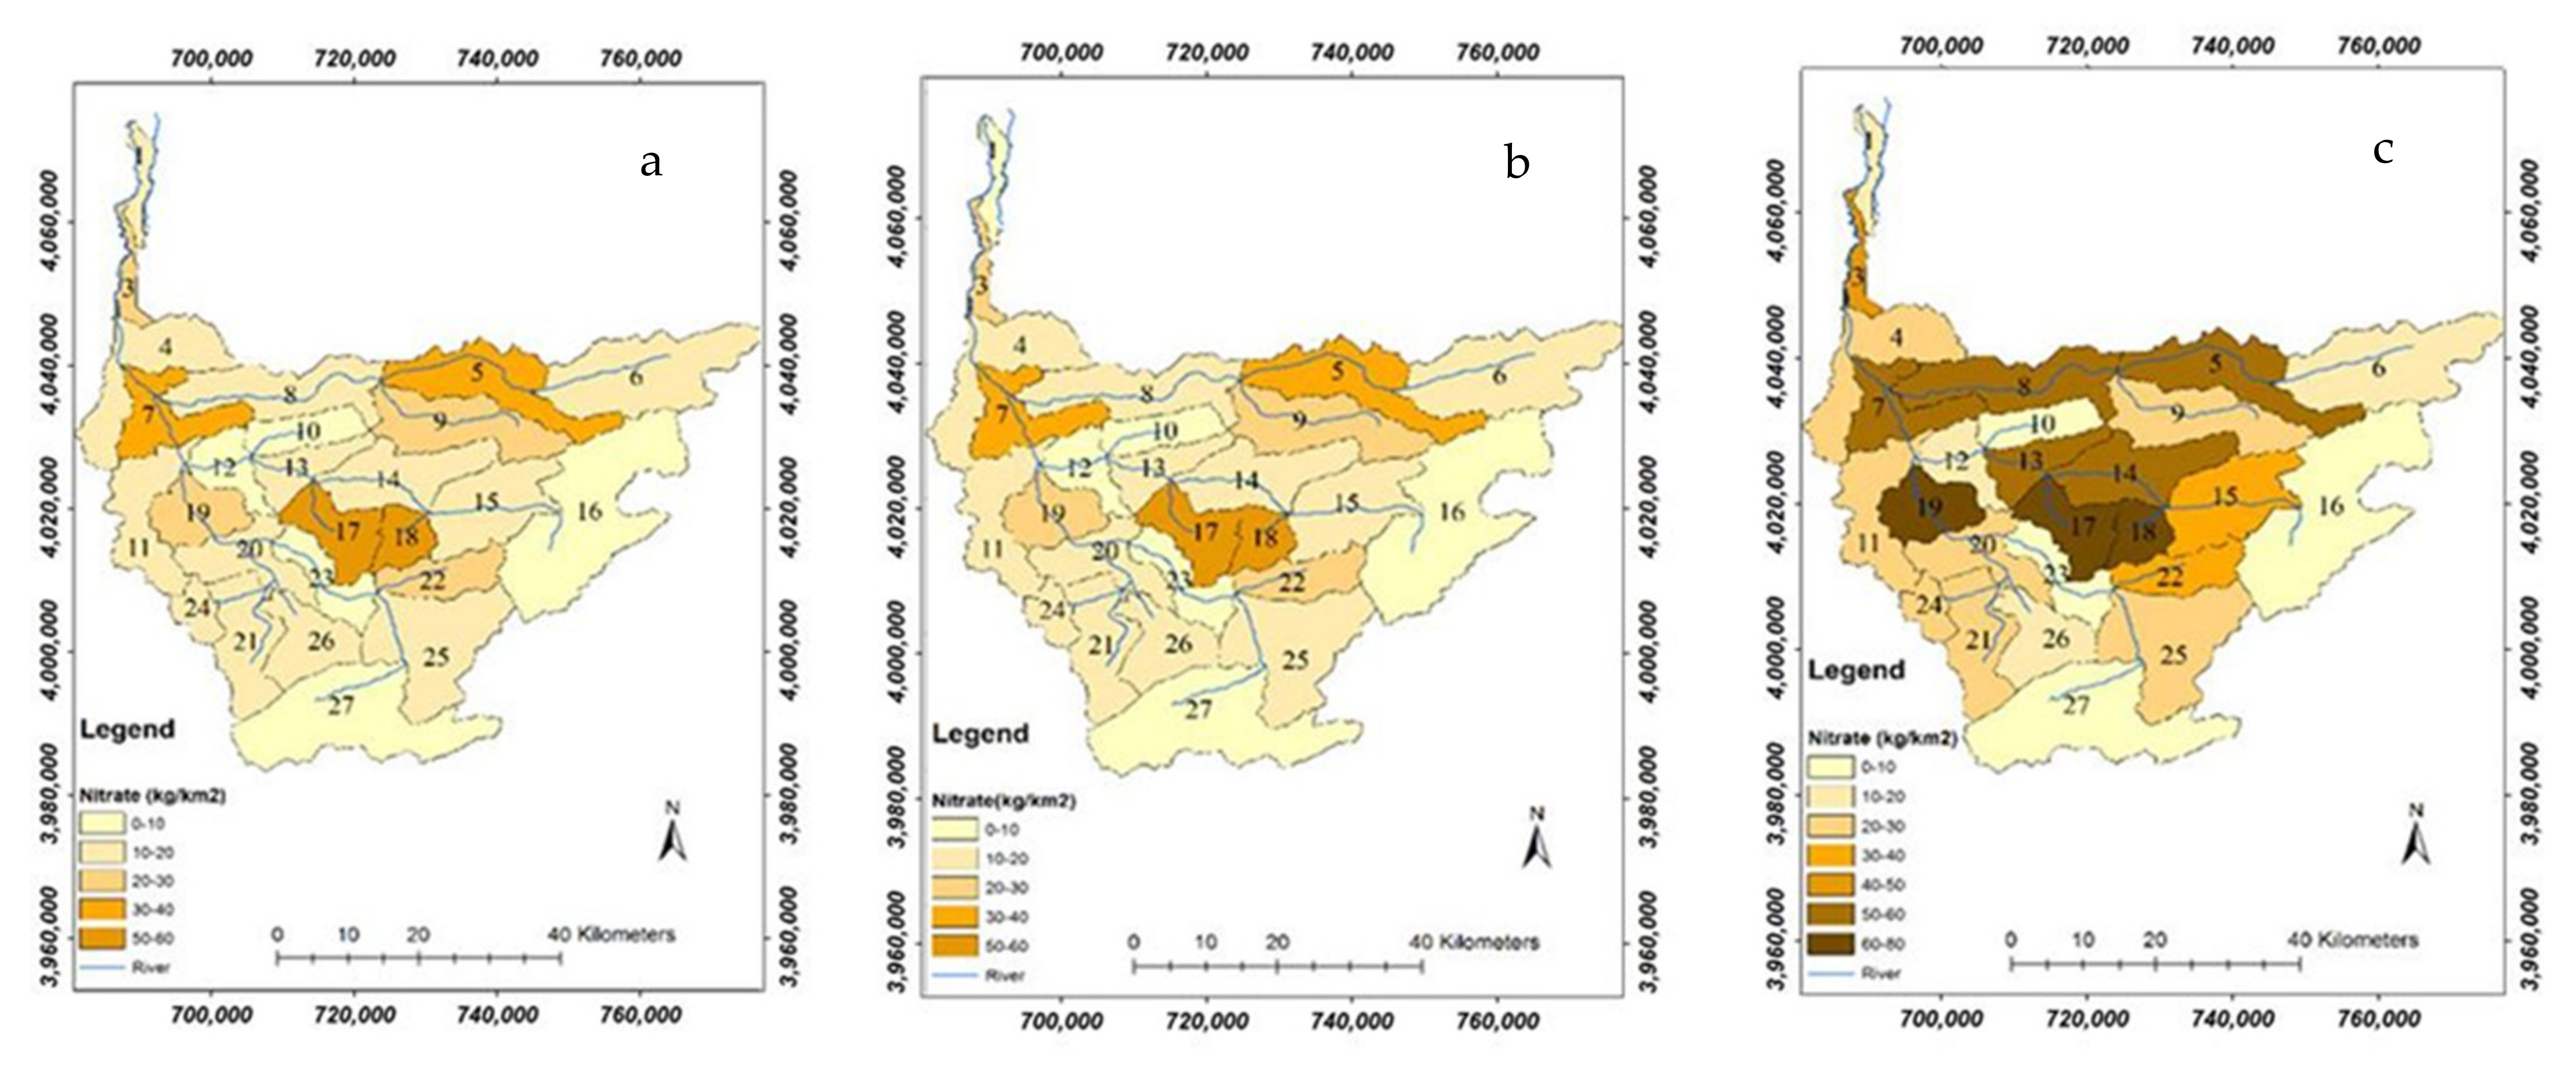
3.3.1. Projecting Annual Nitrate Loads

Figure 6a presents the spatial distribution of nitrate loading in comparison to the baseline scenario (year 2010). We found that changes in nitrate export at the scale of full watershed was not significant (significance level = 0.05). This finding is in agreement with previous studies [48,49] that the impacts of LULC change on total nitrogen pollution is smaller at larger spatial scales. The information on spatial distribution of nitrate can help water managers to understand and prioritize subwatersheds for pollution mitigation. Of the 27 subwatersheds, midstream subwatersheds 18 and 17 exported the greatest nitrate loads, primarily because of the large percentage of agricultural land, population centers and the presence of several point sources.
Subwatershed 19, 7, 3, 17, 18 and 5 have larger nitrate loads than other subwatersheds, due to the extensive expansion of agricultural areas, existence of population centers, recreation and industries, and accumulation of fish farming ponds. Field surveys and interviews with local people as well as urban and rural water and sewerage officials, Sari County Environment Department, identified the main contaminating population centers in Tajan watershed, including the entry of part of Sari and suburban sewerage, indicated that about 10,000 people in the city of Sari (subwatershed 3) and Kiasar (subwatersheds 17 and 18) discharge their sewerage directly into the Tajan River. Further, field visits of the region, interviews with the officials of recreation centers and information from Sari Tourism Organization showed that a massive load of pollution is exported by the tourists, including subwatersheds 19 and 3 were recognized from other locations of pollution entry to the Tajan River, especially in spring and summer. On the other hand, the nitrate load is lowest in subwatersheds 23, 16, 27 and 10, primarily due to the low percent of agricultural land and the dominance of forest and pasture. Many studies have showed that pasture and forest have a positive contribution to water quality [50,51]. The results are consistent with previous studies and confirm the mitigating effects of forest and grassland LULC on nutrient pollution [52,53].
The conservation scenario proposed in this study can guide implementing conservation plans to reduce pollution, preserve valuable forest resources and well-informed selection of lands for farming. Other studies have also shown the positive impact of conservation scenarios on improving the quality of the environment. For example, Wilson and Weng [54], the results of LCM for three future land use/planning scenarios showed that the development of commercial and industrial sectors can help reduce the level of some pollutants, especially phosphorus. Under the economic and conservation scenarios developed by Shrestha et al. [55], the in nitrate nitrogen loading was significantley decreased in the future. In the planning scenarios defined by Trisurat et al. [56] emphasized on the participation of local people in conservation activities, reforestation and mixed-cropping system, the level of water resource pollution in the case study area is significantly improved.
Future LULC change (business-as-usual) can result in up to 100% increase in nitrate load by up to 29 kg/km2 in the Tajan watershed (Figure 6b). Analyzes of subwatersheds in 2040 showed that in many subwatersheds, where agriculture areas increased, nitrate loading also was increased. Such an increase in nitrate load could be due to growing crops in newly transformed areas that would require fertilization. Subwatersheds 6 (upstream) and 10 (midstream) exemplifies the opposite trend of other subwatersheds, where both forest and pasture LULCs were converted into croplands but increase in nitrate load was still low. This can be due to the agricultural growth. Therefore, although we find a positive relationship between the changes in LULC and their impact on nutrient loading, other characteristics of subwatersheds such as topographic slope may also play a vital role in nutrient export by the subwatersheds [57]. In upstream subwatershed 21, the increase in cropland area would produce less nitrate load. On the other hand, midstream subwatersheds 19 and 14 have relatively small LULC change but nitrate loading significantly increases in these subwatersheds.
As can be seen on Figure 3, by 2040, if the historical LULC trend continues, forest will be reduced significantly (212,081 ha to 177,342 ha) and will be converted to agricultural and pasture land. While LULC changes show potential for some agricultural activities, they may not be feasible for farming due to other factors such as soil and slope. In this scenario, most increases to agricultural LULC occurred in subwatershed 21, but nitrate load had a minor change (<0.1%) (Figure 6c). This can be because changes selected in the most suitable areas for agricultural expansion as characteristics of individual subwatersheds may play a vital role in the nitrate export. This may partially explain why larger amounts of LULC change in different subwatersheds have less impact on the nitrate load at the outlets of subwatersheds [58]. As mentioned in Section 2.3, many factors were used to select the most suitable area for future agriculture expansion. For example, low nitrate pollution in subwatershed 21 can be because the farms are located in the appropriate slope and therefore have less runoff. In a study by Shen et al. [59], watershed characteristics (topography, ground slope and drainage area) were found to be the important factors in determining the nitrate loading.

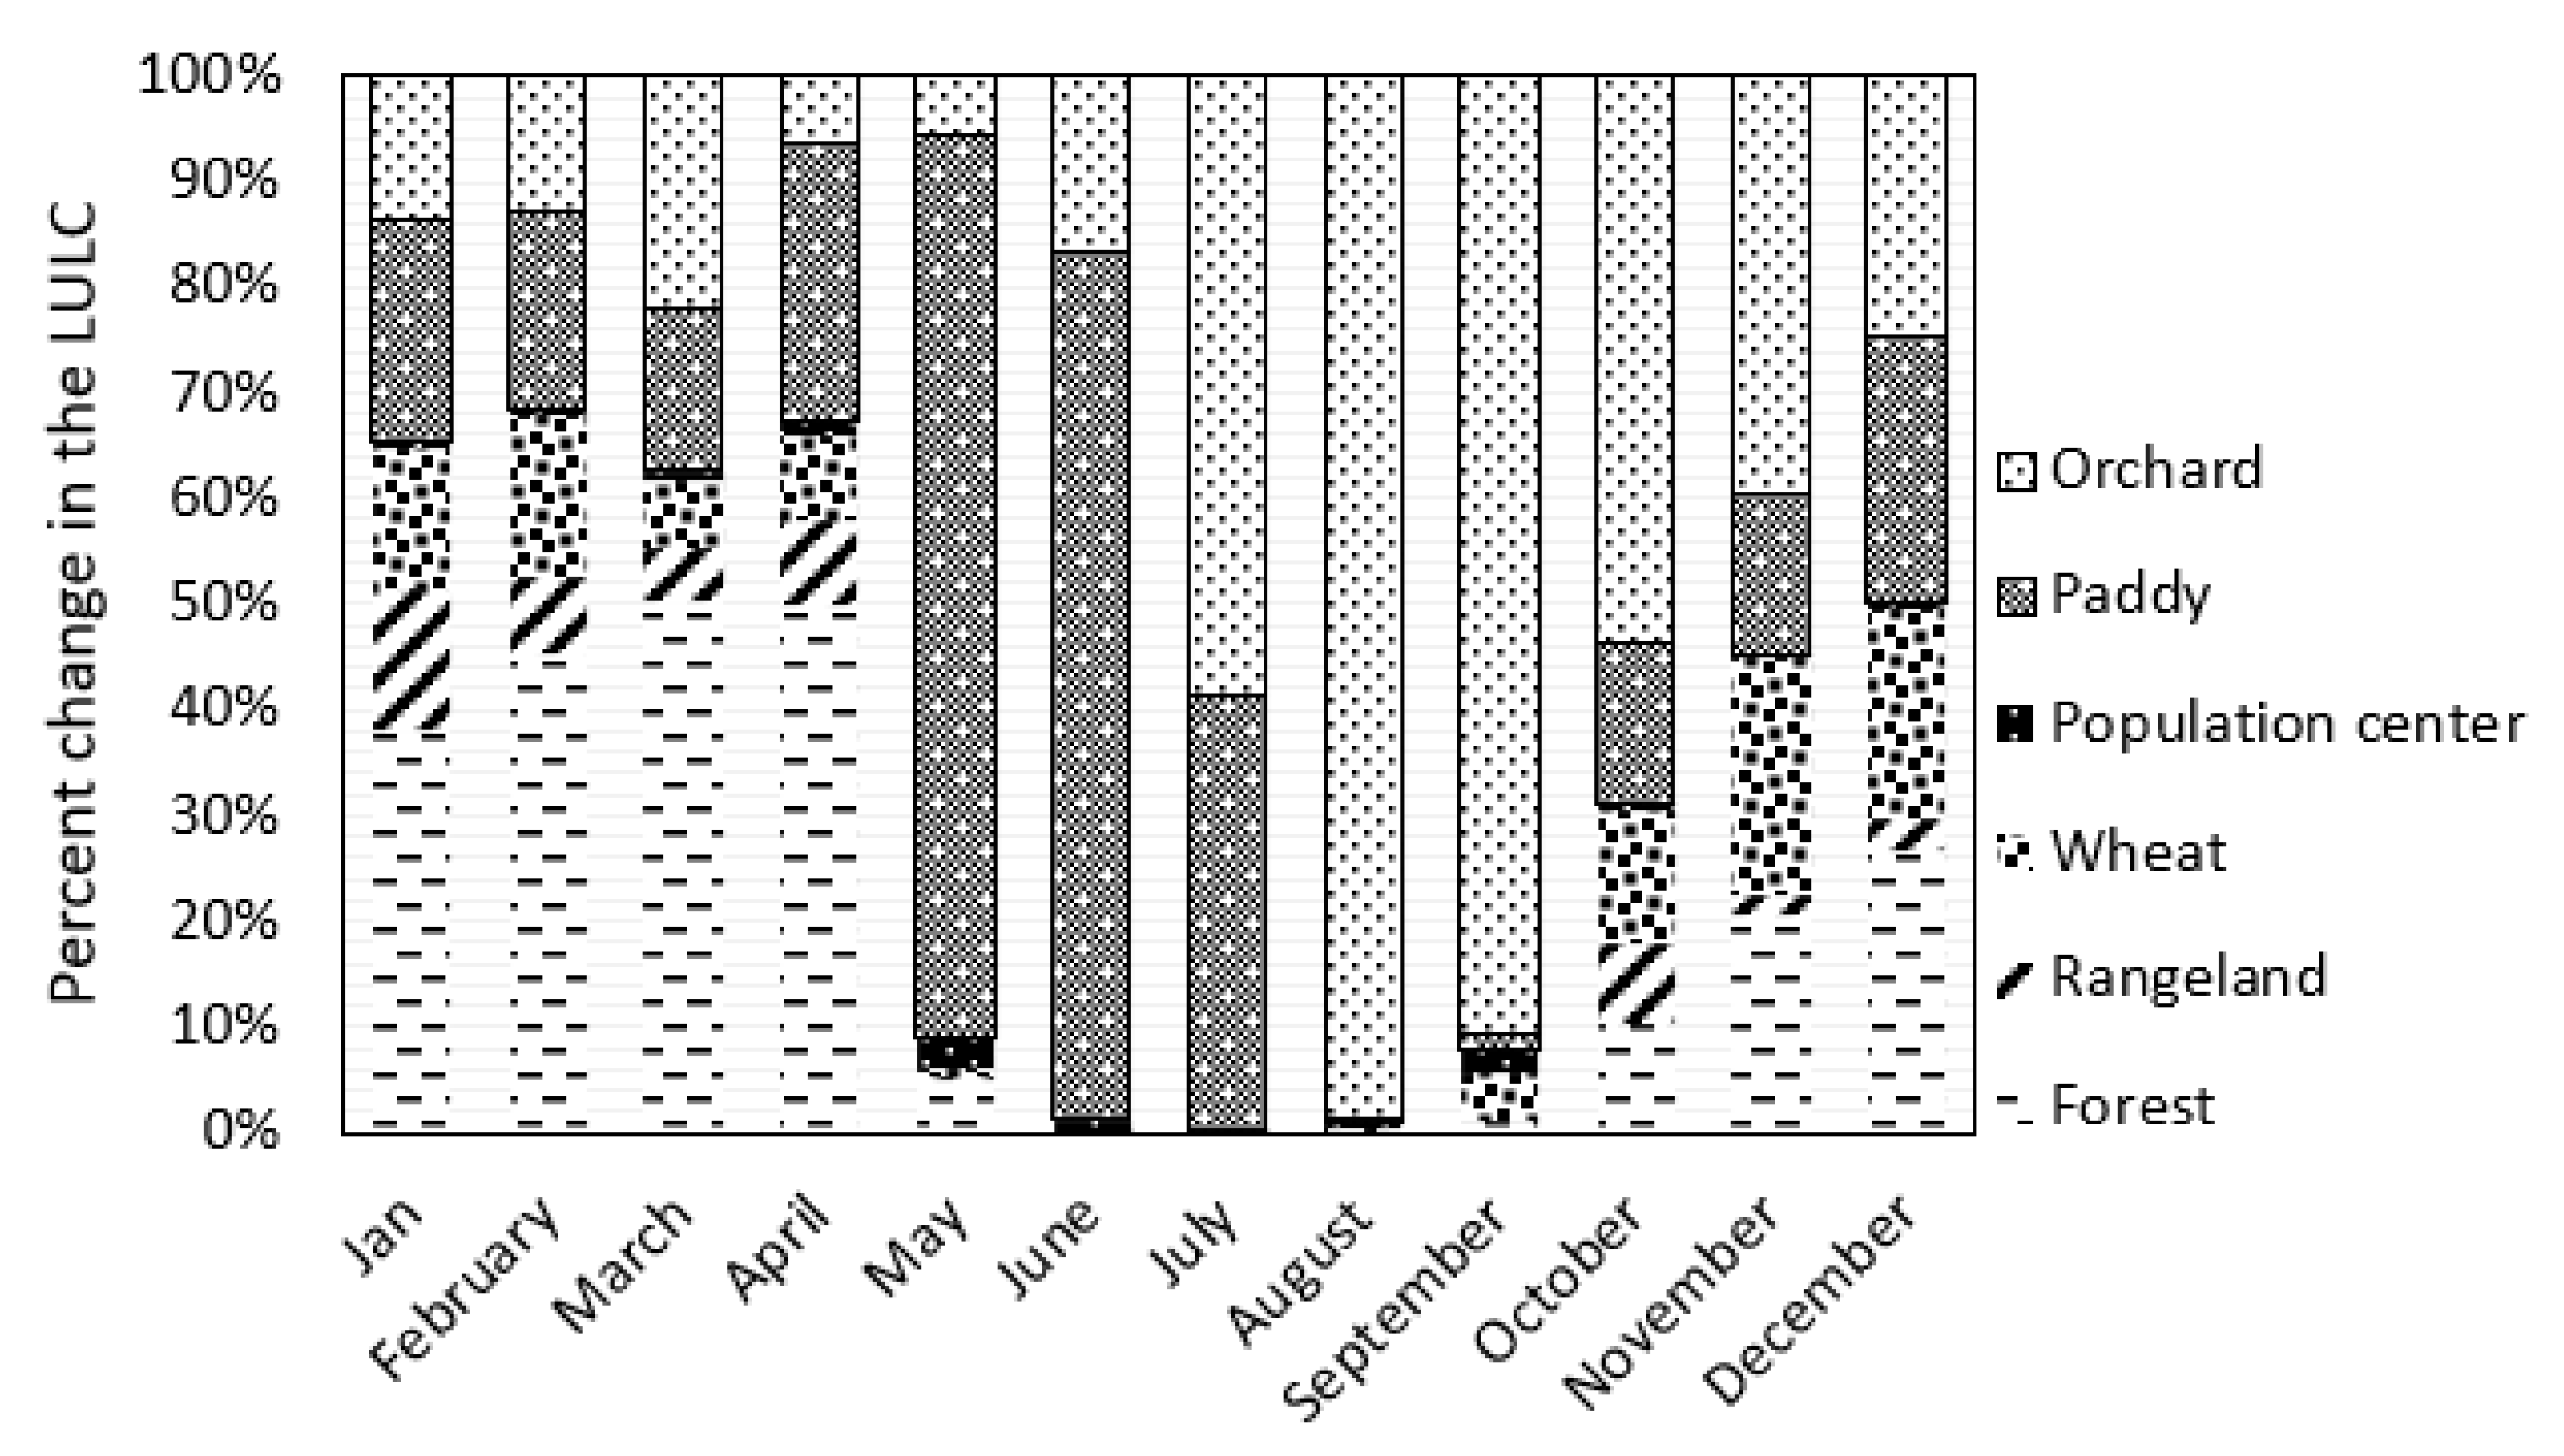
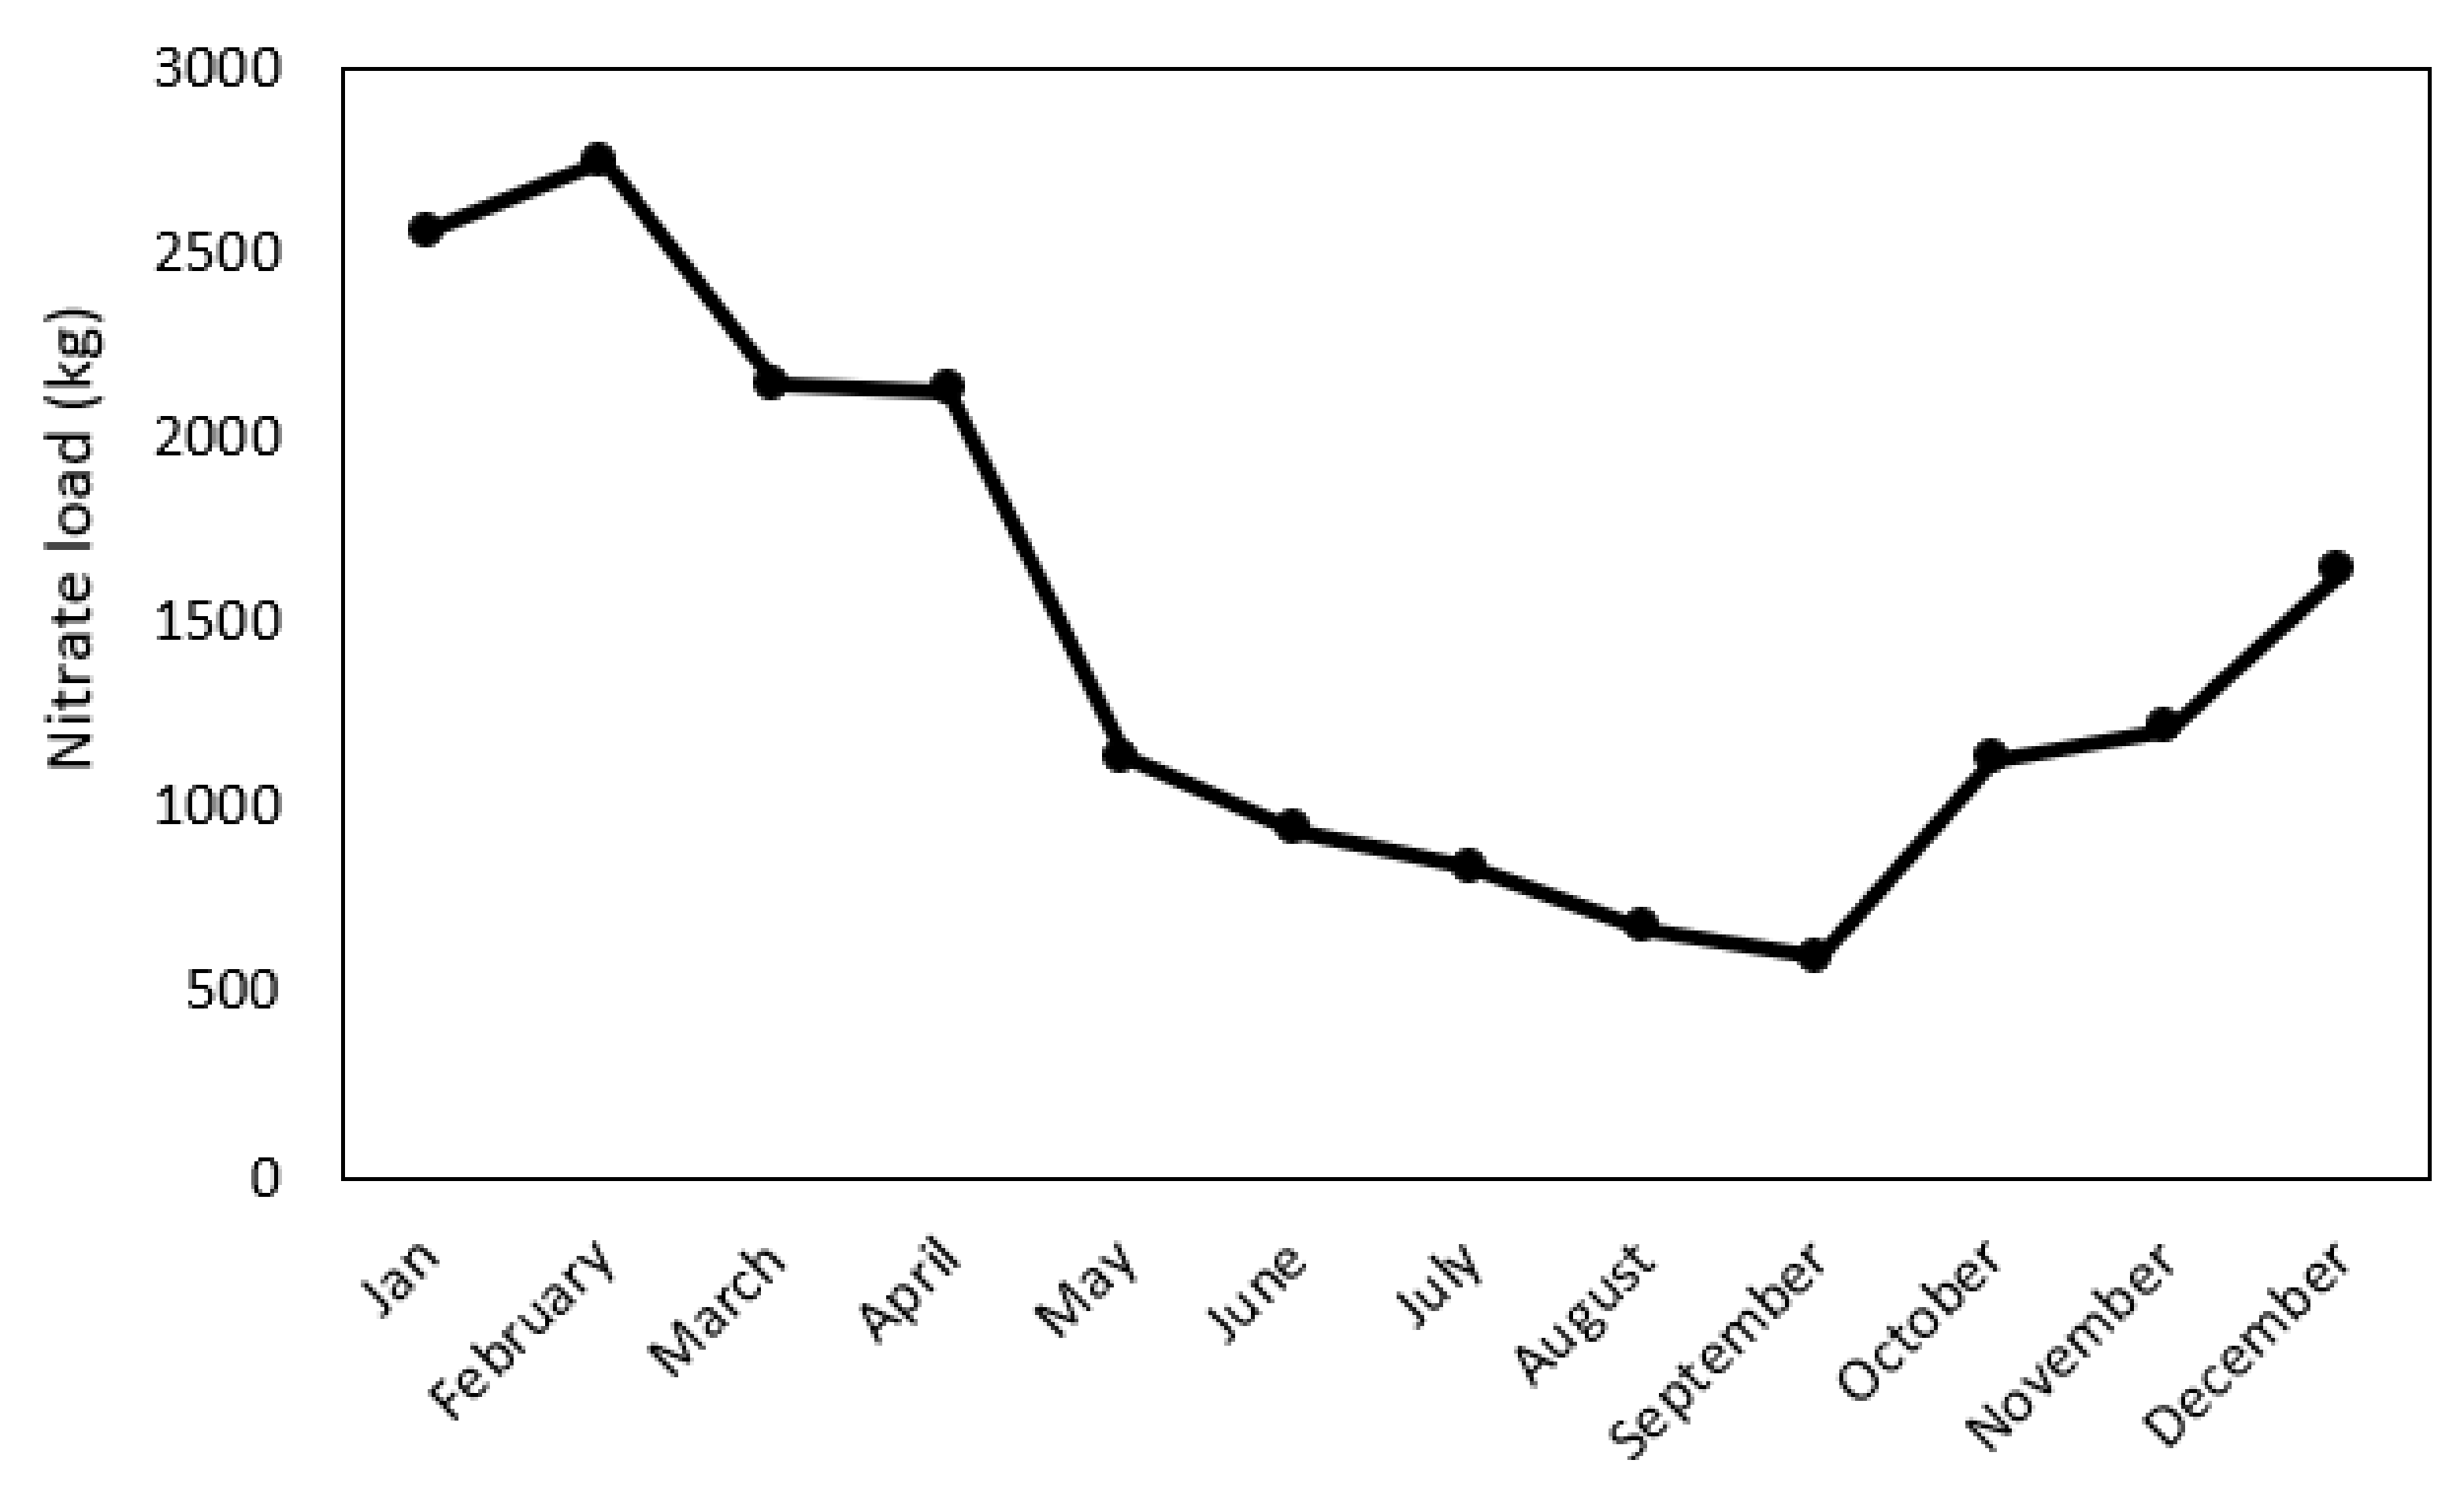
3.3.2. Projecting Monthly Nitrate Loads

By calculating the average monthly values of nitrate load in the simulation period separately for each user and then estimating the share of each user compared to other uses, the pattern of monthly nitrate changes per user was obtained, which is shown in Figure 7. Pastures, which cover 23% of the watershed, only 5.7% of the nitrate load of the basin, while agricultural lands, which cover only 20% of the study area, yield more than 64% of the nitrate load. Nitrate pollution in the agricultural LULC seems to be higher than other LULCs, primarily due to the application of chemical and animal fertilizers, suggesting that the abundant fertilization in agricultural fields has a negative effect on the water quality. In confirmation of this, many studies have reported that urban and agricultural use plays an essential role in reducing water quality in the adjacent water system, changing soil surface conditions, increasing impermeable surface, and producing pollution. Additionally, the amount of nitrate load produced by a cropland depends on the type; rainfed wheat, rice and orchards are the main crops in this region. Rainfed wheat accounts for 13% of the nitrate load, while about 55% of the agricultural land is allocated to this crop. As a result, less polluted runoff is produced and nitrate transfer is postponed to the beginning of the rainy season and with the increase of surface flows in October, December and September, there is a significant increase in the amount of nitrate output in this LULC. Paddy fields account for 25% of the agricultural area and 25.5% of the annual nitrate pollution. Different rice cultivation compared to other crops, the use of abundant fertilizer and a long period of flood cultivation have caused soluble nutrients to be easily lost. It is observed that nitrate output from rice fields reaches its maximum in the spring (May-June). Considering the cultivation and fertilization stages in this season, it seems reasonable to increase nitrate transfer from paddy fields. Nutrient loss occurs when water overflows from paddy fields during rainfall events and overflows [60]. About 20% of the agricultural land is covered by orchards, while 25.5% of the nitrate production is shared. Orchard cultivation, like rice cultivation, has a high share in nitrate output. Orchards have the highest nitrate content in the summer. This increase may be because in the warm months of the year, the amount of irrigation reaches its maximum, which causes the transfer of large volumes of nitrate. Animal manure is also used in large quantities in orchards that the application of this manure is always associated with the loss of large amounts of nitrogen and leaching excess amounts can increase the pollution load to the water. Population areas cover 1.3% of the basin but produce 6% of the nitrate pollution. The load leaving the population centers due to the population sewage caused by the population centers flows in almost all months, except the dry season of the year, and increases with rainfall. The results are consistent with the previous studies [50,51,61] on the positive relationship between the area of agricultural lands and discharge and negative relationship between the area of forest and rangeland LULCs and discharge.
Also, Jamshidi et al. [62] indicated that untreated wastewater and failing septic systems are the main sources of nitrate loading in the Jajrood river system. The runoff from orchards is another significant source of nitrate. It can be also concluded from the measurements that the maximum flow rate and nitrate load in the Jajrood River occurs from February to June, which implies that, nitrate load increases at high flow rates [62].
As shown in Figure 8, the nitrate time pattern indicated that the average annual nitrate load of the total output from the Tajan watershed is higher in the winter months (January-March). Nitrate load in the three winter months accounts for 49% of the total annual nitrate load (17,767 kg). The highest level of nitrate in the study period is in February (average of 2720 kg) and the lowest is in September (average of 470 kg).
These results are consistent with the study by Lee et al. [51]. From May to September, nitrate levels are inversely related to plant growth; nitrate load decreases with increasing vegetation and increases from September with harvest [63]. This indicates that nonpoint sources such as agricultural runoff play a major role in production of nitrate loading. Further, due to the decrease in rainfall in summer, the pollution transport in the river has decreased. Reduced nitrogen removal and reduced consumption by plants and microbes due to snow accumulation and low water temperature can also cause higher nitrate levels in the winter [59].

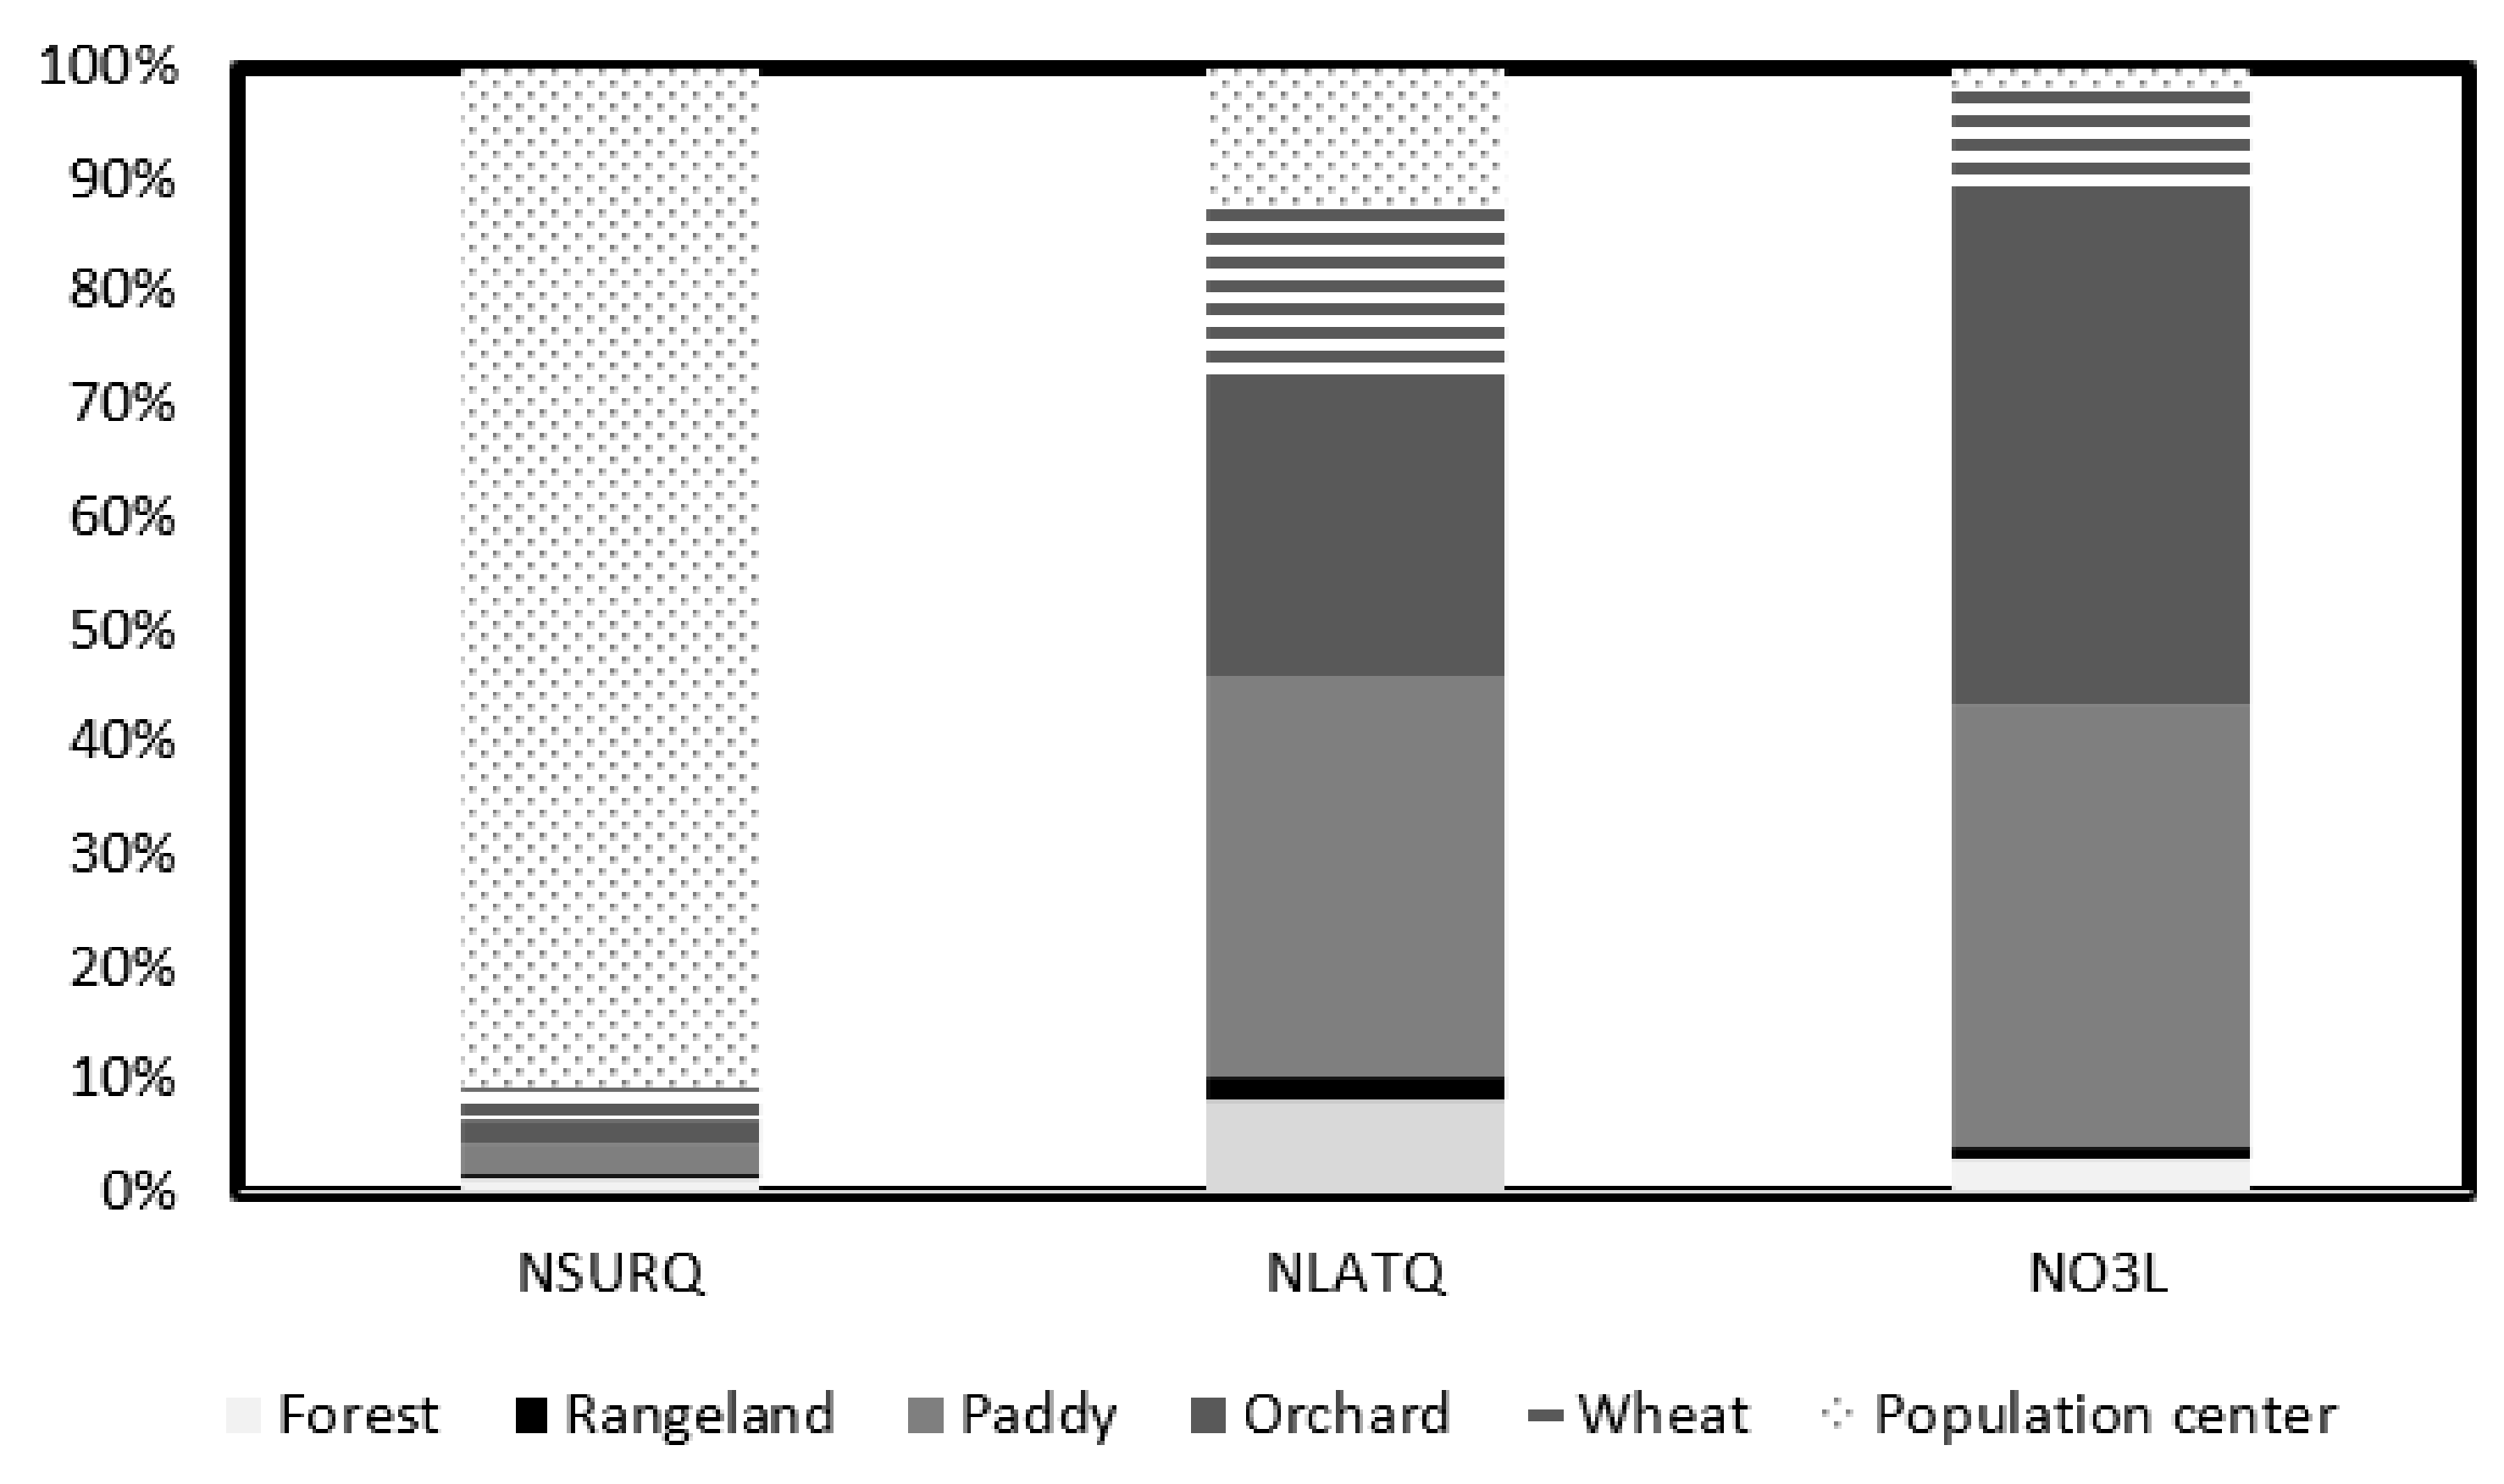
3.3.3. Components Related to Nitrate Losses

For each LULC, the nitrate export was categorized into three components of NSURQ, NLATQ, NO3L (Figure 9). The greatest percentage of nitrate export in orchards is related to leaching. In wheat crop, the highest percentage of export is related to the runoff flow, which can be due to rainfed cultivation of this crop, and rainfall will have less opportunity for leaching. However, in forests and rangelands, nitrate export is not significantly different from the three nitrate export components. In population centers, the largest share of nitrogen transfer is through washoff. Intensive fertilization during the farming season in agricultural land exports massive amounts of nitrate.

3.3.4. Limitations and Future Research

The proposed approach can be used for future land use planning by the consideration of nitrate load reduction. However, the MCE-based approach used a statistic methodology, where only a single land use scenario was suggested to achieve the water quality reduction goals. This approach did not account for the feedback (nitrate reduction) from a scenario to the next land use planning scenario. Future work should utilize dynamic optimization methods, where such a feedback informs next scenarios and eventually an optimal land use scenario is obtained.
In the modeling, management practices such as agricultural and urban best management practices were not considered. These practices reduce the nitrogen load and should be considered in the future work to provide a fuller picture of the LULC change impacts and support informed agricultural planning. We also solely focused on the surface water quality. Nutrient leaching is a critical issue in agricultural watersheds, which was not studied here. Research is needed to investigate the impacts of LULC change on nutrient leaching and evaluating the combined ground and surface water impacts. Also, the contribution of manure to nitrate loads was not considered in this study.
The proposed land use planning approach only considered one pollutant, nitrate, the main pollutant in the study watershed. Future research should incorporate multiple pollutants using approaches similar to the methodology proposed in this study. In addition to water quality goals, other water management goals, such as groundwater flow, hydrologic regime (e.g., low flows) and soil erosion, Eutrophication process can be studied for a holistic land use planning.
We used a deterministic approach for watershed-scale modeling of nitrate. No uncertainties were incorporated in the analyses. The uncertainty is present in the model inputs, the watershed model structure, model parameters and calibration-validation data [34,64]. These uncertainties affect model predictions (e.g., nitrate concentrations) and projected future water pollution. Future research should use stochastic watershed modeling [65] and ensemble modeling approaches [66] to quantify the uncertainty in the model predictions.

4. Conclusions

This paper presented an approach for informed land use planning by considering water quality reduction goals. The study predicted the future LULC impacts on nitrate loading in the Tajan watershed, north of Iran. With the recent LULC changes as a result of deforestation and agricultural activities, it is expected that continuing changes make the nitrate loading worse off in the watershed. We investigated the trends in LULC change using satellite data over 26 years (1984–2040) at the subwatershed level. Three LULC scenarios were studies: a base case (year 2010) and two future LULCs—business-as-usual and forest conservation—both of which represent year 2040. The business-as-usual scenario represented the scenario that the historical LULC trends continue in the future. Watershed simulations of future LULC projections via SWAT indicated that, if historical LULC trends continue, nitrate loading will substantially increase (up to 100% in 2040 compared to 2010). The informed land use planning approach (conservation scenario), however, showed that, agricultural development by considering the water quality impacts, can reduce the in-stream pollution.
Our results have implications for agricultural planning by considering nitrate runoff reduction. The proposed method to protect forests (i.e., conservation scenario) is useful to evaluate multiple criteria and to incorporate experts’ opinion on land use planning. Identifying suitable areas for agricultural expansion can help with the food supply and the reduction of negative environmental impacts, including the pressure on natural forests. The proposed methodology in this study can help in preventing impacts on the environment, especially runoff and flooding, soil erosion, impacts on aquatic habitats and the improvement of water quality via sustainable land use planning. An analysis of future LULC management evolution combined with the suitability of LULC can help prioritize the zones that export nitrate loads. Land use planners and watershed managers can potentially utilize the results and the proposed methodology of this study to reduce the ecological consequences of LULC change and to increase the compliance with applicable water quality standards to achieve sustainable development in the future with limited resources.
Also, this study can potentially help pollution mitigation efforts in Iran and watersheds deadling with similar agricultural issues. In Iran, our research can potentially assist the ongoing project “Preparation of solutions for quality management of the Tajan River”.

Author Contributions

Conceptualization, methodology, writing original draft preparation R.D.B., V.S; software, F.R.; validation, E.A.; investigation, resources, review and editing, R.N., V.S., B.D.; project administration, V.S., B.D.; funding acquisition, V.S., B.D., E.A., data curation, S.G., V.S., B.D.; writing—review and editing, visualization, supervision, S.G., V.S., B.D. All authors have read and agreed to the published version of the manuscript.

Funding

This research received no external funding.

Institutional Review Board Statement

No human or animal samples were used in this study.

Informed Consent Statement

I understand that the text and any pictures published in the article will be freely available on the internet and may be seen by the general public. The pictures, and text may also appear on other websites or in print, may be translated into other languages or used for commercial purposes.

Data Availability Statement

The authors declared that the data and materials for this work are available.

Acknowledgments

This work was funded by the University of Zanjan and University of Zabol.

Conflicts of Interest

The authors declared that there is no conflict of interest among them. All the authors read and approved the manuscript.

References

  1. FAO Global Forest Resources Assessment. Progress Towards Sustainable Forest Management; Springer: Berlin/Heidelberg, Germany, 2006. [Google Scholar]
  2. Tingsanchali, T. Urban flood disaster management. Procedia Eng. 2012, 32, 25–37. [Google Scholar] [CrossRef] [Green Version]
  3. IFRWMO Rport of Iran’s Forests, Range and Watershed Management Organization (2018). Repot 200. Available online: https://frw.ir/02/Fa/default.aspx (accessed on 8 June 2018).
  4. Rajaei, F.; Sari, A.E.; Salmanmahiny, A.; Randhir, T.O.; Delavar, M.; Behrooz, R.D.; Bavani, A.M. Simulating long-term effect of Hyrcanian forest loss on phosphorus loading at the sub-watershed level. J. Arid Land 2018, 10, 457–469. [Google Scholar] [CrossRef] [Green Version]
  5. Emadodin, I. Impacts of Land Management on Soil Formation and Soil Degradation during Middle and Late Holocene in Schleswig-Holstein (Germany). Ph.D. Thesis, Mathematisch-Naturwissenschaftliche Fakultät, Zürich, Switzerland, 2008. [Google Scholar]
  6. Gholamalifard, M.; Joorabian Shooshtari, S.; Hosseini Kahnuj, S.H.; Mirzaei, M. Land cover change modeling of coastal areas of Mazandaran Province using LCM in a GIS environment. J. Environ. Stud. 2013, 38, 109–124. [Google Scholar]
  7. Tavangar, S.; Moradi, H.; Massah Bavani, A.; Gholamalifard, M. A futuristic survey of the effects of LU/LC change on stream flow by CA--Markov model: A case of the Nekarood watershed, Iran. Geocarto Int. 2019, 36, 1–17. [Google Scholar] [CrossRef]
  8. Saaty, T.L. The Analytic Hierarchy Process Mcgraw Hill, New York. Agric. Econ. Rev. 1980, 70, 109–121. [Google Scholar]
  9. Pérez-Hoyos, A.; Udías, A.; Rembold, F. Integrating multiple land cover maps through a multi-criteria analysis to improve agricultural monitoring in Africa. Int. J. Appl. Earth Obs. Geoinf. 2020, 88, 102064. [Google Scholar] [CrossRef]
  10. Feizizadeh, B.; Blaschke, T. Land suitability analysis for Tabriz County, Iran: A multi-criteria evaluation approach using GIS. J. Environ. Plan. Manag. 2013, 56, 1–23. [Google Scholar] [CrossRef]
  11. Mustafa, A.A.; Singh, M.; Sahoo, R.N.; Ahmed, N.; Khanna, M.; Sarangi, A.; Mishra, A.K. Land suitability analysis for different crops: A multi criteria decision making approach using remote sensing and GIS. Researcher 2011, 3, 61–84. [Google Scholar]
  12. Neitsch, S.L.; Arnold, J.G.; Kiniry, J.R.; Williams, J.R. Soil and Water Assessment Tool Theoretical Documentation Version 2009; Texas Water Resources Institute Technical Repott No.406; Texas A&M University System: College Station, TX, USA, 2011. [Google Scholar]
  13. Sigaroodi, S.K.; Ebrahimi, S. Effects of land use change on surface water regime (case study Orumieh Lake of Iran). Procedia Environ. Sci. 2010, 2, 256–261. [Google Scholar] [CrossRef] [Green Version]
  14. Salmani, H.; MOHSENI, S.M.; Rouhani, H.; Salajegheh, A. Evaluation of Land Use Change and Its Impact on the Hydrological Process in the Ghazaghli Watershed, Golestan Province; J. Watershed. Manag. Res. 2012, 3, 43–60. [Google Scholar]
  15. Zare, M.; Samani, A.A.N.; Mohammady, M.; Salmani, H.; Bazrafshan, J. Investigating effects of land use change scenarios on soil erosion using CLUE-s and RUSLE models. Int. J. Environ. Sci. Technol. 2017, 14, 1905–1918. [Google Scholar] [CrossRef]
  16. Arami, S.A.; Ownegh, M.; Mohammadian Behbahani, A.; Akbari, M.; Zarasvandi, A. Statistical Analysis of Spatio-Temporal Pattern of Dust Storms in West and Southwest of Iran. J. Water Soil Conserv. 2018, 25, 61–83. [Google Scholar]
  17. Fallah, M.; Farajzadeh, M. The assessment of land use and land cover change on abiotic characterises of Tajan River, Iran. Iran. J. Geogr. Res. 2008, 64, 89–104. [Google Scholar]
  18. Rajaei, F.; Sari, A.E.; Salmanmahiny, A.; Delavar, M.; Bavani, A.R.M.; Srinivasan, R. Surface drainage nitrate loading estimate from agriculture fields and its relationship with landscape metrics in Tajan watershed. Paddy Water Environ. 2017, 15, 541–552. [Google Scholar] [CrossRef]
  19. Khodorevskaya, R.P.; Dovgopol, G.F.; Zhuravleva, O.L.; Vlasenko, A.D. Present status of commercial stocks of sturgeons in the Caspian Sea basin. In Sturgeon Biodiversity and Conservation; Springer: Berlin/Heidelberg, Germany, 1997; pp. 209–219. [Google Scholar]
  20. Eastman, J.R. IDRISI Selva Manual; Clark labs-Clark University: Worcester, MA, USA, 2012. [Google Scholar]
  21. Eastman, J.R.; Solórzano, L.A.; Van Fossen, M.E. Transition Potential Modeling for Land-Cover Change. GIS Spat. Anal. Modeling 2005, 17, 357–386. [Google Scholar]
  22. Shooshtari, S.J.; Gholamalifard, M. Scenario-based land cover change modeling and its implications for landscape pattern analysis in the Neka Watershed, Iran. Remote Sens. Appl. Soc. Environ. 2015, 1, 1–19. [Google Scholar] [CrossRef]
  23. Eastman, J.R. IDRISI Andes guide to GIS and image processing; Clark University: Worcester, MA, USA, 2006; p. 328. [Google Scholar]
  24. Zadeh, L.A. Fuzzy sets. In Fuzzy Sets, Fuzzy Logic, and Fuzzy Systems: Selected Papers by Lotfi A Zadeh; World Scientific: Binghamton University–SUNY: Binghamton, NY, USA, 1996; pp. 394–432. [Google Scholar]
  25. Malczewski, J. Fuzzy screening for land suitability analysis. Geogr. Environ. Model. 2002, 6, 27–39. [Google Scholar] [CrossRef]
  26. Malczewski, J. GIS-based land-use suitability analysis: A critical overview. Prog. Plann. 2004, 62, 3–65. [Google Scholar] [CrossRef]
  27. Zhang, X.; Fang, C.; Wang, Z.; Ma, H. Urban construction land suitability evaluation based on improved multi-criteria evaluation based on GIS (MCE-GIS): Case of New Hefei City, China. Chin. Geogr. Sci. 2013, 23, 740–753. [Google Scholar] [CrossRef] [Green Version]
  28. Malczewski, J.; Rinner, C. Multicriteria Decision Analysis in Geographic Information Science; Springer: Berlin/Heidelberg, Germany, 2015. [Google Scholar]
  29. Jothibasu, A.; Anbazhagan, S. Modeling groundwater probability index in Ponnaiyar River basin of South India using analytic hierarchy process. Model. Earth Syst. Environ. 2016, 2, 1–14. [Google Scholar] [CrossRef] [Green Version]
  30. MOJA Iranian Ministry of Jahade-Agriculture (MOJA). Report 30 of Agricultural Statistics and the Information Center; Agricultural Statistics and the Information Center: Tehran, Iran, 2007. [Google Scholar]
  31. Abbaspour, K.C.; Yang, J. Calibration and Uncertainty Analysis for SWAT Using SUFI2 with SWAT-SAI Interface, a User Manual; Swiss Federal Institute of Aquatic Science and Technology: Dübendorf, Switzerland, 2006. [Google Scholar]
  32. Moriasi, D.N.; Gitau, M.W.; Pai, N.; Daggupati, P. Hydrologic and water quality models: Performance measures and evaluation criteria. Trans. ASABE 2015, 58, 1763–1785. [Google Scholar]
  33. Moriasi, D.N.; Arnold, J.G.; Van Liew, M.W.; Bingner, R.L.; Harmel, R.D.; Veith, T.L. Model evaluation guidelines for systematic quantification of accuracy in watershed simulations. Trans. ASABE 2007, 50, 885–900. [Google Scholar] [CrossRef]
  34. Ahmadisharaf, E.; Camacho, R.A.; Zhang, H.X.; Hantush, M.M.; Mohamoud, Y.M. Calibration and validation of watershed models and advances in uncertainty analysis in TMDL studies. J. Hydrol. Eng. 2019, 24, 3119001. [Google Scholar] [CrossRef]
  35. Oñate-Valdivieso, F.; Sendra, J.B. Application of GIS and remote sensing techniques in generation of land use scenarios for hydrological modeling. J. Hydrol. 2010, 395, 256–263. [Google Scholar] [CrossRef]
  36. Geist, H.J.; Lambin, E.F. What drives tropical deforestation. LUCC Rep. Ser. 2001, 4, 116. [Google Scholar]
  37. Holmgren, P. Global land use area change matrix. In Input to the Fourth Global Enviromental Outlook (GEO-4); FAO: Rome, Italy, 2006. [Google Scholar]
  38. Václavik, T.; Rogan, J. Identifying trends in land use/land cover changes in the context of post-socialist transformation in central Europe: A case study of the greater Olomouc region, Czech Republic. GIScience Remote Sens. 2009, 46, 54–76. [Google Scholar] [CrossRef] [Green Version]
  39. Hosonuma, N.; Herold, M.; De Sy, V.; De Fries, R.S.; Brockhaus, M.; Verchot, L.; Angelsen, A.; Romijn, E. An assessment of deforestation and forest degradation drivers in developing countries. Environ. Res. Lett. 2012, 7, 44009. [Google Scholar] [CrossRef]
  40. D’Annunzio, R.; Sandker, M.; Finegold, Y.; Min, Z. Projecting global forest area towards 2030. For. Ecol. Manage. 2015, 352, 124–133. [Google Scholar] [CrossRef] [Green Version]
  41. Hansen, M.C.; Potapov, P.V.; Moore, R.; Hancher, M.; Turubanova, S.A.; Tyukavina, A.; Thau, D.; Stehman, S.V.; Goetz, S.J.; Loveland, T.R.; et al. High-resolution global maps of 21st-century forest cover change. Science 2013, 342, 850–853. [Google Scholar] [CrossRef] [Green Version]
  42. Nepstad, D.C.; Stickler, C.M.; Filho, B.S.; Merry, F. Interactions among Amazon land use, forests and climate: Prospects for a near-term forest tipping point. Philos. Trans. R. Soc. B Biol. Sci. 2008, 363, 1737–1746. [Google Scholar] [CrossRef] [Green Version]
  43. Mohammadi, J.; Shataee Joibary, S.; Yaghmaee, F.; Mahiny, A.S. Modelling forest stand volume and tree density using Landsat ETM+ data. Int. J. Remote Sens. 2010, 31, 2959–2975. [Google Scholar] [CrossRef]
  44. MEA Millennium ecosystem assessment: Ecosystems and human well-being (volume 2). In Findings of the Scenarios Working Group, Millennium Ecosystem Assessment; Island Press: Washington, DC, USA; WHO: Geneva, Switzerland, 2005.
  45. UNEP Global Environment Outlook 4 (GEO-4). United Nations Environment Programme, Nairobi. Available online: <http://www.unep.org/geo/geo4.asp> (accessed on 1 February 2015).
  46. Heidarlou, H.B.; Shafiei, A.B.; Erfanian, M.; Tayyebi, A.; Alijanpour, A. Effects of preservation policy on land use changes in Iranian Northern Zagros forests. Land Use policy 2019, 81, 76–90. [Google Scholar] [CrossRef]
  47. Zaman, M.R.; Morid, S.; Delavar, M. Evaluating climate adaptation strategies on agricultural production in the Siminehrud catchment and inflow into Lake Urmia, Iran using SWAT within an OECD framework. Agric. Syst. 2016, 147, 98–110. [Google Scholar] [CrossRef]
  48. Lacher, I.L.; Ahmadisharaf, E.; Fergus, C.; Akre, T.; Mcshea, W.J.; Benham, B.L.; Kline, K.S. Scale-dependent impacts of urban and agricultural land use on nutrients, sediment, and runoff. Sci. Total Environ. 2019, 652, 611–622. [Google Scholar] [CrossRef] [PubMed]
  49. Ahmadisharaf, E.; Lacher, I.L.; Fergus, C.; Benham, B.L.; Akre, T.; Kline, K.S. Projecting land use change impacts on nutrients, sediment and runoff in multiple spatial scales: Business-as-usual vs. stakeholder-informed scenarios. J. Clean. Prod. 2020, 257, 120466. [Google Scholar] [CrossRef]
  50. Tong, S.T.Y.; Chen, W. Modeling the relationship between land use and surface water quality. J. Environ. Manage. 2002, 66, 377–393. [Google Scholar] [CrossRef]
  51. Lee, S.-W.; Hwang, S.-J.; Lee, S.-B.; Hwang, H.-S.; Sung, H.-C. Landscape ecological approach to the relationships of land use patterns in watersheds to water quality characteristics. Landsc. Urban Plan. 2009, 92, 80–89. [Google Scholar] [CrossRef]
  52. Nakagawa, Y.; Iwatsubo, G. Water chemistry in a number of mountainous streams of east Asia. J. Hydrol. 2000, 240, 118–130. [Google Scholar] [CrossRef]
  53. Piatek, K.B.; Christopher, S.F.; Mitchell, M.J. Spatial and temporal dynamics of stream chemistry in a forested watershed. Hydrol. Earth Syst. Sci. 2009, 13, 423–439. [Google Scholar] [CrossRef] [Green Version]
  54. Wilson, C.O.; Weng, Q. Simulating the impacts of future land use and climate changes on surface water quality in the Des Plaines River watershed, Chicago Metropolitan Statistical Area, Illinois. Sci. Total Environ. 2011, 409, 4387–4405. [Google Scholar] [CrossRef]
  55. Shrestha, S.; Bhatta, B.; Shrestha, M.; Shrestha, P.K. Integrated assessment of the climate and landuse change impact on hydrology and water quality in the Songkhram River Basin, Thailand. Sci. Total Environ. 2018, 643, 1610–1622. [Google Scholar] [CrossRef]
  56. Trisurat, Y.; Eawpanich, P.; Kalliola, R. Integrating land use and climate change scenarios and models into assessment of forested watershed services in Southern Thailand. Environ. Res. 2016, 147, 611–620. [Google Scholar] [CrossRef] [PubMed]
  57. Nohegar, A.; Kazemi, M. Evaluation of Water Erosion with ICONA Model Case study: Tange Bostanak watershed in Shiraz. Geogr. Res. 2013, 28, 1–15. [Google Scholar]
  58. Sanyal, J.; Densmore, A.L.; Carbonneau, P. Analysing the effect of land-use/cover changes at sub-catchment levels on downstream flood peaks: A semi-distributed modelling approach with sparse data. Catena 2014, 118, 28–40. [Google Scholar] [CrossRef] [Green Version]
  59. Shen, Z.; Hou, X.; Li, W.; Aini, G.; Chen, L.; Gong, Y. Impact of landscape pattern at multiple spatial scales on water quality: A case study in a typical urbanised watershed in China. Ecol. Indic. 2015, 48, 417–427. [Google Scholar] [CrossRef]
  60. Zhou, F.; Xu, Y.; Chen, Y.; Xu, C.-Y.; Gao, Y.; Du, J. Hydrological response to urbanization at different spatio-temporal scales simulated by coupling of CLUE-S and the SWAT model in the Yangtze River Delta region. J. Hydrol. 2013, 485, 113–125. [Google Scholar] [CrossRef]
  61. Talebi, A.S.H.; Azari, D.F.; Sadeghi, S.H.R.; Soufbaf, S.R. Study on Landscape Degradation in Neka Watershed Using Landscape Metrics. Envi. Sci. 2009, 6, 133–144. [Google Scholar]
  62. Jamshidi, M.; Tajrishy, M.; Maghrebi, M. Others Modeling of point and non-point source pollution of nitrate with SWAT in the Jajrood river watershed, Iran. Int. Agric. Eng. J. 2010, 19, 23–31. [Google Scholar]
  63. Wan, R.; Cai, S.; Li, H.; Yang, G.; Li, Z.; Nie, X. Inferring land use and land cover impact on stream water quality using a Bayesian hierarchical modeling approach in the Xitiaoxi River Watershed, China. J. Environ. Manage. 2014, 133, 1–11. [Google Scholar] [CrossRef]
  64. Shirmohammadi, A.; Chaubey, I.; Harmel, R.D.; Bosch, D.D.; Muñoz-Carpena, R.; Dharmasri, C.; Sexton, A.; Arabi, M.; Wolfe, M.L.; Frankenberger, J.; et al. Uncertainty in TMDL models. Trans. ASABE 2006, 49, 1033–1049. [Google Scholar] [CrossRef] [Green Version]
  65. Mishra, A.; Ahmadisharaf, E.; Benham, B.L.; Wolfe, M.L.; Leman, S.C.; Gallagher, D.L.; Reckhow, K.H.; Smith, E.P. Generalized likelihood uncertainty estimation and Markov chain Monte Carlo simulation to prioritize TMDL pollutant allocations. J. Hydrol. Eng. 2018, 23, 5018025. [Google Scholar] [CrossRef] [Green Version]
  66. Sharifi, A.; Yen, H.; Boomer, K.M.B.; Kalin, L.; Li, X.; Weller, D.E. Using multiple watershed models to assess the water quality impacts of alternate land development scenarios for a small community. Catena 2017, 150, 87–99. [Google Scholar] [CrossRef] [Green Version]
Figure 1. Study area.
Water 13 02039 g001
Figure 2. Schematic diagram of land use suitability for agriculture development in the watershed Tajan, Iran.
Water 13 02039 g002
Figure 3. Land use maps for: (a) 2010, (b) Continuity scenario (2040) and (c) limitation and conservation scenario from left to right.
Water 13 02039 g003
Figure 4. Observed and simulated nitrate during calibration and validation period at Kordkhil (a), Rigcheshme (b) and Solaiman Tange stations (c) and Observed and simulated run off during calibration and validation period at Kordkhil (d), Rigcheshme (e) and Solaiman Tange (f).
Water 13 02039 g004
Figure 5. Simulation values and the reported values of the National Water Document.
Water 13 02039 g005
Figure 6. Nitrate Loads for: (a) 2010, (b) continuity scenario, and (c) limitation and conservation scenario from left to right.
Water 13 02039 g006
Figure 7. Relative contribution of different land use/land covers (LULCs) to nitrate loading across various months.
Water 13 02039 g007
Figure 8. The average nitrate load output the Tajan watershed during the months of the year.
Water 13 02039 g008
Figure 9. Various components related to nitrogen losses. NSURQ: NO3 contributed by HRU in surface runoff to reach (kg N/ha), NLATQ: NO3 contributed by hydrologic response unit (HRU) in lateral flow to the adjacent stream (kg N/ha), NO3L: NO3 leached below the soil profile (kg N/ha).
Water 13 02039 g009
Table 1. Relative weights of criteria/factors used in future land use planning under the conservation scenario.
CriterionSubcriteriaWeight (Pasture)Weight (Forest)Weight (Agriculture)
Natural VegetationRangeland condition0.180.030.062
Vegetation density0.0360.1050.011
Forest type-----0.161----
Geology0.0190.0520.025
SoilSoil texture0.0620.150.162
Sensitivity to erosion0.110.040.073
ClimateTemperature (°C)00.060.04
Rainfall (mm)0.0350.110.084
Water ResourceDistance to dam (m)0/0580/0050/091
Distance to the stream and water channels and other water sources (m)0/1100/0350/122
Land use 0/0500/0620/032
TopographyElevation (m)0/0080/0300/003
Slope (°)0/1290/0900/261
Aspect------0/0110/001
Distance from the human distributionsDistance to residential areas (m)0/1090/0300/011
Natural VegetationDistance to roads (m)0/0780/0300/022
Table 2. Parameters adjusted in the calibration of Soil and Water Assessment Tool (SWAT).
ParameterDescriptionInitial RangeOptimal Value
SOL_CBNOrganic carbon content0.05–100.44
HLIFE_NGWHalf-life of nitrogen in groundwater (days)0–50015.8
SOL_AWCAvailable water capacity of the soil layer (mm H2O/mm Soil)0–10.26
HRU_SLPAverage slope steepness (m/m)0–1−0.7
USLE_PUSLE equation support pra0–10.24
CN2SCS runoff curve number for moisture condition35–9875
CANMXMaximum canopy storage (mm)0–1007
BIOMIXBiological mixing efficient0–10.29
EPCOPlant uptake compensation factor0–10.63
ESCOOutflow simulation option0–10.7
GW_REVAPGroundwater “revap” coefficient0.02–0.20.05
GW_DELAYGroundwater delay (days)0–500170
GWQMNThreshold depth of water in the shallow aquifer required for return flow to occur (mm)0–5000290
SMTMPSnow melt base temperature (°C)−20–200
ANION_EXCLFraction of porosity from which anions are excluded0.01–10.55
Table 3. Model evaluation statistics for calibration and validation of runoff.
Solaimantange StationRigcheshme StationKordkhil Station
StatisticCalibration (2006–2010)Validation (2011–2014)Calibration (2001–2010)Validation (2011–2014)Calibration (2005–2010)Validation (2011–2014)
R20.670.780.530.580.500.77
NSE0.580.750.520.50.530.47
NSE: Nash–Sutcliffe efficiency; R2: Coefficient of determination.
Table 4. Model evaluation statistics for the calibration and validation of nitrate.
StationsSolaimantange StationRigcheshme StationKordkhil Station
StatisticCalibration (2009–2013)Validation (2013–2014)Calibration (2009–2012)Validation (2013–2014)Calibration (2009–2013)Validation (2013–2014)
R20.510.670.820.580.650.77
NSE0.550.660.610.540.500.49
NSE: Nash–Sutcliffe efficiency; R2: Coefficient of determination.
Publisher’s Note: MDPI stays neutral with regard to jurisdictional claims in published maps and institutional affiliations.

