
Study of Creep Mechanical Properties and a Rheological Model of Sandstone under Disturbance Loads

College of Civil Engineering, Liaoning Technical University, Fuxin 123000, China
*
Author to whom correspondence should be addressed.
Processes 2021, 9(8), 1291; https://doi.org/10.3390/pr9081291
Submission received: 29 June 2021
/
Revised: 25 July 2021
/
Accepted: 26 July 2021
/
Published: 26 July 2021
Abstract
:The stress environments of rock masses are complex. To explore the mechanical properties of sandstone under earthquake or disturbance loads, laboratory triaxial creep tests under different disturbance loads were conducted on sandstone from Fuxin, Liaoning Province, China. Given the disturbance load, a creep deformation pattern for sandstone was analyzed, and the influence of the disturbance load on the mechanical properties of rock was considered. Thus, a constitutive model of rock under creep disturbance load was established. The results show that (1) the creep curve can be divided into four stages: attenuation creep, steady creep, disturbance creep, and acceleration creep; the increment of disturbance creep varies for different disturbance loads and the larger the disturbance load, the larger the disturbance creep deformation; (2) with increasing disturbance loads, the long-term strength, failure time, and elastic modulus of sandstone decreases linearly, while the peak strain increases; and (3) considering the influence of the disturbance load and introducing an acceleration element to modify the Nishihara model, a constitutive model describing the whole deformation process of sandstone under creep disturbance load was established. The accuracy of the model was verified by test data and provides a theoretical basis for rock mass stability analysis.
1. Introduction
The geological environments of deep rock masses are complex, and the mechanical properties of sandstone and other rocks in deep complex geological environments are different from those in shallow geological environments. To ensure the long-term stability of engineering projects surrounded by rock and the safety of construction personnel, it is necessary to conduct in-depth research on the rheological properties of rock [1,2]. At the same time, the long-term deformation characteristics of rock under external load and multifactor coupling conditions are very complex, and the creep model established by the traditional rheological element combination method cannot describe the deformation characteristics of rock well. In recent years, an increasing number of scholars have used damage theory, continuum mechanics, and other theories to establish an internal variable that can reflect the deterioration of the internal mechanical properties of rock, making the rheological model more scientific and reasonable [3].
Li et al. [4] applied the theory of fracture mechanics and damage mechanics to study the constitutive model and fracture damage mechanism of brittle intermittent jointed rock masses under complex stress states. Ming et al. [5] analyzed the mechanical characteristics and failure characteristics of a high-stress rock mass under one-sided unloading with static and dynamic combination conditions of different initial stresses, disturbance amplitudes, and disturbance frequencies. A true triaxial unloading test system was used to carry out a one-sided unloading disturbance test on sandstone. Zhao [6] studied the rheological mechanical properties of rock through laboratory creep tests and theoretical analysis and discussed the mechanical mechanism of rock rheology.
On the basis of Perzyna’s viscoelastic plastic theory, Jiang et al. [7] introduced the meso unit strength damage model of rock based on strain-energy theory, considered the creep rate changing with time in the creep process of rock, and constructed a meso viscoelastic plastic damage-coupled creep constitutive model of the whole creep process. To study the rheological mechanical properties of weak rock masses, Liu et al. [8] established a nonlinear fractional order creep model of weak rock masses by introducing fractional calculus theory, using the Abel clay-pot element to replace the viscoelastic body in the traditional Burgers rheological model. Based on the deformation characteristics of rock mass samples in the accelerated creep stage in the field rheological test results of a rock mass and the rheological test data of rock samples, parameter fitting and comparative analysis of the nonlinear fractional creep model and burger model were carried out. Fahimifar and Karami [9] modified the viscoelastic plastic model proposed by step to simulate steady-state creep at a low stress level and to calculate creep deformation under repeated loading and unloading conditions. Wang et al. [10] studied the nonlinear creep characteristics and creep disturbance effect of deep rock under disturbance load and established a composite model of nonlinear disturbance creep damage for rock. Zeng and Zhang [11] obtained a creep constitutive model of mudstone based on fractional integral theory. Khaledi et al. [12] proposed a modified Norton creep method including damage parameters to predict material failure and explained the role of time in creep. Cao et al. [13] proposed a new constitutive model for nonlinear creep damage considering the failure deformation of soft rock under high ground stress.
However, the above research failed to explore the mechanical properties of sandstone under creep disturbance load. In this paper, triaxial compression creep tests of sandstone under different disturbance loads were carried out to analyze the influence of disturbance load on the mechanical properties of rock masses. Combining the disturbance load and nonlinear curve characteristics, a constitutive model describing sandstone under creep disturbance load was established, which provides support for rock mass stability analysis.
2. Creep Disturbance Test
2.1. Test Plan
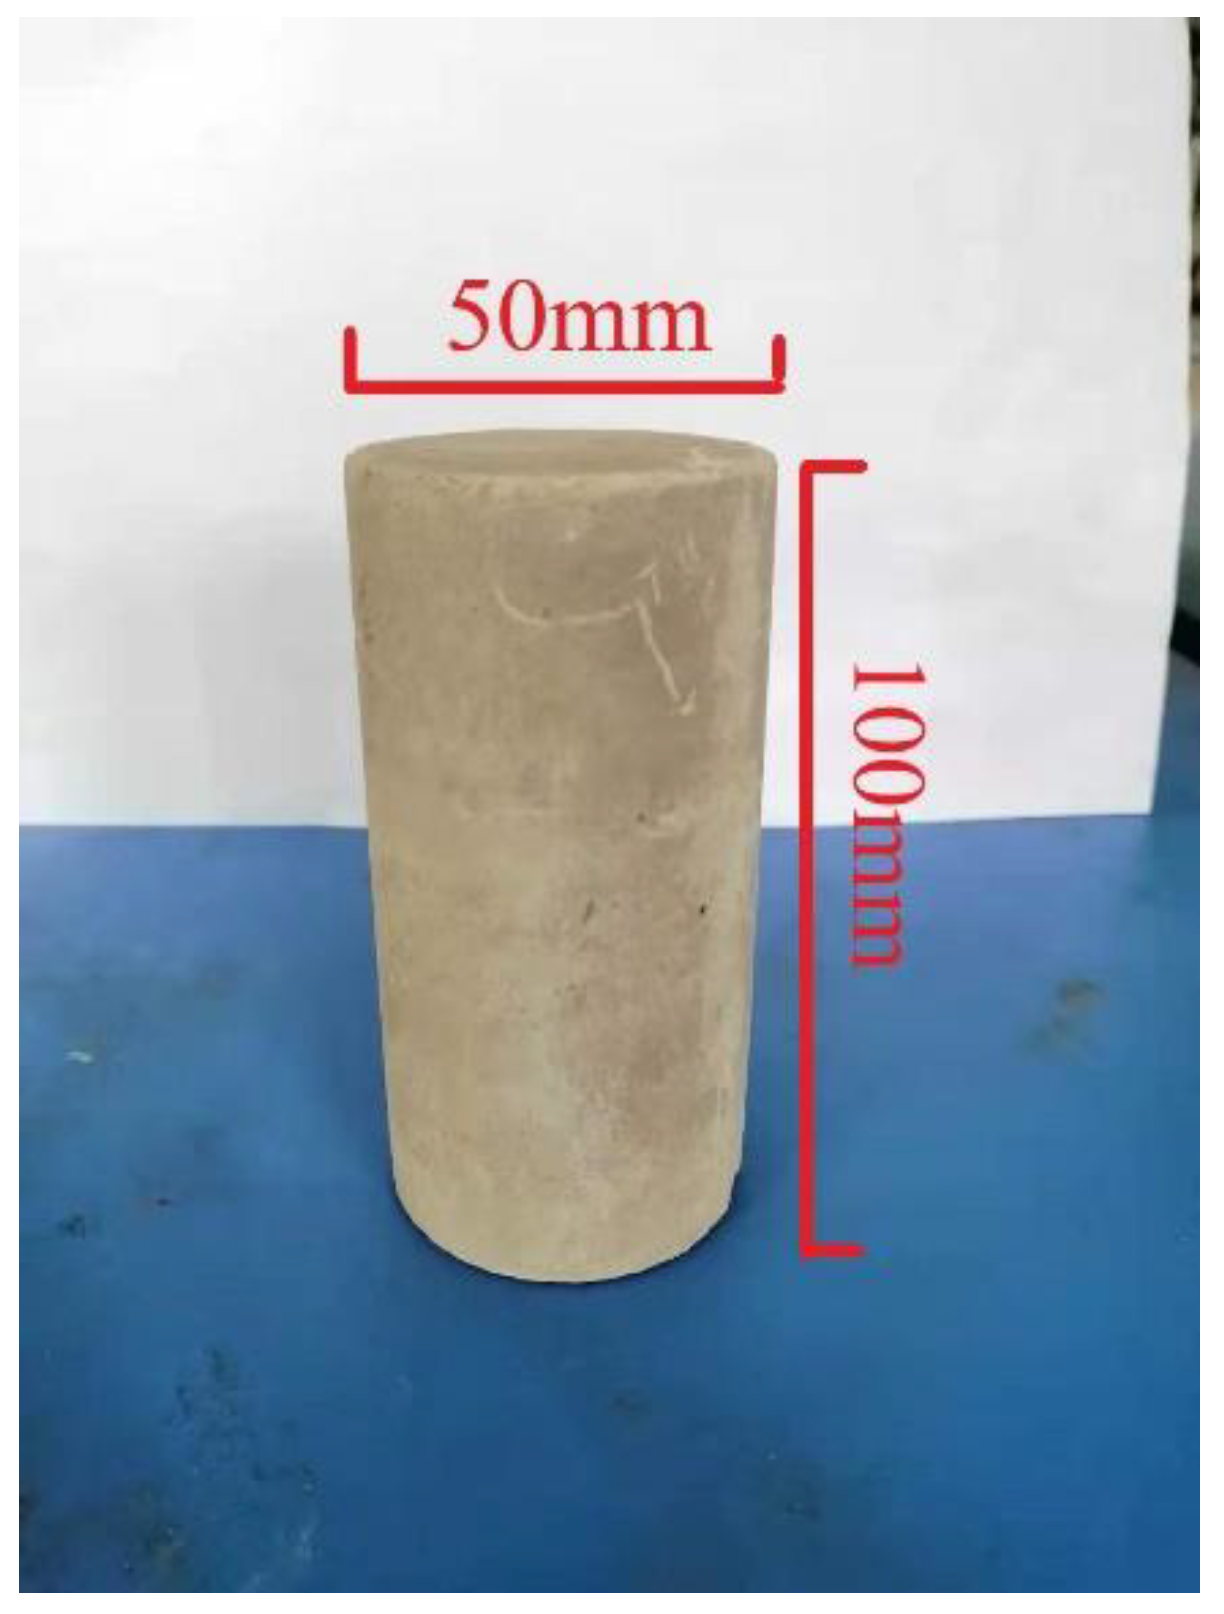
The red sandstone used in this test was collected from a coal mine in Fuxin city. The rock samples were refined according to the requirements of relevant rock test regulations and shaped into standard cylindrical specimens with H = 100 mm and d = 50 mm, as shown in Figure 1. The density of the rock was measured by the specific gravity cup method, and the porosity of the rock was measured by the drainage method (an average value for three samples was taken) [14]. Other parameters are shown in Table 1.
The disturbance load was selected by referring to relevant specifications and references (Wang et al. [10]): Specifically, the maximum peak velocity of underground vibration was 0.52–4.38 m/s, the frequency range was 0.01–0.1 Hz, the shear wave velocity was 2480 m/s, and the longitudinal wave velocity was 4300 m/s. Therefore, the fatigue amplitudes were 2, 4, and 6 kN, respectively, and the fatigue frequency was 0.02 Hz and remained constant in the creep fatigue test. There were four creep fatigue load test specimens in each group, a total of three groups, and a total of 12 specimens were used.
2.2. Test Procedure
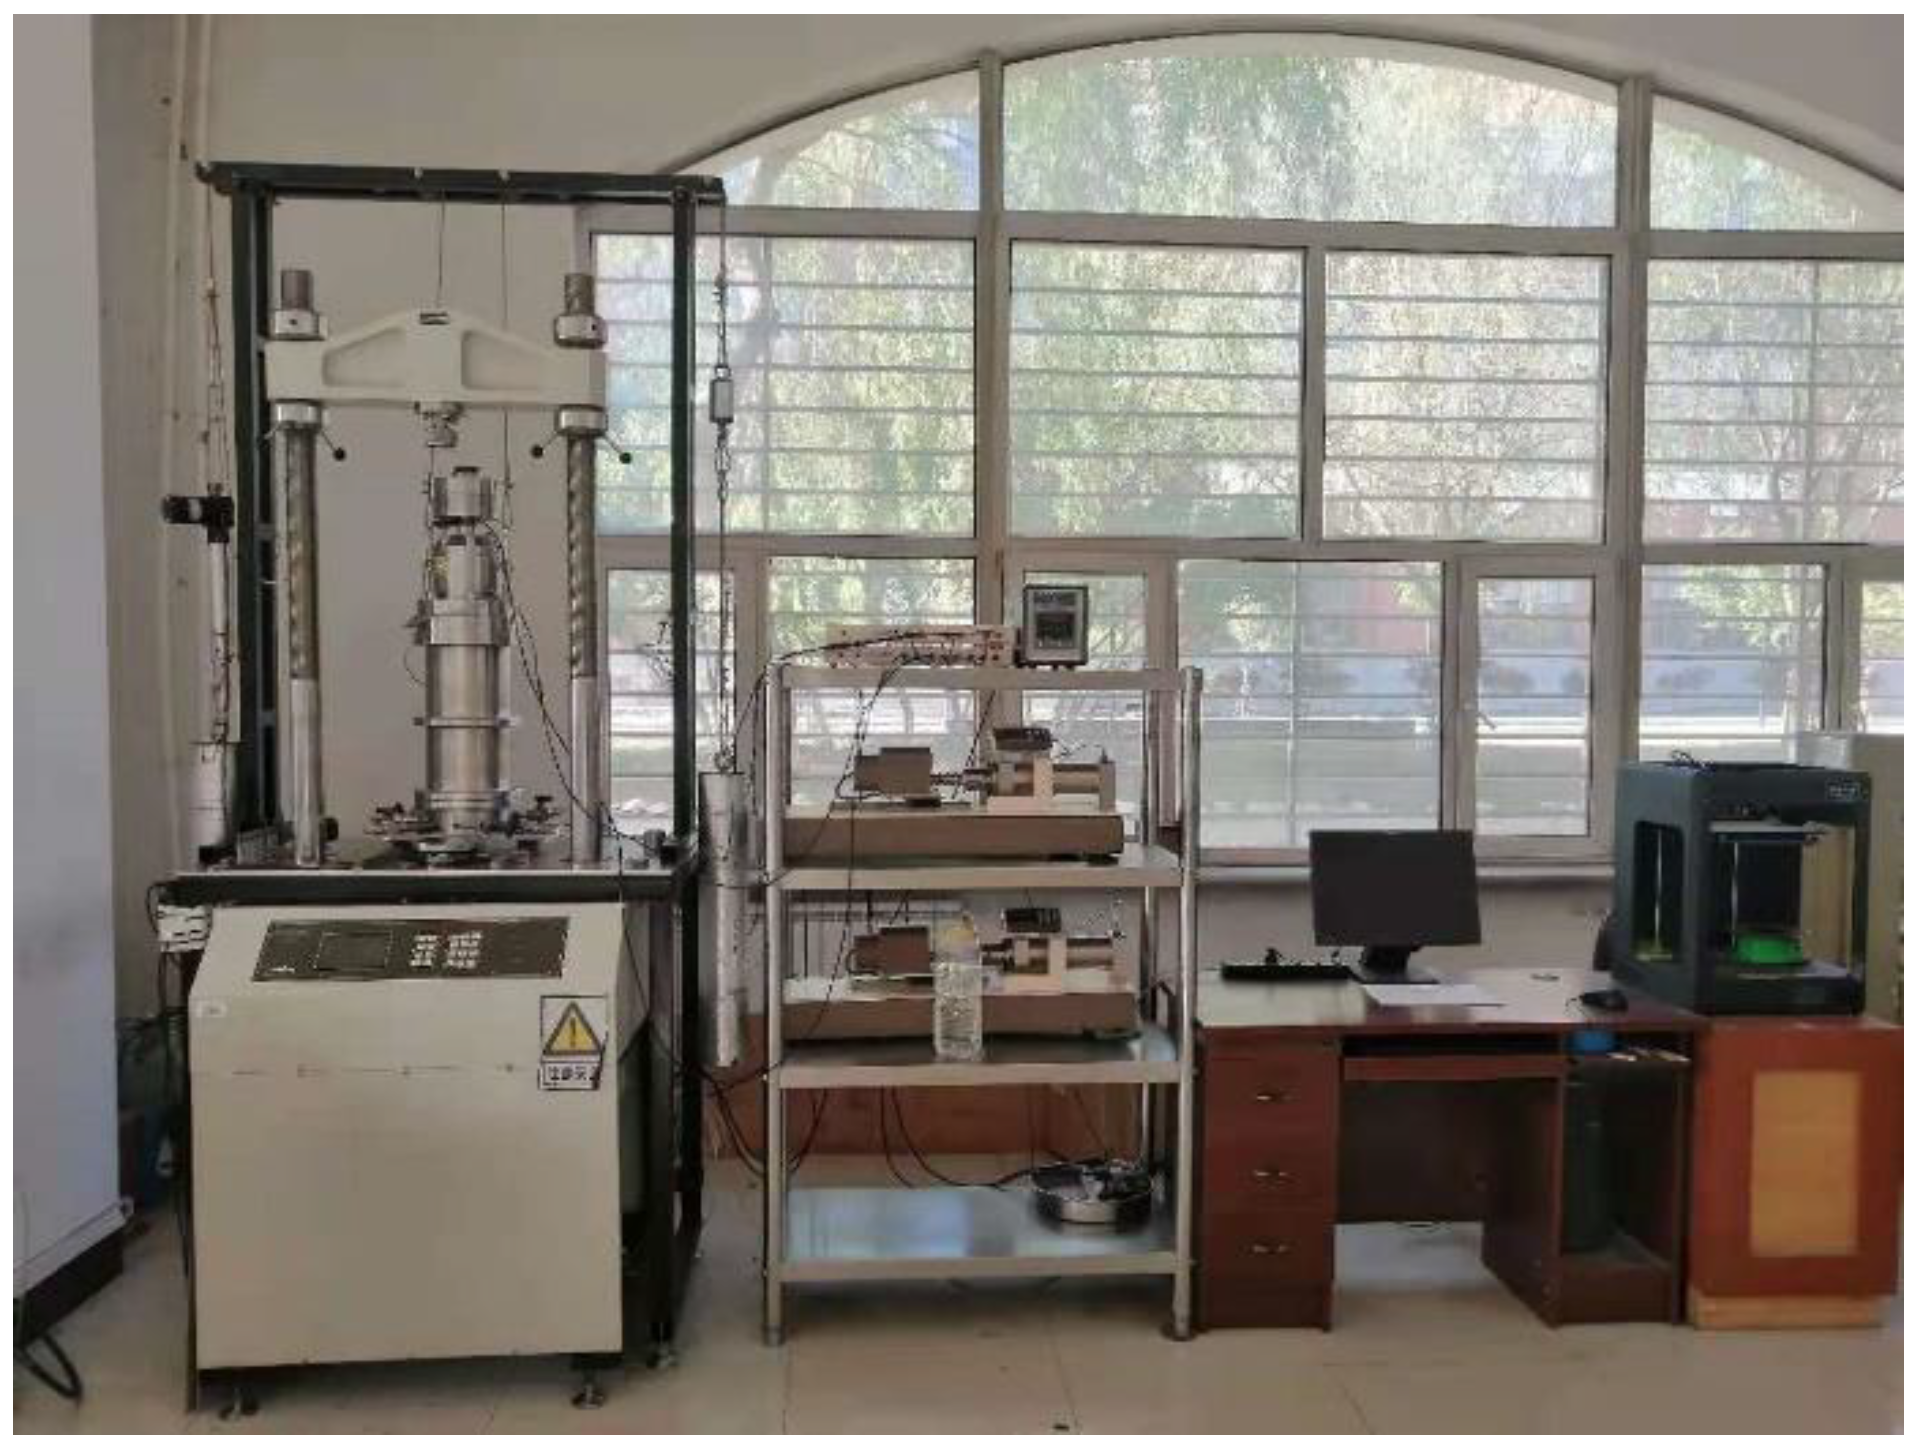
The test equipment used the MTS815.02 rock test system. As shown in Figure 2, its maximum confining pressure was 100 MPa, and the precise range of force measurement was −1–1%, which met the requirements of this test [15,16].
The specific steps of the creep disturbance test were as follows:
- (1)
- Specimen preparation: All samples were taken from the same rock mass, the samples with obvious external defects were removed, and rock samples with the same wave velocity in the wave velocity tester were taken as the sample objects.
- (2)
- Stress application: The stress level of the creep test was determined according to the maximum deviatoric stress of the triaxial compression test, and the initial stress level was 60% of the peak strength from the triaxial test. To facilitate the application of stress, the initial value was selected as an integer value, and the later loads were taken as 70%, 80%, and 90% of the peak strength from the triaxial test.
- (3)
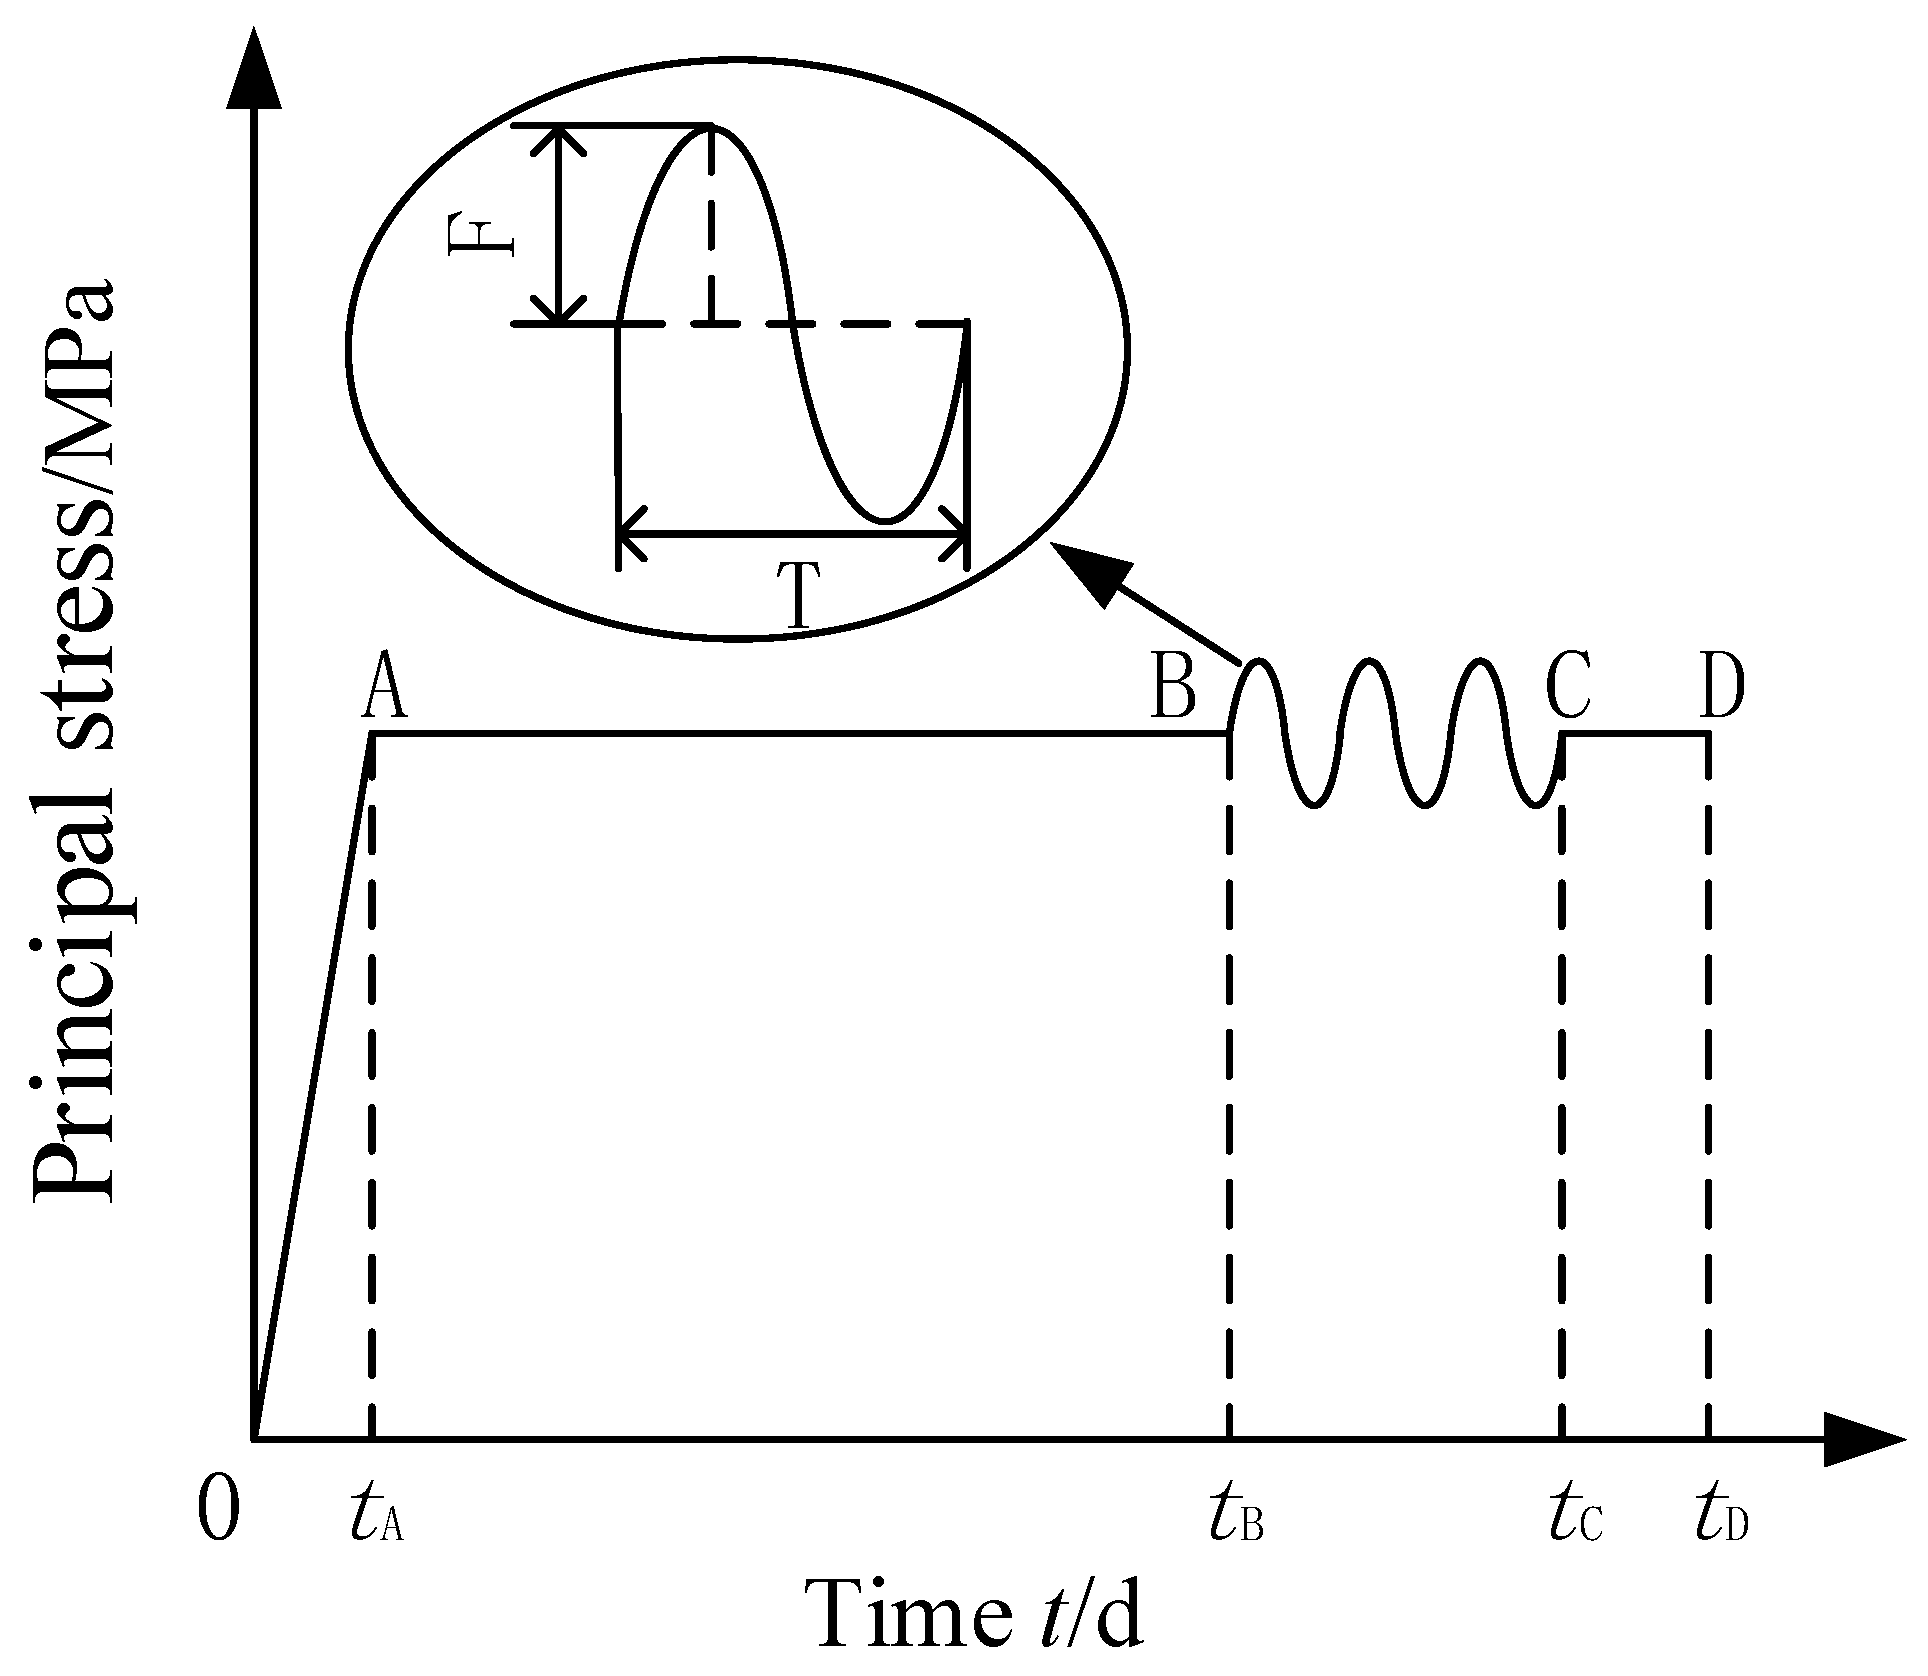
- Disturbance load application: First, the confining pressure was applied to the predetermined value at the loading speed of 500 N/s; next, the axial pressure was applied to the predetermined value at the same loading speed after stabilization, and the disturbance load was then applied by using the load control to increase or decrease the axial stress, as shown in Figure 3. When the radial deformation of rock was less than 0.03 mm/24 h, the next level load was applied, and the above steps were repeated until the specimen was destroyed.
- (4)
- Data recording: After the completion of the test, the confining pressure was first unloaded to zero; then, the axial pressure was unloaded to zero, the hydraulic oil in the pressure chamber was pumped back to the equipment, the pressure chamber was raised, and the rock sample was removed for storage; the test data storage interval was 5 s, and finally, the test data were exported.
2.3. Test Results
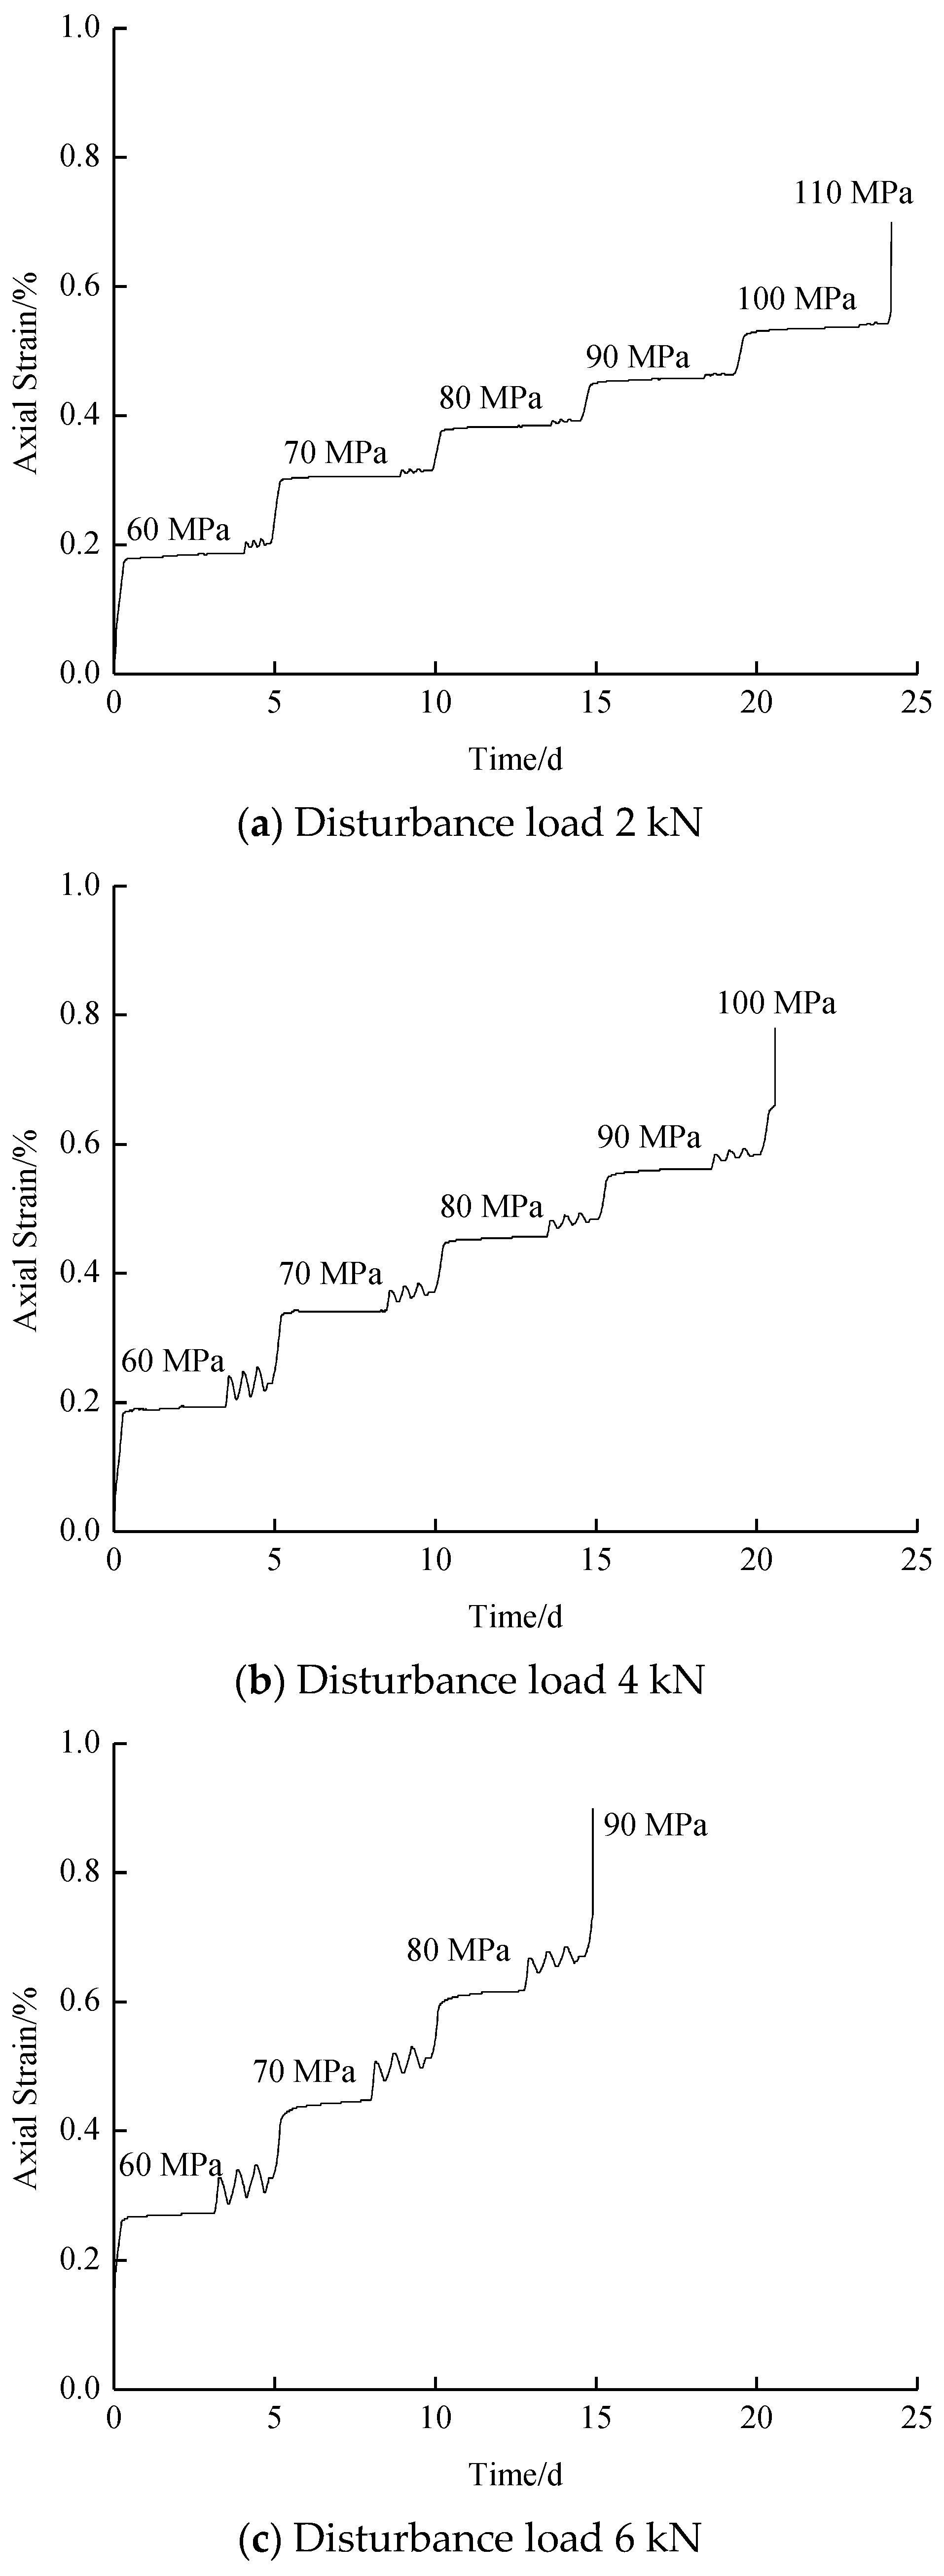
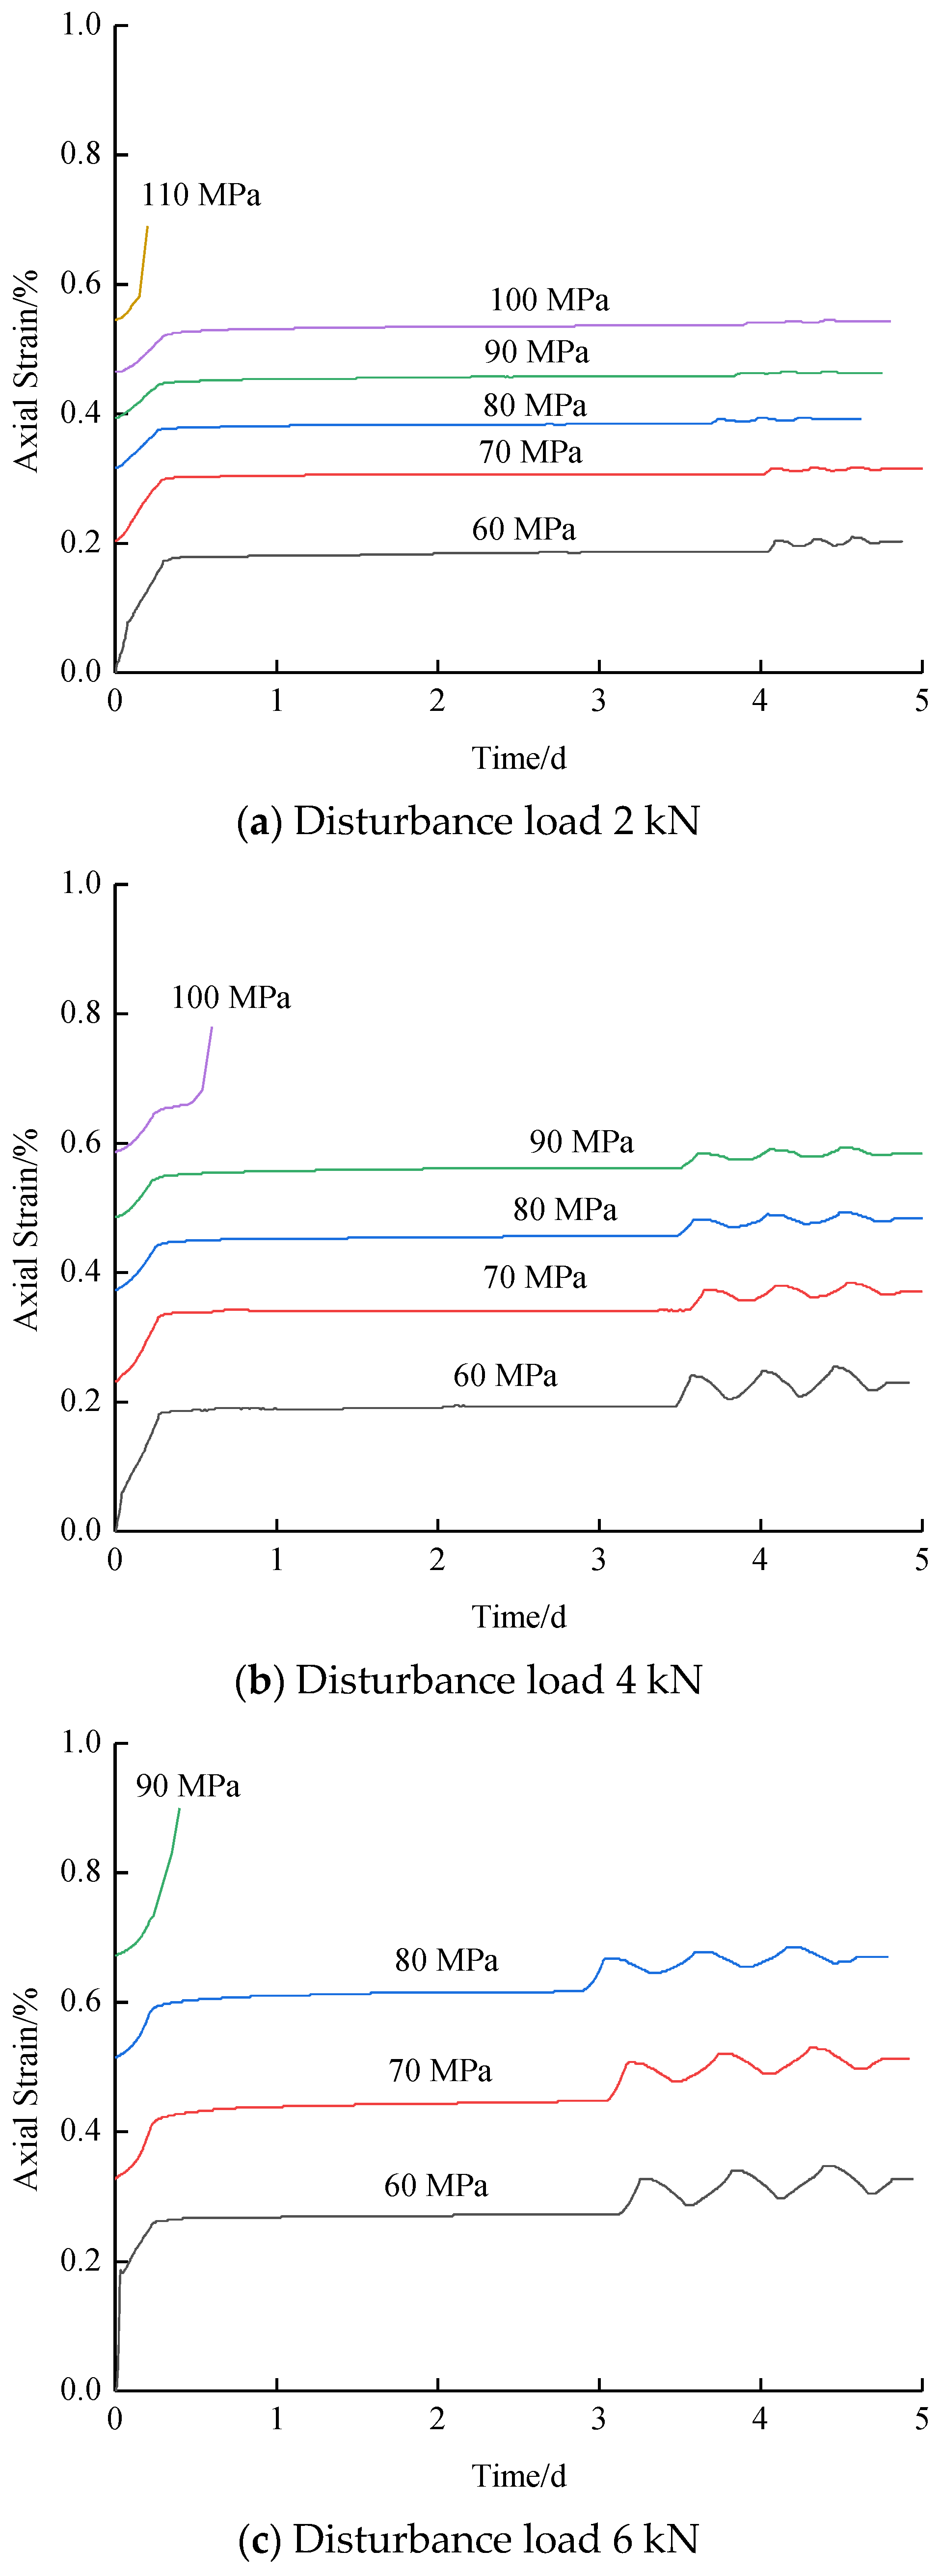
In the test results, a representative specimen from each group was selected for analysis. Through the analysis and arrangement of the test data, the creep disturbance test curve was obtained, as shown in Figure 4:
According to Figure 4, the changes in the axial creep curves of the rocks under different disturbance loads are basically the same, and the curves can be divided into four stages:
- (1)
- Decay creep stage: This stage is consistent with the attenuation stage in the conventional creep test, which shows that with increasing time, the rock displacement increases gradually, but the creep deformation rate decreases gradually until it reaches 0. The reason is that with the pressure, the density of the interior pores of the specimen changes, and the ability of the specimen to resist deformation gradually increases, which leads to the gradual improvement in the deformation of the specimen, but the deformation rate decreases.
- (2)
- Stable creep stage: The deformation of the specimen is basically consistent with the conventional creep curve, but the difference is that unstable creep deformation occurs at a low stress level due to the addition of the disturbance load. This indicates that an increase in disturbance load can change or even affect the mechanical properties and failure mechanism of the specimen. The reason is that the disturbance load causes some interlaminar dislocation in the stable specimen, which advances the crack initiation and crack propagation time, and creep increment appears at a low stress level.
- (3)
- Creep stage of disturbance: The curve of this stage shows a reversed “V” change; that is, with an increase in disturbance load, it shows a trend of first increasing and then decreasing. At a low stress level, the creep deformation is obvious; that is, the creep increment before and after disturbance is large, but when the stress level increases, the creep increment of disturbance is smaller. At a low stress level, there are many pores in the specimen, and the application of an appropriate disturbance load can cause the specimen to deform greatly. When the specimen is at a high stress level, the proportion of the disturbance load is small, and the influence on the creep deformation of rock is limited. Moreover, when the specimen is subjected to a periodic disturbance load, the specimen has some irreparable deformation compared with the overall deformation, which also indicates that the fracture of the pores inside the specimen is irreversible permanent deformation.
- (4)
- Accelerated creep stage: The deformation characteristics of this stage are basically consistent with conventional creep. Due to the application of the disturbance load in the early stage, the load is stored in the form of elastic energy inside the specimen. When the specimen is at a high stress level, the crack inside the specimen expands rapidly due to the application of elastic energy, which leads to deformation and failure of the specimen. The deformation velocity and degree are higher than those of the conventional creep curve.
3. Analysis of Creep Disturbance Tests
The test curves illustrate that the disturbance load had a certain impact on the rock deformation and mechanical properties, so it was necessary to explore the rock mechanical properties under different disturbances.
3.1. Disturbance Load Characteristics
The creep test data obtained under different disturbance load conditions were processed, and the Boltzmann superposition principle curves of axial creep at all levels were obtained [17], as shown in Figure 5.
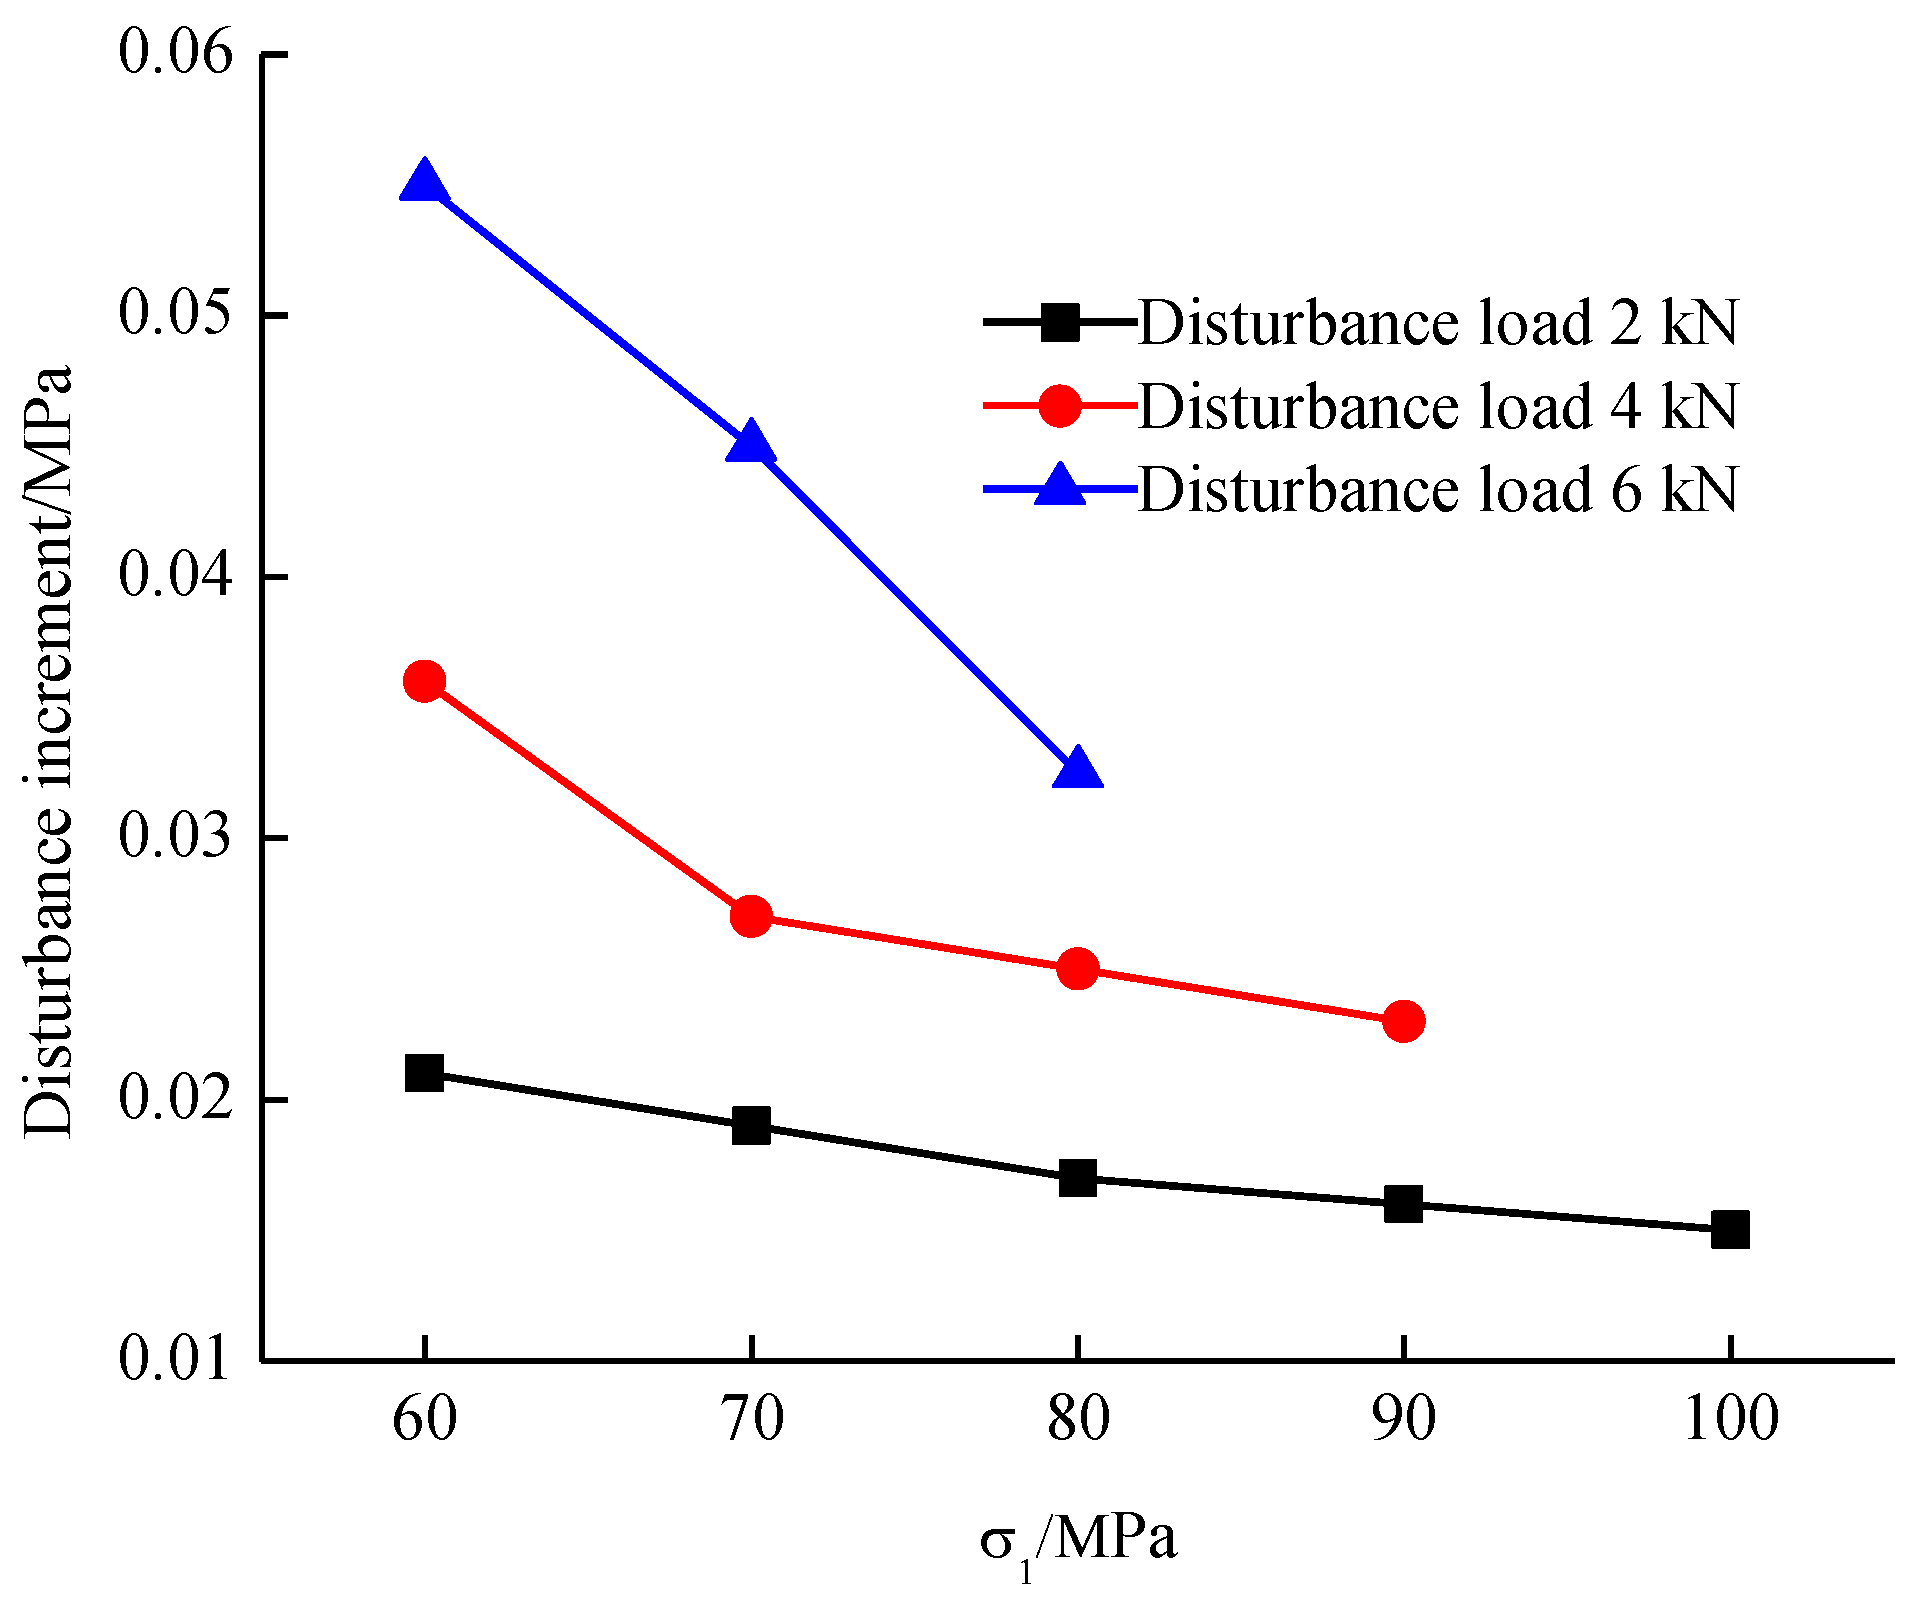
Figure 5 shows that only when the stress level applied to the rock is high do the stable creep and accelerated creep stages appear. Otherwise, the creep deformation only attenuates the creep stage and stable creep stage, and the deformation of the rock change before and after the disturbance load. The increments before and after the disturbance under different grading conditions were counted, as shown in Table 2, and the disturbance increment curve was drawn, as shown in Figure 6.
The figure above reveals that the disturbance load affects the creep increment in rock. The larger the disturbance load, the larger the corresponding disturbance creep deformation. When the disturbance load is constant, with the gradual increase in σ1, the disturbance increment show a downward trend and nearly linear change.
3.2. Analysis of Mechanical Properties
The disturbance load can accelerate the compaction and expansion of the internal pores in the rock and then affect the deformation characteristics and patterns of the rock. To explore the influence of different disturbance loads on the mechanical properties of rock, mechanical properties such as the long-term strength, peak strain, failure time, and elastic modulus of rock under different disturbance loads are summarized, as shown in Table 3.
The above table shows the following points:
- (1)
- When the disturbance load increased from 2 kN to 4 kN and then to 6 kN, the increments were 11.4% and 15.4%, respectively, which indicates that the disturbance load has a certain enhancing effect on the peak strain of rock. The reason is that the increase in disturbance load gradually compacts the pores and cracks in the specimen, so the creep deformation of the specimen increases.
- (2)
- The long-term strength of rock is the strength value of rock resisting failure under long-term load, which produces a creep effect under long-term load, so the creep strength is regarded as the long-term strength of rock. The long-term strength of rock is greatly affected by its structure and internal defects, as well as by the complicated genesis.
- (3)
- When the disturbance load increased from 2 kN to 4 kN, the decrease proportion was 15%, and when the disturbance load increased from 4 kN to 6 kN, the decrease proportion was 27.6%. The reason is that the increase in disturbance load shortens the compaction time of pores and cracks, and the failure time of the specimen decreases gradually.
- (4)
- The elastic modulus of a rock is one of the physical and mechanical properties of the rock and represents the relationship between rock stress and strain. The change in elastic modulus indicates that the disturbance load has a certain impact on the deformation characteristics of the rock and then affects the physical and mechanical properties of the rock.
4. Creep Disturbance Constitutive Model
With the mining of deep coal and rock and the construction of deep underground engineering, the causes of rock deformation and failure are increasingly complex; when there are joint planes in rock, the failure mode is different from that of intact rock. However, the classic viscoelastic plastic theory cannot determine and predict the mechanical and deformation characteristics of rock under the influence of many factors, which leads to the failure of roadway supports, and other major problems which cannot be effectively solved in engineering practice. To effectively solve the above problems and analyze the influence of interference factors on rock-mass properties, a damage variable was introduced to reflect the changes in rock mass mechanical properties under geological action on the basis of continuum mechanics theory. Combining this variable with the traditional Nishihara model, the mechanical properties of sandstone under creep disturbance load were analyzed.
4.1. Disturbance Damage Function
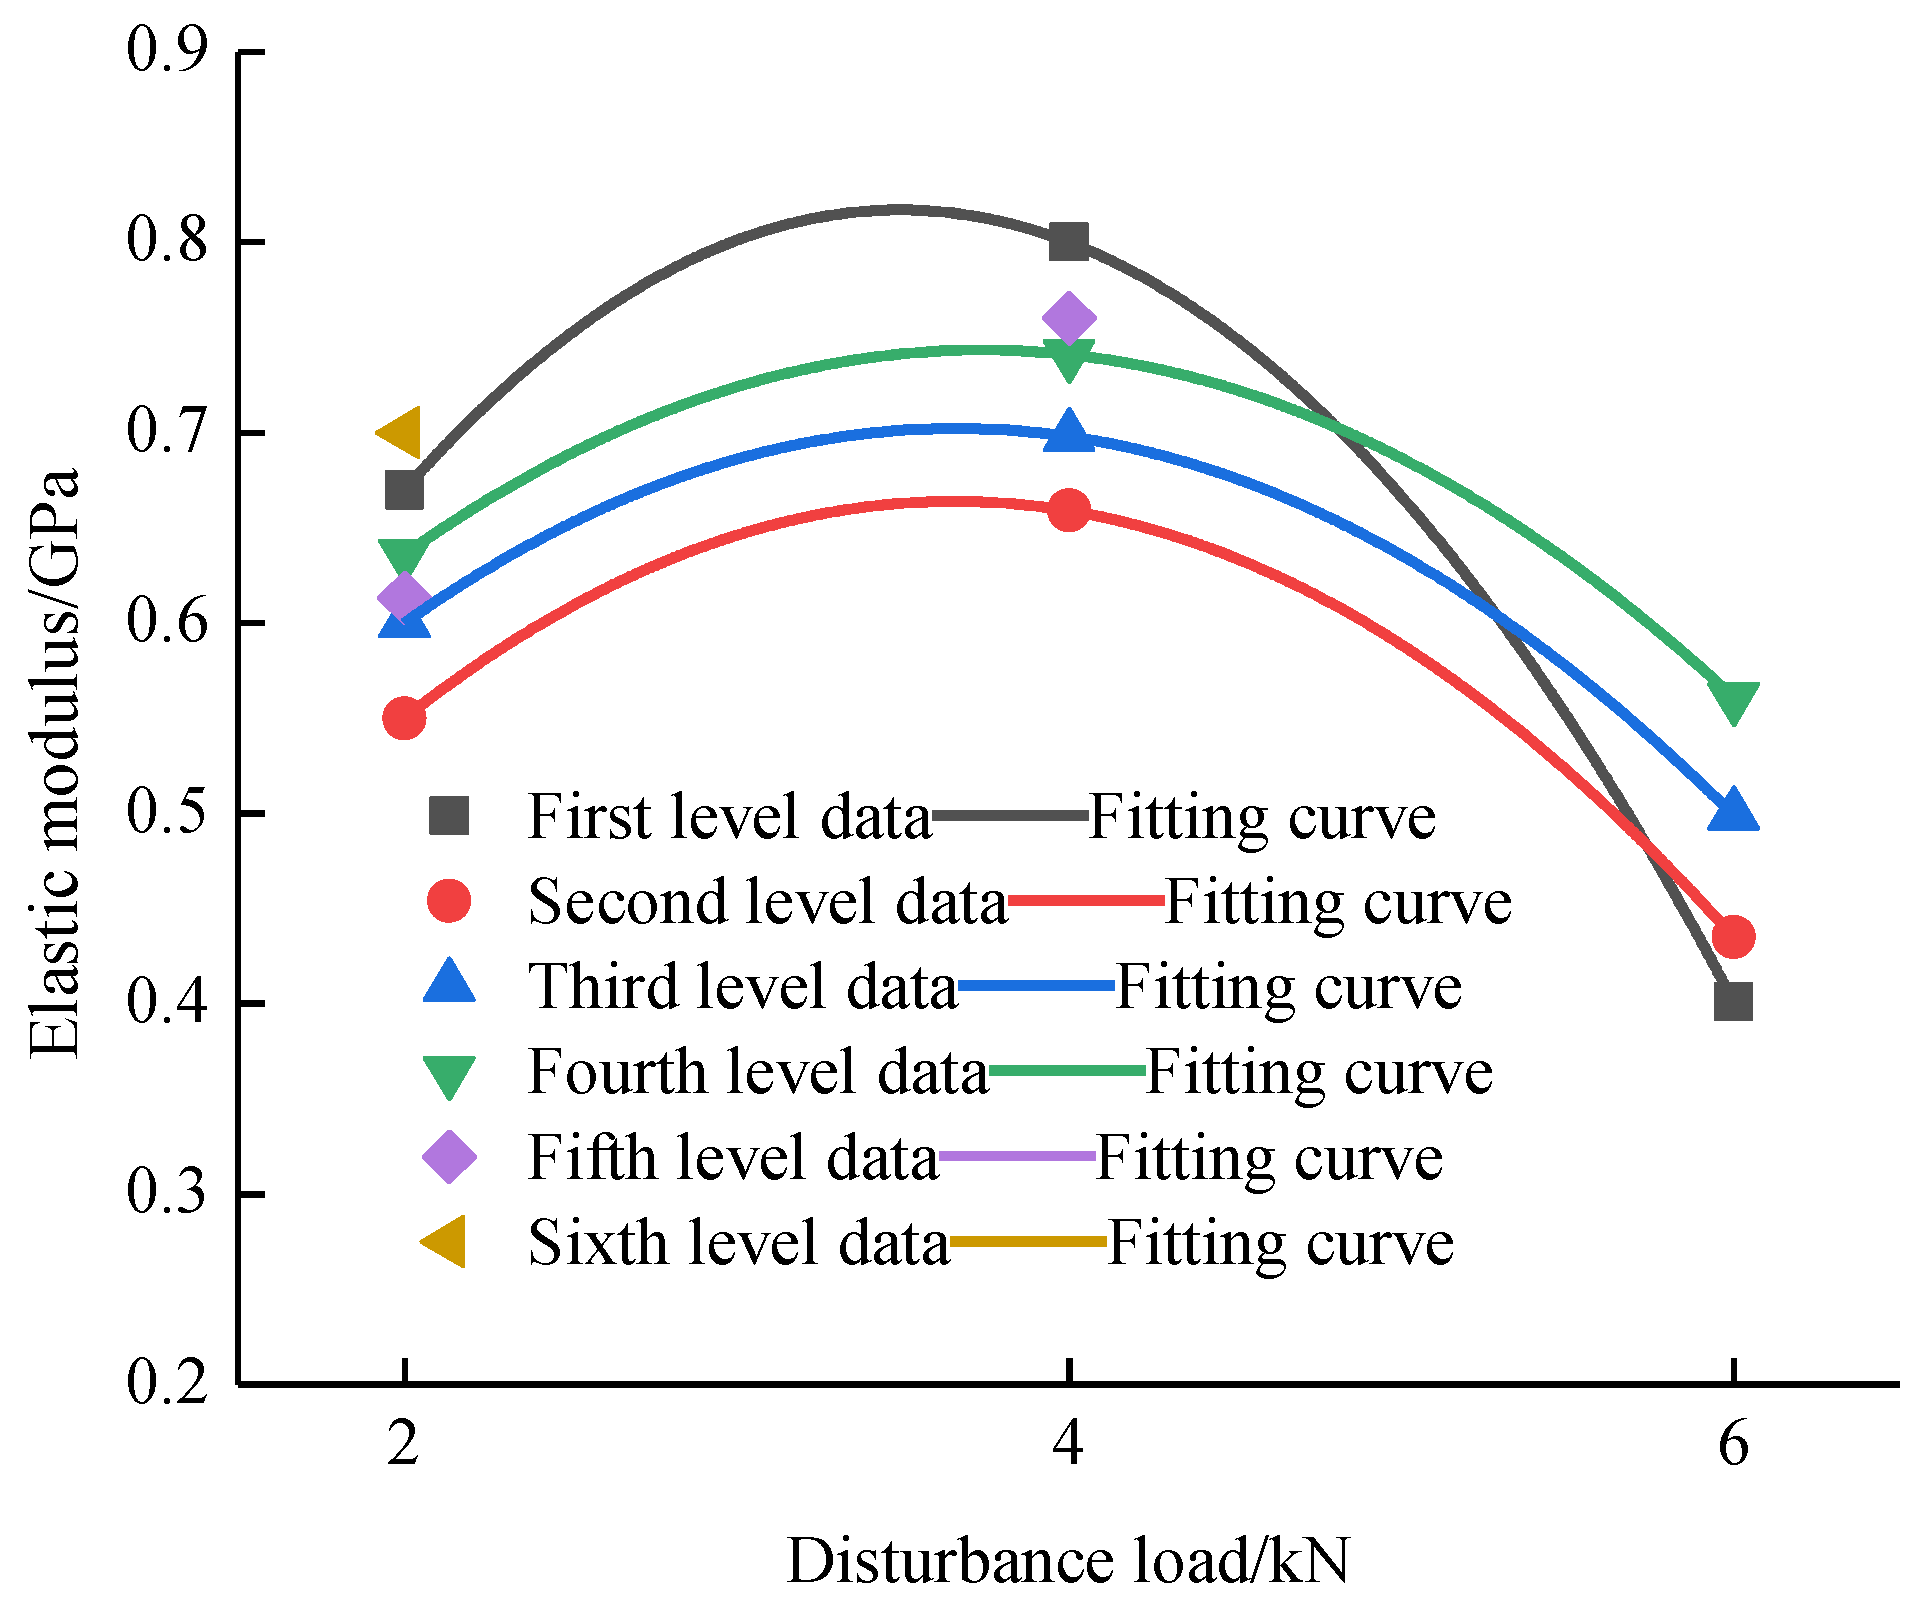
The above analysis demonstrates that a disturbance load affects the creep of sandstone, and the elastic modulus that characterizes the rock mechanical properties under the disturbance load was quantitatively studied. After a summary analysis of the changes in the elastic modulus of the specimens under different disturbance loads, as shown in Figure 7, curve fitting was performed on the changes in the elastic modulus under different disturbance loads, as shown in Equation (1), and the fitting formula. The relevant parameters are given in Table 4.
where E(x) is the elastic modulus function under the disturbance load, x is the disturbance load, and a, b, and c are formula parameters.
4.2. Establishment of One-Dimensional Creep Model
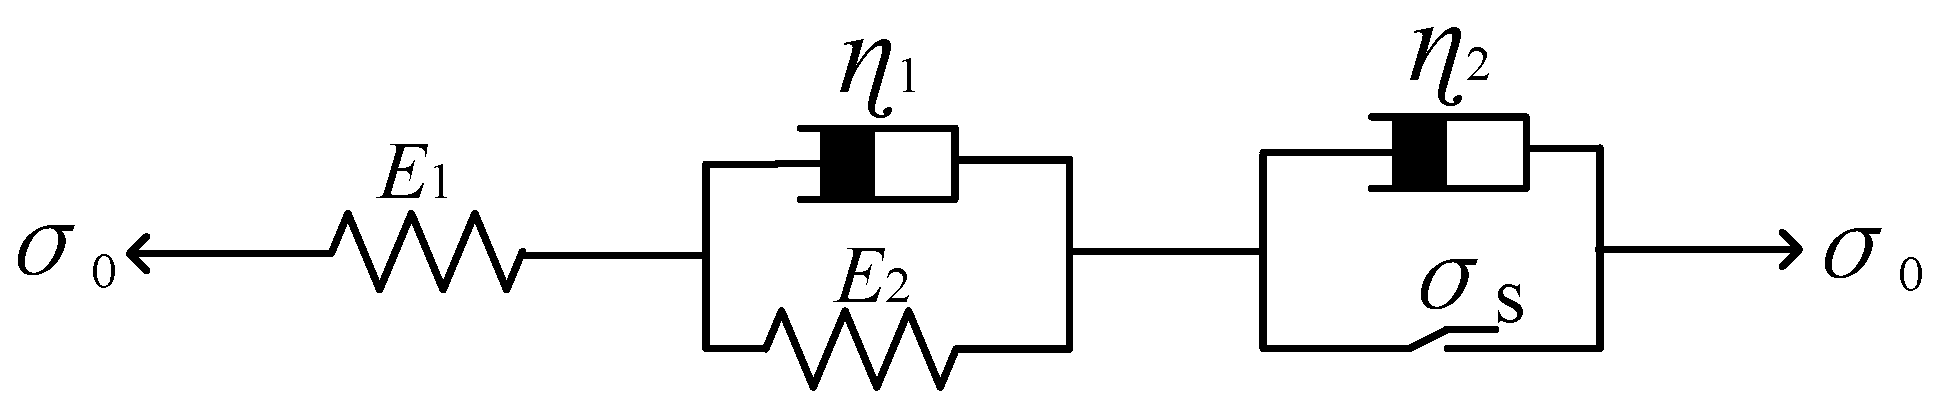
The traditional model consists of an elastic element, an elastic viscous element and a viscoplastic element. The rheological behavior of the model is also comprehensive under low-stress conditions. Creep is stable and has relaxation characteristics [18]. Under the condition of high stress, the rheological properties of rock are changed. Creep is metastable and has relaxation characteristics; thus, the rheological properties of the rock are closer to those of actual rock. The details are shown in Figure 8.
In the figure, σ0 is the initial stress, E1 is the elastic modulus of the elastic body, E2 and η1 are the elastic modulus and viscosity coefficient of the elastic viscous body, σs is the long-term strength, and η2 is the viscosity coefficient of the viscoplastic body.
The differential constitutive equation of the Nishihara model can be expressed as follows:
When σ < σs:
When σ ≥ σs:
When σ is constant, the creep equation of the model can be expressed as [19]:
where εe is the elastic stress and strain, εve is the viscoelastic stress and strain, and εvp is the viscoplastic stress and strain.
- (1)
- The creep equation of the elastic element is as follows [20]:
- (2)
- The creep equation of the elastic viscous element is as follows:
- (3)
- The creep equation of the viscoplastic element is as follows:
When σ < σs:
When σ ≥ σs:
The creep deformation of rock mainly includes attenuation, steady state, and acceleration stages. The traditional Nishihara model can describe the first two stages well, but it cannot describe the nonlinear acceleration stage well. The whole process of creep deformation of rock is a process of gradual fracture, and the accumulation of damage to internal pores gradually densifies the rock until crack propagation and failure. The creep curve shows that with the gradual increase in the graded load, the nonlinear characteristics of the creep curve of the specimen in the acceleration stage are more obvious than those in other stages. In the acceleration stage, the curve has the following characteristics: (1) short time, less than 1/3 of the steady-state stage duration; (2) deformation approximately twice as large as that of the whole; and (3) complex influencing factors.
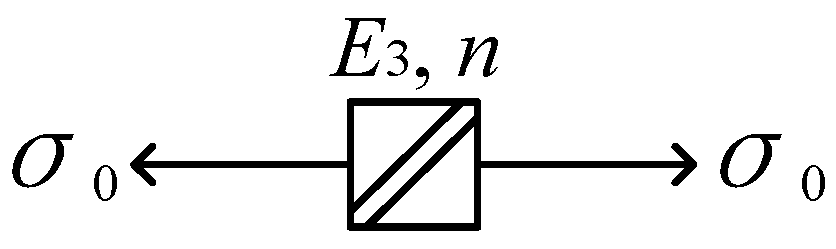
Considering that the deformation of rock is irreversible after it enters the nonlinear stage, strain parameters can be selected to indicate whether the rock enters the accelerated creep stage, and a nonlinear element with time triggering is introduced to describe the deformation of rock during the accelerated creep stage, as shown in Figure 9. The so-called time trigger means that when the overall time of the model is less than that of the rock entering the accelerated creep stage, the element is a rigid body and does not play a role. When the whole time of the model is greater than or equal to the beginning of accelerated creep of rock, the nonlinear element starts to trigger. The constitutive relation of the nonlinear element is defined as follows:
When t < tp:
When t ≥ tp:
where Q is the nonlinear correction coefficient, εg is the nonlinear stress-strain, and tp is the start time of the acceleration phase.
In the figure, E3 and n are the parameters of the acceleration element.
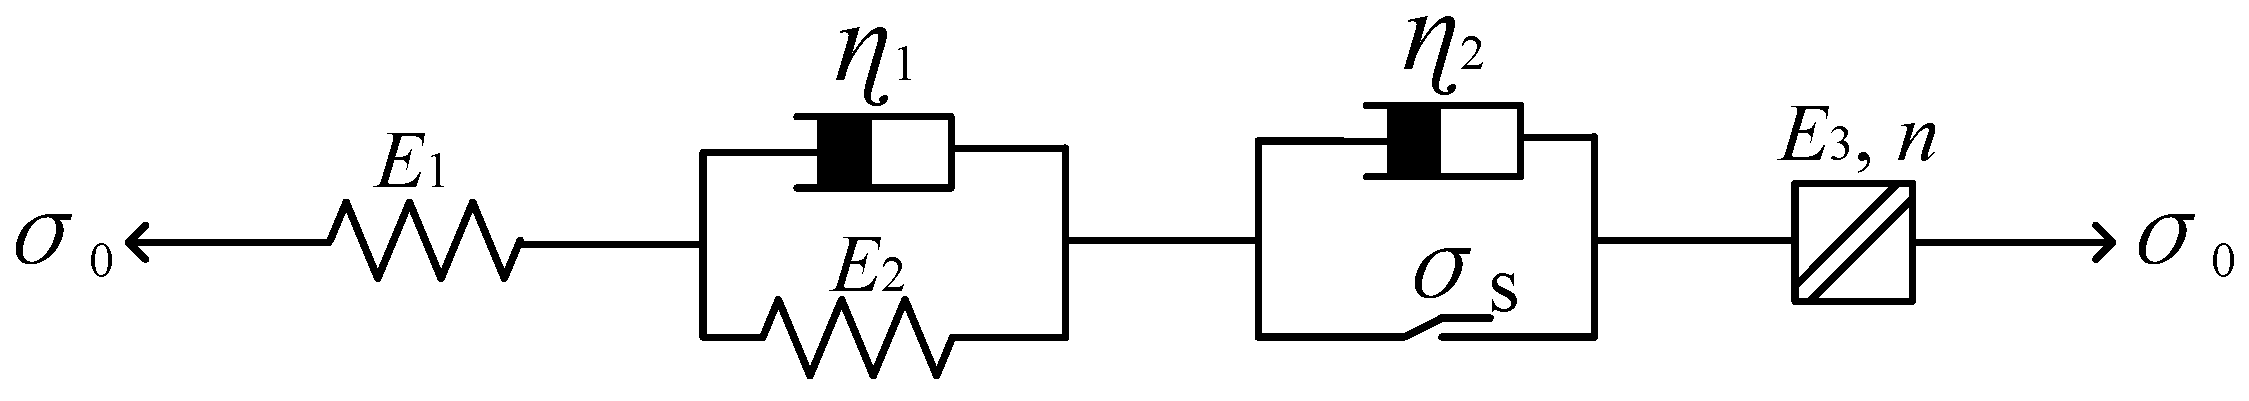
In view of the failure of the Nishihara model to describe the acceleration stage of rock [21], the improved Nishihara model in Figure 10 can be obtained by connecting the elements describing the acceleration stage of rock based on the time effect with the Nishihara model:
The total creep strain ε satisfies:
According to the damage degree and stress of the specimen, the influence of the disturbance load on creep is assessed. The elastic modulus function composed of the disturbance load is introduced into the creep model, and the creep equation of the creep disturbance model is given as follows:
When σ0 ≤ σ < σs:
When σs ≤ σ < σb and t < tp:
When σs ≤ σ < σb and t ≥ tp:
4.3. Establishment of Triaxial Creep Model
The actual rock mass is generally in a three-dimensional stress state, so it is more practical to establish a creep equation with a three-dimensional stress state. The three-dimensional extension of the creep equation needs to satisfy some basic assumptions: the volume deformation of the material is independent of time, the spherical stress does not cause creep, the deviatoric stress can produce creep, and Poisson’s ratio, ν, is low, constant, and does not change with time.
The three-dimensional constitutive relations of elastic strain, viscoelastic strain, and viscoplastic strain are as follows:
where Sij and σmδij are the deviatoric stress and spherical stress, respectively; Gi and K are the shear modulus and bulk modulus, respectively; Gv and ηs are the shear modulus and viscosity coefficient; F is the yield function; F0 is the initial value of the yield function; and m is the experimental constant, usually 1.
The one-dimensional creep constitutive model is transformed into a three-dimensional model by the analogy method. The three-dimensional accelerated creep constitutive model that can describe the accelerated creep process based on statistical damage theory is obtained as follows:
When σ0 ≤ σ < σs:
When σs ≤ σ < σb and t < tp:
When σs ≤ σ < σb and t ≥ tp:
4.4. Parameter Identification and Verification of the Creep Model
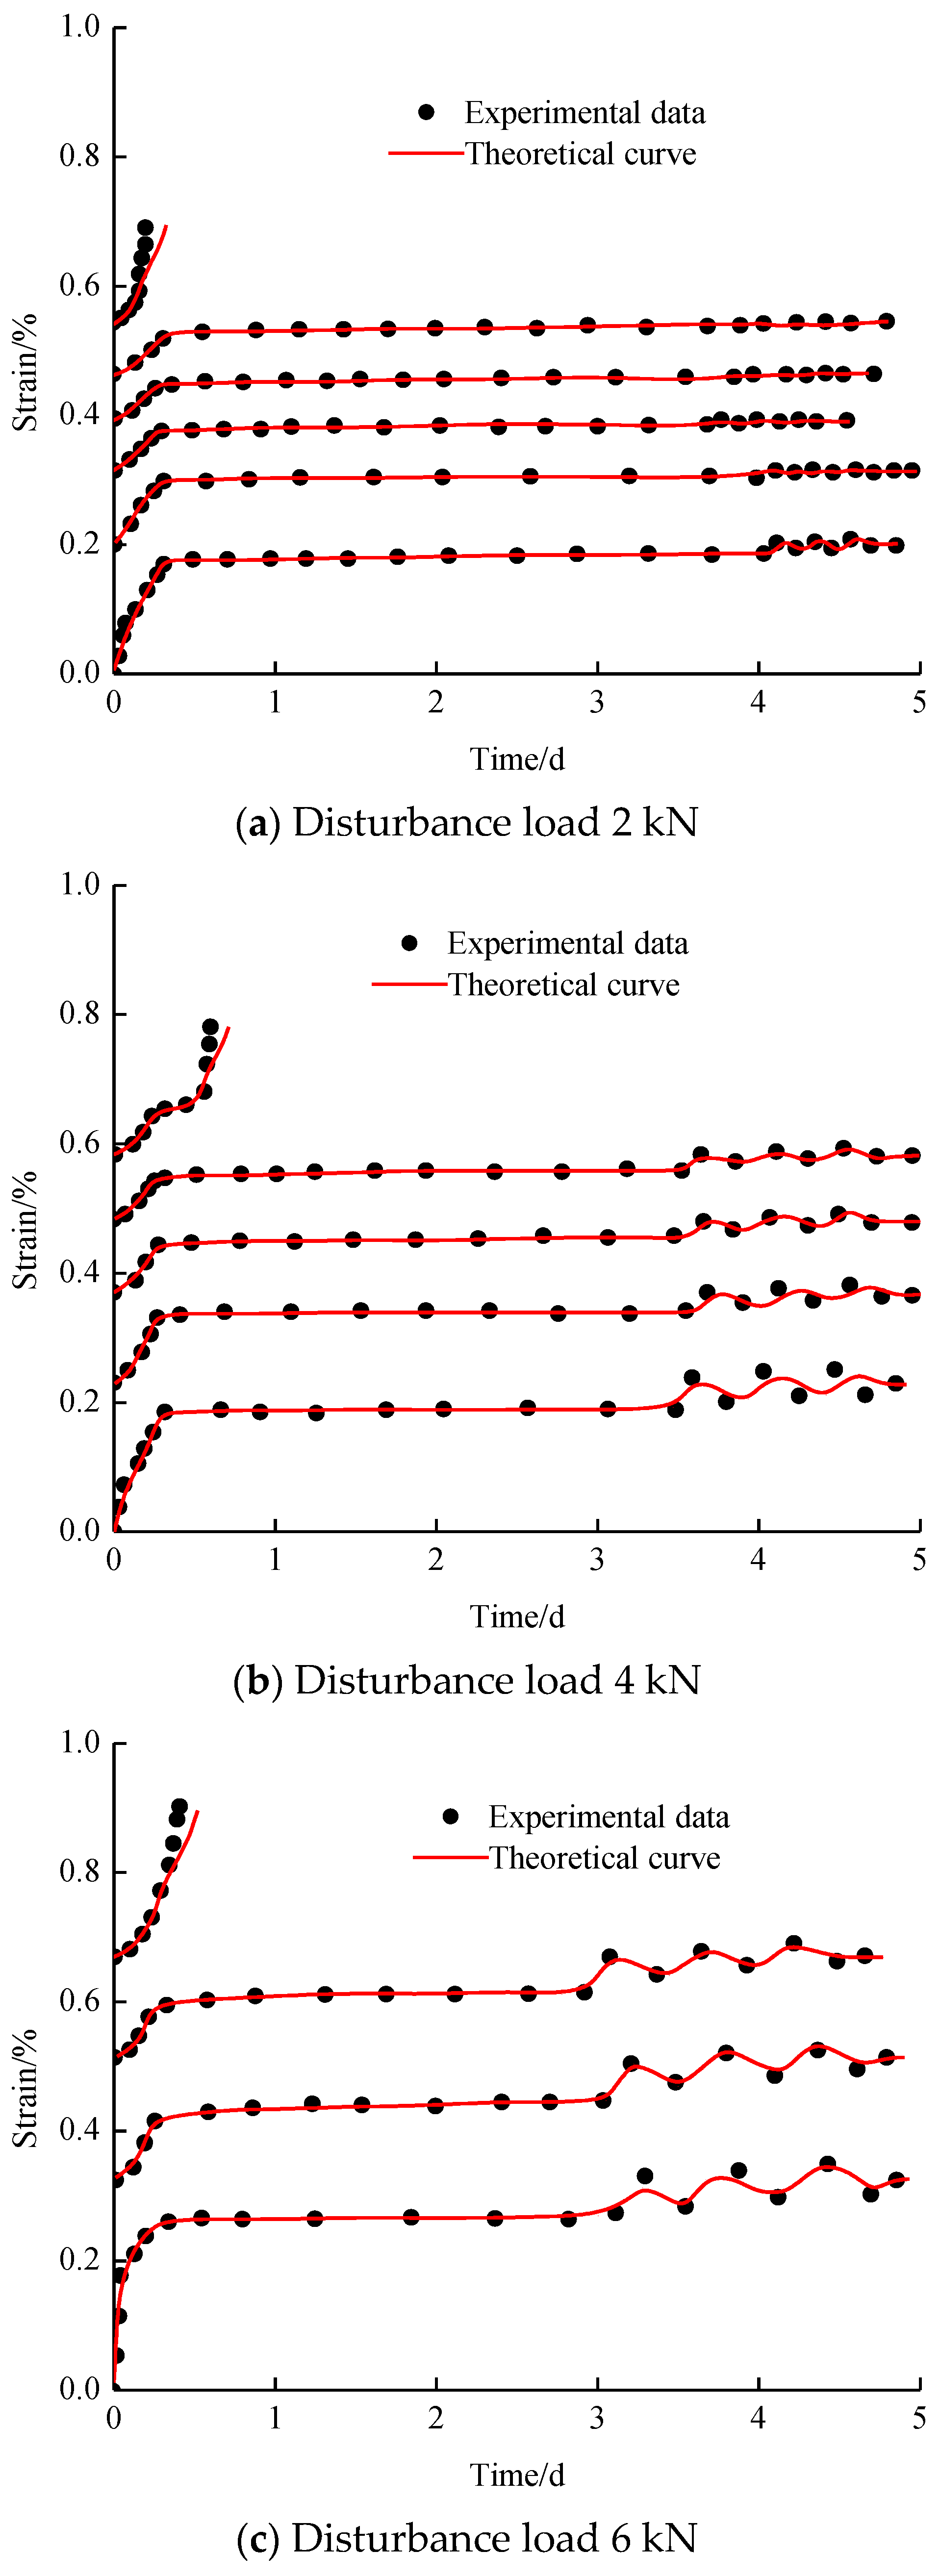
Combining the creep data of sandstone with a disturbance load of 6 kN, based on the least squares method and 1stop fitting software, the fitting values of the model parameters were obtained, as shown in Table 5, and a comparison between the test data and the calculated model curve is shown in Figure 11.
The relevant parameters in the constitutive equation of sandstone are obtained by using software, and the creep equation of sandstone under creep fatigue load can be obtained by bringing these parameters into the creep model. Compared with the laboratory test data, the model has higher fitting parameters, which indicates that the model can better reflect the relationship among stress, strain and time of sandstone under creep fatigue loading and the mechanical properties of sandstone.
5. Conclusions
In this paper, the influence of disturbance loads on the mechanical properties of sandstone were studied by triaxial compression creep tests under different disturbance loads. The relevant conclusions are as follows:
- (1)
- Compared with the conventional triaxial creep curve, the triaxial creep curves of sandstone under disturbance load are divided into decay creep, steady creep, disturbance creep, and accelerated creep stages, and the increment of disturbance creep varies with different disturbance loads.
- (2)
- With increasing disturbance load, the long-term strength, failure time, and elastic modulus of sandstone show linear decreases, while the peak strain increases.
- (3)
- An acceleration element is introduced into the Nishihara model, and the influence of disturbance load is considered. A constitutive model describing the whole deformation of sandstone under creep disturbance load is established. The accuracy of the model is verified by the test data, which provides a theoretical basis for the stability analysis of rock masses.
Author Contributions
Conceptualization, X.L. and Z.Y.; methodology, X.L.; formal analysis, X.L.; investigation, X.L.; resources, X.L.; data curation, Z.Y.; writing—original draft preparation, Z.Y.; writing—review and editing, X.L.; visualization, X.L.; supervision, X.L.; project administration, X.L.; funding acquisition, X.L. Both authors have read and agreed to the published version of the manuscript.
Funding
We gratefully acknowledged the National Natural Science Foundation of China (51774173) for funding this work.
Institutional Review Board Statement
Not applicable.
Informed Consent Statement
Not applicable.
Data Availability Statement
The data used to support the findings of this study are available from the corresponding author upon request.
Acknowledgments
We gratefully acknowledged the National Natural Science Foundation of China (51774173) for funding this work. Special thanks are given to Xiangzhi Yin for providing technical support. I declare that this paper has been presented as preprint in Research Square.
Conflicts of Interest
We declare that we have no financial and personal relationships with other people or organizations that can inappropriately influence our work, there is no professional or other personal interest of any nature or kind in any product, service, and/or company that could be construed as influencing the position presented in, or the review of, the manuscript entitled, “Study on creep mechanical properties and a rheological model of sandstone under disturbance loads”.
References
- Grgic, D. Constitutive modelling of the elastic–plastic, viscoplastic and damage behaviour of hard porous rocks within the unified theory of inelastic flow. Acta Geotech. 2014, 11, 95–126. [Google Scholar] [CrossRef]
- Mishra, V.; Singh, K.N. Microstructural relation of macerals with mineral matter in coals from Ib valley and Umaria, Son-Mahanadi basin, India. Int. J. Coal Sci. Technol. 2017, 4, 191–197. [Google Scholar] [CrossRef] [Green Version]
- Kwon, T.H.; Hong, E.S.; Cho, G.C. Shear behavior of rectangular-shaped asperities in rock joints. KSCE J. Civ. Eng. 2010, 14, 323–332. [Google Scholar] [CrossRef]
- Li, S.; Wang, G.; Wang, S.; Yang, W.; Wang, X. Application of fracture-damage model to anchorage of discontinuous jointed rockmass of excavation and supporting. Yanshilixue Yu Gongcheng Xuebao/Chin. J. Rock Mech. Eng. 2006, 25, 1582–1590. [Google Scholar]
- Ming, Z.G.; Song, X.W.; Rui, M.X.; Yan, L.C. Instability mechanism of high stress rock mass under excavation and unloading induced by disturbance. J. China Coal Soc. 2010, 45, 936–948. [Google Scholar]
- Zhao, T.B.; Tan, Y.L.; Liu, S.S.; Xiao, Y.X. Analysis of rheological properties and control mechanism of anchored rock. Rock Soil Mech. 2012, 33, 1730–1734. [Google Scholar]
- Jiang, P.; Pan, P.Z.; Kun, Z.S. A coupled elasto-viscoplastic damage model based on strain energy theory of rock and application. J. China Coal Soc. 2019, 43, 2967–2979. [Google Scholar]
- Liu, Q.S.; Luo, C.Y.; Peng, X.X.; Liu, H.; Chen, L.; Pan, Y.C. Research on field rheological test and nonlinear fractional derivative creep model of weak rock mass. J. China Coal Soc. 2020, 45, 1348–1356. [Google Scholar]
- Fahimifar, A.; Karami, M. Modifications to an elasto-visco-plastic constitutive model for prediction of creep deformation of rock samples. Soils Found. 2015, 55, 1364–1371. [Google Scholar] [CrossRef] [Green Version]
- Wang, J.G.; Liang, B.; Yang, P.J. Creep experiment and nonlinear disturbance creep model of gneiss under dynamic and static loads. J. China Coal Soc. 2019, 44, 199–205. [Google Scholar]
- Jia, Z.E.; Zhang, J. Damage constitutive model of mudstone creep based on the theory of fractional calculus. Adv. Pet. Explor. Dev. 2015, 10, 83–87. [Google Scholar]
- Khaledi, K.; Mahmoudi, E.; Datcheva, M.; Schanz, T. Stability and serviceability of underground energy storage caverns in rock salt subjected to mechanical cyclic loading. Int. J. Rock Mech. Min. Sci. 2016, 86, 115–131. [Google Scholar] [CrossRef]
- Cao, P.; Wen, Y.; Wang, Y.; Yuan, H.; Yuan, B. Study on nonlinear damage creep constitutive model for high-stress soft rock. Environ. Earth Sci. 2016, 75, 900. [Google Scholar] [CrossRef]
- Xi, D.Y.; Qiu, W.L. Relationship between attenuation of saturated porous rock and porosity and saturation. Oil Geop. Prospect. 1997, 32, 196–201. [Google Scholar]
- Prodan, M.V.; Mileusnić, M.; Arbanas, S.M.; Arbanas, Ž. Influence of weathering processes on the shear strength of siltstones from a flysch rock mass along the northern Adriatic coast of Croatia. Bull. Eng. Geol. Environ. 2016, 76, 695–711. [Google Scholar] [CrossRef]
- Valiulin, S.V.; Onischuk, A.A.; Baklanov, A.M.; Bazhina, A.A.; Paleev, D.Y.; Zamashchikov, V.V.; Korzhavin, A.; Dubtsov, S.N. Effect of coal mine organic aerosol on the methane/air lower explosive limit. Int. J. Coal Sci. Technol. 2020, 7, 778–786. [Google Scholar] [CrossRef] [Green Version]
- Nyoni, B.; Duma, S.; Bolo, L.; Shabangu, S.; Hlangothi, S.P. Co-pyrolysis of South African bituminous coal and Scenedesmus microalgae: Kinetics and synergistic effects study. Int. J. Coal Sci. Technol. 2020, 7, 807–815. [Google Scholar] [CrossRef] [Green Version]
- Hood, M.M.; Eble, C.F.; Hower, J.C.; Dai, S. Geochemistry, petrology, and palynology of the Princess No. 3 coal, Greenup County, Kentucky. Int. J. Coal Sci. Technol. 2020, 7, 633–651. [Google Scholar] [CrossRef] [Green Version]
- Tang, L.; Chen, H.; Sang, H.; Zhang, S.; Zhang, J. Determination of traffic-load-influenced depths in clayey subsoil based on the shakedown concept. Soil Dyn. Earthq. Eng. 2015, 77, 182–191. [Google Scholar] [CrossRef]
- Ajamzadeh, M.; Sarfarazi, V.; Dehghani, H. Evaluation of plow system performance in long-wall mining method using particle flow code. Int. J. Coal Sci. Technol. 2019, 6, 518–535. [Google Scholar] [CrossRef] [Green Version]
- Yang, S.Q.; Xu, W.Y.; Yang, S.L. Investigation on shear rheological mechanical properties of shale in Longtan Hydropower Project. Yantu Lixue 2007, 28, 895–902. [Google Scholar]
Figure 1.
Sandstone specimens.

Figure 2.
Soft rock rheometer.

Figure 3.
σ1 loading path diagram.

Figure 4.
Axial creep curves of rock under different disturbance loads.

Figure 5.
Axial creep curves of specimens under different disturbance loads.

Figure 6.
Different σ1 creep increment curves for lower disturbance levels.

Figure 7.
Variation curves of elastic modulus with disturbance load.

Figure 8.
Nishihara model.

Figure 9.
Nonlinear element.

Figure 10.
Creep disturbance model.

Figure 11.
Theoretical axial creep curves of rock under different disturbance loads.


Table 1.
Physical and mechanical properties of sandstone.
| Dry Density Mg/m3 | Porosity/% | Natural Moisture Content/% | Water Absorption/% | Compressive Strength/MPa | Elastic Modulus/GPa |
|---|---|---|---|---|---|
| 2.51 | 3.1 | 0.84 | 1.4 | 109.56 | 43.5 |
Table 2.
Disturbance increment under different disturbance loads.
| Disturbance Load/kN | 60/MPa | 70/MPa | 80/MPa | 90/MPa | 100/MPa |
|---|---|---|---|---|---|
| 2 | 0.021 | 0.019 | 0.017 | 0.016 | 0.015 |
| 4 | 0.036 | 0.027 | 0.025 | 0.023 | / |
| 6 | 0.055 | 0.045 | 0.0325 | / | / |
Table 3.
Summary of the mechanical properties of the specimens under different disturbance loads.
| Disturbance Load/kN | Peak Strain/% | Long-Term Strength/MPa | Destruction Time/d | Elastic Modulus/GPa |
|---|---|---|---|---|
| 2 | 0.7 | 100 | 24.19 | 26.13 |
| 4 | 0.78 | 90 | 20.57 | 33.49 |
| 6 | 0.9 | 80 | 14.90 | 22.76 |
Table 4.
Polynomial regression results for E(x).
| Parameter | a | b | c | Fitting Parameters |
|---|---|---|---|---|
| First level | 0.011 | 0.462 | −0.066 | 1 |
| Second level | 0.108 | 0.304 | −0.042 | 1 |
| Third level | 0.205 | 0.272 | −0.037 | 1 |
| Fourth level | 0.246 | 0.266 | −0.036 | 1 |
Table 5.
Parameter table of creep fatigue model.
| σ1/MPa | G1/GPa | G2/GPa | K/GPa | η1/GPa·h | η2/GPa·h | G3/GPa | Q | n | R2 |
|---|---|---|---|---|---|---|---|---|---|
| 60 | 1.44 | 47.18 | 3.41 | 0.46 | 2.56 | - | - | - | 0.978 |
| 70 | 2.94 | 73.22 | 4.23 | 0.79 | 3.09 | - | - | - | 0.984 |
| 80 | 3.01 | 60.12 | 5.12 | 0.84 | 3.16 | - | - | - | 0.962 |
| 90 | 4.59 | 46.33 | 6.11 | 0.78 | 2.04 | 2.44 | 1.27 | 1.53 | 0.945 |
Publisher’s Note: MDPI stays neutral with regard to jurisdictional claims in published maps and institutional affiliations. |
© 2021 by the authors. Licensee MDPI, Basel, Switzerland. This article is an open access article distributed under the terms and conditions of the Creative Commons Attribution (CC BY) license (https://creativecommons.org/licenses/by/4.0/).
Share and Cite
MDPI and ACS Style
Li, X.; Yin, Z. Study of Creep Mechanical Properties and a Rheological Model of Sandstone under Disturbance Loads. Processes 2021, 9, 1291. https://doi.org/10.3390/pr9081291
AMA Style
Li X, Yin Z. Study of Creep Mechanical Properties and a Rheological Model of Sandstone under Disturbance Loads. Processes. 2021; 9(8):1291. https://doi.org/10.3390/pr9081291
Chicago/Turabian StyleLi, Xiaofeng, and Zhixiang Yin. 2021. "Study of Creep Mechanical Properties and a Rheological Model of Sandstone under Disturbance Loads" Processes 9, no. 8: 1291. https://doi.org/10.3390/pr9081291
Note that from the first issue of 2016, this journal uses article numbers instead of page numbers. See further details here.