Article

Kaolinite-to-Chlorite Conversion from Si,Al-Rich Fluid-Origin Veins/Fe-Rich Carboniferous Shale Interaction

1
Univ. Lille, IMT Lille Douai, Univ. Artois, Yncrea Hauts-de-France, ULR 4515-LGCgE, Laboratoire de Génie Civil et géo-Environnement, F-59000 Lille, France
2
Univ. Lille, CNRS, INRAE, Centrale Lille, UMR 8207-UMET, Unité Matériaux et Transformations, F-59000 Lille, France
3
Univ. Lille, Univ. Littoral Côte d’Opale, CNRS, UMR 8187-LOG, Laboratoire d’Océanologie et de Geosciences, F-59000 Lille, France
*
Author to whom correspondence should be addressed.
Minerals 2021, 11(8), 804; https://doi.org/10.3390/min11080804
Submission received: 18 June 2021 / Revised: 15 July 2021 / Accepted: 22 July 2021 / Published: 26 July 2021
(This article belongs to the Special Issue Advances in Low-Temperature Mineralogy and Geochemistry)

Abstract

:
The kaolinite-to-chlorite conversion is one of the chloritization processes that occurs in low temperature diagenetic and hydrothermal systems. The mechanism of this mineralogical transformation is still under discussion, since direct transformation, conversion via berthierine as intermediate phase or direct formation of berthierine/chlorite mix, either by dissolution-crystallization or by solid state transformation (or a combination of both), are all hypotheses put forward. In this context, each description of a kaolinite-to-chlorite conversion occurrence becomes an opportunity to shed new light and to renew this debate. Studying Carboniferous shale–crosscut by large quartz-kaolinite veins–from the mining basin of the North of France, we report therefore an uncommon kaolinite-Fe-rich chlorite assemblage. This assemblage appears as a chlorite fringe 20 µm wide along the interfaces between the shale and the quartz-kaolinite veins. All petrographical, mineralogical and chemical data suggest that the Fe-chlorite results from the interaction between the shale, providing the Fe,Mg supply, and the Si,Al-rich veins, leading to the chloritization of the kaolinite at a small scale via at least one dissolution-recrystallisation step. High-resolution observations highlight that neoformed Fe-rich chlorite contains some 7Å isochemical layers, as relict of berthierine. Therefore, we advance that the conversion takes place either through the precipitation of berthierine following by a second step involving solid state berthierine-chlorite conversion, or through the direct precipitation of a chlorite-rich/berthierine-poor mix driven by the Fe/(Fe + Mg) ratio, at low temperature and in reducing conditions. The comparison of our data with the recent literature allows to prefer the second hypothesis.

1. Introduction

Chlorite, a 2:1:1 phyllosilicate crystallizing from 80 °C [1] up to 600 °C [2], is ubiquitous in diagenetic, hydrothermal and metamorphic rocks. Considering that the chlorite composition depends in part on the pressure-temperature conditions [3], chlorite is widely used as an indicator mineral and provides the basis of many geothermobarometers (e.g., [4,5,6,7,8,9,10,11,12]). However, the chlorite thermometry application in diagenetic and hydrothermal contexts is debated, especially because low-T chlorites (i.e., T < 350 °C) are often considered metastable, or contaminated by metastable phases (e.g., [13,14,15,16]). In fact, chlorite formation, and more widely clay mineral transformation, may depend on kinetic factors. This point is moreover coupled to the complexity of the conversion pathways of a precursor into chlorite, and more widely, of the chlorite formation processes.
Whether in hydrothermal or diagenetic systems, chlorite can be formed by: (i) direct precipitation (DP) from a supersaturated solution-more frequent in hydrothermal context-or by (ii) conversion of a precursor, often 1:1 or 2:1 phyllosilicates, either via a solid-state transformation (SST), either via dissolution-crystallization process (DC) ([15] and references therein). Mineral conversions driving to the chlorite formation regularly highlighted are the kaolinite–AlMg-chlorite conversion (1:1 dioctaedral conversion; e.g., [17]) via DC, the berthierine–Fe-chlorite (1:1 tricoctaedral conversion; e.g., [18]) mainly via SST, the saponite–Mg-chlorite (2:1 trioctaedral conversion; e.g., [16]) via SST or/and DC, and the montmorillonite–chlorite (2:1 dioctaedral conversion; e.g., [19]) via SST or/and DC. The diversity of precursors and reaction schemes (chloritization processes or direct precipitation) which can lead to chlorite formation, is one of the key elements of the low-T chlorite thermometry applicability. Thus, it is crucial to understand the conditions and mechanisms of the precursor-to-chlorite transformation.
The formation of chlorite from serpentine or smectite is already covered by the literature, but the kaolinite-to-chlorite conversion is less documented. Few studies report two conversion schemes at low-T: the kaolinite-to-sudoite–a di-trioctahedral structure containing a large amount of vacancies (until 1 apfu)–conversion (e.g., [17,20]) mainly in Mg systems, and the kaolinite-to-Fe-rich chlorite conversion, often via berthierine (e.g., [21]). Concerning the latter, several hypotheses have been put forward, like the direct formation of chlorite from kaolinite, a conversion of kaolinite into berthierine followed by the conversion of berthierine into chlorite via DC and/or SST, and the precipitation of a berthierine/chlorite mix from kaolinite via DC. In this context, each occurrence of the kaolinite-to-Fe-rich chlorite conversion must be studied in order to provide new information likely to tip the balance in favor of one or the other of hypotheses, or to demonstrate that all hypotheses can coexist, depending on the P-T-X conditions.
Here, we describe the formation of Fe-rich chlorite with kaolinite as primary precursor, at the interface between clay and oxide-rich system and quartz-kaolinite veins in a Carboniferous black shale from the North of France. This spectacular kaolinite-chlorite assemblage is characterized through a petrological and geochemical study, while the conversion process is discussed on the basis of crystallochemical data, from SEM-EDX, FIB/TEM-EDX and FIB/STXM-XANES analysis. Fluid inclusion thermometry is also applied on quartz from veins, to constrain the temperature of the primary fluid circulation.

2. Materials and Methods

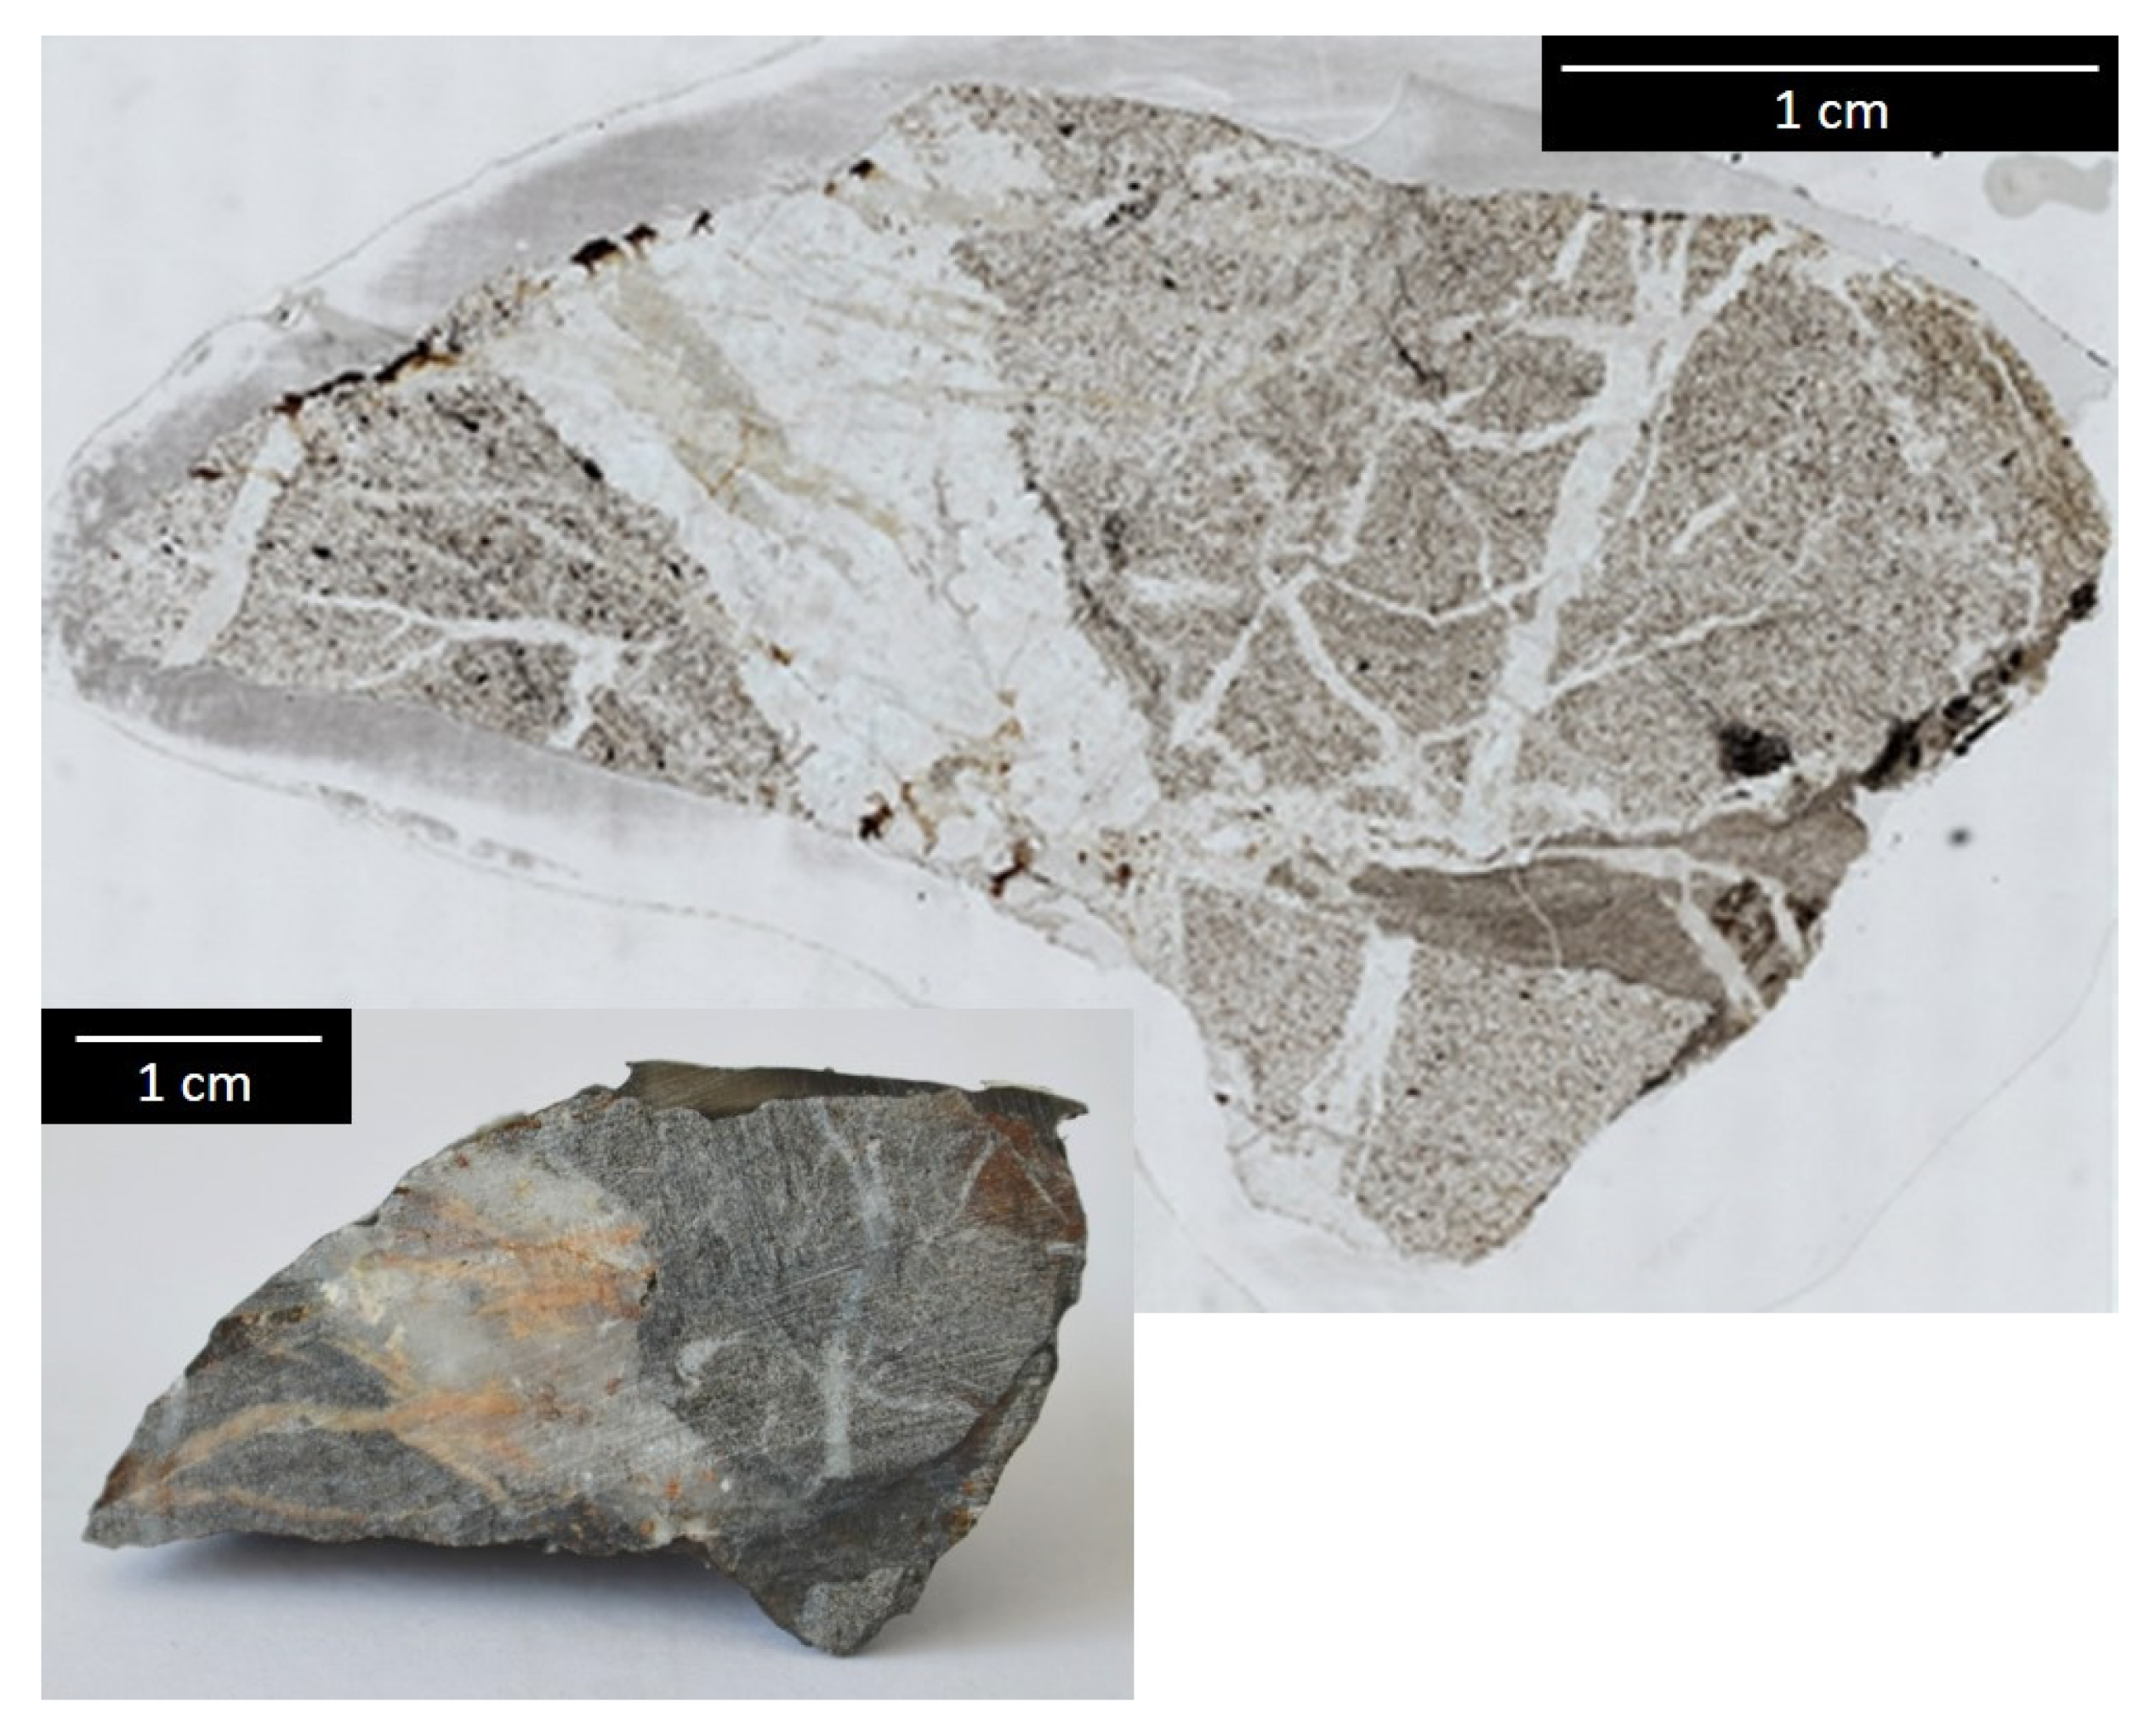
2.1. Geological Setting and Sampling

The studied samples are Carboniferous “black shales” in a generic sense, or a “black schist” in an industrial sense, from the mining basin of the Northern France. The geological unit including these “shales” was put in place during the Westphalian (Pennsylvanian) epoch and corresponds to an alternation of black shales, black sandy shales, black siltstone and shaly sandstones, with several thin coal seams (Figure 1). After a long period of burial, deformation, fracturing and erosion, the Carboniferous unit was covered in unconformity by Cretaceous and Paleogene sediments (marl, limestone and sands), and currently no crops out. However, the past mining activity, related to the coal extraction during the 20th century, led to bring shale samples to the surface, piled up as spoil tips. Studied samples were taken from the spoil tip located at Ostricourt (Figure 1) resulting from the mining via a well drilled to 480 m (fosse 7-7bis), and correspond to the most abundant of the rock component of the coal-waste heap in the Coal Basin of the Northern France (Figure 2; [22]).

2.2. Chlorite Analysis

Scanning electron microscopy (SEM) images and Energy Dispersive X-ray spectroscopy (EDX) analysis were carried out on thin section cut across the shale, using a QUANTA 200 SEM instrument (FEI, Hillsboro, OR, USA; LOG laboratory, Université de Lille, Lille, France) operating at 15 kV with a 1.5 nA current intensity, and coupled to a calibrated-on-standards EDX probe.
Chemical analyses of chlorite were carried out with a CAMECA SX 100 electron microprobe (EMP, Cameca, Gennevilliers, France) equipped with wavelength dispersive spectrometers (WDS). The equipment belongs to the Chevreul Institute (Michel-Eugène Chevreul Institute IMET; CNRS Research Federation-FR2638) in Lille (France). The analytical conditions were the following: 15 nA, 15 kV, spot size of 1 μm, counting time of 20 s/element. The analysed elements were Si, Al, Fe, Mg, Mn, Ti, Ca, Na and K. The system was calibrated with albite for Na, orthoclase for Al and K, wollastonite for Ca and Si, MgO for Mg, MnTiO3 for Ti and Mn, and Fe2O3 for Fe. Prior to analyse, thin sections were coated with carbon. Only analyses with an oxide weight % summing between 84.00 and 89.00 were considered as belonging to the chlorite group.
The area of interest, i.e., through kaolinite/chlorite interface, was cut with a focused ion beam (FIB). The FIB foils were taken using the FEI strata DualBeam 235 instrument (FEI, Hillsboro, OR, USA) of the Institut d’Électronique, de Microélectronique et de Nanotechnologie (IEMN, Lille, France), and cut out with a size of approximately 15 µm by 5 µm and a thickness around 100 nm. To check the preservation of the mineral crystalline structure after FIB-milling, lattice-fringe imaging was systematically carried out with a transmission electron microscope (TEM), following the protocol of Bourdelle et al. [23].
Observations and analyses were performed on a Tecnai G2 20 model transmission electronic microscope (FEI, Hillsboro, OR, USA; Plateforme de Microscopie Electronique (PMEL)–IMET, Lille, France) operating at 200 kV and equipped with a CCD camera and an EDX spectrometer (analysis with a counting time of 30 s for a dead time less than 10% and a beam defocused at 50 nm).
X-ray absorption near-edge structure spectroscopy (XANES) data were acquired on the PolLux beamline (beamline characteristics in [24]) at the Swiss Light Source (Paul Scherrer Institute–SLS, Villigen, Switzerland). During data collection, the SLS synchrotron storage ring operated at 2.4 GeV and 400 mA current in a top-up mode. The XANES spectroscopy was carried out with a scanning transmission X-ray microscope (STXM), allowing to collect spectrum on each pixel of a “sample image” and to evaluate the variation in the Fe3+/Fetotal ratio with an uncertainty of around 5% (probably less for well-defined spectra). Spectra and stacks were obtained over the 700–730 eV energy range (Fe L2,3-edges), using a circularly polarized light and a dwell time per pixel and energy point of 10 ms. Data are processed using the aXis2000 software [25]. The procedure for the Fe3+/Fetotal ratio determination is detailed in Bourdelle et al. [26].

2.3. Fluid Inclusions and Microthermometry

Fluid inclusions (FIs) are relics of paleo-fluids trapped inside minerals during their growth. The study of FIs allows characterising the paleo-fluid by determining its composition and the minimum pressure-temperature conditions during its entrapment. The validity of fluid inclusion analyses relies on three assumptions: (i) the inclusions trapped a single, homogeneous phase; (ii) the volume of the inclusions has not changed since entrapment; (iii) the composition of the inclusions remains unchanged since it was trapped [27]. In this study, fluid inclusion analyses were performed at the Laboratory of Civil Engineering and geo-Environment (LGCgE, University of Lille, Lille, France), using a Fluid, Inc. microthermometric USGS-type stage (Fluid, Inc., Oakland, CA, USA). The calibration was done by measuring the melting of ice in a pure water bath (0.0 °C) and the melting temperature of CO2 in synthetic aquo-carbonic fluid inclusions (−56.6 °C). An additional standard was used for low-temperature phase measurements (H2O-KCl eutectic temperature, −10.7 °C). The maximum uncertainty above room temperature was 0.1 °C.
The “Fluid Inclusion Assemblage” (FIA) approach was used [28]. This method consists in gathering FIs all formed contemporaneously, by using only petrographic criteria. According to Goldstein and Reynolds [28], all the inclusions of a given FIA must have the same composition, density and homogenization temperatures (Th). A FIA is typically composed of 15 to 20 inclusions. This statistical approach allows to eliminate data that diverge more than 10–15 °C from the average value. Salinity based on the temperature of ice melting (Tmi) were calculated using the equation of Bodnar [29].

3. Results

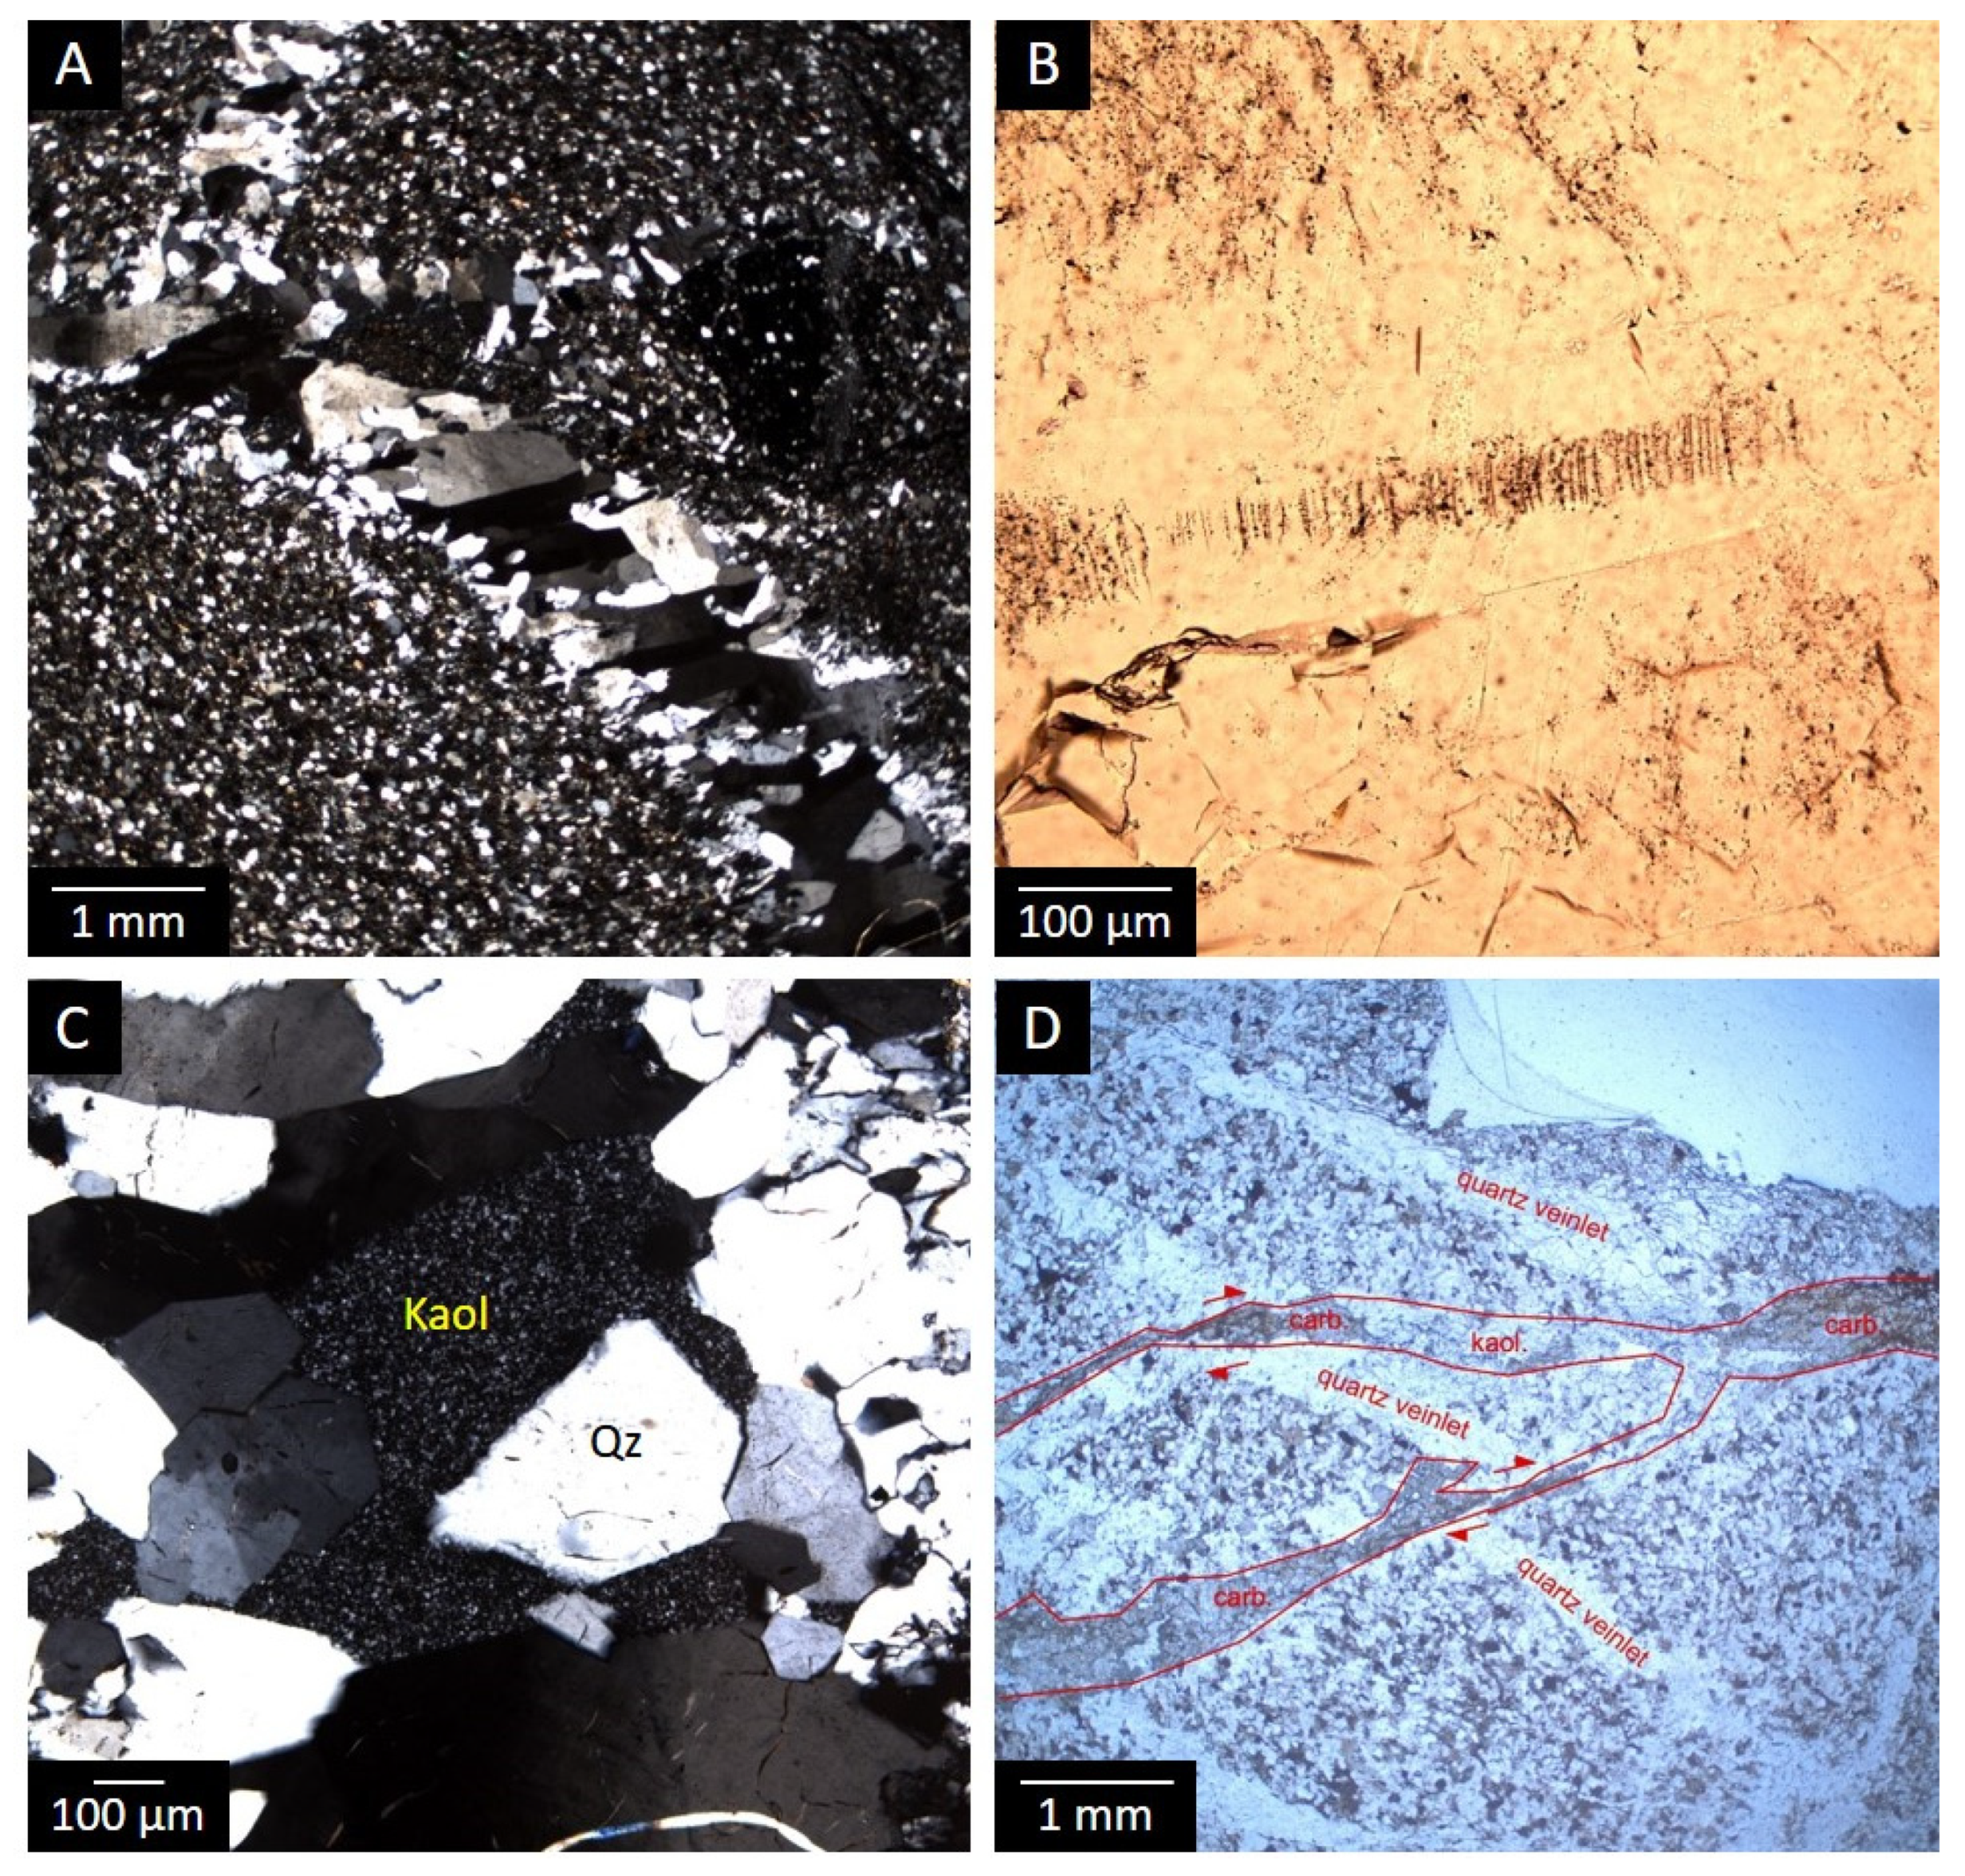
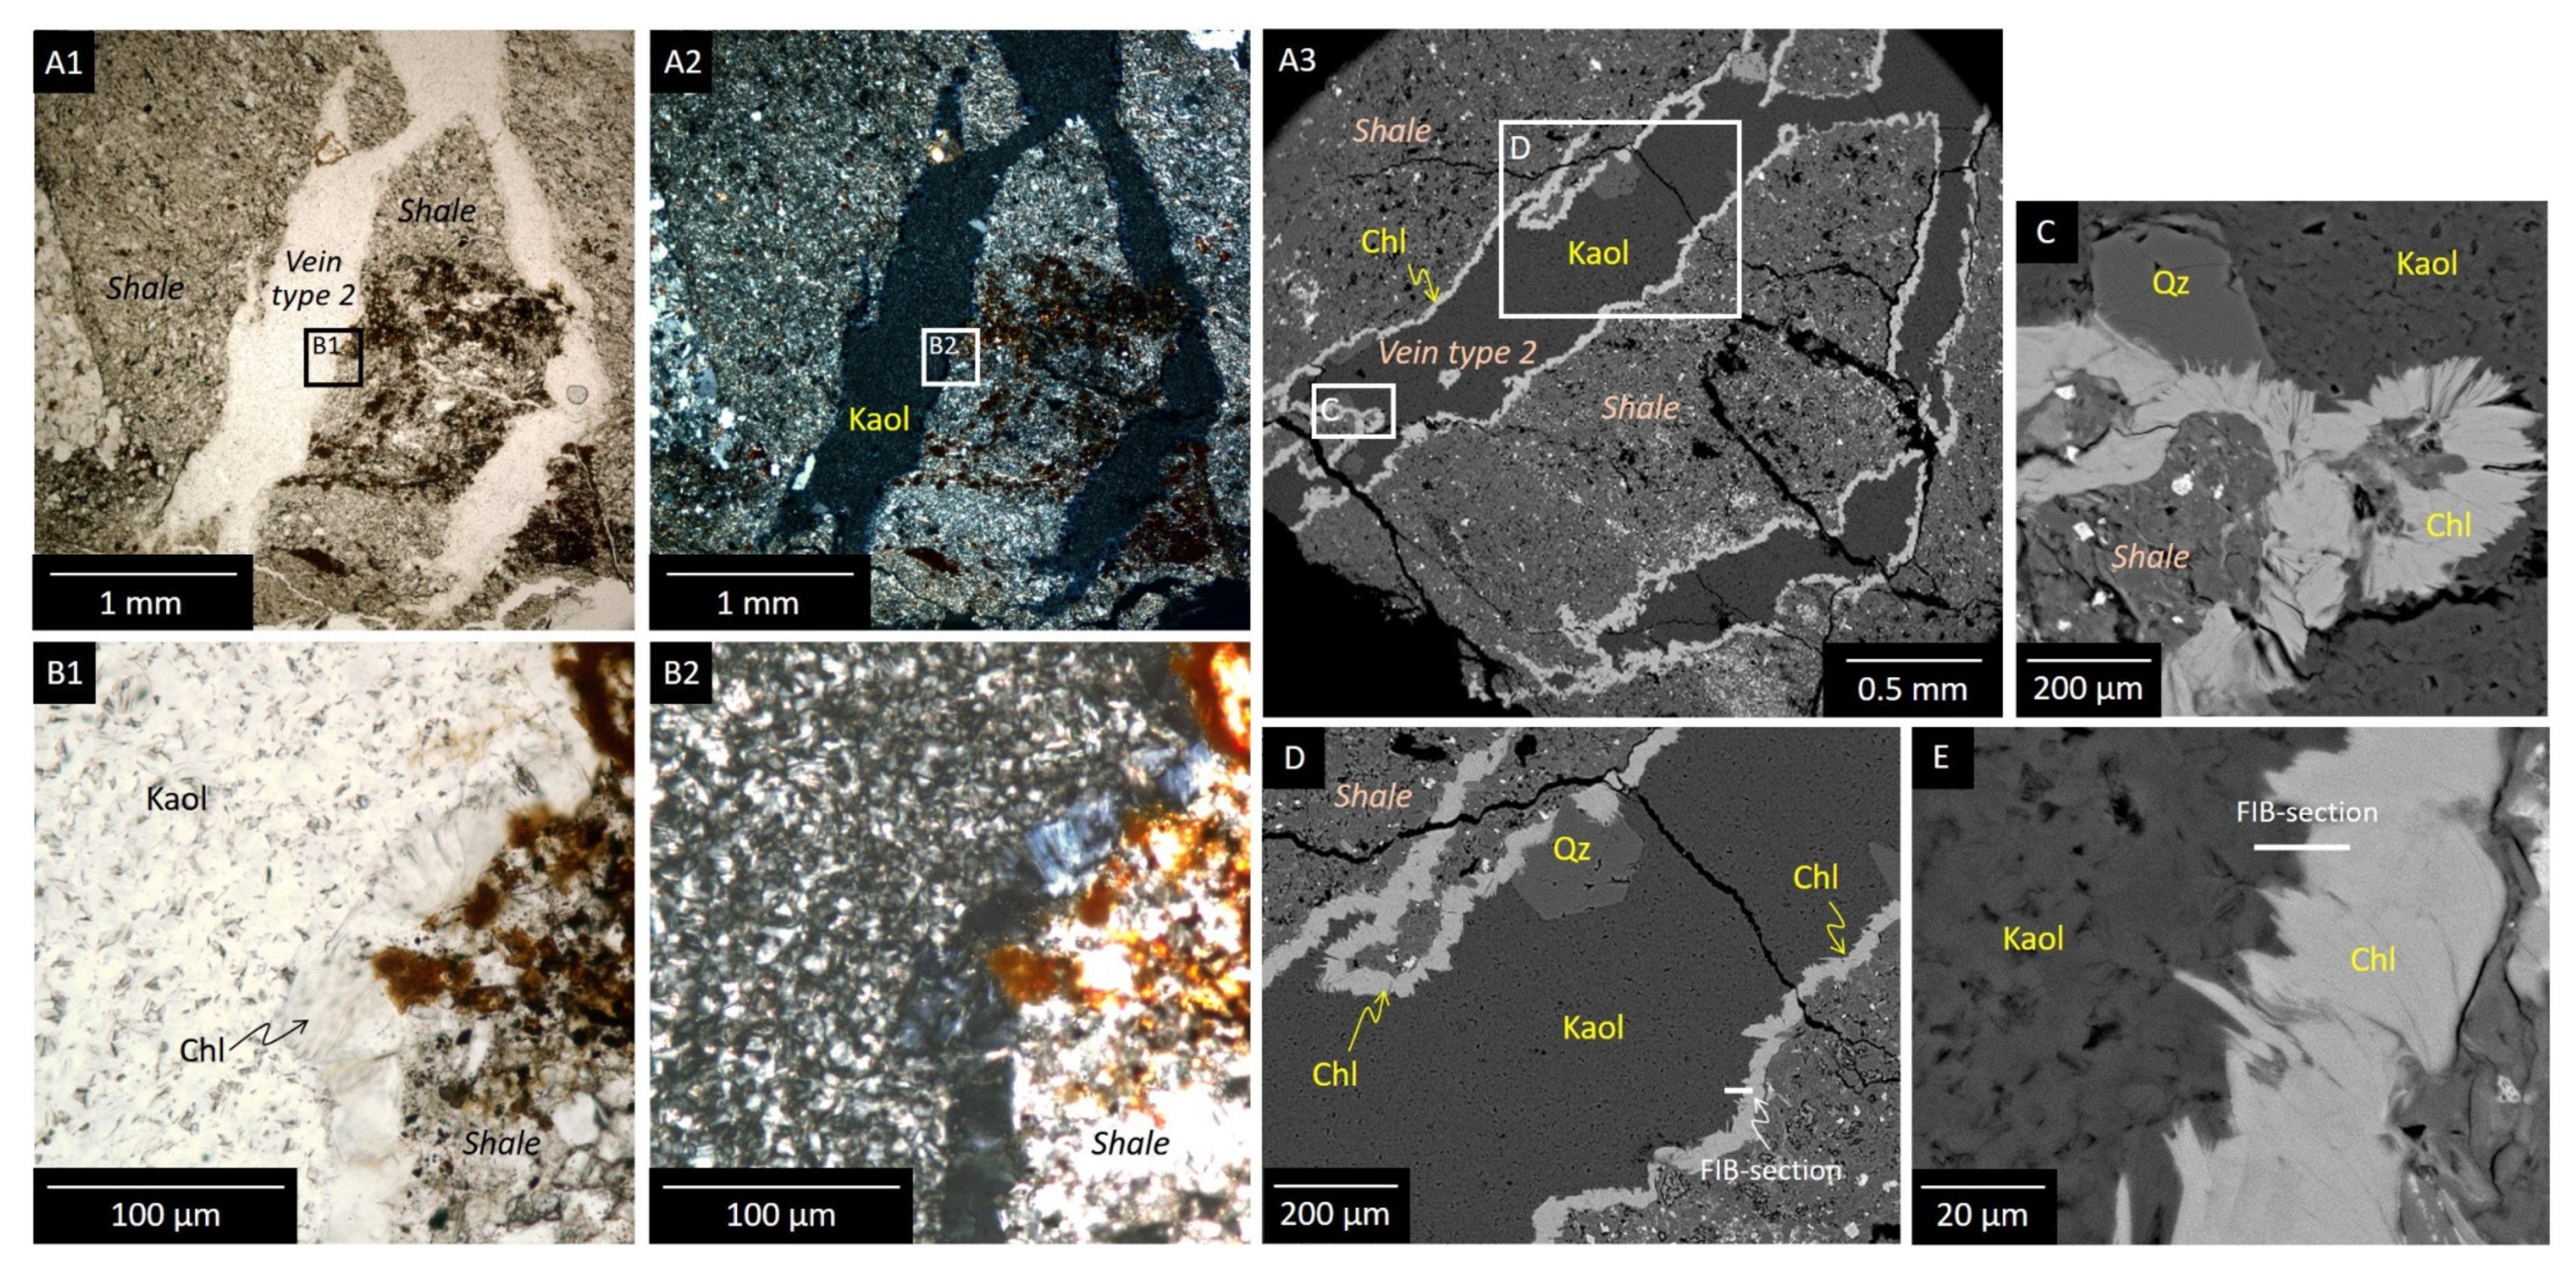
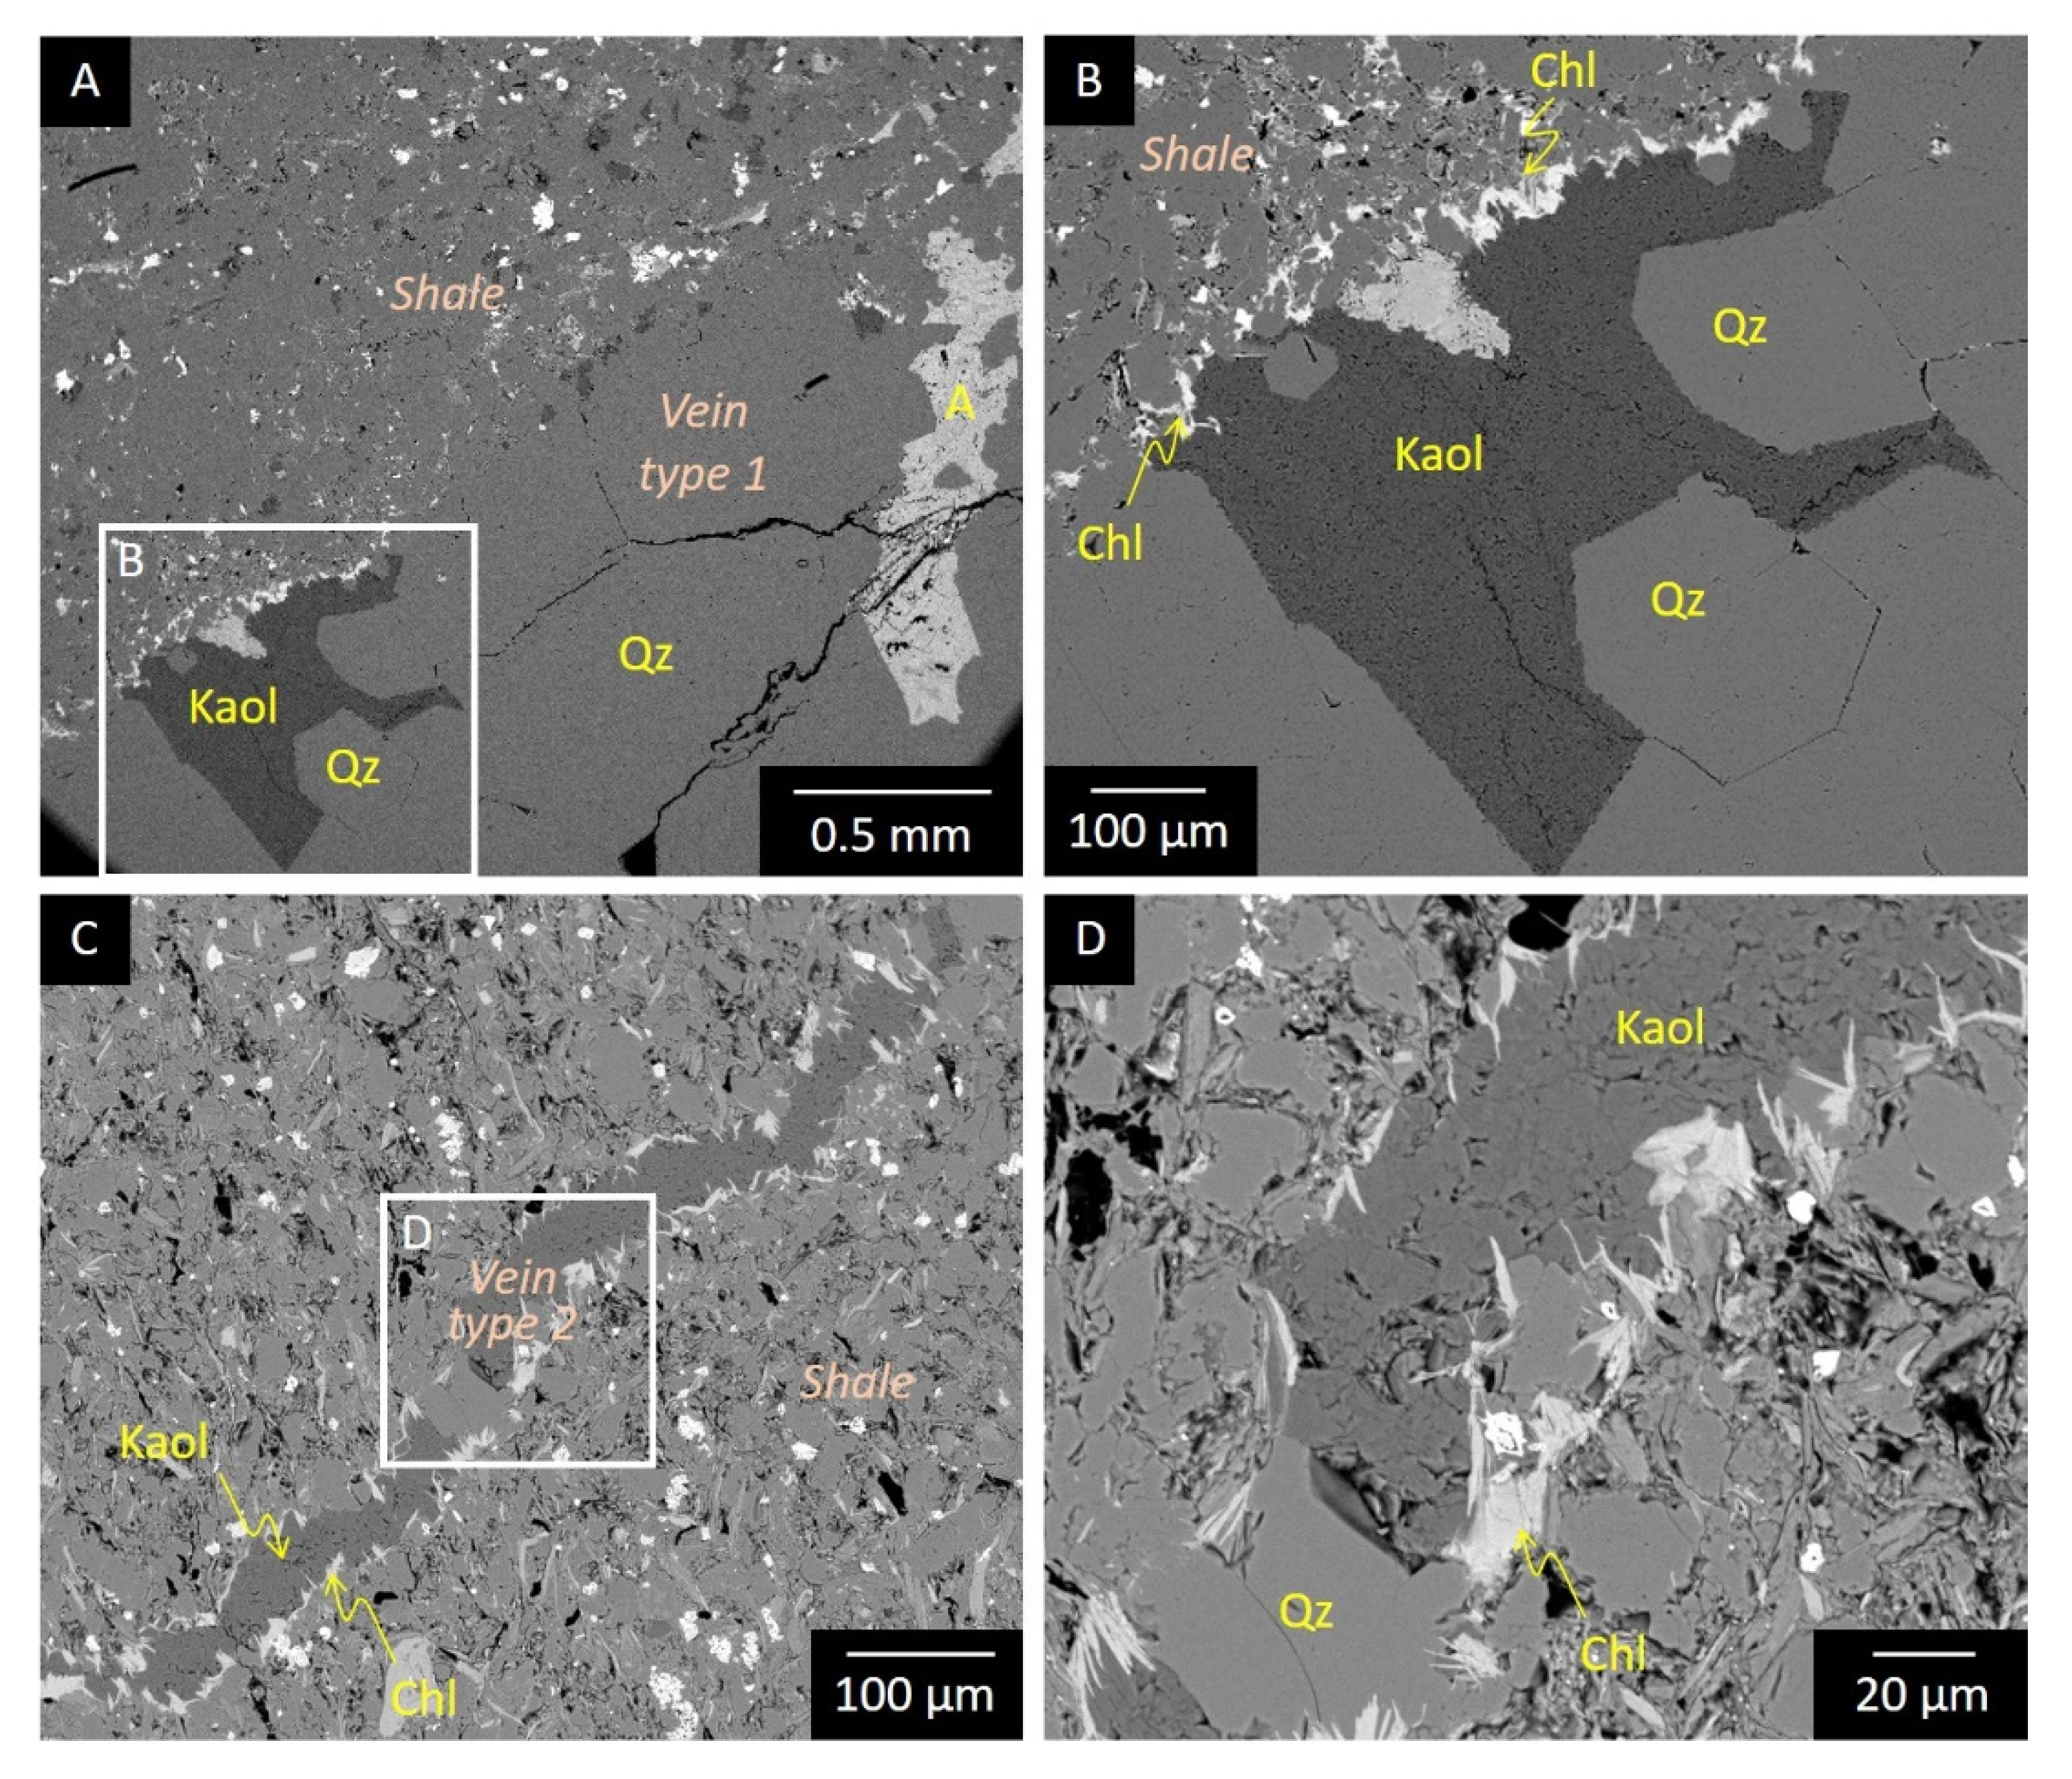
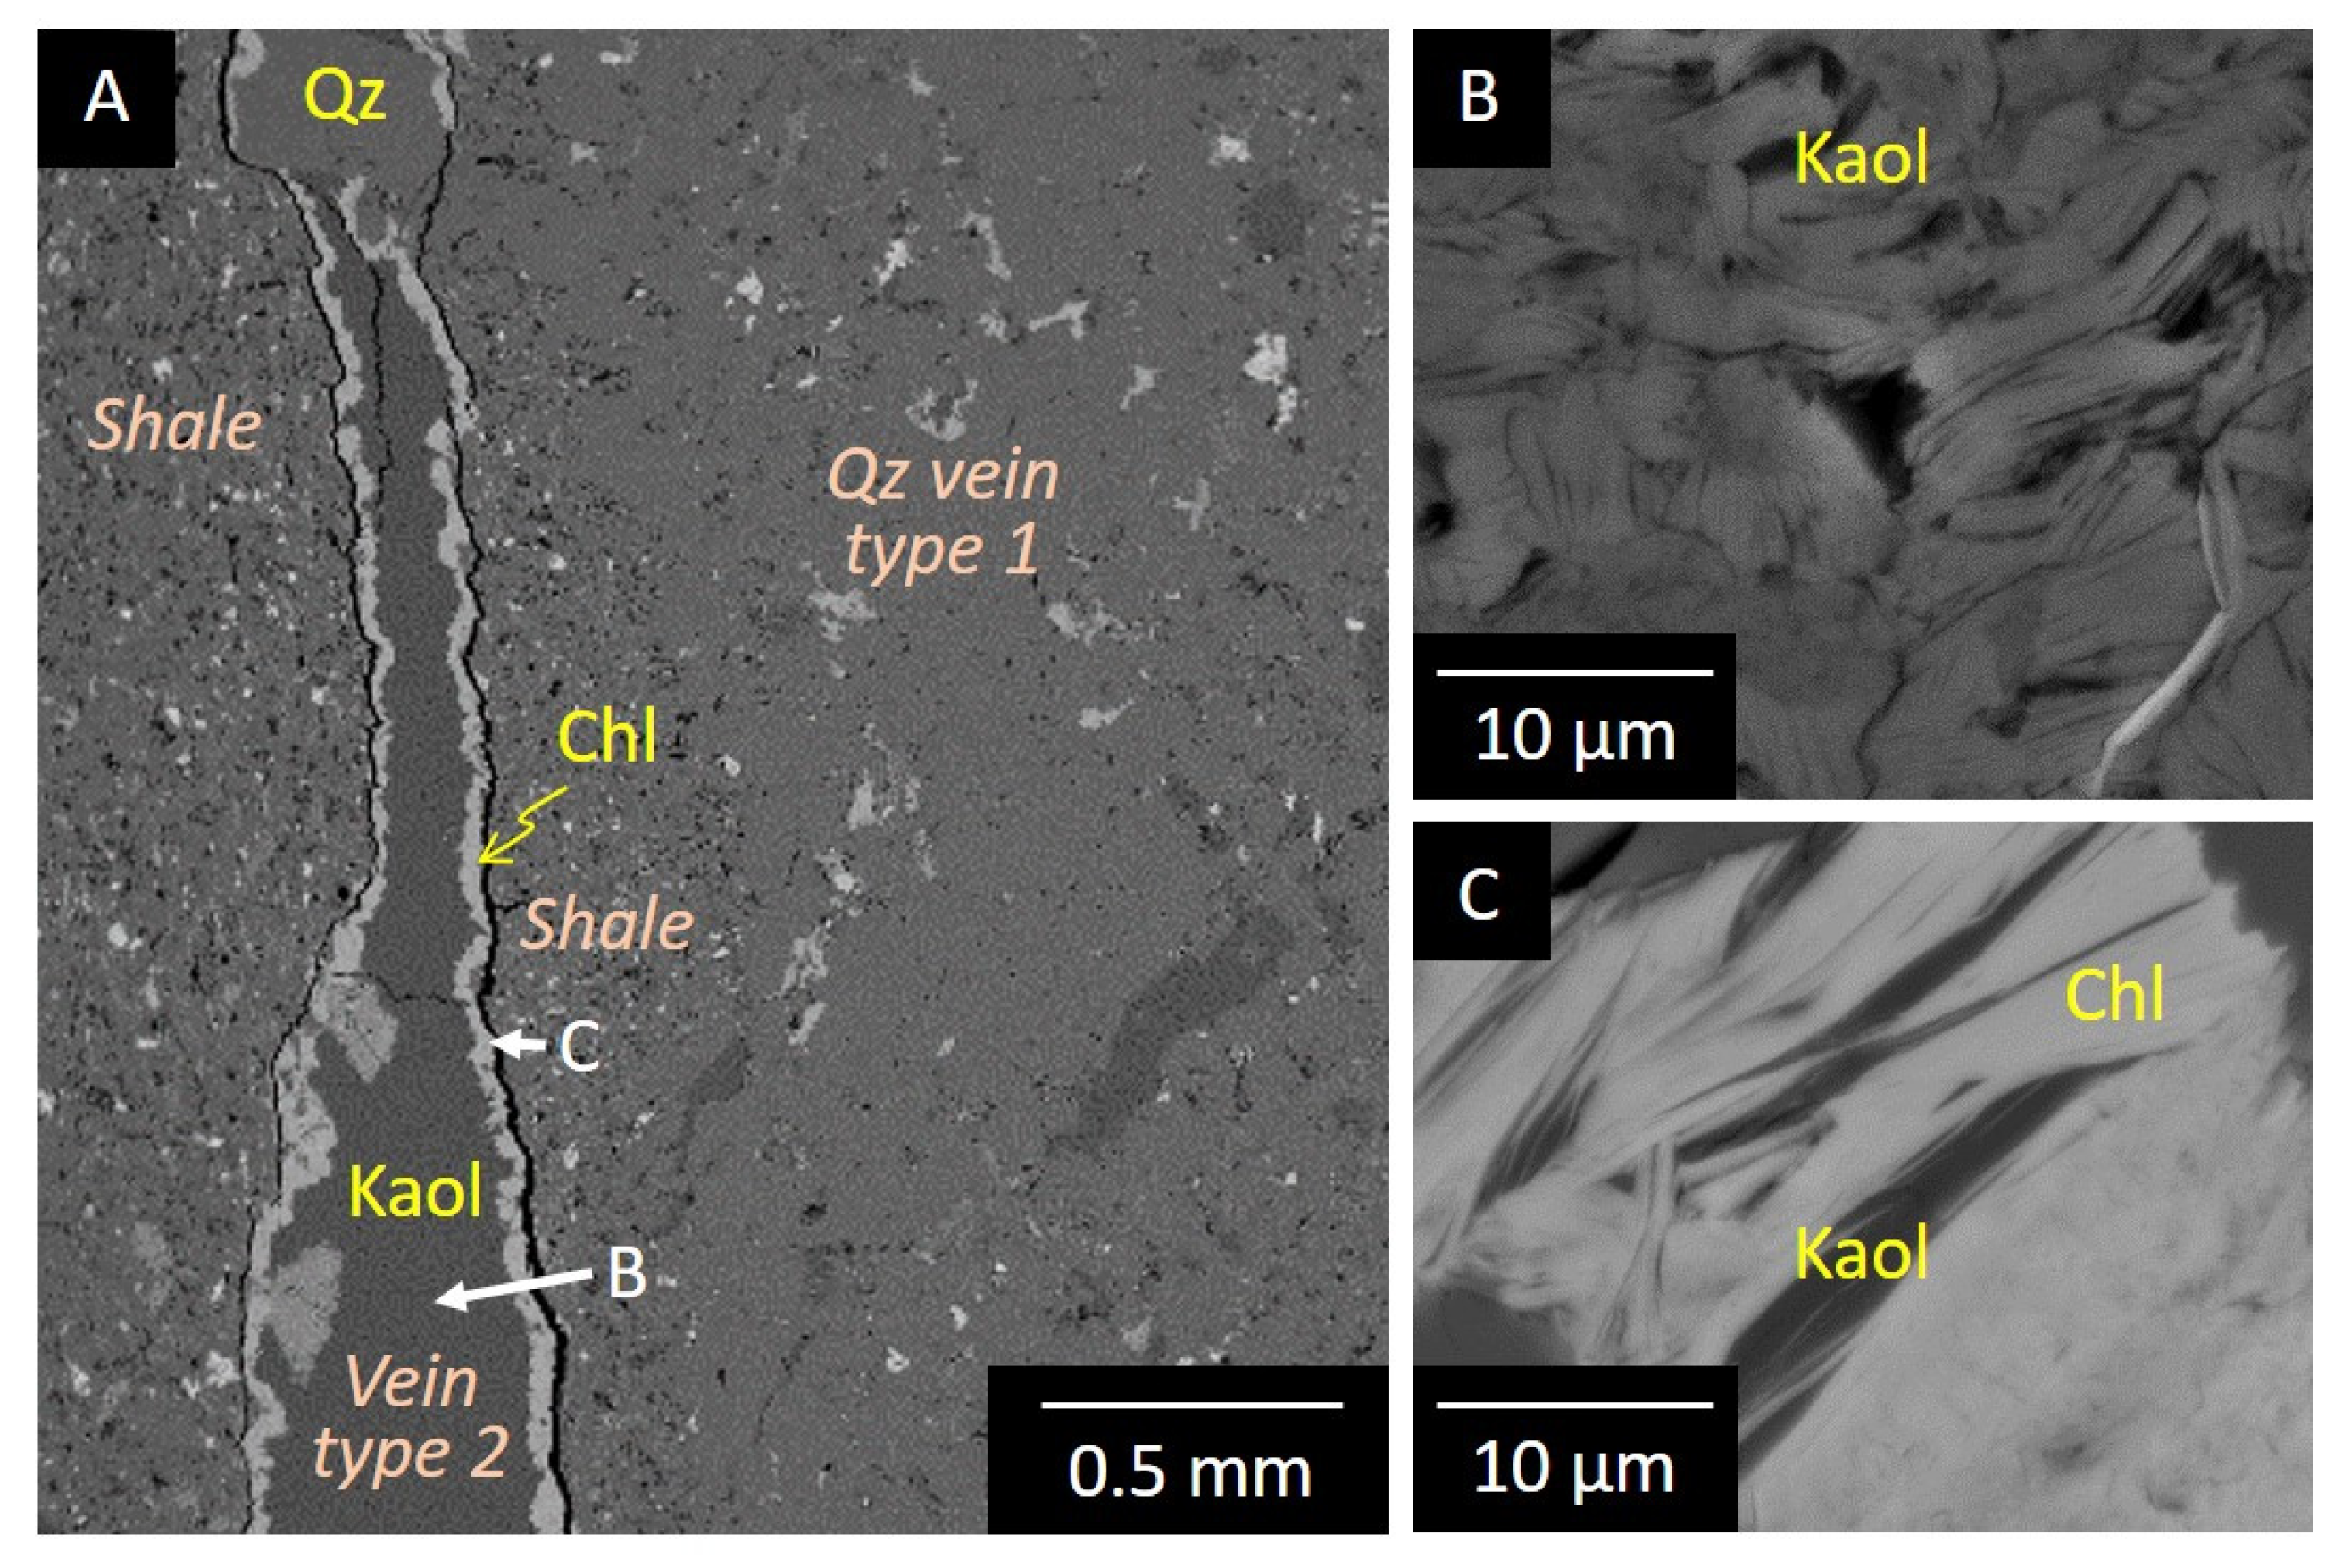
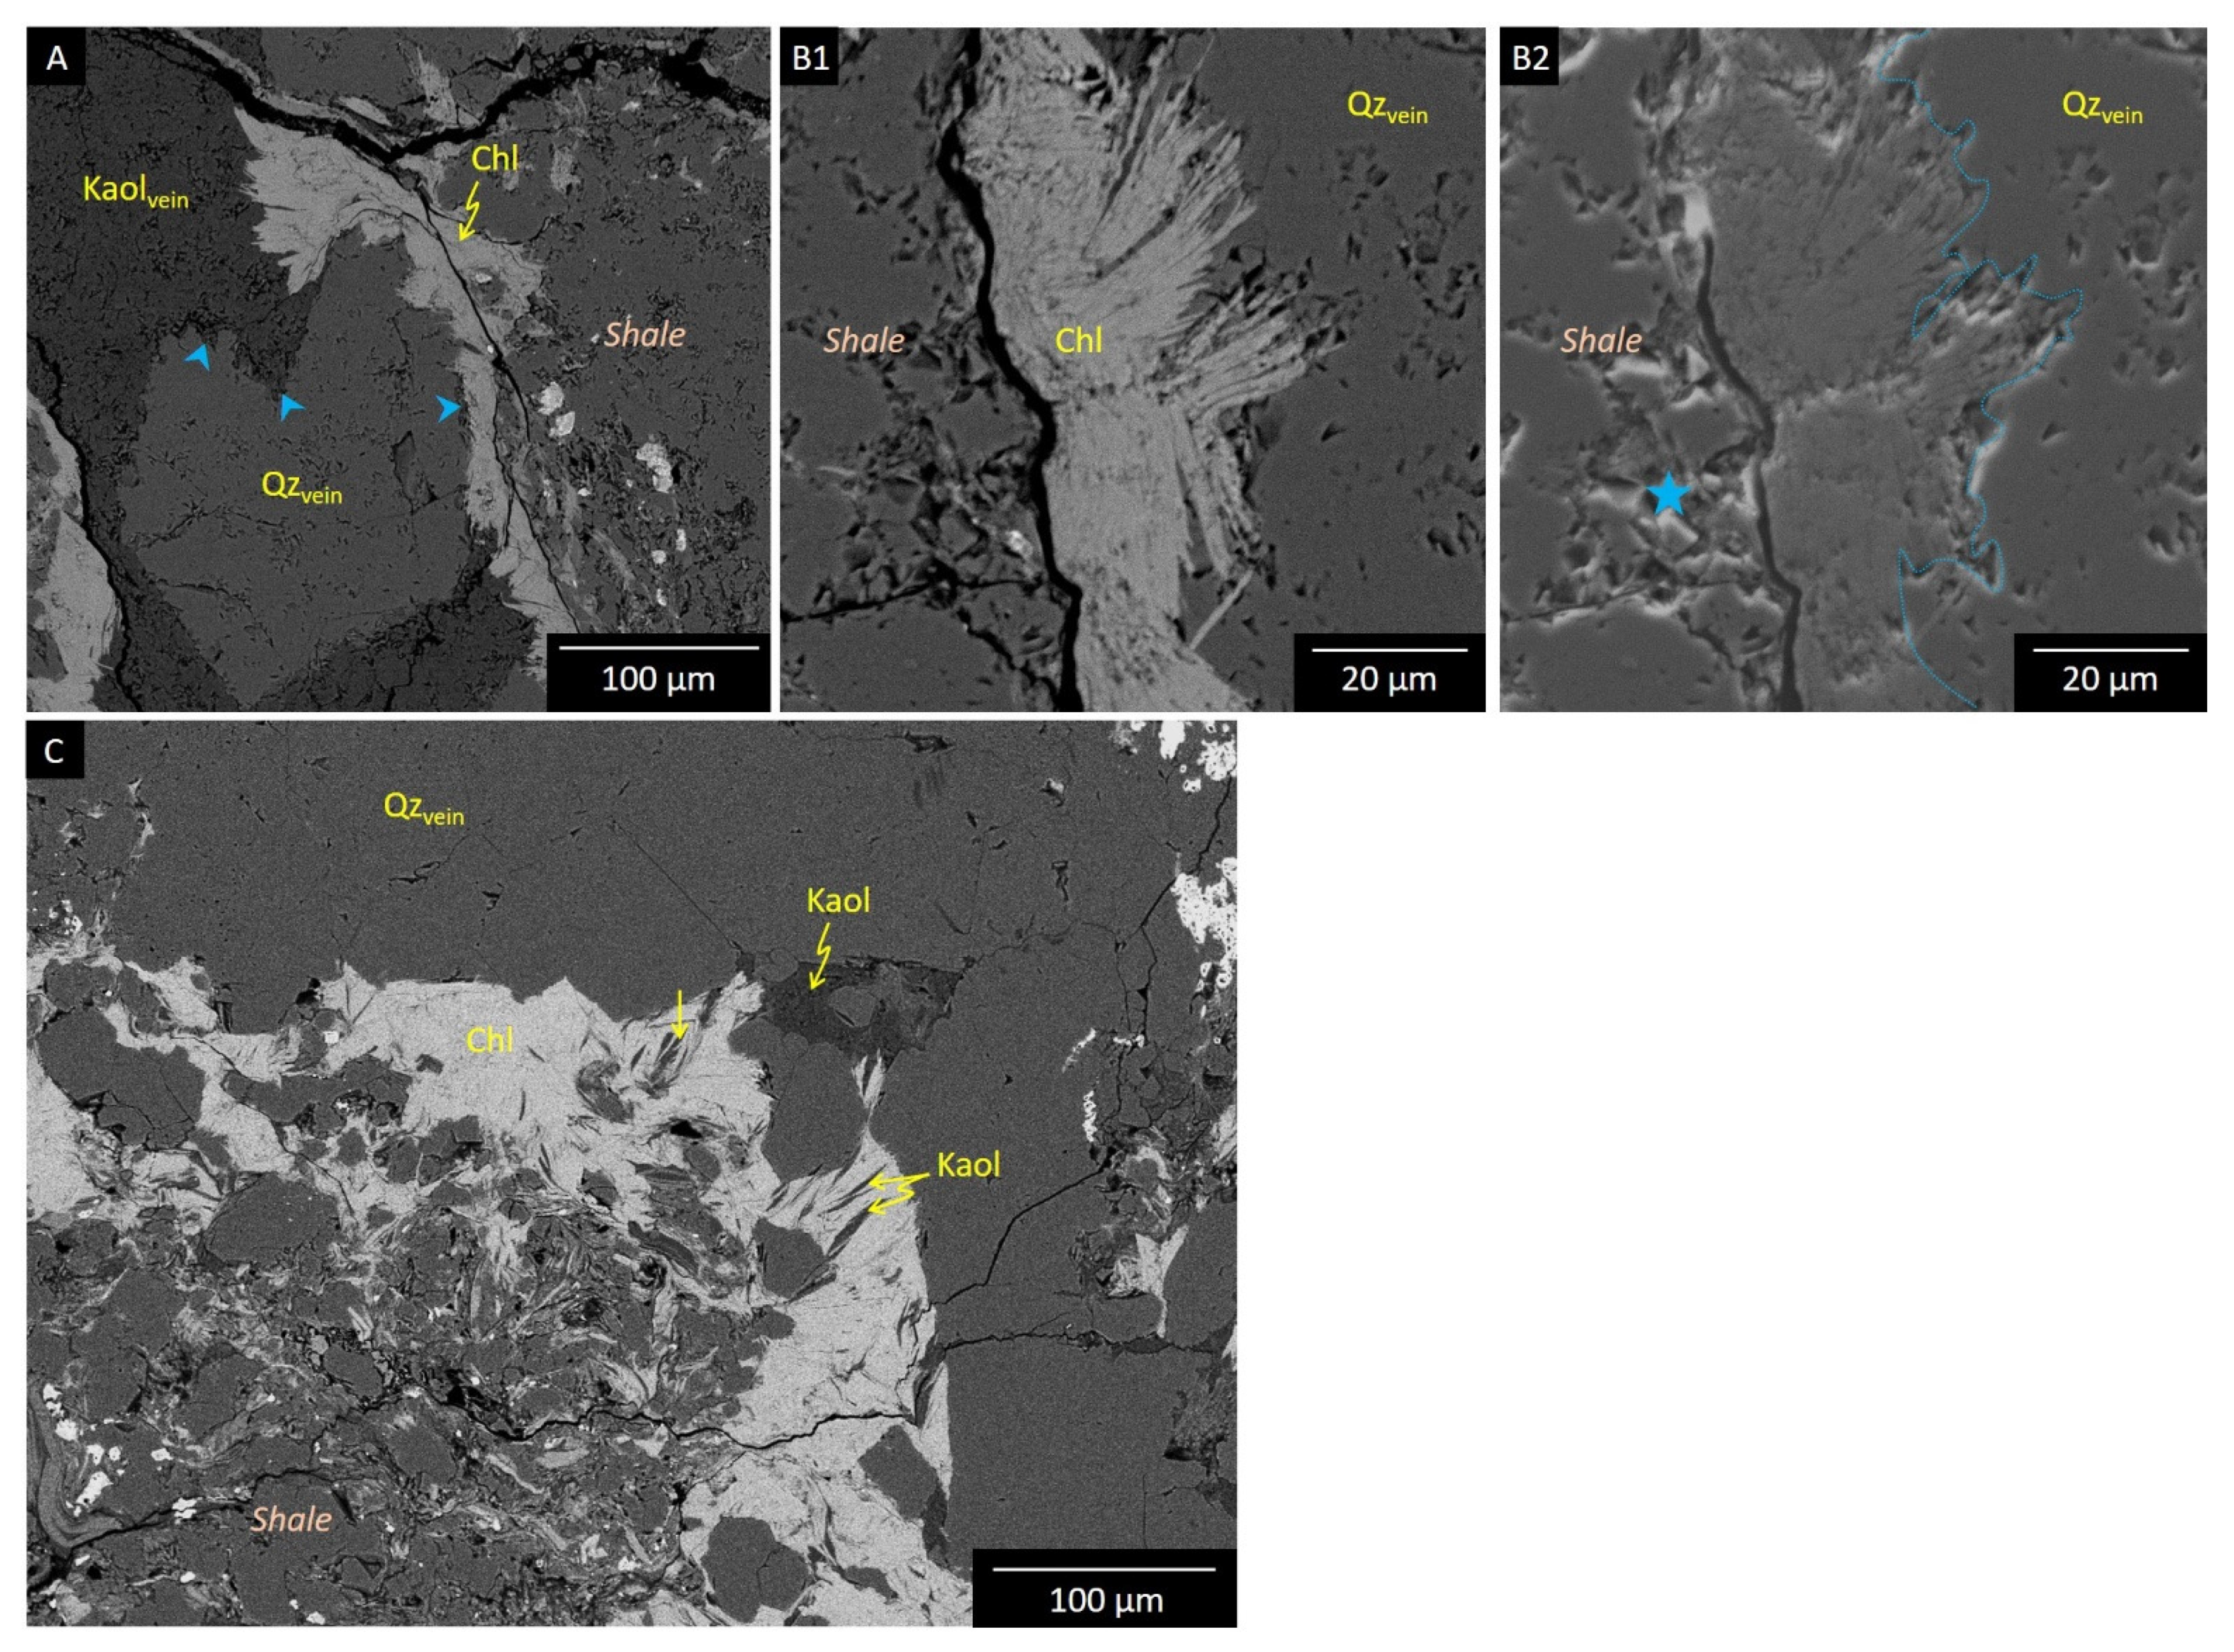
3.1. Petrographical Observations

The petrological study is based on optical microscope and SEM observations, presented in Figure 2, Figure 3, Figure 4, Figure 5, Figure 6 and Figure 7.
The black shale consists of quartz, mica, smectite, kaolinite, chlorite, iron oxides, titanium oxides, feldspar as major phases. Petrographically it can be defined as a siltstone rich in organic matter. The mineralogy mainly includes rounded or blunted well-sorted quartz grains (granulometry 10 to 50 µm) encased in by a clayey matrix. Pyrites, iron and titanium oxides are identified in the form of framboidal clusters or covering large areas. All these mineral phases are similar to those previously identified by X-ray diffraction (XRD) by Masalehdani et al. [22].
The rock is crosscut by numerous fractures of several centimeters in length and 1 to 5 mm wide, without preferential orientation (Figure 2, Figure 3 and Figure 4). Fractures generate disjunction of fragments in a jigsaw puzzle pattern. Veinlets are filled by a simple mineralogy composed of quartz, calcite and minerals of the kaolinite group. Two veinlet types can be distinguished as regards to the veinlet filling. The first type (type 1) is mainly composed of quartz. Moreover, at least two quartz generations can be distinguished inside. A first generation is composed of anhedral quartz defining a comb texture. This texture (Figure 3A) is characterized by the preferential alignment of parallel to sub-parallel elongated crystals either perpendicular to the veinlet wall [30,31], or with variable orientation relative to the wall. Crystals terminate in open space towards the vein center allowing for development of rhombohedral terminations. Crystals have a uniform size and zonation of crystals is common and attributed to variations in inclusion density, particularly fluid inclusions (Figure 3B). Quartz crystals present an undulose extension, which could testify of a slight deformation. The open space inside veinlets is occupied by a second quartz generation composed of euhedral quartz, micrometric to millimetric in size. Finally, the residual porosity is filled by carbonates (identified as ankerite) and minerals of the kaolinite group (Figure 3C,D, Figure 5 and Figure 6; [32]). These latter form 4 to 10 µm-long vermicular booklets by stacking of thin pseudo-hexagonal plates, which is one of the typical morphology of kaolinite polymorph, and not of dickite [32].
The second veinlet type (type 2) clearly crosscuts both the host rock and the type 1 veinlet network and is composed either of kaolinite with minor euhedral quartz (Figure 4 and Figure 6), or carbonates (ankerite). At the intersection between type 1 and type 2 veinlets a shift of type 1 veinlets is observable (Figure 3D).
At the interface between the shale and the kaolinite areas of veins (type 1 and type 2), pleochroic very-light chlorites are observed, with irregular extinction under crossed-polarized light suggesting polycrystalline structures formed by very thin micrometric crystallites (Figure 4, Figure 5, Figure 6 and Figure 7). These chlorites appear in the form of hair-like bundles, sometimes sparses (Figure 5; start of the chloritization process) along the interface, sometimes contiguous until a fringe 20 µm wide is formed (Figure 4 and Figure 6). However, chlorites are almost exclusively present at the kaolinite/shale contacts (Figure 5A and Figure 6A), rarely when the interface corresponds to euhedral quartz/shale contacts (mainly type 1 veins) or when a kaolinite pocket is isolated from shale by quartz crystals (Figure 3C and Figure 6A). Sometimes chlorite forms intergrowths with kaolinite at the micrometric scale (Figure 6C), but chlorite and kaolinite are often not mixed (and never mixed at the nanometric scale, see below). Rare pockets of kaolinite are also observable into the shale, and partially replaced by chlorite with the same characteristics than the one at the shale/vein interface.
In addition to Figure 4, Figure 5 and Figure 6, Figure 7 allows one to confirm the anteriority of the quartz-kaolinite precipitation over the chlorite formation. In Figure 7A, the chlorite clearly bypasses the euhedral quartz of the vein, taking therefore locally a direction parallel to the vein/shale interface, to significantly grow trough the kaolinite (top of the image). The chlorite follows the cracked surfaces of the quartz, but textural insights do not allow to consider that the quartz is posterior to the chlorite, or encloses chlorite hairs. Sometimes, it might appear that the chlorite is “encapsulated” in quartz, but a focus on the quartz/chlorite interface (Figure 7B1,B2) indicates that the chlorite only replaces kaolinite which is nestled in quartz cracks. Observing the rare areas where the chlorite is developed beyond a 20 µm fringe, and almost completely replaced kaolinite (Figure 7C), we can identify: (i) residual kaolinite in the chlorite-the reverse being never found, (ii) a chlorite growth delimited by quartz faces, i.e., chlorite surronding, bypassing or following the euhedral quartz. Moreover, chlorite was found along the two types of veins, whereas they have different mineralogical assemblages (two generations of quartz, with one as large euhedral quartz and few kaolinite areas for veins type 1, and mainly kaolinite with few small quartz for veins type 2). By adding the Figure 5A observations where chlorite formation is restricted to the kaolinite areas of the veins (and not in front of quartz), all microstructures are in favor of a kaolinite chlorite sequence, and not of a late quartz-kaolinite infill of a chlorite-lined fractures.

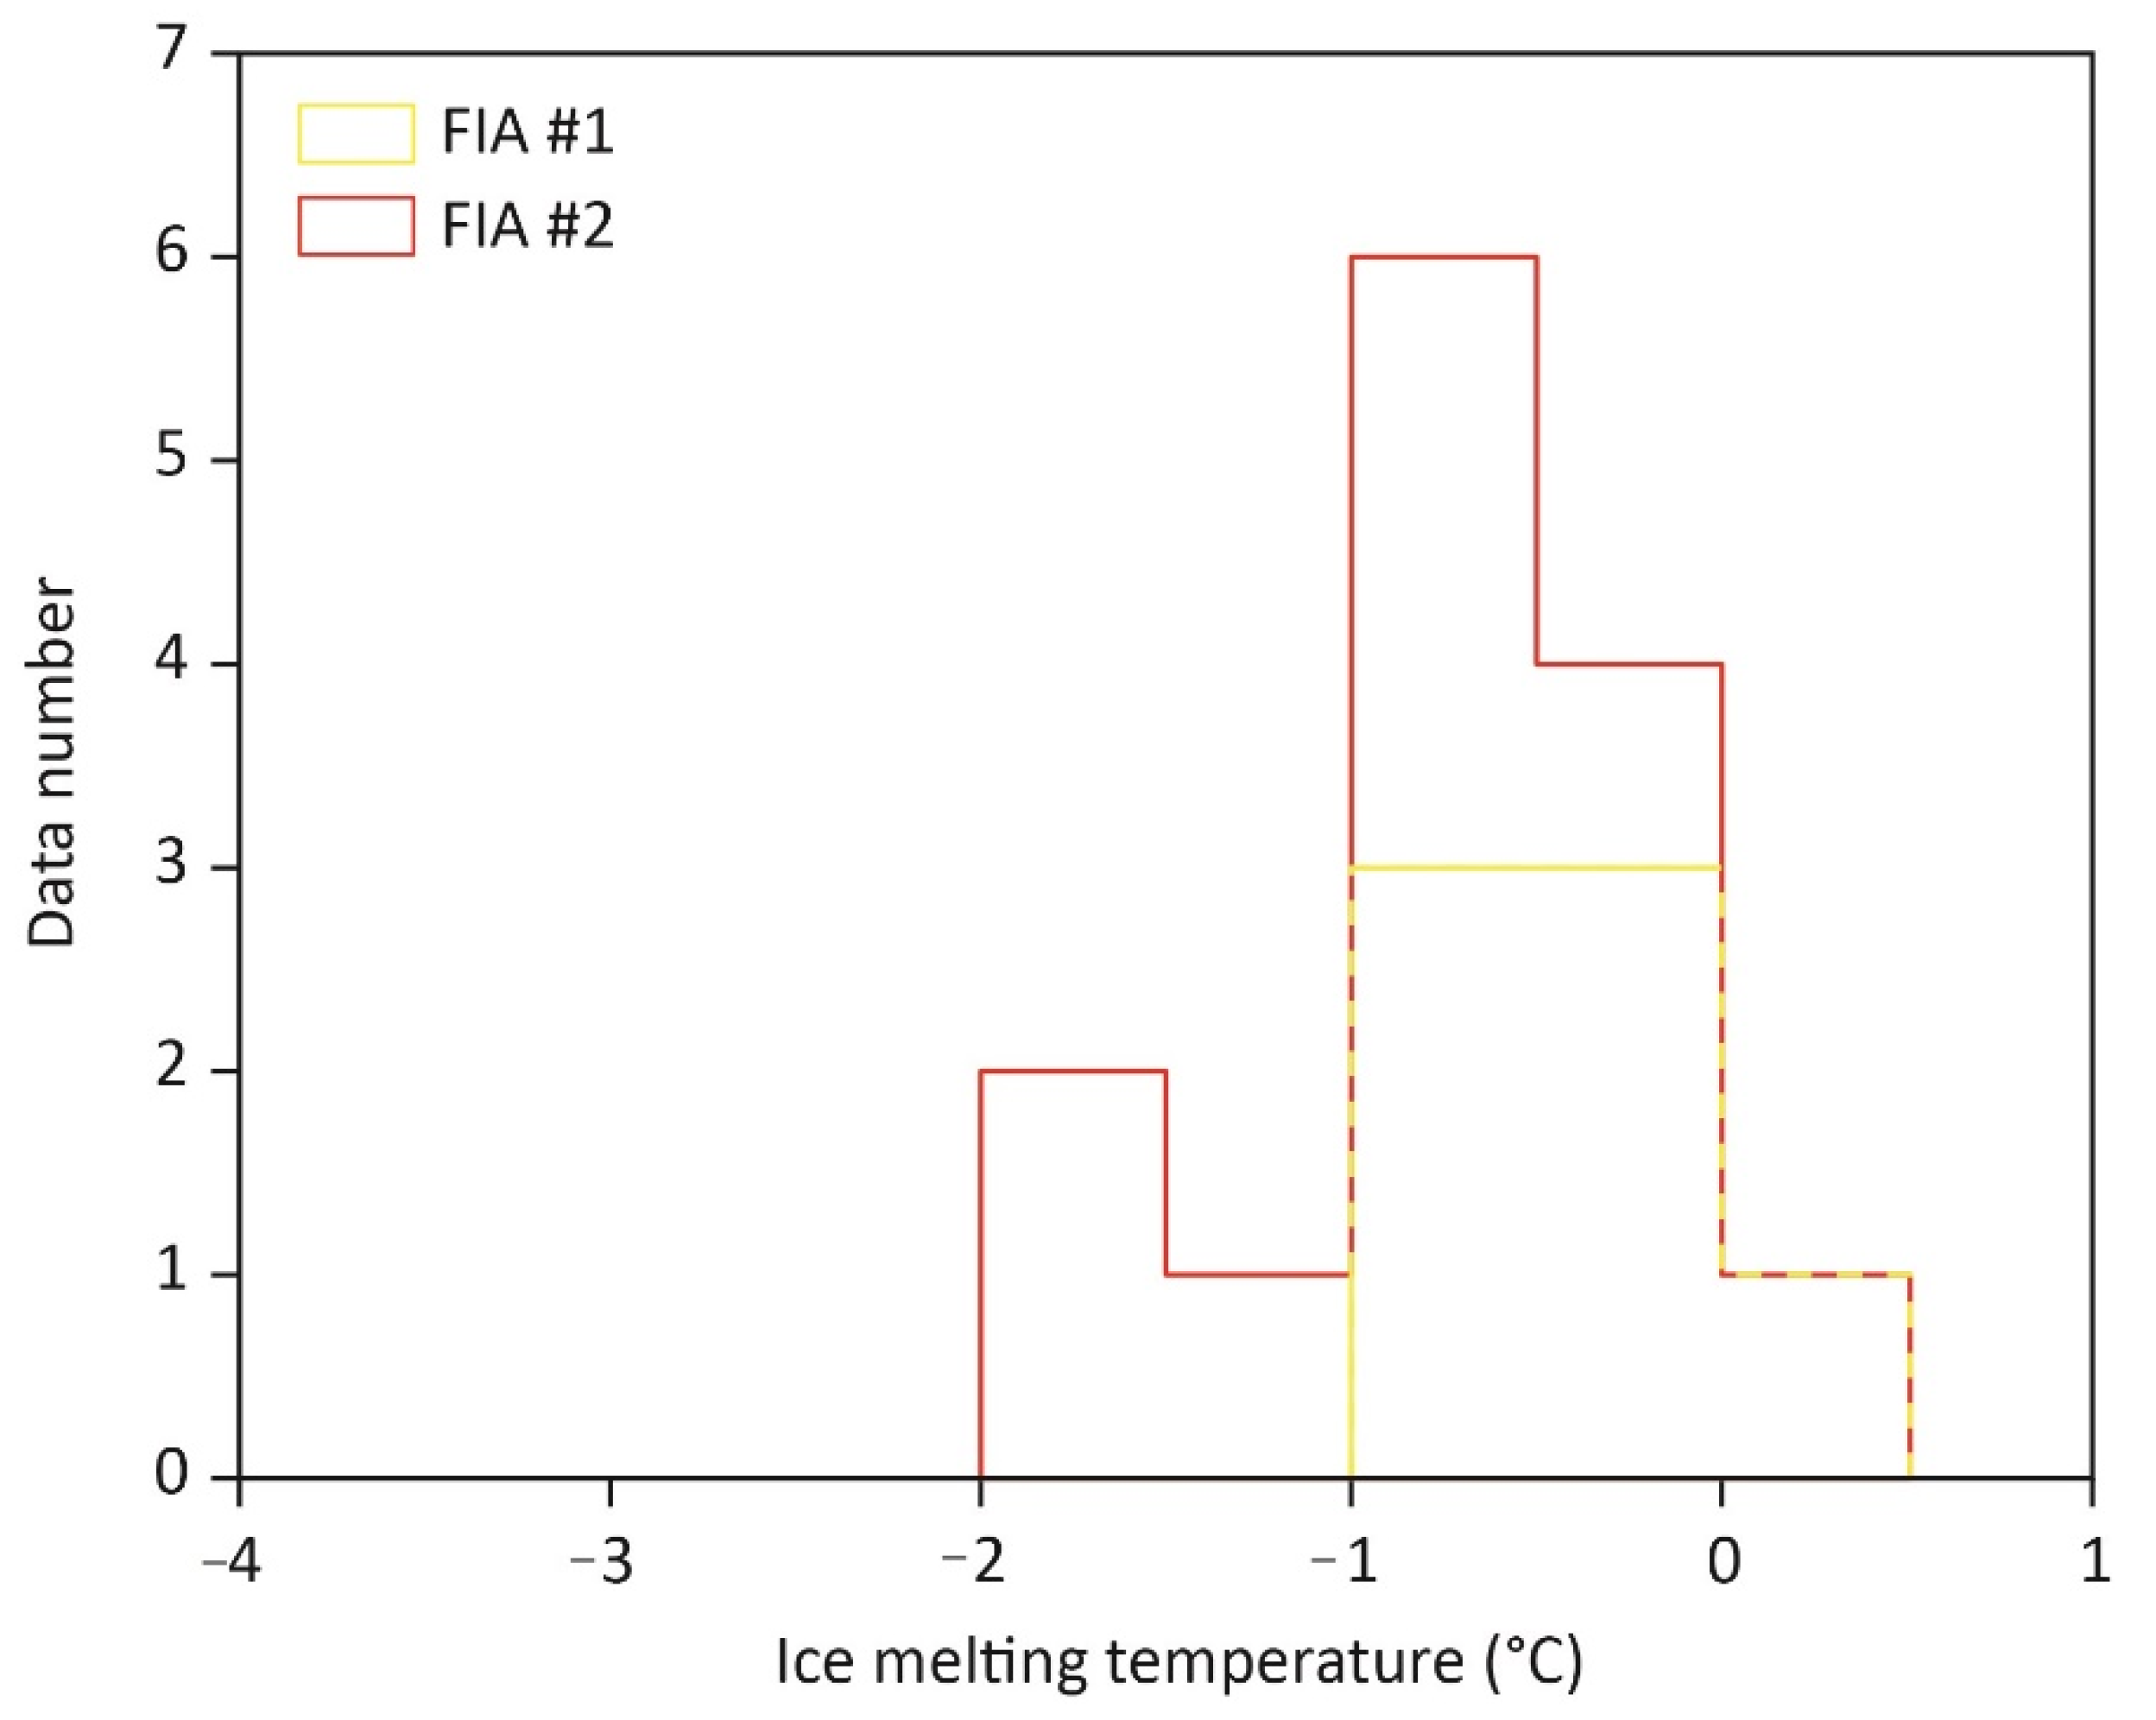
3.2. Fluid Inclusions

Fluid inclusions were observed in comb quartz crystals of the type 1 veinlets. The crystal cores generally present numerous FIs defining a cloudy aspect, whereas quartz borders are limpid and inclusions are scarce (Figure 8A). Detail examination shows that in crystal cores, inclusions are distributed along parallel tight alignments (Figure 8B) or as an unoriented cloud (Figure 8A). As the FI distribution can be related to growth of the crystal (concentric distribution, alignments perpendicular to the growth direction thus parallel to faces), these features indicate a primary origin [33]. FIs are very tiny, less than 5 µm in size and their shape is irregular, complex, often presenting necking down; they are therefore defined as immature [27]. At a FIA scale, defined as cluster inside the crystal core, FIs are predominantly one-phase and filled by liquid water. Very few inclusions present a vapour bubble at room temperature, sometimes rapidly moving (Figure 8B). The sample was stored one month in a deep freezer in order to try to bring about the nucleation of a vapour bubble during cooling. Additionally, inclusions were cooled down to −30 °C (just above the temperature of metastable water solidification) in the microthermometric stage and kept a few minutes at this temperature in order to induce bubble nucleation. All attempts (deep freezer and cooling down to −30 °C) were however unsuccessful.
Experiments were performed on the thin sections used for petrographic observations. Indeed, the very small size of inclusions requires the use of thinner sections that the thick ones classically used in fluid inclusion studies. After precise location and mapping of Fluid Inclusion Assemblages, the thin section was cut using a putty knife into fragments of about 1 cm2 in order to be introduced in the chamber of the microthermometric stage.
Ice melting temperatures (Tmi) were only measured in two-phase inclusions as Tmi can only be interpreted when at equilibrium with ice. Bubble nucleation in numerous inclusions was induced by inclusion freezing down to −50 °C, due to volume change and inclusion wall deformation during crystallization of ice. 17 values were kept in 2 distinct FIAs. All data lie in the range −1.6 to + 0.1 °C (Figure 9), with a mean value of −0.7 ± 0.5 °C. This corresponds to a value of salinity of 1.2 ± 0.8 wt% eq. NaCl.
Before any freezing run, the very rare two-phase inclusions (only 3) were heated in order to measure Th. Three values were obtained (58, 95 and 118 °C).

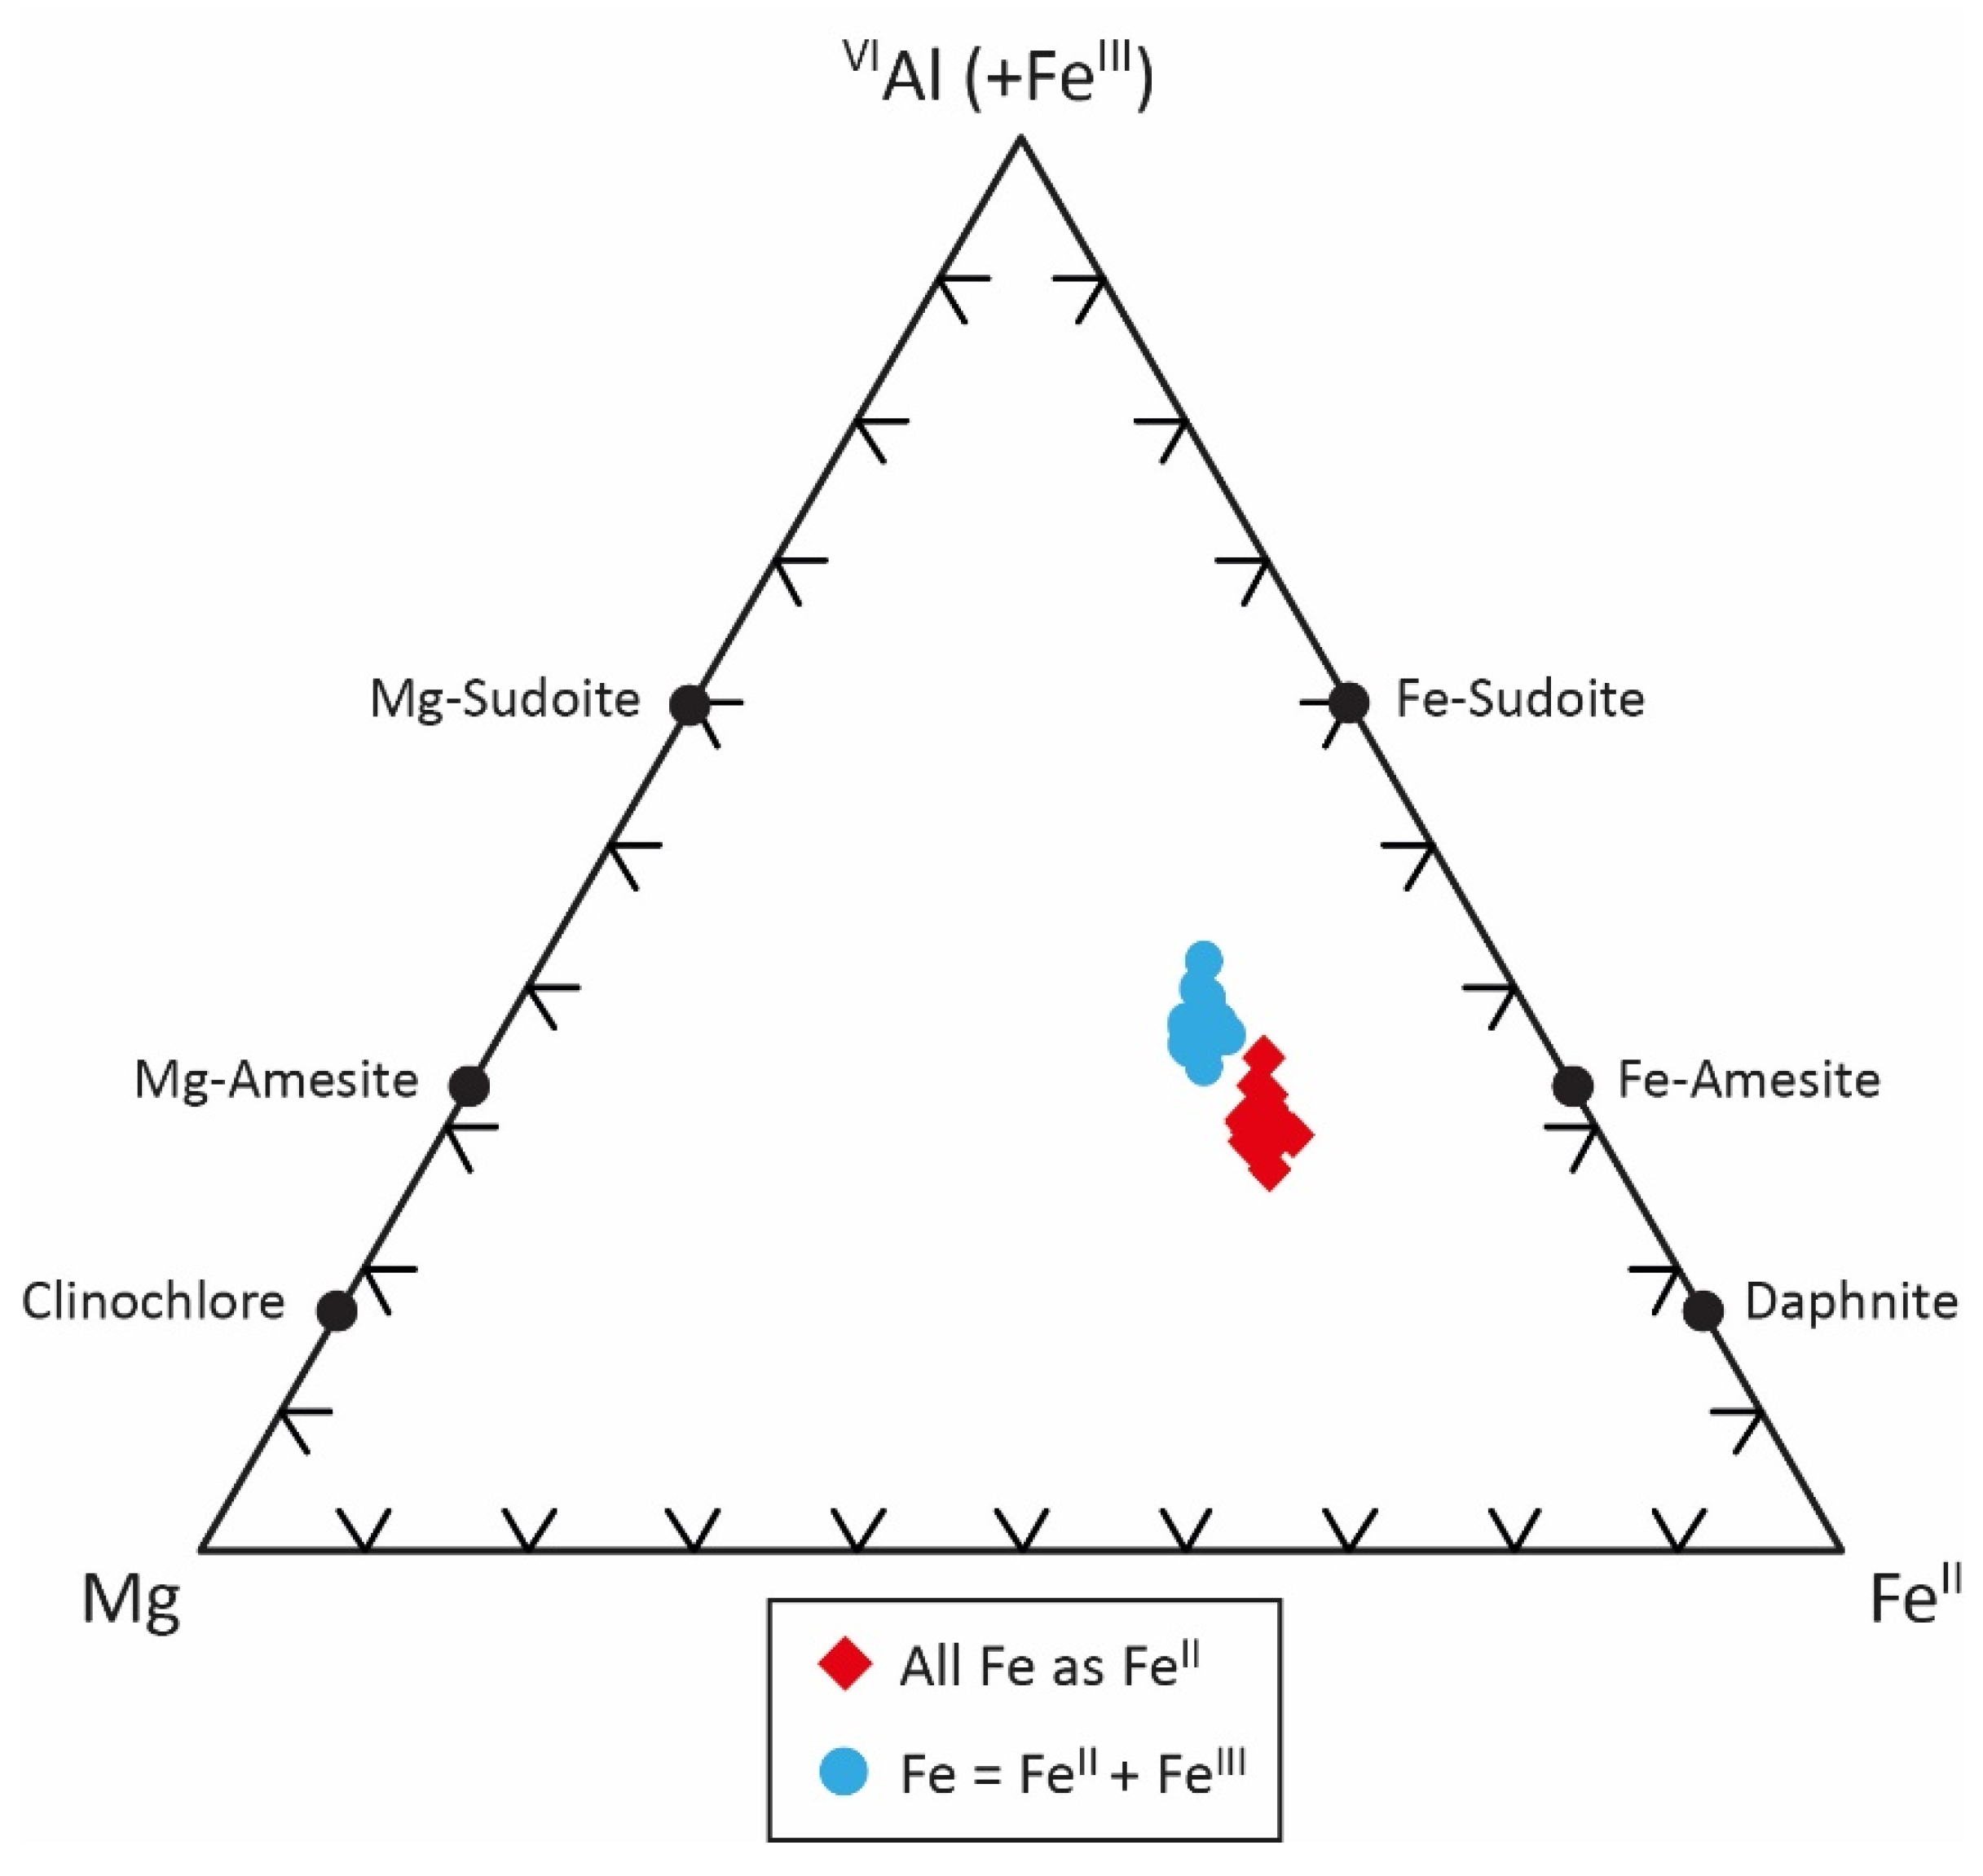
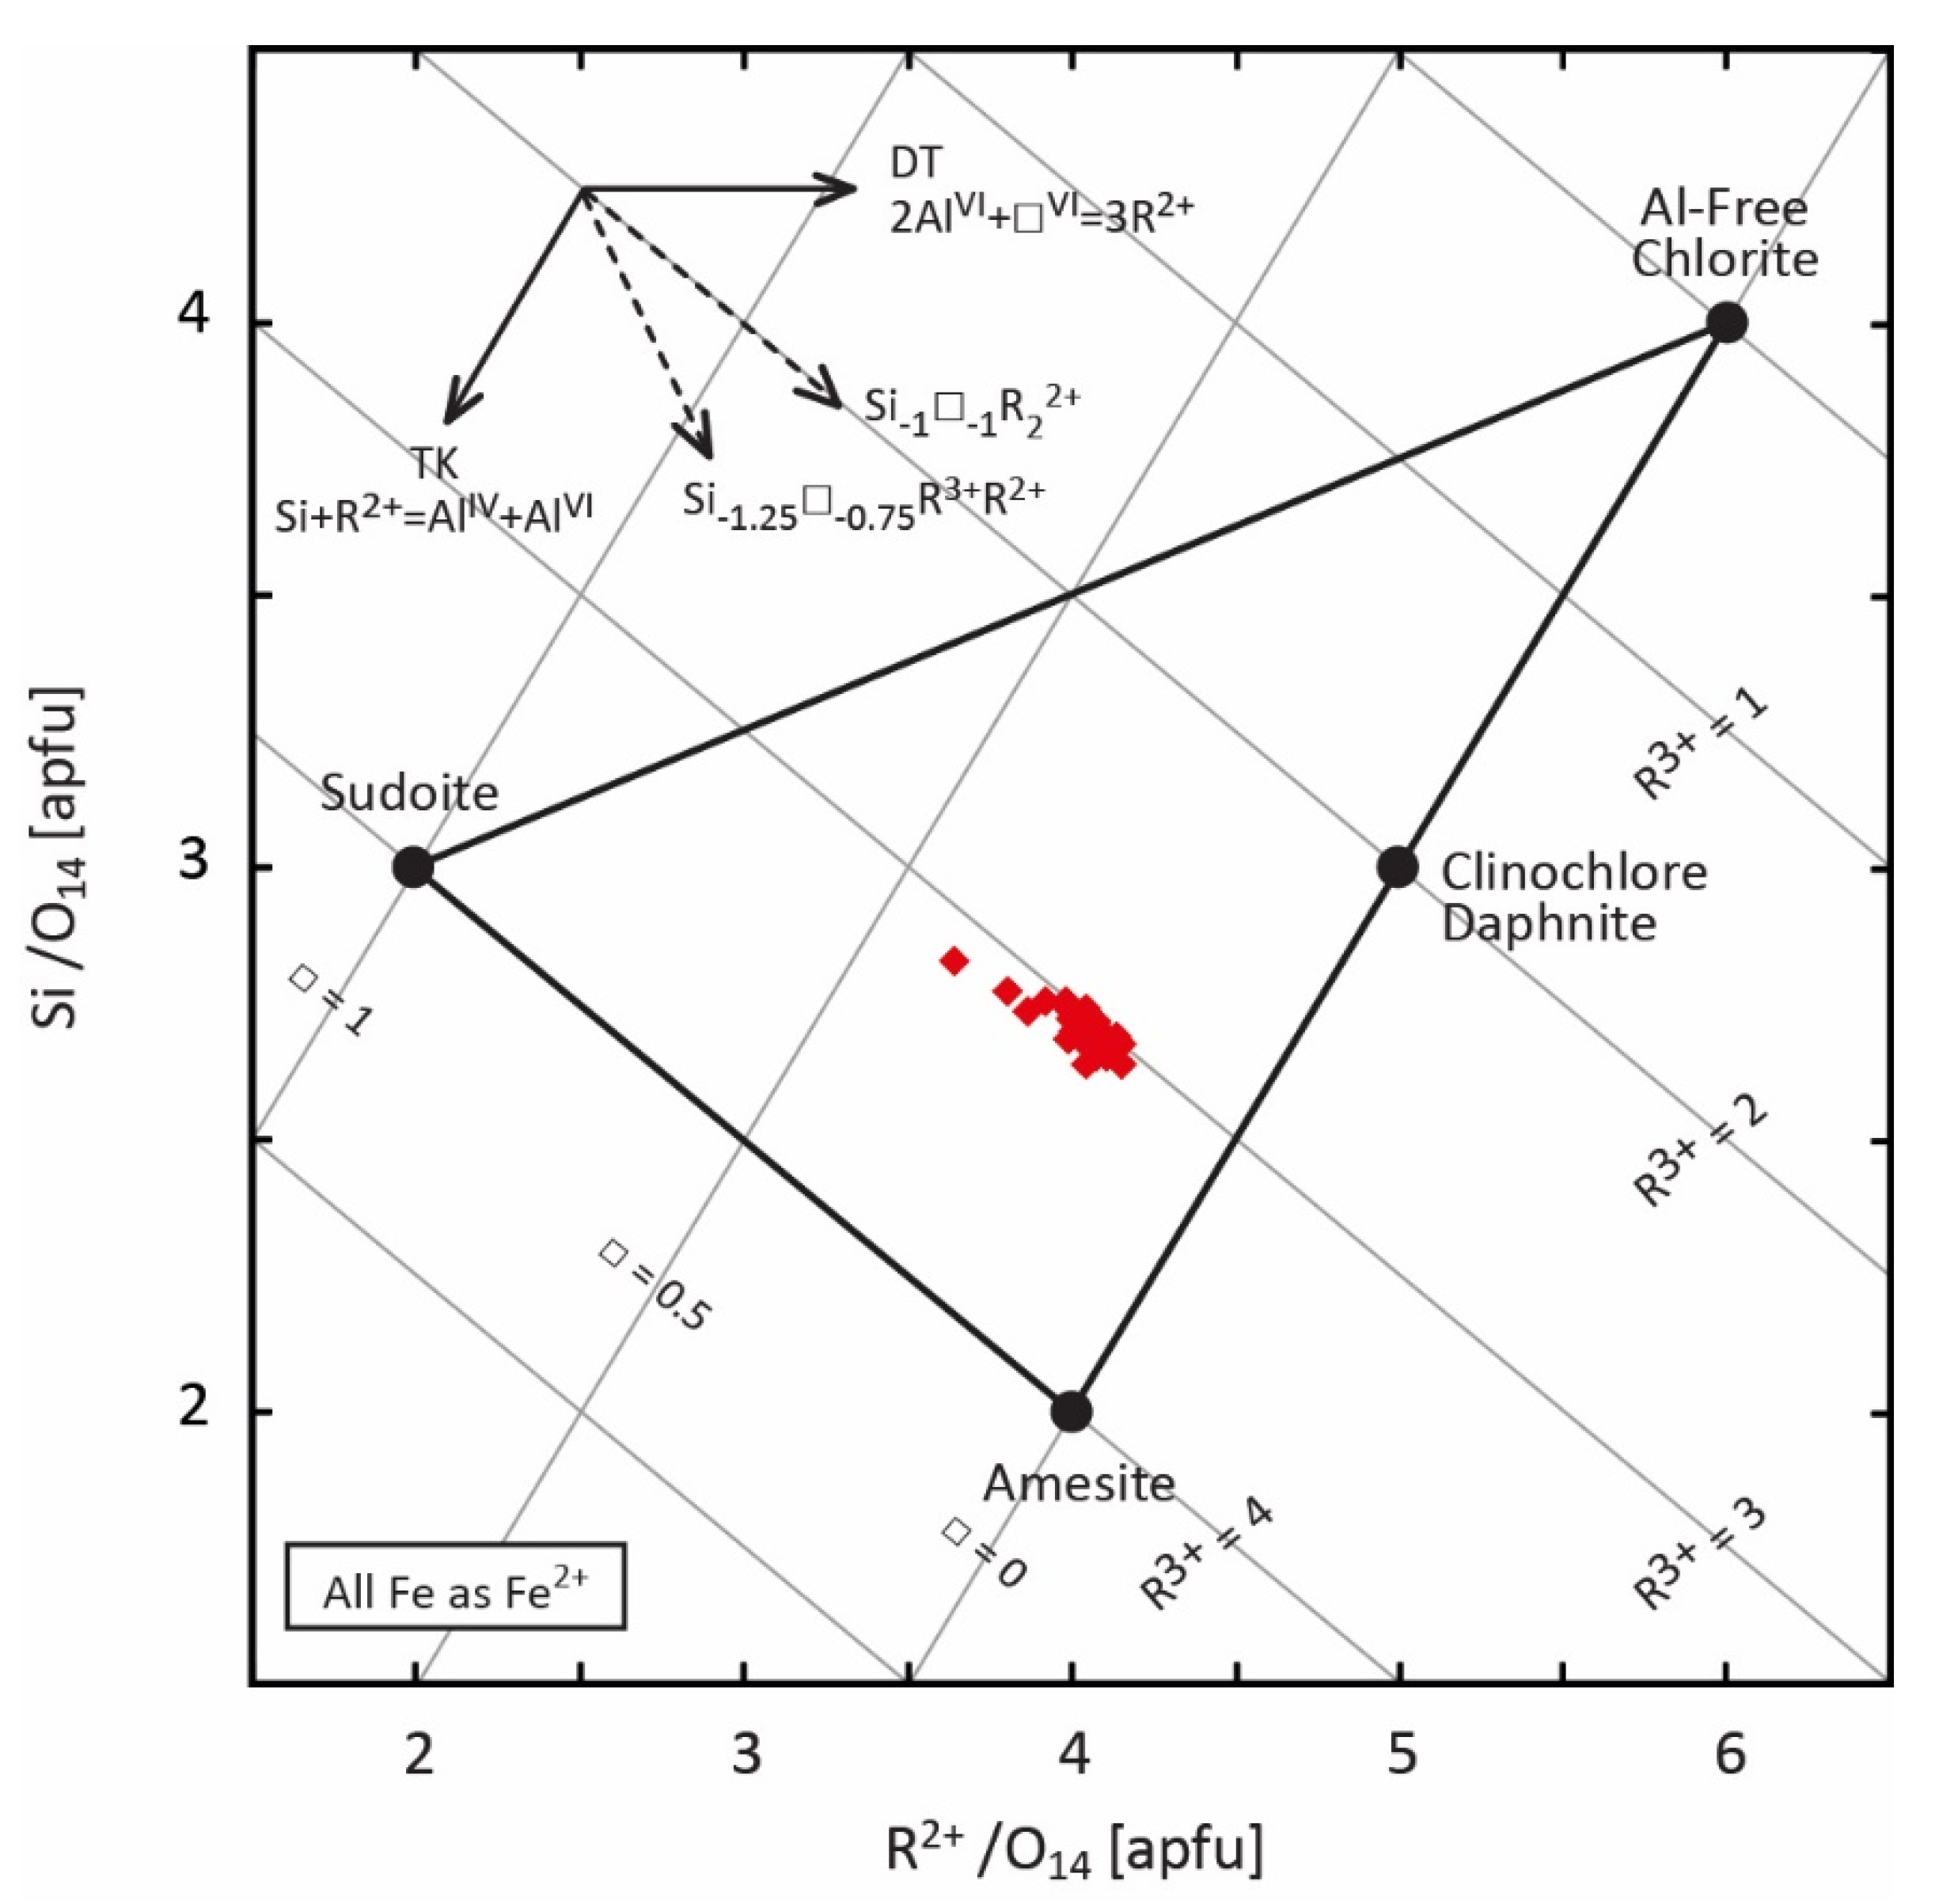
3.3. Chlorite Composition and Structure

3.3.1. SEM-EDX, EMPA and TEM-EDX Data

SEM-EDX, EMPA and TEM-EDX data were used to calculate the chlorite structural formulas on the basis of 14 O atoms per half formula unit (apfu). These data show the high homogeneity–at all scales–of the composition of the chlorite formed at the shale/vein interface (Table 1; Figure 10 and Figure 11). Si is quite substituted by Al, i.e., Si ~2.7 atoms per formula unit, underlining the impact of the Tchermak substitution from a Si-pure end-member. This chlorite approaches tri-trioctaedral characteristics, with an R3+ content (Figure 10 and Figure 11) around 30% of octahedral cations (~1.7 apfu), and consequently 70% of R2+ (~4 apfu), mainly–but not exclusively–due to the di-trioctahedral vector. The Fe/(Fe+Mg) ratio is high, ~0.7, bringing the composition of the considered chlorite between chamosite (daphnite) and Fe-amesite (Figure 10 and Figure 11).

3.3.2. XFe3+ Quantification by STXM-XANES on FIB-Section

Estimate of the chlorite Fe3+ content, i.e., the Fe3+/Fetotal ratio, was performed via STXM-XANES analysis, at the Fe L2,3-edges (Figure 12). STXM-XANES were carried out on a FIB section cutting across the kaolinite/chlorite interface (Figure 12B; location on Figure 4D,E). Fe L2,3-edge spectra display four major peaks, two for the L3-edge and noted L3-a (~708.7 eV) and L3-b (~710.2 eV), and two for the L2-edge and noted L2-a (~720 eV) and L2-b (~723.5 eV). L3-a and L2-a peaks are mainly affected by the Fe2+ content, while the L3-b and L2-b peaks are by the Fe3+ content (Figure 12A). Here, the estimation of Fe3+/Fetotal ratio is based on the calibrated L3-b/L3-a peak intensity ratio. Spectra were acquired on several areas of the FIB section, into the chlorite, symbolized by squares on the Figure 12C. Rescaled spectra are compared in the Figure 12A, and Fe3+/Fetotal ratio were calculated following the Bourdelle et al. [26] protocol. All spectra have a similar shape: a high L3-a peak and a small L3-b peak, indicating a ferrous phase. All Fe3+/Fetotal ratio estimates are around 14% +/−1, showing the homogeneity of the chlorite composition even at the nanoscale, from the contact with kaolinite to the contact with the shale. Combined with SEM-EDX, EMPA and TEM-EDX data, the mean structural formula for this chlorite is:
(FeII2.39Mg1.14)(FeIII0.42Al1.65)(Si2.67Al1.33)O10(OH)8.

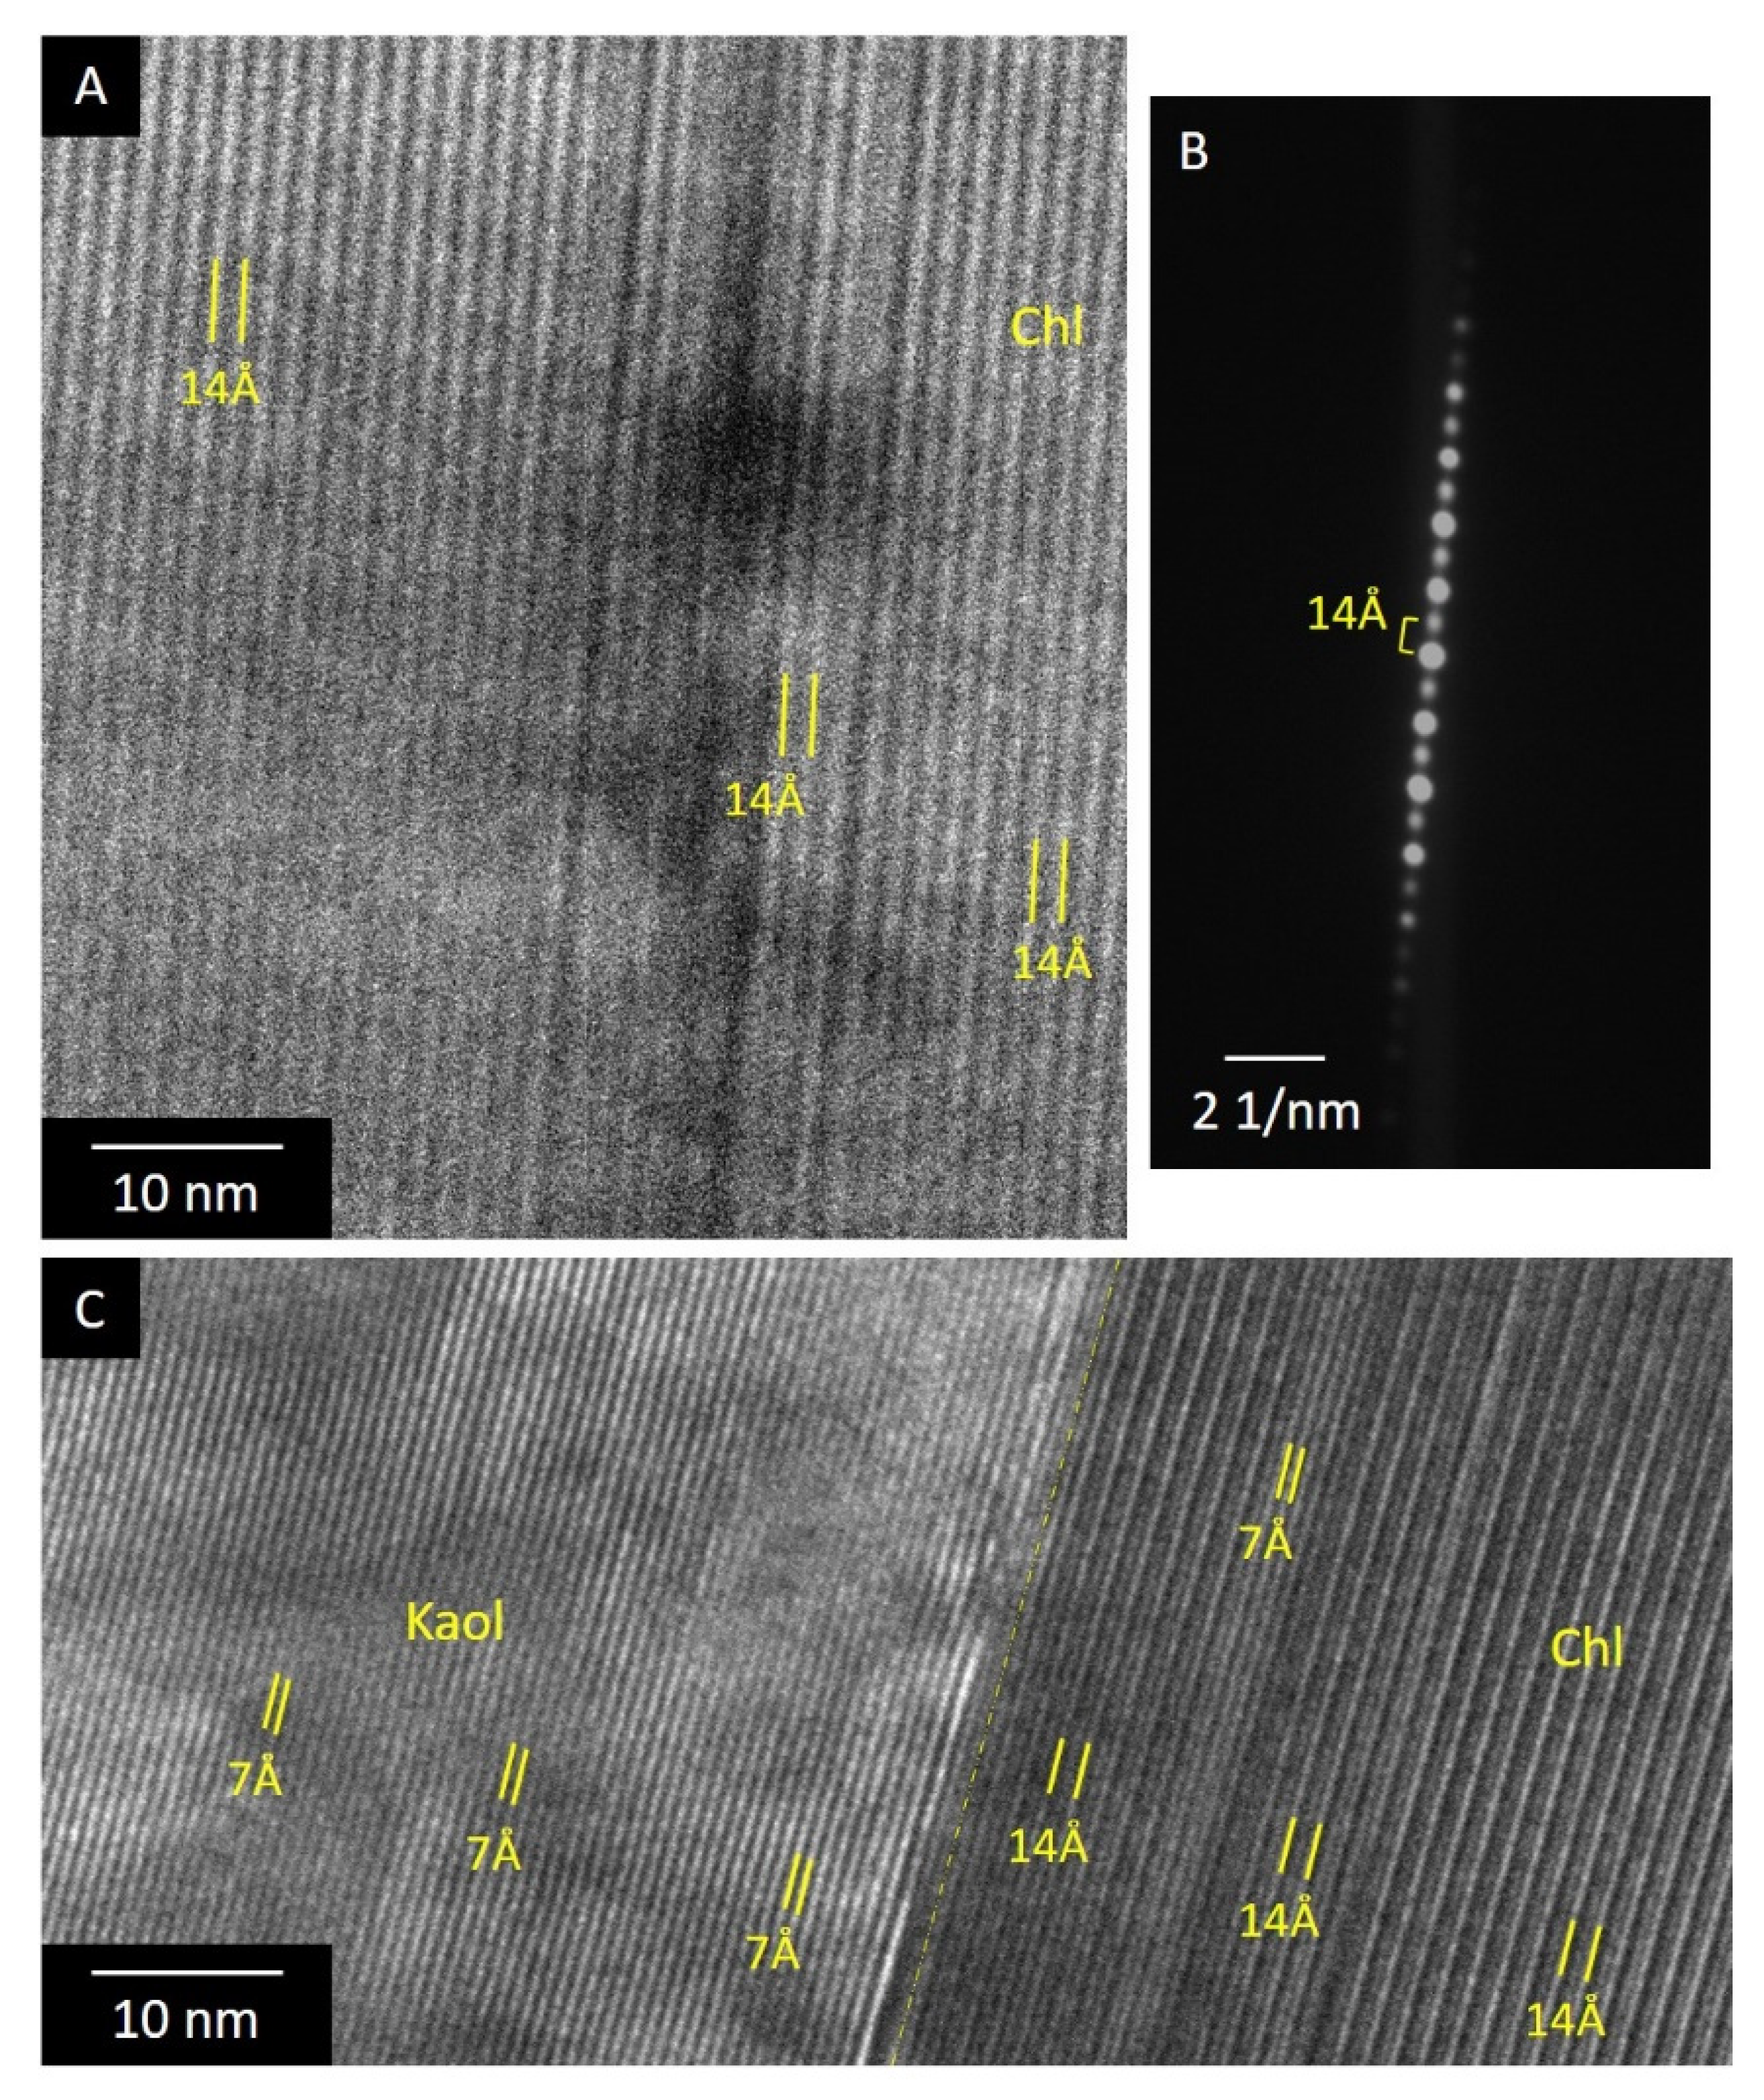
3.3.3. TEM Observations on FIB-Section

The nature of the phase was verified using TEM on the FIB section, by high-resolution images and electron diffraction on selected area. The chlorite fringe was specifically observed to ensure a 14 Å structure, and not a 7 Å structure. Therefore, a 14 Å layer structure is clearly identified, as well as by high-resolution observation than by electron diffraction (Figure 13A,B). The layered structure is regular, with very rare 7 Å layers which present the same composition (in term of Si, Al, Fe, Mg contents and Fe3+/Fetotal ratio) as the 14 Å layers (Figure 13C). These berthierine-like layers visually represent less than 10% of the structure. In the same way, the platy crystallites of kaolinite have a regular, free from any defect, 7 Å layer structure (Figure 13C). Although kaolinite and chlorite sometimes form intergrowths at the micrometric scale (as on Figure 6C), the interface between the two phases at the nanoscale is clear, there is no continuity observed between kaolinite and chlorite layers whatever the orientation of the crystallites, and no chemical zonation on either side of the interface. The kaolinite composition was checked by EMPA and TEM-EDX, confirming a pure kaolinite without compositional variation (Table 2).

4. Discussion

4.1. Kaolinite Precipitation

The presence of authigenic kaolinite in sandstones or shales is often the result of an early alteration of detrital material, as feldspar or mica (e.g., [35]), due to meteoric flushing in an open system, sometimes favored by acidic fluids (CO2 or organic acid). In the present case, authigenic kaolinite is quite rare in the shale, but is one of the main phases filling the fractures–in association with quartz. The kaolinite morphology and location suggest direct precipitation from solutions [36], especially since these fractures constitute preferential paths for fluid circulation. In this way, the rock structure indicates that the veinlet formation is due to hydraulic fracturing (fluid-assisted brecciating). The chronological sequence was probably (i) a first quartz generation with a comb texture, (ii) a second quartz generation, represented by euhedral crystals, at the veinlet center, (iii) the precipitation of kaolinite (and locally carbonate like ankerite) in residual voids as well as in thin veinlet crosscutting all previous structures.
All these veins testify to the circulation of an aqueous fluid, confirmed by the presence of nearly pure water fluid inclusions. The fluid was probably charged in elements from the weathering and leaching of feldspar and/or mica at shallow depth/very low temperature before migrating to the depth. The feldspar and/or mica alteration provided the sufficient quantity of Si and Al, but also gave amounts of K and Na. The large fractures in the shale, in addition to facilitate the fluid circulation, led to local high water/rock ratio and fluid flow rates [37], sufficient to remove or to lower the concentration of K and Na, and to make Al mobile. In this way, the salinity determined from the Tmi for fluid inclusions is very low (1.2 ± 0.8 wt% eq. NaCl). Therefore, the system presented here favors the movement of the Si and Al ions to lead to the precipitation of quartz and kaolinite rather than illite.
Boles and Franks [38], also observing veins of coexisting kaolinite and quartz across sandstone and shale in the Eocene Wilcox formation (Texas Gulf Coast, TX, USA), estimate that the process of kaolinite formation occurs at T < 170 °C, beyond that, kaolinite is progressively less abundant. Here, fluid inclusions are mainly one-phase. The coexistence of one-phase and rare two-phase inclusions in a given FIA indicates a low formation temperature, probably less than 50 °C [28]. Indeed, one-phase inclusions are typical of low-temperature environments because metastability in this case prevents the nucleation of the vapor bubble. Moreover, fluid inclusions do not present any clues allowing to consider a subsequent significant increase in the temperature. Consequently, the observed kaolinite was formed at T < 100 °C, and probably T < 50 °C. This is in agreement with the literature reporting the kaolinite formation temperature in sedimentary rocks (e.g., [39]).

4.2. Mechanisms of Kaolinite-to-Chlorite Conversion

Two major mechanisms are involved in the conversion of a precursor into chlorite: the solid-state transformation (SST) and the dissolution-crystallization (DC). In the first case, the precursor is gradually replaced by chlorite from layers to layers in a topotactic transformation. This mechanism leads to a conservation of the volume, the shape and the size of the precursor crystallites. In the second case, the precursor is dissolved to a great extent, and chlorite nucleates and growths as epitaxial or separate crystallites [40]. In this way, the characteristics of the precursor plates, as shape or volume, are lost, and the reaction can involve important changes in chemistry and crystal texture. In our case, chlorite formed at the kaolinite/shale contact does not retain any property of the kaolinite precursor. Indeed, there is no continuity between chlorite and kaolinite crystallites, no relict of kaolinite layers in the chlorite structure, and the chlorite seems to grow as epitaxial crystallites on shale surface toward the kaolinite, at the expense of the latter. It is the same for the observed berthierine-like layers, which do not have the characteristics allowing to consider a transformation of kaolinite into berthierine by SST. So, all structural observations indicate that the kaolinite-to-chlorite conversion involves at least one dissolution-crystallization step.
In Al-rich systems, the kaolinite is transformed into sudoite (a di-trioctahedral MgAl-chlorite) via tosudite (a 1:1 regularly interstratified chlorite-smectite) as an intermediate phase of a conversion series [17]. This conversion may be through stepwise mineral reactions with DC as the main mechanism. In the present case, the kaolinite conversion occurs in a Fe-rich system, but similarly, kaolinite seems to be replaced by Fe-rich tri-trioctahedral-like chlorite via DC. This kind of kaolinite-Fe-rich chlorite assemblage was already observed in less ancient rocks, e.g., in Oligocene until recent sediments of Gulf Coast by Boles and Franks [38] and Burton et al. [21], or in Jurassic sandstones of the Moezian Platform (Northern Bulgaria) by Hrischeva and Gier [36], but indication for a kaolinite dissolution–chlorite replacement was not clear. Boles and Franks [38] highlighted a decrease in kaolinite amount with depth in the Gulf Coast basin in Texas and a counter-variation of the Fe-chlorite amount, and consequently suggested that kaolinite dissolves in favor of chlorite, unfortunately without petrographic evidence. Burton et al. [21], also studying Gulf Coast samples, confirms their hypothesis observing lamellar intermixture of kaolinite and chlorite, and proposed a kaolinite-to-chlorite conversion via berthierine as an intermediate phase. Here, several berthierine-like layers, or small stacks of 7 Å layers, were indeed found in the chlorite phase. Even if these types of chlorite isochemical 7 Å layers are in a very low number, they could be considered as relics of a berthierine-to-chlorite conversion which is almost complete. Berthierine was previously reported in hydrothermally altered shales [41], sandstones (e.g., [42]), arenites [43], or in Palaeogene and Triassic coal measures [44], but the coupling of kaolinite-to-berthierine and berthierine-to-chlorite conversions is in debate. Iljima and Matsumoto [44] argue that all the kaolinite-to-chlorite conversion process occurs by DC transformations: as a first step, kaolinite and siderite reacted to form berthierine, and as a second step, berthierine is converted into chlorite via DC since the two minerals present different chemical compositions. In the same way, Aagaard et al. [42], from the study of experimental and natural samples (in clastic quartz-rich sandstones), claim that chamosite formation from berthierine involved DC, with a chemical composition evolution between the two phases. On the other hand, SST transformation is the process privileged by many authors for various berthierine-to-chlorite conversion contexts (e.g., [45,46,47,48,49,50,51,52]). This hypothesis is often supported by the interpretation of polytype modifications or High-resolution TEM images showing intercalation of 7 Å layers and 14 Å layers. Especially, Banfield and Bailey [48], Xu and Veblen [51] and Ryan and Reynolds [49] suggest a SST mechanism of berthierine-to-chlorite conversion by inversion of half of the tetrahedral layers, i.e., from a TO TO to a TOT O structure. In the present study, the 7 Å layers are few in number, dispersed as small stacks in chlorite domains, and have compositions identical to the 14 Å layers, making two approaches conceivable:
(i)
either the dissolution of the kaolinite and the crystallization of berthierine, followed by an advanced chloritization of the berthierine via SST,
(ii)
or the dissolution of the kaolinite, and the direct crystallization of a chlorite containing isochemical 7 Å layers as defects.
Since the 14 Å layers are the predominant components, it does not seem possible to decide in favor of either of the hypotheses. However, Inoue and Kogure [53], studying chlorite crystallites from quartz veins of epithermal to xenothermal vein-type ore deposits (Japan), propose that the direct precipitation of chlorite containing 7 Å layers actually corresponds to the neoformation of a 7/14 Å interstratification phase enriched in 14 Å layers. In this case, the authors suggest that the proportion of 7 Å layers is driven by the Fe content and the Fe/(Fe + Mg) ratio. For Arakawa chlorites, which present the same chemical characteristics that the chlorite in the present study in term of Si content, Fe content, Fe/(Fe + Mg) ratio, chemical homogeneity of the 7/14 Å layers, and electron diffraction patterns, Inoue and Kogure [53] determined by HRTEM a proportion of 7 Å layers around 8%. TEM observations made in the present study are in agreement with those of [53], supporting the hypothesis of direct precipitation of chlorite in its most stable form, interlaying with infrequent metastable 7 Å layers observed only very locally.

4.3. Conditions of Chlorite Formation

The transformation of the kaolinite in a clay mineral of “higher” temperature like chlorite was probably triggered by a change in the P-T conditions of the system and/or an increase of Fe,Mg content in the pore-fluid. An increase of the temperature coupled with an increase of iron availability, either due to the burial (with contribution of pore-fluid) or by the circulation of fluids, can explain the dissolution of the kaolinite and the formation of a Fe-rich chlorite. From petrographic observations, this process was only made possible by the contribution of the shale, which provided Fe and Mg, and by the kaolinite as parental mineral. This explains why Fe-rich chlorite is rarely observed at the quartzvein/shale contact or elsewhere in the rock excepted in some pockets of kaolinite/chlorite in the shale porosity. The phases in the shale likely to provide Fe and Mg supply are pyrite, oxides and detrital ferromagnesian minerals, by dissolution and/or transformation (as illitization of smectite). Therefore, the system represented by the kaolinite/shale contact has favored, beyond any effect of kinetics, as:
kaolinite + 5.7 Fe2+shale + 2.3 Mgshale + 10 H2O = 2 chlorite + 0.25 SiO2 + 16 H+
This type of reaction releases a small amount of silicon and consumes a considerable amount of water. However, the Fe and Mg-two elements deemed to be mobile-transfer seems to be limited, i.e., operates only on short distance, since the kaolinite is largely preserved and is often transformed only over a 20 µm wide fringe near the shale. It is permissible to consider that the chlorite, after needing Fe and Mg from the shale to nucleate and growth, formed a fringe wide and homogeneous enough to reduce the local permeability and to prevent Fe and Mg circulation to the kaolinite further in the vein, to keep kaolinite away from the shale and to stop the reaction. Sometimes, the element or fluid supply is not even enough to reach the fringe step, and only sparse chlorite hairs are formed. The mineral reaction and the new equilibrium are therefore very localized on the vein rims, testifying to a very small-scale system. The high homogeneity of chlorite composition (structural formula and Fe3+/Fetotal ratio) despite the large extent of the reaction front, argues in favor of either a rapid mineralogical reaction, or of P-T-X conditions that have been maintained for a time, while the high Fe content, the high Fe/(Fe + Mg) ratio and the relatively low Fe3+/Fetotal ratio (14%) of neoformed chlorite suggest reducing conditions. In fact, this chlorite formation only recorded one event of condition changes, since chlorite composition did not reequilibrated afterwards.
The mineral sequence from the literature is roughly kaolinite → berthierine → chlorite with increasing temperature. In the scenario of successive kaolinite-to-berthierine–berthierine-to-chlorite conversions, via DC and SST respectively, the first conversion probably occurs between 50 and 100 °C, according to the P-T-X context. Iljima and Matsumoto [44], studying diagenetic mineral reactions in coal measures, argue that kaolinite-siderite reaction leads to the formation of berthierine between 65 and 130 °C. In arenites, Velde et al. [43] suggest that the kaolinite-to-berthierine conversion takes place up to ~100 °C, similarly to Jahren and Aagaard [54] in clastic reservoir. The rest of the chloritization process, involving a berthierine-to-chlorite conversion via SST or DC, is often reported between 70 and 200 °C, as during burial diagenesis of shales and sands [38,42,44,46,54,55]. Considering a DC mechanism for this conversion, Iljima and Matsumoto [44] found chamosite from 160 °C, while Aagaard et al. [42] envisage that the transition is around 90–100 °C in natural environments.
In the scenario based on Inoue and Kogure [53], the chlorite-containing few 7 Å layers-precipitates directly from kaolinite dissolution fluid, at a temperature which can exceed 190 °C. Without invalidating the precursor character of berthierine in the chloritization process during burial diagenesis, Inoue and Kogure [53] suggest the possibility that berthierine is formed as a metastable phase from solutions at the same time as Fe-rich chlorite, which widens the range of possible temperatures of formation insofar as the berthierine content does not depend on it but on the Fe content. Although (i) the study of Inoue and Kogure [53] does not include low-temperature samples and (ii) the samples studied here do not come from hydrothermal ore deposits like those observed by Inoue and Kogure [53], chlorites described here also precipitate in quartz veins, and also show a high-homogeneous composition. Therefore, a similar direct DC conversion, but at T < 190 °C, of kaolinite into chlorite containing few metastable 7 Å layers is quite possible.

5. Conclusions

Here, we report the formation of Fe-rich chlorite as the result of an interaction between a black shale supplying Fe, Mg and large kaolinite areas formed from a Si,Al-rich fluid, like a small size system leading to a noteworthy mineralogical reaction front. The chloritization of the kaolinite begins with its dissolution, followed by the precipitation either of a chlorite-rich/berthierine-poor mix, or the precipitation of berthierine as intermediate phase. In this last case, a second step—berthierine-to-chlorite conversion—is required, probably through a solid state mechanism given the isochemistry of the observed 14 and 7 Å layers. The first hypothesis, suggests by Inoue and Kogure [53], signifies that the conversion is driven by the local P-T-X conditions, especially the Fe/(Fe+Mg) ratio and eventually the redox conditions, while the second hypothesis rather call to kinetic factors. Although we cannot totally exclude the second hypothesis, the first one is in our favor since we have found only few berthierine layers, and not clearly observed any signs of sheet-to-sheet transformation of berthierine into chlorite. This kaolinite-to-chlorite conversion occurs here at a very localized scale, under specific conditions such as a low-T, an interstitial fluid as transfer vector of Fe and Mg and reducing conditions.

Author Contributions

Conceptualization, F.B., M.D., E.L., and C.D.; analysis, F.B., M.D., E.L., C.D., A.A., S.B., S.V., and P.R.; writing—original draft preparation, F.B.; writing—review and editing, F.B., M.D., E.L., and C.D.; project administration, F.B.; funding acquisition, F.B and E.L. All authors have read and agreed to the published version of the manuscript.

Funding

This research was funded by Centre National de la Recherche Scientifique (CNRS), France, INSU TelluS SYSTER program, and by Agence Nationale de la Recherche (ANR), France, JCJC ENTRESOL project, and LGCgE funding.

Data Availability Statement

On request from Franck Bourdelle.

Acknowledgments

We acknowledge four anonymous reviewers and the editor for their constructive comments. We are most grateful to the PSI SLS synchrotron, especially Benjamin Watts (PolLux beamline) for technical advice, and to UMET Laboratory (University of Lille). The TEM national facility at Institut Chevreul (Lille, France) is supported by the Conseil Régional du Nord-Pas de Calais, the European Regional Development Fund (ERDF), and the Institut National des Sciences de l’Univers (INSU, CNRS). Thanks are also extended to David Troadec and IEMN (Cité Scientifique, av. Poincaré CS 60069, 59652 Villeneuve d’Ascq Cedex). This study was carried out with the gracious assistance of the Département du Nord.

Conflicts of Interest

The authors declare no conflict of interest.

References

  1. Hillier, S.; Velde, B. Octahedral Occupancy and the Chemical-Composition of Diagenetic (Low-Temperature) Chlorites. Clay Miner. 1991, 26, 149–168. [Google Scholar] [CrossRef]
  2. Vidal, O.; Lanari, P.; Munoz, M.; Bourdelle, F.; De Andrade, V. Deciphering Temperature, Pressure and Oxygen-Activity Conditions of Chlorite Formation. Clay Miner. 2016, 51, 615–633. [Google Scholar] [CrossRef] [Green Version]
  3. Bourdelle, F.; Cathelineau, M. Low-Temperature Chlorite Geothermometry: A Graphical Representation Based on a T-R2+-Si Diagram. Eur. J. Mineral. 2015, 27, 617–626. [Google Scholar] [CrossRef]
  4. Cathelineau, M. Cation Site Occupancy in Chlorites and Illites as a Function of Temperature. Clay Miner. 1988, 23, 471–485. [Google Scholar] [CrossRef]
  5. Vidal, O.; Parra, T.; Trotet, F. A Thermodynamic Model for Fe-Mg Aluminous Chlorite Using Data from Phase Equilibrium Experiments and Natural Pelitic Assemblages in the 100 Degrees to 600 Degrees C, 1 to 25 Kb Range. Am. J. Sci. 2001, 301, 557–592. [Google Scholar] [CrossRef] [Green Version]
  6. Vidal, O.; Parra, T.; Vieillard, P. Thermodynamic Properties of the Tschermak Solid Solution in Fe-Chlorite: Application to Natural Examples and Possible Role of Oxidation. Am. Mineral. 2005, 90, 347–358. [Google Scholar] [CrossRef]
  7. Vidal, O.; De Andrade, V.; Lewin, E.; Munoz, M.; Parra, T.; Pascarelli, S. P-T-Deformation-Fe3+/Fe2+ Mapping at the Thin Section Scale and Comparison with XANES Mapping: Application to a Garnet-Bearing Metapelite from the Sambagawa Metamorphic Belt (Japan). J. Metamorph. Geol. 2006, 24, 669–683. [Google Scholar] [CrossRef]
  8. Bourdelle, F.; Parra, T.; Chopin, C.; Beyssac, O. A New Chlorite Geothermometer for Diagenetic to Low-Grade Metamorphic Conditions. Contrib. Mineral. Petrol. 2013, 165, 723–735. [Google Scholar] [CrossRef]
  9. Lanari, P.; Wagner, T.; Vidal, O. A Thermodynamic Model for Di-Trioctahedral Chlorite from Experimental and Natural Data in the System MgO-FeO-Al2O3- SiO2-H2O: Applications to P-T Sections and Geothermometry. Contrib. Mineral. Petrol. 2014, 167, 968. [Google Scholar] [CrossRef] [Green Version]
  10. Inoue, A.; Meunier, A.; Patrier-Mas, P.; Rigault, C.; Beaufort, D.; Vieillard, P. Application of Chemical Geothermometry to Low-Temperature Trioctahedral Chlorites. Clays Clay Miner. 2009, 57, 371–382. [Google Scholar] [CrossRef]
  11. Inoue, A.; Inoue, S.; Utada, M. Application of Chlorite Thermometry to Estimation of Formation Temperature and Redox Conditions. Clay Miner. 2018, 53, 143–158. [Google Scholar] [CrossRef]
  12. Bourdelle, F. Low-Temperature Chlorite Geothermometry and Related Recent Analytical Advances: A Review. Minerals 2021, 11, 130. [Google Scholar] [CrossRef]
  13. de Caritat, P.; Hutcheon, I.; Walshe, J. Chlorite Geothermometry—A Review. Clays Clay Miner. 1993, 41, 219–239. [Google Scholar] [CrossRef]
  14. Essene, E.J.; Peacor, D.R. Clay Mineral Thermometry—A Critical Perspective. Clays Clay Miner. 1995, 43, 540–553. [Google Scholar] [CrossRef]
  15. Beaufort, D.; Rigault, C.; Billon, S.; Billault, V.; Inoue, A.; Inoue, S.; Patrier, P. Chlorite and Chloritization Processes through Mixed-Layer Mineral Series in Low Temperature Geological Systems A—Review. Clay Miner. 2015, 50, 497–523. [Google Scholar] [CrossRef]
  16. Jiang, W.; Peacor, D.; Buseck, P. Chlorite Geothermometry—Contamination and Apparent Octahedral Vacancies. Clays Clay Miner. 1994, 42, 593–605. [Google Scholar] [CrossRef]
  17. Hillier, S.; Wilson, M.J.; Merriman, R.J. Clay Mineralogy of the Old Red Sandstone and Devonian Sedimentary Rocks of Wales, Scotland and England. Clay Miner. 2006, 41, 433–471. [Google Scholar] [CrossRef]
  18. Ryan, P.C.; Reynolds, R.C. The Chemical Composition of Serpentine/Chlorite in the Tuscaloosa Formation, United States Gulf Coast: EDX vs. XRD Determinations, Implications for Mineralogic Reactions and the Origin of Anatase. Clays Clay Miner. 1997, 45, 339–352. [Google Scholar] [CrossRef]
  19. Mosser-Ruck, R.; Pignatelli, I.; Bourdelle, F.; Abdelmoula, M.; Barres, O.; Guillaume, D.; Charpentier, D.; Rousset, D.; Cathelineau, M.; Michau, N. Contribution of Long-Term Hydrothermal Experiments for Understanding the Smectite-to-Chlorite Conversion in Geological Environments. Contrib. Mineral. Petrol. 2016, 171, 97. [Google Scholar] [CrossRef]
  20. Biernacka, J. Pore-Lining Sudoite in Rotliegend Sandstones from the Eastern Part of the Southern Permian Basin. Clay Miner. 2014, 49, 635–655. [Google Scholar] [CrossRef]
  21. Burton, J.H.; Krinsley, D.H.; Pye, K. Authigenesis of Kaolinite and Chlorite in Texas Gulf Coast Sediments. Clays Clay Miner. 1987, 35, 291–296. [Google Scholar] [CrossRef]
  22. Masalehdani, M.N.-N.; Mees, F.; Dubois, M.; Coquinot, Y.; Potdevin, J.-L.; Fialin, M.; Blanc-Valleron, M.-M. Condensate Minerals from a Burning Coal-Waste Heap in Avion, Nothern France. Can. Mineral. 2009, 47, 573–591. [Google Scholar] [CrossRef] [Green Version]
  23. Bourdelle, F.; Parra, T.; Beyssac, O.; Chopin, C.; Moreau, F. Ultrathin Section Preparation of Phyllosilicates by Focused Ion Beam Milling for Quantitative Analysis by TEM-EDX. Appl. Clay Sci. 2012, 59–60, 121–130. [Google Scholar] [CrossRef]
  24. Raabe, J.; Tzvetkov, G.; Flechsig, U.; Boege, M.; Jaggi, A.; Sarafimov, B.; Vernooij, M.G.C.; Huthwelker, T.; Ade, H.; Kilcoyne, D.; et al. PolLux: A New Facility for Soft x-Ray Spectromicroscopy at the Swiss Light Source. Rev. Sci. Instrum. 2008, 79, 113704. [Google Scholar] [CrossRef] [PubMed]
  25. Hitchcock, A.P. Soft X-Ray Imaging and Spectromicroscopy. In Handbook of Nanoscopy; Van Tendeloo, G., Van Dyck, D., Pennycook, S.J., Eds.; Wiley-VCH Verlag GmbH & Co. KGaA: Weinheim, Germany, 2012; pp. 745–791. ISBN 978-3-527-64186-4. [Google Scholar]
  26. Bourdelle, F.; Benzerara, K.; Beyssac, O.; Cosmidis, J.; Neuville, D.R.; Brown, G.E.; Paineau, E. Quantification of the Ferric/Ferrous Iron Ratio in Silicates by Scanning Transmission X-Ray Microscopy at the Fe L2,3 Edges. Contrib. Mineral. Petrol. 2013, 166, 423–434. [Google Scholar] [CrossRef]
  27. Roedder, E. Fluid Inclusions: An Introduction to Studies of All Types of Fluid Inclusions, Gas, Liquid, or Melt, Trapped in Materials from Earth and Space, and Their Application to the Understanding of Geologic Processes; Reviews in Mineralogy; Mineral Society of America: Washington, DC, USA, 1984; ISBN 978-0-939950-16-4. [Google Scholar]
  28. Goldstein, R.H.; Reynolds, T.J. Systematics of Fluid Inclusions in Diagenetic Minerals; SEPM (Society for Sedimentary Geology): Tusla, OK, USA, 1994; ISBN 978-1-56576-008-0. [Google Scholar]
  29. Bodnar, R.J. Revised Equation and Table for Determining the Freezing Point Depression of H2O-Nacl Solutions. Geochim. Cosmochim. Acta 1993, 57, 683–684. [Google Scholar] [CrossRef]
  30. Dowling, K.; Morrison, G. Application of Quartz Textures to the Classification of Gold Deposits Using North Queensland Examples. In The Geology of Gold Deposits: The Perspective in 1988; Economic Geology Monograph Series; Society of Economic Geologists (SEG): Littleton, CO, USA, 1989. [Google Scholar] [CrossRef]
  31. Dong, G.; Morrison, G.; Jaireth, S. Quartz Textures in Epithermal Veins, Queensland; Classification, Origin and Implication. Econ. Geol. 1995, 90, 1841–1856. [Google Scholar] [CrossRef]
  32. Beaufort, D.; Cassagnabere, A.; Petit, S.; Lanson, B.; Berger, G.; Lacharpagne, J.C.; Johansen, H. Kaolinite-to-Dickite Reaction in Sandstone Reservoirs. Clay Miner. 1998, 33, 297–316. [Google Scholar] [CrossRef]
  33. Goldstein, R. Petrographic Analysis of Fluid Inclusions. In Petrographic Analysis of Fluid Inclusions; Mineralogical Association of Canada: Quebec City, QC, Canada, 2003; pp. 9–53. [Google Scholar]
  34. Wiewiora, A.; Weiss, Z. Crystallochemical Classifications of Phyllosilicates Based on the Unified System of Projection of Chemical Composition; II, The Chlorite Group. Clay Miner. 1990, 25, 83–92. [Google Scholar] [CrossRef]
  35. Lanson, B.; Beaufort, D.; Berger, G.; Bauer, A.; Cassagnabère, A.; Meunier, A. Authigenic Kaolin and Illitic Minerals during Burial Diagenesis of Sandstones: A Review. Clay Miner. 2002, 37, 1–22. [Google Scholar] [CrossRef]
  36. Hrischeva, E.; Gier, S. Clay Mineralogy and Geochemistry of Early Jurassic Sedimentary Rocks from the Moezian Platform, Northern Bulgaria. Clay Miner. 2002, 37, 413–428. [Google Scholar] [CrossRef]
  37. Huang, W.L.; Bishop, A.M.; Brown, R.W. The Effect of Fluid/Rock Ratio on Feldspar Dissolution and Illite Formation under Reservoir Conditions. Clay Miner. 1986, 21, 585–601. [Google Scholar] [CrossRef]
  38. James, R.B.; Stephen, G.F. Clay Diagenesis in Wilcox Sandstones of Southwest Texas: Implications of Smectite Diagenesis on Sandstone Cementation. SEPM J. Sediment. Res. 1979, 49. [Google Scholar] [CrossRef]
  39. Ruiz Cruz, M.D.; Reyes, E. Kaolinite and Dickite Formation during Shale Diagenesis: Isotopic Data. Appl. Geochem. 1998, 13, 95–104. [Google Scholar] [CrossRef]
  40. Baronnet, A. Silicate Microstructures at the Sub-Atomic Scale-Web of Science Core Collection. Comptes Rendus Acad. Sci. Ser. II Fasc. Sci. Terre Planetes 1997, 324, 157–172. [Google Scholar]
  41. Yau, Y.-C.; Peacor, D.R.; Beane, R.E.; Essene, E.J.; Mcdowell, S.D. Microstructures, Formation Mechanisms, and Depth-Zoning of Phyllosilicates in Geothermally Altered Shales, Salton Sea, California. Clays Clay Miner. 1988, 36, 1–10. [Google Scholar] [CrossRef]
  42. Aagaard, P.; Jahren, J.S.; Harstad, A.O.; Nilsen, O.; Ramm, M. Formation of Grain-Coating Chlorite in Sandstones. Laboratory Synthesized vs. Natural Occurrences. Clay Miner. 2000, 35, 261–269. [Google Scholar] [CrossRef]
  43. Velde, B.; Raoult, J.-F.; Leikine, M. Metamorphosed Berthierine Pellets in Mid-Cretaceous Rocks from North-Eastern Algeria. J. Sediment. Res. 1974, 44, 1275–1280. [Google Scholar] [CrossRef]
  44. Iljima, A.; Matsumoto, R. Berthierine and Chamosite in Coal Measures of Japan. Clays Clay Miner. 1982, 30, 264–274. [Google Scholar] [CrossRef]
  45. Meunier, A. Clays; Springer: Berlin/Heidelberg, Germany, 2005; ISBN 978-3-540-21667-4. [Google Scholar]
  46. Velde, B. Clay Minerals: A Physico-Chemical Explanation of Their Occurrence; Elsevier: Amsterdam, The Netherlands, 1985; ISBN 978-0-444-41238-6. [Google Scholar]
  47. Hillier, S. Origin, Diagenesis, and Mineralogy of Chlorite Minerals in Devonian Lacustrine Mudrocks, Orcadian Basin, Scotland. Clays Clay Miner. 1993, 41, 240–259. [Google Scholar] [CrossRef]
  48. Banfield, J.F.; Bailey, S.W. Formation of Regularly Interstratified Serpentine-Chlorite Minerals by Tetrahedral Inversion in Long-Period Serpentine Polytypes. Am. Mineral. 1996, 81, 79–91. [Google Scholar] [CrossRef]
  49. Ryan, P.C.; Reynolds, R.C. The Origin and Diagenesis of Grain-Coating Serpentine-Chlorite in Tuscaloosa Formation Sandstones, U.S. Gulf Coast. Am. Mineral. 1996, 81, 213–225. [Google Scholar] [CrossRef]
  50. Hornibrook, E.R.C.; Longstaffe, F.J. Berthierine from the Lower Cretaceous Clearwater Formation, Alberta, Canada. Clays Clay Miner. 1996, 44, 1–21. [Google Scholar] [CrossRef]
  51. Xu, H.; Veblen, D.R. Interstratification and Other Reaction Microstructures in the Chlorite-Berthierine Series. Contrib. Mineral. Petrol. 1996, 124, 291–301. [Google Scholar] [CrossRef]
  52. Billault, V.; Beaufort, D.; Baronnet, A.; Lacharpagne, J.-C. A Nanopetrographic and Textural Study of Grain-Coating Chlorites in Sandstone Reservoirs. Clay Miner. 2003, 38, 315–328. [Google Scholar] [CrossRef]
  53. Inoue, S.; Kogure, T. High-Resolution Transmission Electron Microscopy (HRTEM) Study of Stacking Irregularity in Fe-Rich Chlorite from Selected Hydrothermal Ore Deposits. Clays Clay Miner. 2016, 64, 131–144. [Google Scholar] [CrossRef]
  54. Jahren, J.S.; Aagaard, P. Compositional Variations in Diagenetic Chlorites and Illites, and Relationships with Formation-Water Chemistry. Clay Miner. 1989, 24, 157–170. [Google Scholar] [CrossRef]
  55. Walker, J.R.; Thompson, G.R. Structural Variations in Chlorite and Illite in a Diagenetic Sequence from the Imperial Valley, California. Clays Clay Miner. 1990, 38, 315–321. [Google Scholar] [CrossRef]
Figure 1. Location of the mining basin of the Northern France, and of the Ostricourt well (fosse 7-7bis) and spoil stip. Stratigraphic log, established from H.N. Groupes d’Oignies drilling report.
Minerals 11 00804 g001
Figure 2. Main petrographic features of the studied sample. General view of the shale sample and of the thin section, on which the veins can be seen in white through the shale in grey (natural light).
Minerals 11 00804 g002
Figure 3. (A): general view of the romb quartz texture (crossed polarized light). (B): quartz zonation presenting a crystal core with numerous inclusions, particularly FIs (polarized light). (C): euhedral quartz crystal (type 1) enrobed with kaolinite in the middle of the vein. (D): distribution of the two veinlet types with criteria of relative chronology and displacement (microphotograph).
Minerals 11 00804 g003
Figure 4. Optical microscope and SEM images of a carboniferous shale sample. (A,B): images of the large view of the veins/shale contact by plain light microscopy (A1,B1), crossed-polarized light microscopy (A2,B2) and SEM (backscattered-electrons) (A3), showing kaolinite vein (type 2) running through the shale. A: images highlight the wide expanse of the chlorite fringe along the kaolinite/shale interface. All kaolinite areas are surrounded by chlorite. (C,D) images are located. (B): plain light (B1) and crossed-polarized light (B2) microscopy images of the vein/shale contact, highlighting the chlorite fringe at the kaolinite/shale interface. (C): hairy chlorite seems to grow from the shale to kaolinite. (D): chlorite fringe on either side of a kaolinite vein. FIB section is located. (E): zoom of (D) image detailing the kaolinite/chlorite contact. Qz: quartz; Kaol: kaolinite; Chl: chlorite.
Minerals 11 00804 g004
Figure 5. SEM images (backscattered-electrons) of a vein/shale contact (vein type 1). (A): large view of a vein/shale contact, showing the millimetric size of euhedral quartz in vein (type 1) and the absence of chlorite fringe at the quartz/shale interface. (B) image is located. (B): vein/shale contact, focused on the kaolinite/shale interface, underlining the presence of chlorite along this interface, and the occupation by kaolinite of the porosity left by quartz growth in the vein (type 1). (C): large view of a vein (type 2)/shale contact. (D) image is located. (D): vein/shale contact, focused on the start of the chloritization process, with sparse hairy chlorites which do not yet form a fringe. A: ankerite; Qz: quartz; Kaol: kaolinite; Chl: chlorite.
Minerals 11 00804 g005
Figure 6. SEM images (backscattered-electrons) of veins/shale contacts. (A): On the left of the image, a vein mainly filled by kaolinite–type 2, and surrounded by a chlorite fringe. On the right, a vein mainly filled by quartz–type 1, not presenting chlorite fringe at the contact of the shale in absence of kaolinite/shale contacts. (B,C) images are located. B: platy crystals of kaolinite. C: kaolinite/chlorite intergrowths. Qz: quartz; Kaol: kaolinite; Chl: chlorite.
Minerals 11 00804 g006
Figure 7. SEM images of veins/shale contacts. (A): backscattered-electron image of an euhedral quartz with cracked surfaces surrounded in part by a chlorite fringe. The cracks on the quartz crytsal surfaces are highlighted by blue arrows and are filled by kaolinite. The chlorite grows is stopped by the quartz, but progresses in the kaolinite. (B1,B2): backscattered and secondary electron images, respectively, of chlorite growing at the expense of the kaolinite nestled in quartz cracks. Kaolinite is no longer visible, but the cracks, whose limits are underlined by a blue dashed line on SE image, contain the neoformed chlorite. The blue star notifies in SE image an example of cracked area in quartz. (C): a rare–large–area where the chlorite has almost completely replaced kaolinite (noted residual kaolinite in chlorite fringe), surronding, bypassing or following the euhedral quartz. Qz: quartz; Kaol: kaolinite; Chl: chlorite.
Minerals 11 00804 g007
Figure 8. Fluid inclusion petrography. (A): Microphotograph of the cloudy core of a comb quartz crystal of vein type 1. (B): Typology of fluid inclusions inside a Fluid Inclusion Assemblage.
Minerals 11 00804 g008
Figure 9. Frequency plot of ice melting temperature in 2 Fluid Inclusion Assemblage (FIAs) in quartz of type 1 veinlets.
Minerals 11 00804 g009
Figure 10. Compositions of analysed chlorites (SEM-EDX, EMPA and TEM-EDX data) in a VIAl-Mg-FeII ternary diagram. Chlorite end-members are indicated.
Minerals 11 00804 g010
Figure 11. Chlorite chemical compositions (chlorite of the veins/shale interface) in R2+–Si diagram [34]. R3+ refers to trivalent cations (Al and Fe3+), □ to octahedral vacancies and R2+ to divalent cations (Fe2+ and Mg). TK and DT refer to the Tschermak (Si + R2+ = IVAl + VIAl) and the di-trioctahedral (2 VIAl + VI□ = 3 R2+) exchanges, respectively.
Minerals 11 00804 g011
Figure 12. (A): Representative X-ray absorption spectra of chlorites, measured in transmission mode (STXM, SLS) at the Fe L3-edge. Based on the protocol of Bourdelle et al. [26]. The calculated average Fe3+/Fetot ratio is ~14% for all analysed chlorites. (B): SEM image of the FIB-section cut through the kaolinite/chlorite contact. (C) image is located. Pt: platinum, added before cutting the FIB-section to protect it. (C): location of the STXM-XANES analyses into chlorite, each square referring to one spectrum.
Minerals 11 00804 g012
Figure 13. TEM images obtained on the FIB section. (A): high-resolution image of the chlorite formed at the vein/shale interface. (B): electron diffraction obtained on the area of A; 00l spots. (C): high-resolution of a kaolinite/chlorite contact. Kaol: kaolinite; Chl: chlorite.
Minerals 11 00804 g013
Table 1. EMPA, SEM-EDX and TEM-EDX analyses of Fe-chloritevein. Apfu; 14 oxygen basis. * analysis with 7Å layers.
EMPA
# 123456789101112131415
Si2.682.592.712.752.692.712.702.762.682.712.652.702.692.712.73
Ti0.000.000.000.000.000.000.000.000.000.000.000.000.000.000.00
Al2.992.932.992.973.083.003.002.983.063.013.042.983.043.043.02
Fe2+2.892.882.882.912.842.902.882.762.902.832.952.872.872.852.81
Mn0.060.340.010.010.000.010.010.020.000.010.010.010.010.010.01
Mg1.191.201.191.121.151.171.191.201.141.221.191.251.171.151.18
Ca0.000.010.000.000.000.000.000.010.010.000.010.000.000.000.00
Na0.000.000.000.000.000.010.000.010.000.000.000.000.010.000.01
K0.000.000.000.000.000.000.000.010.000.000.000.000.000.000.00
Fe/(Fe+Mg)0.710.710.710.720.710.710.710.700.720.700.710.700.710.710.70
Σoct5.815.945.785.765.765.795.785.725.785.785.845.815.785.765.75
SEM-EDXTEM-EDX
# 16171819202122232425262728 *29 *30 *
Si2.662.722.762.842.652.742.742.782.662.672.712.712.752.732.71
Ti0.000.000.000.000.000.000.000.000.000.000.000.000.000.000.00
Al3.072.983.033.123.113.013.093.093.043.023.023.053.003.032.99
Fe2+2.922.902.812.632.942.782.782.713.002.862.872.842.842.812.87
Mn0.000.010.010.010.000.010.010.010.010.010.010.000.010.010.01
Mg1.151.161.111.001.111.211.081.081.091.251.171.161.151.181.19
Ca0.000.010.010.000.000.010.010.000.010.000.000.000.000.000.00
Na0.000.010.010.000.000.000.000.000.000.000.000.000.000.000.00
K0.000.000.000.000.000.000.000.000.000.000.000.000.000.000.00
Fe/(Fe+Mg)0.720.710.720.720.730.70.720.720.730.700.710.710.710.700.71
Σoct5.85.775.725.65.815.755.75.675.85.815.785.765.755.765.77
Table 2. TEM-EDX analyses of kaolinite. Apfu; 7 oxygen basis.
# 123
Si2.012.042.00
Ti0.000.000.00
Al1.981.961.99
Fe2+0.000.000.00
Mn0.000.000.00
Mg0.000.000.00
Ca0.000.000.00
Na0.000.000.00
K0.000.000.00
Publisher’s Note: MDPI stays neutral with regard to jurisdictional claims in published maps and institutional affiliations.

